")
Back to Journals » International Journal of Nanomedicine » Volume 12
Ti-GO-Ag nanocomposite: the effect of content level on the antimicrobial activity and cytotoxicity
Authors Jin J , Zhang L, Shi M, Zhang Y, Wang Q
Received 16 February 2017
Accepted for publication 17 April 2017
Published 7 June 2017 Volume 2017:12 Pages 4209—4224
DOI https://doi.org/10.2147/IJN.S134843
Checked for plagiarism Yes
Review by Single anonymous peer review
Peer reviewer comments 2
Editor who approved publication: Dr Linlin Sun
Jianfeng Jin,1,2 Li Zhang,3 Mengqi Shi,3 Yumei Zhang,3 Qintao Wang1
1State Key Laboratory of Military Stomatology and National Clinical Research Center for Oral Diseases and Shaanxi Engineering Research Center for Dental Materials and Advanced Manufacture, Department of Periodontology, School of Stomatology, The Fourth Military Medical University, Xi’an, 2Department of General Dentistry, Kunming Municipal Stomatology Hospital, Kunming, 3State Key Laboratory of Military Stomatology and National Clinical Research Center for Oral Diseases and Shaanxi Key Laboratory of Stomatology, Department of Prosthodontics, School of Stomatology, The Fourth Military Medical University, Xi’an, People’s Republic of China
Abstract: Surface modification of titanium (Ti) implants are extensively studied in order to obtain prominent biocompatibility and antimicrobial activity, especially preventing implant-associated infection. In this study, Ti substrates surface were modified by graphene oxide (GO) thin film and silver (Ag) nanoparticles via electroplating and ultraviolet reduction methods so as to achieve this purpose. Microstructures, distribution, quantities and spectral peaks of GO and Ag loading on the Ti sheets surface were characterized. GO-Ag-Ti multiphase nanocomposite exhibited excellent antimicrobial ability and anti-adherence performance. Subsequently, morphology, membrane integrity, apoptosis and relative genes expression of bacteria incubated on the Ti samples surface were monitored to reveal the bactericidal mechanism. Additionally, the cytotoxicity of Ti substrates incorporating GO thin film and Ag nanoparticles were investigated. GO-Ag-Ti composite configuration that have outstanding antibacterial properties will provide the foundation to study bone integration in vitro and in vivo in the future.
Keywords: GO-Ag-Ti multiphase nanocomposite, microstructure and quantities, antibacterial activity, bactericidal mechanism, cytotoxicity
Introduction
Titanium (Ti) and its alloys still account for a substantial percentage of clinically used functional biomaterials in the field of biomedicine to manufacture orthopedic implants, bone screws, orthopedic joints, bone plates and dental implants1 due to their biocompatibility, good fracture toughness, relatively low elastic modulus, high strength-to-weight ratio and excellent corrosion resistance.1–3 Nevertheless, many reasons of implant failure are still associated with peri-implantitis4 and appear to be resolved. On the implant surfaces, the adsorption of the subsequent accumulation of bacteria and biomolecular pellicles are the main stimuli for inducing peri-implantitis processes.4 Though the biocompatibility of Ti and its alloys has been recognized,5 it remains difficult to carry out all the requirements, such as osseointergration, biocompatibility, mechanical properties and antibacterial ability. To achieve excellent implant biomaterials, the Ti and its alloys often need modifications, such as sandblasting processing,6 acid treatment,7 alkali treatment,8 laser etching,9 microarc oxidation10 and anodic oxidation11 and so on.
Fortunately, more and more ideas and solutions are being put into practice due to the development of novel bioactive materials and nanobiotechnology. In the research area, one of the new possibilities is based on the graphene and its derivatives, which might be used in biomedical field in biosensors, biomaterials for tissue engineering, bioimaging and photothermal therapy agents, drug and gene delivery systems, and antibacterial killing factors, etc.12–15 Certainly, the graphene and its derivatives are promising materials for other applications due to their cell anti-adhesive and bactericidal properties, such as textiles, additives to drugs and food, orthopedic and dental biomaterials etc. Interestingly, graphene oxide (GO) is applied widely not only due to its character as an inexpensive precursor of graphene, but also due to its unique electrical, thermal, mechanical, optical, chemical and antibacterial properties. GO is a two-dimensional carbon nanomaterial consisting of a layer of single atom thick sp2-bonded carbon atoms, which are closely packed into a hexagonal crystal structure that contains carboxyl, epoxide and hydroxyl functional groups at the edges.16,17 The features of GO could enhance its interactions with proteins through covalent, hydrogen bonding and electrostatic nature.18–20 GO could promote the differentiation of stem cells, cell growth, expansion and proliferation. Additionally, it is often used as carrier to minimize the surface energy in the preparation process.21 It has been reported that GO-silver (Ag) shows excellent antibacterial properties against many bacterial species.22,23
Metal nanoparticles have generated wide interest and focus, and are used in diverse field of research, most importantly, in biological and medical areas,24 such as titanium dioxide,25 zinc oxide,26 magnesium,27 gold,28 copper29 and Ag.30 Ag, a nonspecific biocidal agent, is of particular interest due to its significant antimicrobial activity against a broad spectrum of fungus, viruses and bacteria, even antibiotic-resistant strains.31 Ag nanoparticles (AgNPs) have unique physical and chemical properties. For example, AgNPs are more reactive than bulk metallic materials due to the larger active surface area. Because of this, its antibacterial effects are recognized and studied abundantly.32 AgNPs not only inhibit the growth of Gram-positive bacteria and Gram-negative bacteria,33 but also have cytotoxicity34 at different concentrations. Hence, at the appropriate concentration, AgNPs play an important role and help to overcome drug resistance35 in biomedical applications. Several studies have shown that AgNPs induce cell necrosis and apoptosis36 because AgNPs get ingested and enter the cytoplasm. A series of inflammatory reactions occur in the cell, and the expression of tumor necrosis factor-α37,38 increases markedly. Of course, AgNPs have also been demonstrated to cause cell apoptosis in vitro, including in neuronal cells, liver cells and macrophage cells. Microorganisms are much less likely to develop resistance to metal nanoparticles, which are promising candidates for multidrug-resistant bacteria, compared with antibiotics. Metal nanoparticles are widely used for electrical, environmental, structural, medical, and everyday purposes.32
In the work, we synthesized GO-Ag on the Ti surface by electroplating process and ultraviolet (UV) reduction method. Why was GO-Ag chosen to be as antimicrobial agents? Because GO-modified Ti surface did not show antibacterial properties, and instead promoted the growth and adhesion of bacteria. Gram-positive bacteria, Staphylococcus aureus, Streptococcus mutans, and Gram-negative bacteria, Porphyromonas gingivalis were chose as models to study the antibacterial activities of the GO-Ag-Ti toward different bacteria species. Antimicrobial properties under different conditions were investigated at different bactericide dosages. The antimicrobial mechanism of GO-Ag-Ti was also demonstrated by structural and morphological observation, bacterial apoptosis, bactericidal process and bactericidal species analysis, gene expression assays, and cytotoxicity, etc.
Materials and methods
Specimen preparation
Commercial pure Ti plates (Northwest Institute for Nonferrous Metal Research, Xi’an, China, 1×10×10 mm3) were polished with 400–2,000-grit sic sandpaper (Zhuhai Dali Export Co., Ltd, China), then subjected to ultrasonic cleaning with acetone, deionized water, and ethanol sequentially for 10 min each. Afterward, specimen (anode) were electroplated in an aqueous electrolyte solution containing 20, 50, 80 and 100 μg/mL of GO at room temperature for 10 min with graphite electrode (cathode) and a direct current regulated power supply at 20 V. Polished titanium (P) specimen served as the control group. Additionally, before the samples preparation, the specimen were required to be etched in acid solution (deionized water: HNO3=4:1); the pH of GO aqueous solution was also adjusted. The Ti modified with GO was soaked in 1 mol/L of AgNO3 solution for 30 min.39 Subsequently, it was rinsed with deionized water and dried, and then irradiated with UV light for 30 min. Before the experiment, all the samples were required to be sterilized by UV light for 1 h.
Surface characterization
The surface topography and relevant element distribution of the samples were inspected by stereomicroscope (Leica Microsystems, Wetzlar, Germany), field-emission scanning electron microscopy (FE-SEM, S-4800, Hitachi High Technologies, Tokyo, Japan). Raman spectroscopy of the specimens were recorded using a Horiba Jobin Yvon at 633 nm laser power 17 mW ×100 objective lens and an acquisition range from 1,000 to 3,000 cm−1. X-ray photoelectron spectroscopy (Kratos Analytical Ltd, Manchester, UK) analyses of the chemical composition of the samples were carried out with monochromatic Al Ka line at a power of 100 W (10 mA, 10 KV). The hydrophilic properties of the specimens were obtained with the DSA1 system (KRÜSS GmbH, Hamburg, Germany) by analyzing deionized water drop shape. Elastic modulus and binding force of samples were evaluated by nanoindentation (Agilent Technologies, Santa Clara, CA, USA) and nano-scratch (Agilent Technologies, USA), respectively.
Bacterial strain and culture conditions
S. mutans (UA159) was cultivated in brain–heart infusion (BHI, Oxoid, Basingstoke, England) broth medium overnight at 37°C in an anaerobic atmosphere (80% N2, 10% H2, 10% CO2).40 P. gingivalis (ATCC33277) was cultured in the BHI broth medium containing 10% sheep blood for 24 h at 37°C in an anaerobic atmosphere containing two AnaeroPack (Mitsubishi, Japan). The bacterial suspension was adjusted to a concentration of 106 CFU/mL by turbidity meter (SGZ-6AXJ) for further usage.
Antibacterial assay
Antibacterial and adherent rate
The antibacterial ability and adhesion rate were evaluated using S. mutans and P. gingivalis cultivated in the BHI medium. Each sample was placed in 1 mL of bacterial suspension at a concentration of 106 CFU/mL for 24 h at 37°C. After culture completion, the samples were gently rinsed three times with phosphate-buffered saline (PBS) so as to remove non-adherent bacteria, and oscillated in 1 mL of PBS for 1 min. Bacterial suspensions of 100 μL were re-cultured on BHI agar plates. The adhesion and antibacterial rate were tested by following formula. Adhesion rate (%) = CFU of Experimental Groups/CFU of Control ×100%; antibacterial rate (%) = (CFU of Control − CFU of Experimental Groups)/CFU of Control ×100%.
Field emission scanning electron microscopy (FE-SEM) observation
The specimens that were sterilized for 1 h with UV were placed in the wells of a 24-well plate, and incubated with 1 mL bacterial suspension at 37°C for 24 h. Then the Ti substrates were gently rinsed three times with PBS, fixed with 2.5% glutaraldehyde at 4°C overnight, and dehydrated with different concentrations of alcohol for 10 min. The samples that were dried and sprayed with gold were observed with FE-SEM.
Fluorescence staining
Bacterial culture method was same as above. The substrates were gently rinsed with PBS three times, stained for 15 min in the dark at room temperature with LIVE/DEAD BacLight bacterial viability kits (L13152), and observed with laser scanning confocal microscopy (Fluoview FV1000, Olympus Corporation, Tokyo, Japan). The fluorescence intensity was evaluated by ImageJ software.
Flow cytometry texting
Bacterial culture method was same as above. After the bacteria that were on the substrates were eluted into 1 mL of sterile normal saline, LIVE/DEAD BacLight bacterial viability kits was added into the solution. The dyeing method was the same as the fluorescence staining. The bacterial apoptosis rate was monitored by flow cytometry (FACS Aria II, BD Bioscience, Franklin Lakes, NJ, USA).
Real-time polymerase chain reaction (RT-PCR) assay
Bacterial culture method was the same as above. The substrates were gently rinsed with PBS three times, and the bacteria were eluted into 1 mL of sterile normal saline. The total RNA of the cultured bacteria was extracted by centrifuging, digesting, splitting, deproteinization and rinsing (RNAprep pure cell/bacteria kit, TIANGEN, Beijing, China), etc. The pure RNA was determined by UV spectrophotometer (Bibby Scientific Co., Ltd, England), and reverse-transcribed into cDNA using a PrimeScript RT reagent kit (Takara). RT-PCR was implemented (Applied Biosystems 7500 Fast Real-Time PCR System, Foster City, CA, USA) by SYBR Premix Ex Taq™ (Takara), the primers and cDNA templates. The primer sequences of the genes (Table 1) were designed according to the GenBank (www.ncbi.nlm.nih.gov). The expression levels of the genes were calibrated by the 16S rRNA gene as a housekeeping gene.
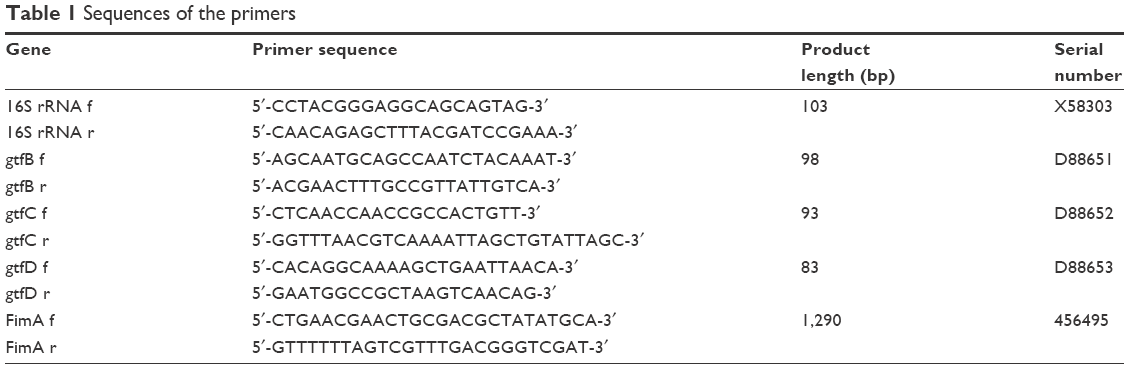 | Table 1 Sequences of the primers |
Cytotoxicity
The samples were placed in the wells of a 24-well plate, and incubated with the density of 2.5×10⁴ cells/cm2 primary rat bone marrow mesenchymal stem cells for 24 h. After the specimens were gently rinsed with PBS three times and were transferred to a new 24-well plate, to which were added 40 μL cell kit-8 (count CCK-8) and 360 μL serum-free α-MEM medium, they were cocultured for 3 h at 37°C. Subsequently, the supernatant was tested using a spectrophotometer (Biotek, VT, USA) at 450 nm. The cell viability was assessed via three parallel experiments.
Statistical analysis
A statistical analysis of variance and Fisher’s protected least-significant difference test were applied to estimate within-group differences and inter-group differences. Statistical analyses were carried out with SPSS 17.0 software at a statistical significant level of P-value <0.05.
Results
Surface characterization
The control, 20, 50, 80 and 100 μg/mL were designated as C, G20, G50, G80, and G100, respectively. The Ti sheets that were modified by the different concentration of GO via electroplating method showed different colors (Figure 1). Silvery white, yellowish, golden, light brown, and purplish brown corresponded to C, G20, G50, G80, and G100, respectively (Figure 1A). Before and after the reaction, the color of the aqueous solution of GO did not change in the naked eye view (Figure 1B).
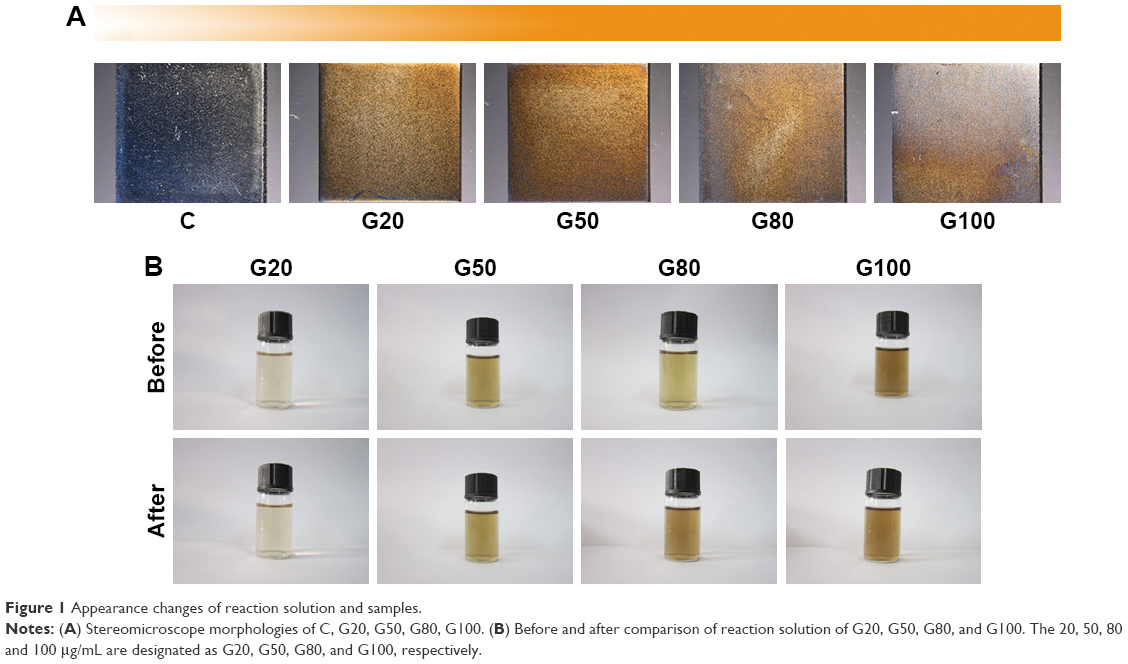 | Figure 1 Appearance changes of reaction solution and samples. |
The morphologies of the Ti substrates are illustrated in Figure 2. There were obvious scratches that were almost parallel and sharp on the Ti surface (Figure 2A1 and A2). In the treatment groups, the specimens surface was relatively flat and obtuse (Figure 2B1, C1, D1 and E1), and appeared as a thin film (Figure 2B2, C2, D2 and E2). The higher the concentration of GO, the more the gauffer was on the Ti surface. In other words, there were more GO on the samples surface. Granular substances were observed on the Ti sheets (Figure 2B3, C3, D3 and E3) via the UV reduction method. At different concentrations of GO, the amount of granular materials were also different (Figure 2B4, C4, D4 and E4).
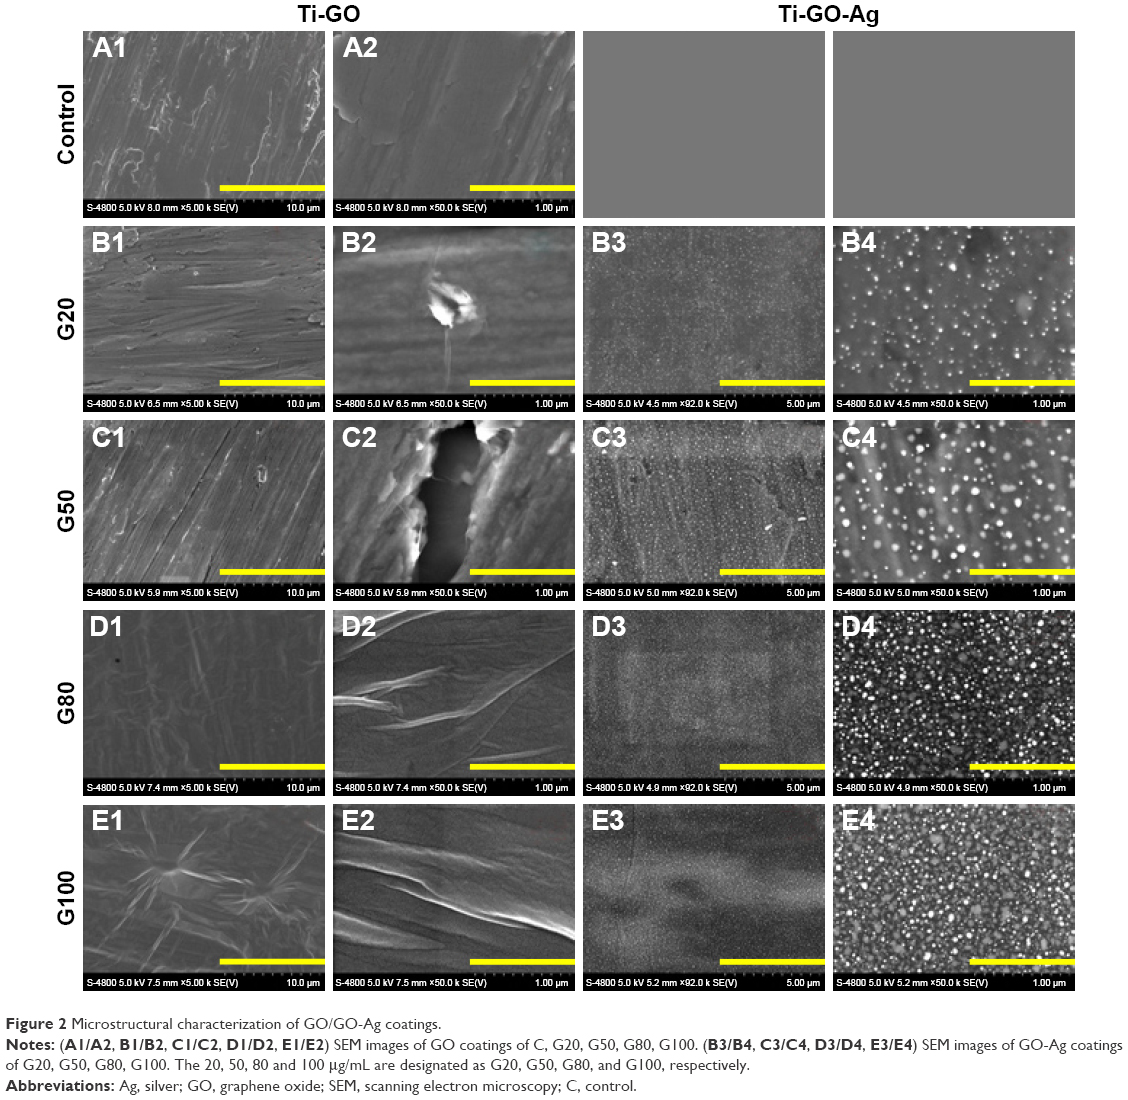 | Figure 2 Microstructural characterization of GO/GO-Ag coatings. |
Figure 3A illustrates the typical Raman spectra of 20, 50, 80 and 100 μg/mL specimens obtained at an excitation wavelength of 633 nm. Two distinct peaks were shown for each substrate at (~1,345.70 cm−1, 1,594.73 cm−1), (~1,338.87 cm−1, 1,607.42 cm−1), (~1,337.89 cm−1, 1,600.59 cm−1), and (~1,347.66 cm−1, 1,601.56 cm−1) corresponding to the D and G bands, respectively. The D/G peaks area and D/G peaks half width height were obtained by fitting the four Raman peaks (Figure 3B). As the concentration of GO increased, the D/G peaks area values also enhanced. There were statistical differences between the four groups, except the G20 and G50. Additionally, at different concentrations, the D peak half width height value of G80 and G peak half width height value of G100 were the highest. Of course, D peak half width height value of G20 and G peak half width height value of G50 were the lowest. But there were no statistical differences between the four groups. Figure 3C indicates the distribution of GO on the Ti sheets surface using Raman spectra mapping, which represented the D peaks, G peaks, and D/G peaks.
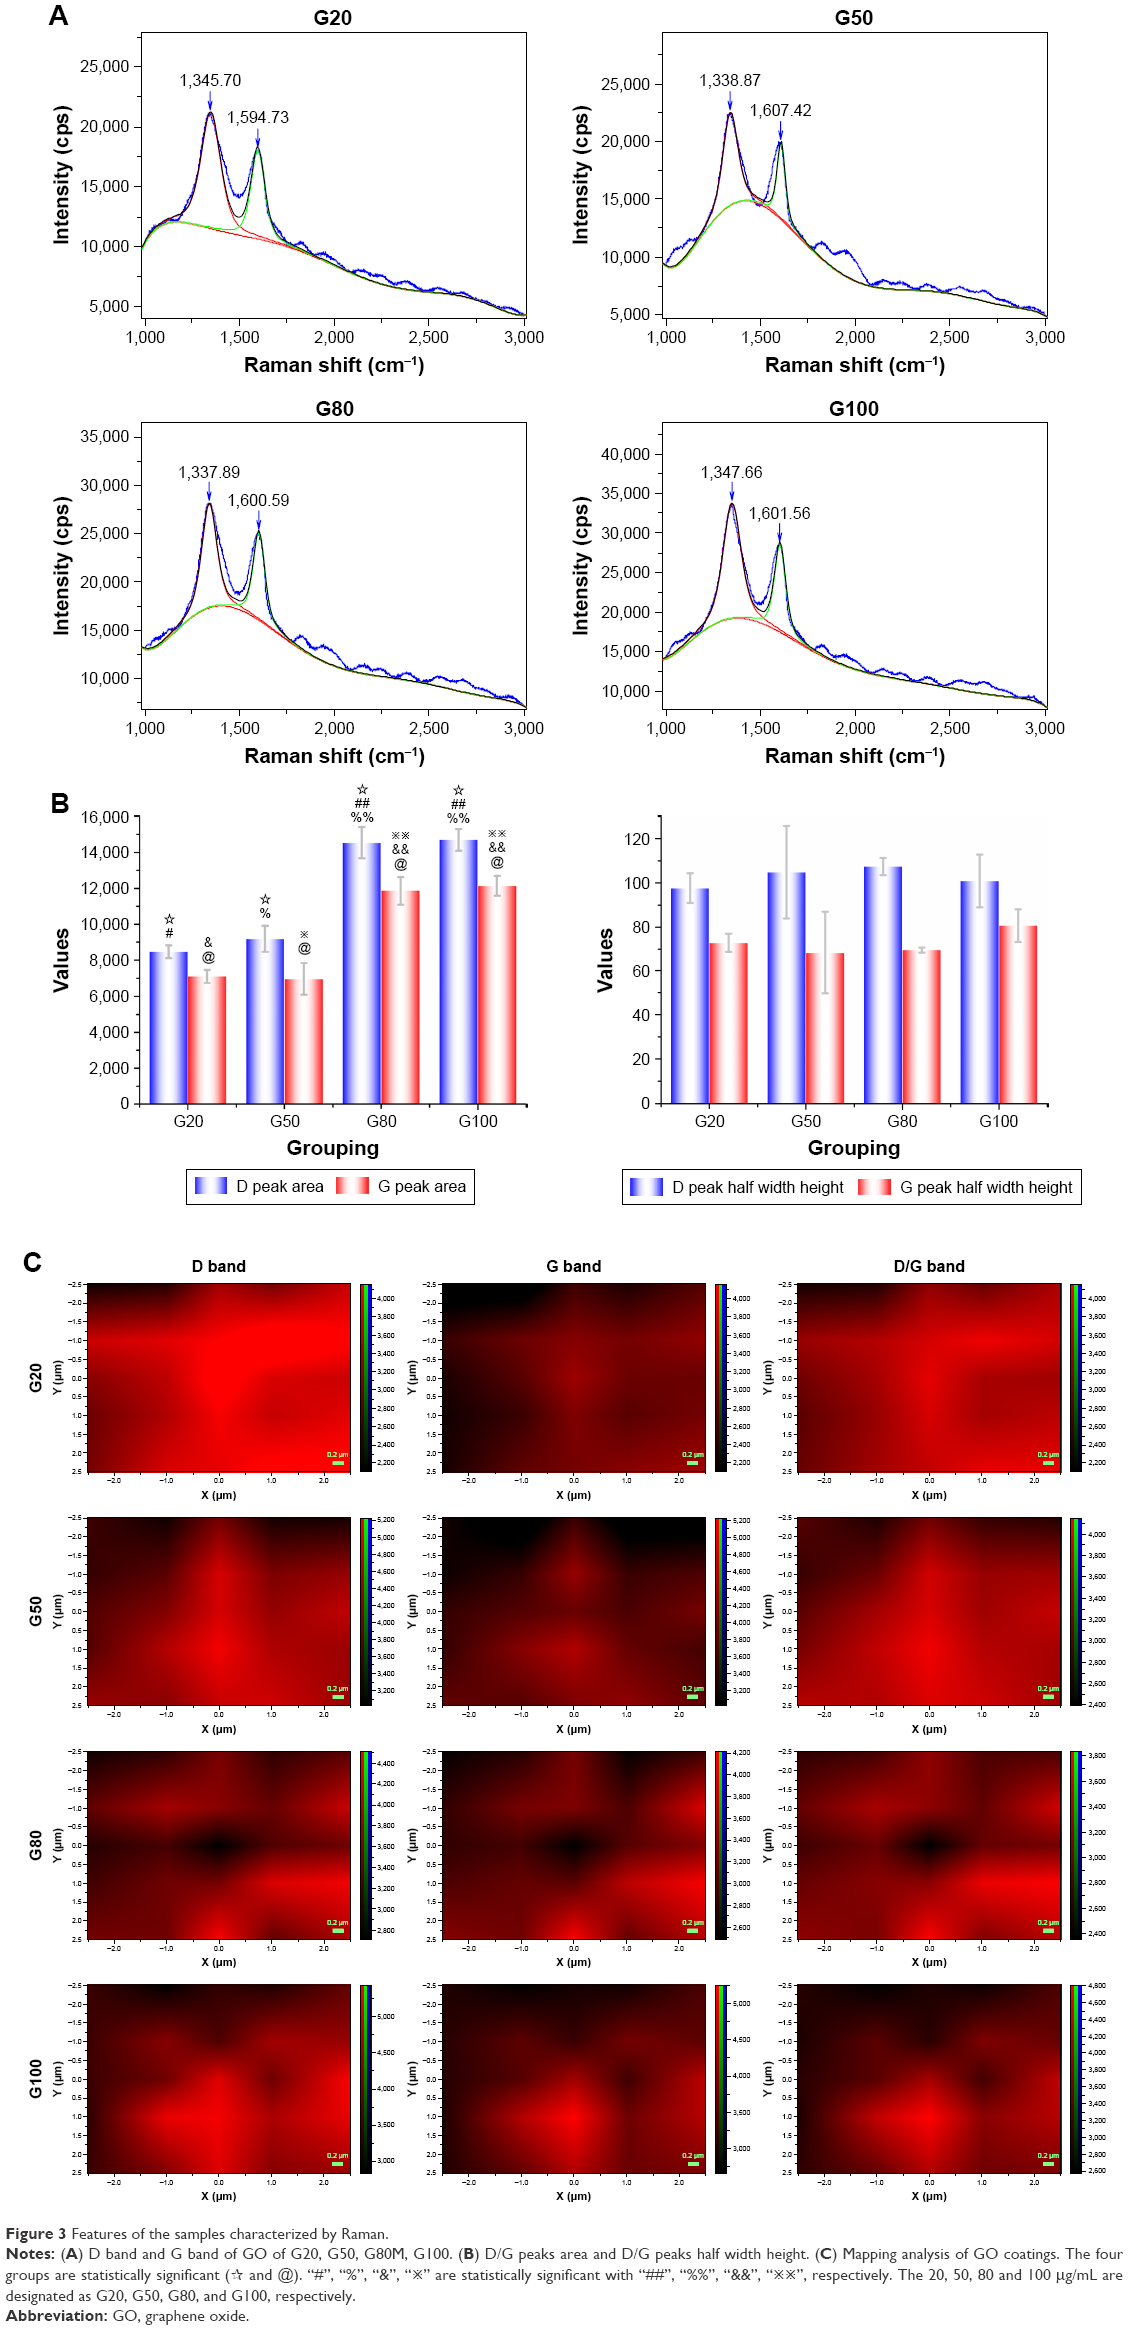 | Figure 3 Features of the samples characterized by Raman. |
 and @). “#”, “%”, “&”, “
 ” are statistically significant with “##”, “%%”, “&&”, “
The surface compositions of the control and experimental groups were monitored by XPS. Figure 4 shows the analysis spectra of the control, G20, G50, G80, and G100. The XPS peaks showed that the four experimental groups contained not only Ag and Ti elements, but also some C and O elements, while the control group included mainly Ti, C and O elements. Besides the above described elements, Ti and Ag elements clearly were shown on the Ti substrates surface (Figure 4A–E). In addition, the Ag atomic and mass ratios (Figure 4F) on the Ti sheets surface were 0, 0.87, 2.14, 4.53, 6.33, and 0, 6.63, 15.31, 28.42, 36.02 that were corresponded to the control group, G20, G50, G80, G100, respectively. And there are a significant statistical difference between the groups (P<0.001).
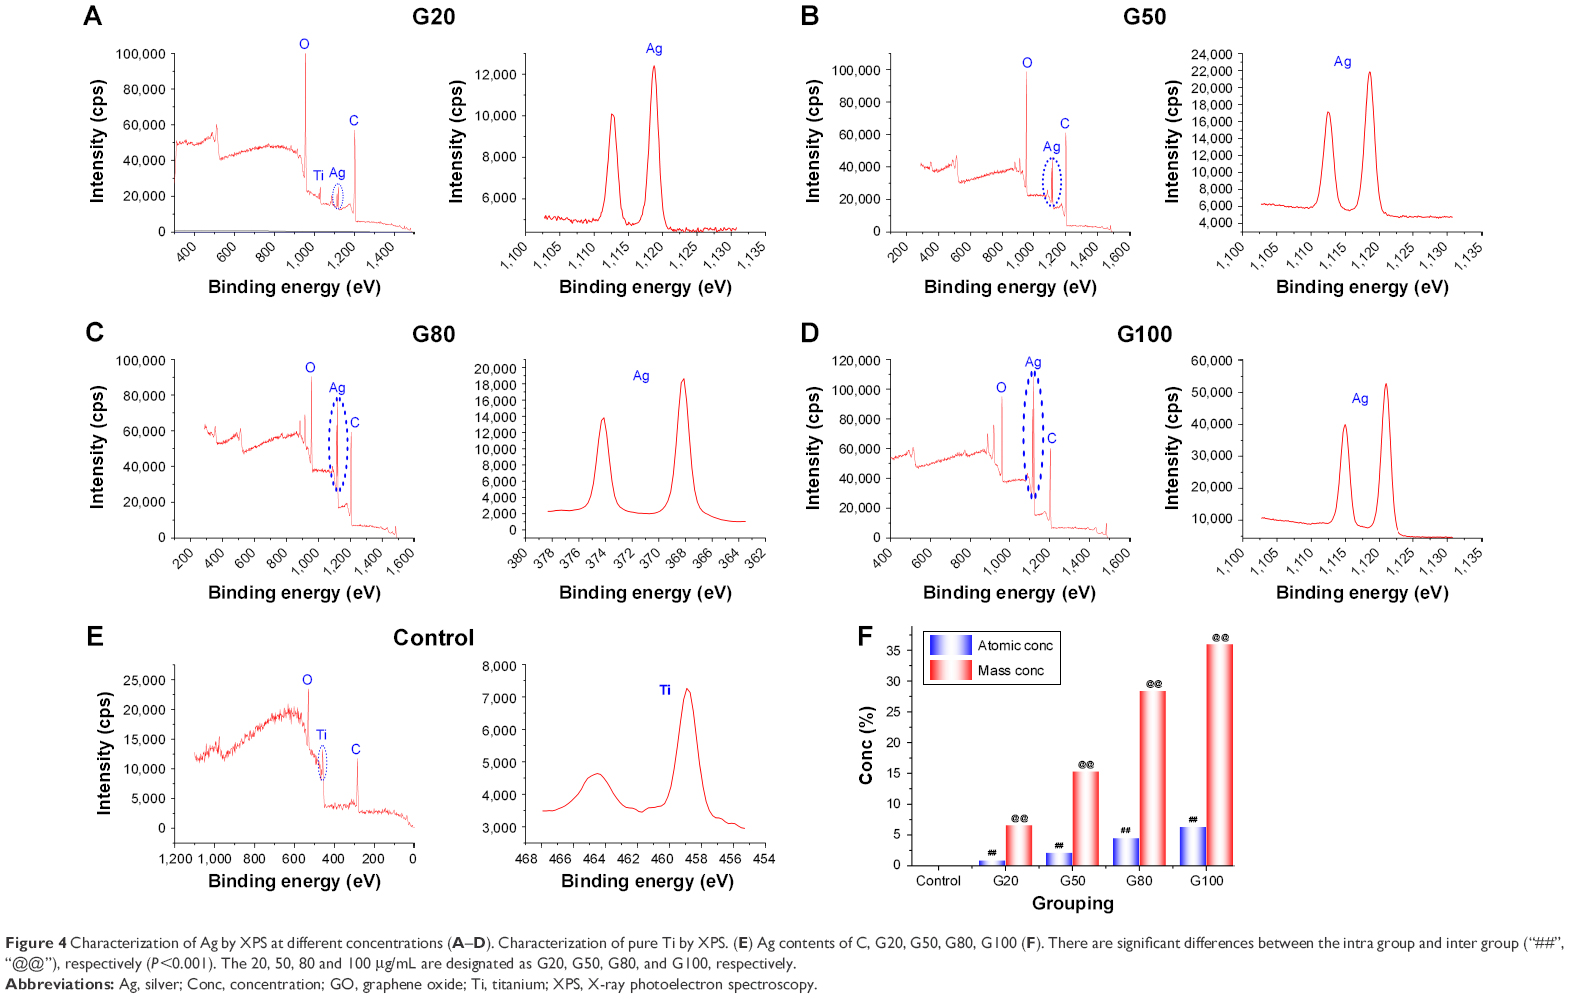 | Figure 4 Characterization of Ag by XPS at different concentrations (A–D). Characterization of pure Ti by XPS. (E) Ag contents of C, G20, G50, G80, G100 (F). There are significant differences between the intra group and inter group (“##”, “@@”), respectively (P<0.001). The 20, 50, 80 and 100 μg/mL are designated as G20, G50, G80, and G100, respectively. |
Antibacterial and adherent rate
Antibacterial and relative adhesion rates against S. mutans and P. gingivalis on the samples surface for 24 h were evaluated, and the results are shown in Figure 5. The relative adhesion rate (Figure 5A) of the control group was the highest, which was close to 100% (the control group was used as reference); and the four experimental groups were 10.05%, 11.00%, 5.25%, 4.55%, which corresponded to the G20, G50, G80, G100, respectively. There are significant statistical differences between the control group and the four experimental groups (P<0.001). The best antibacterial ability (Figure 5B) was shown by G100 (95.45%), which was followed by G80 (94.75%), G50 (89.00%), G20 (89.95%) groups (the control group was used as reference). There were no statistical differences between the four experimental groups.
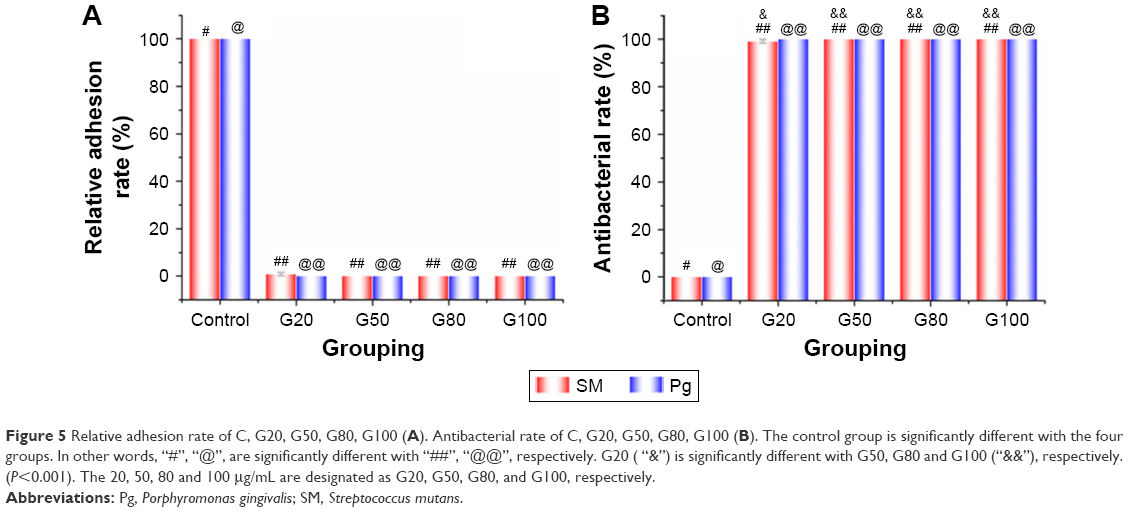 | Figure 5 Relative adhesion rate of C, G20, G50, G80, G100 (A). Antibacterial rate of C, G20, G50, G80, G100 (B). The control group is significantly different with the four groups. In other words, “#”, “@”, are significantly different with “##”, “@@”, respectively. G20 ( “&”) is significantly different with G50, G80 and G100 (“”), respectively. (P<0.001). The 20, 50, 80 and 100 μg/mL are designated as G20, G50, G80, and G100, respectively. |
Morphology of bacteria
The morphology of bacterial cells that was observed by FE-SEM was a benefit to explore the antibacterial mechanism and evaluate the antibacterial ability after being exposed to Ti substrates surface.41 Figure 6 shows the results of bacterial cells illuminating the degree and property of cells damage. The native S. mutans and P. gingivalis exhibited a typically chain-like and globular shape, respectively. The whole cells were membrane integrity (Figure 6A1–A4). After being exposed to G20, G50, G80, G100 groups, the bacteria cells bodies of S. mutans and P. gingivalis were badly damaged, such as shrinking (Figure 6B2, C2, D2 and E2), perforating (Figure 6C4 and E4), breaking (Figure 6D4), and bursting (Figure 6B4). And the number of bacteria on the experimental groups surface was significantly less than that on the control group surface.
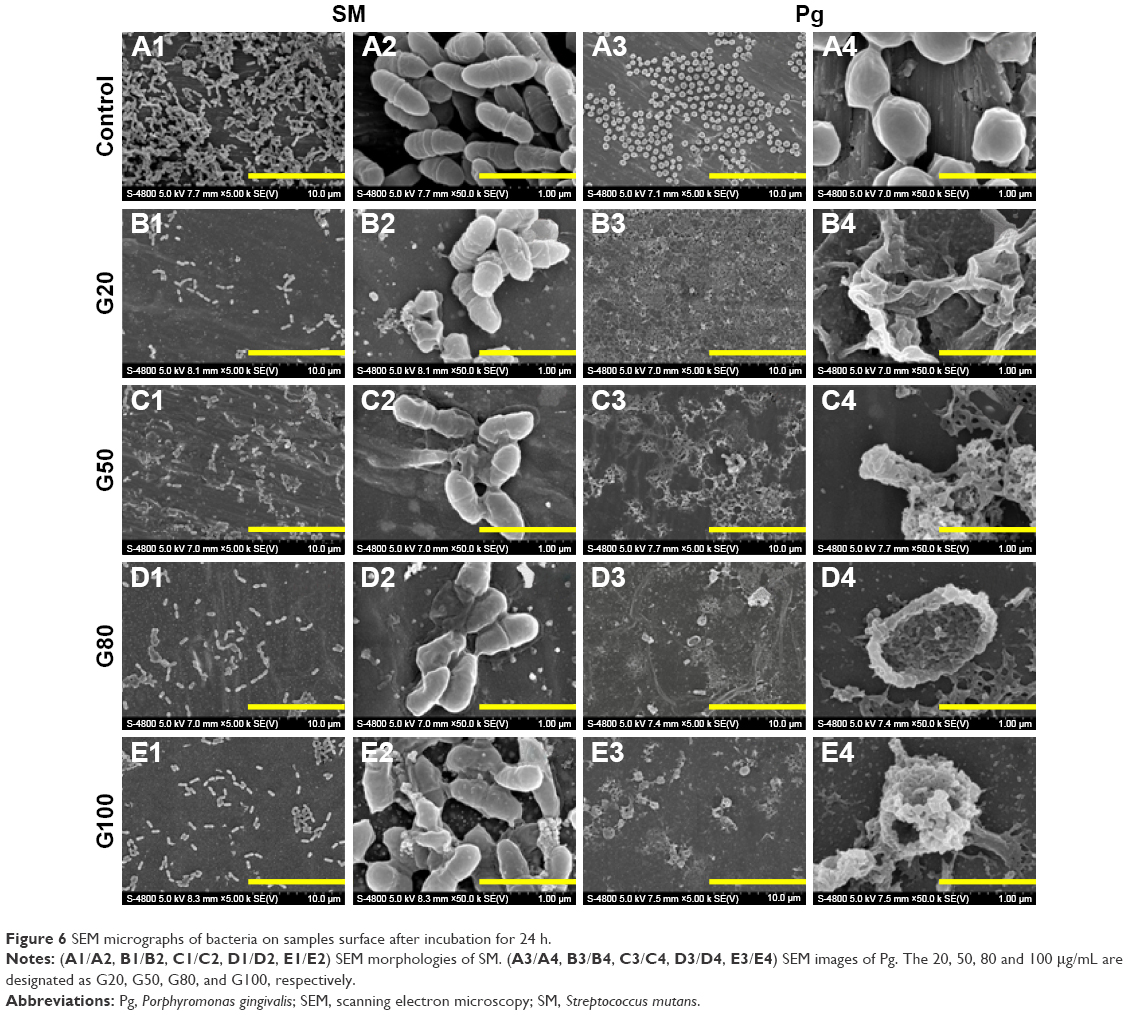 | Figure 6 SEM micrographs of bacteria on samples surface after incubation for 24 h. |
Membrane integrity of S. mutans and P. gingivalis
CLSM was monitored to observe the antibacterial effects of GO-Ag on S. mutans and P. gingivalis (Figure 7). After fluorescence labeling, bacteria with compromised membranes were dyed red, and viable cells with integral membranes were stained green. S. mutans and P. gingivalis biofilms exhibited densely green areas on the control group surface, and the Ti substrates were not dyed (Figure 7F A, a). As shown in Figure 7F B–D, extensive red fluorescence on the specimens surface was examined. There was almost no adhesion of bacteria on the surface of sample G100 (Figure 7F E). However, the Ti sheets were obviously stained red and green. Additionally, after the samples of G20, G50, G80, G100 were placed in P. gingivalis culture medium for 24 h, but there was almost no bacteria on the surface of samples, and fluorescence was observed (Figure 7F B–E). Green fluorescence intensity (FIg), red fluorescence intensity (FIr) and FIr/FIg ratio are shown in Figure 7G. Figure 7G is the fluorescence intensity of S. mutans that adhered to the Ti substrates surface. The highest FIg and FIr were the control group and G50, respectively. The lowest FIr/FIg ratio was the control group (Figure 7G left) and there are statistical differences between the 5 groups. The results of P. gingivalis were similar to the S. mutans (Figure 7G right). The only difference was that the FIg and FIr were close in the control group.
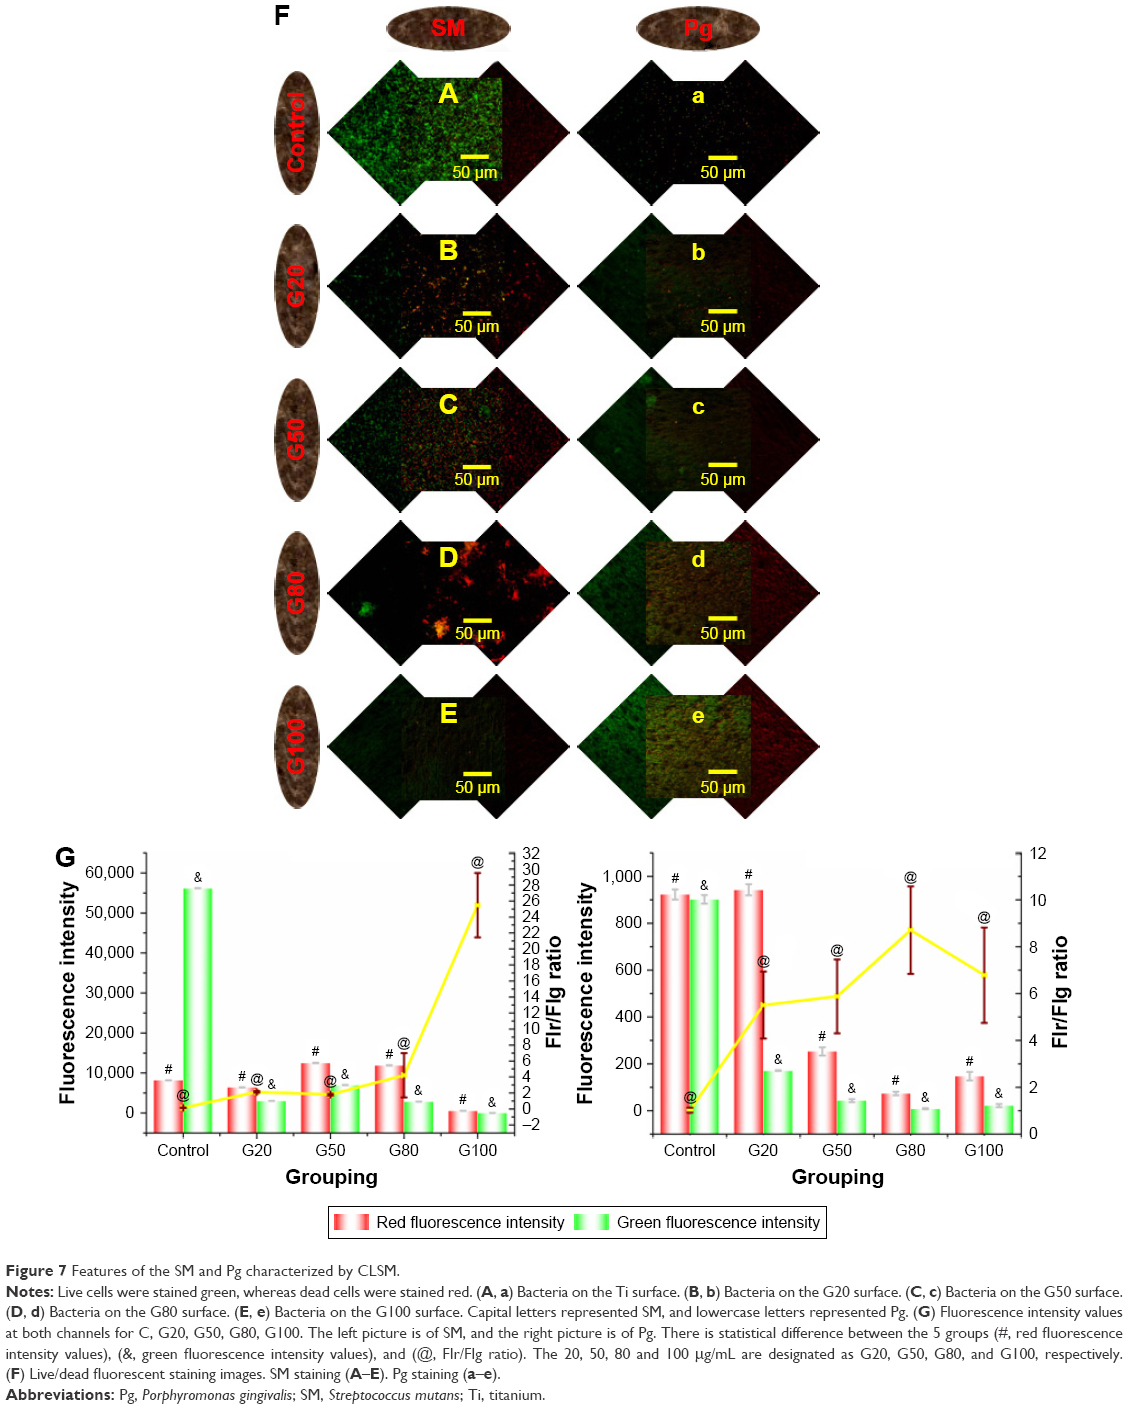 | Figure 7 Features of the SM and Pg characterized by CLSM. |
Bacterial apoptosis
Figure 8 shows the results of flow cytometry analysis of S. mutans and P. gingivalis viability after treatment with pure Ti, 20, 50, 80 and 100 μg/mL of GO-Ag-Ti using LIVE/DEAD BacLight kit, which was composed of two stains, SYTO9 and PI. Figure 8A shows that there were two core areas that were marked by the purple arrows. After the bacteria cells were cultured with GO-Ag, there was only one fluorescent core area, which was labeled by orange dashed box and purple arrows (Figure 8B–E). The results of P. gingivalis were same as those of S. mutans. But the difference was that the fluorescent core area of four experimental groups moved to the bottom left corner (Figure 8A–E).
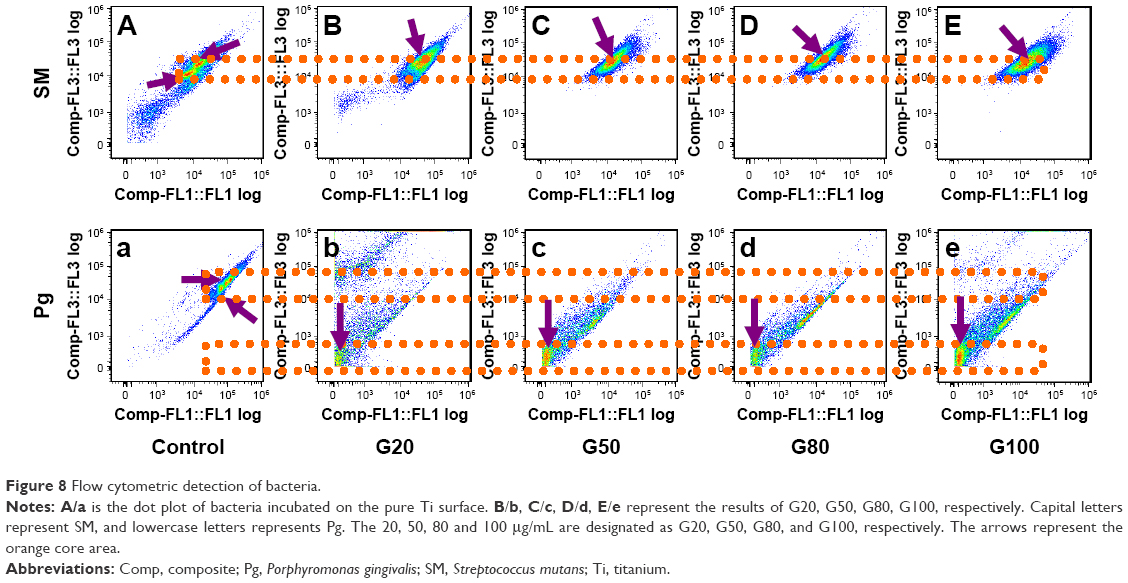 | Figure 8 Flow cytometric detection of bacteria. |
Relative gene expression
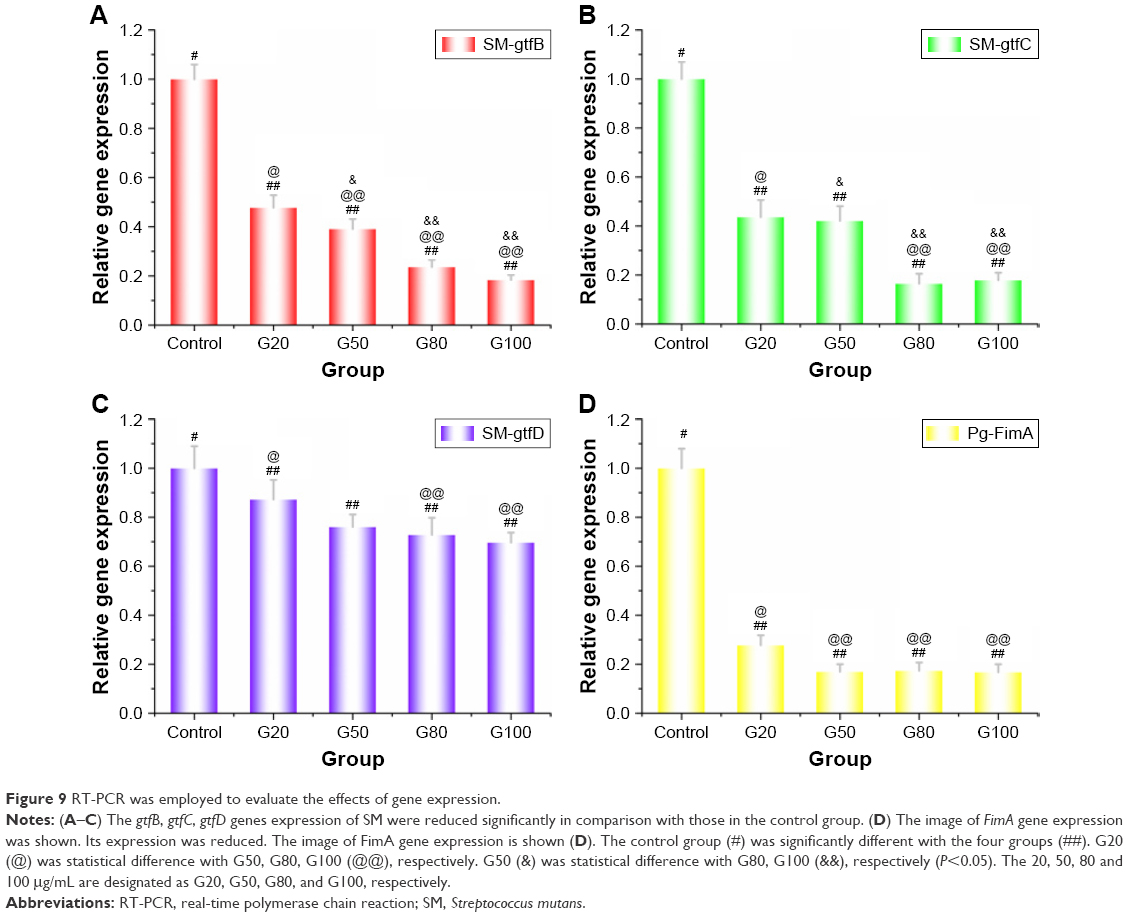
To investigate the effects of metabolites of S. mutans and P. gingivalis incubated on the pure Ti and GO-Ag-Ti surface for 24 h for the expression of the gtfB, gtfC, gtfD, and FimA genes, the RT-PCR was employed to analyze the mRNA levels of those genes. Figure 9A indicates the relative gene expression of gtfB, which decreased with the increase in the concentration of GO. And there were significant statistical differences (P<0.05), except for G80 and G100 (P>0.05). Figure 9B–D shows the results of gtfC, gtfD and FimA, which were similar to the results of gtfB. Additionally, there were no statistical differences, including between G20 and G50 (P>0.05, Figure 9B), G80 and G100 (P>0.05, Figure 9B), G20 and G50 (P>0.05, Figure 9C), G50 and G80 (P>0.05, Figure 9C), G50 and G100 (P>0.05, Figure 9C), G80 and G100 (P>0.05, Figure 9C), G50 and G80 (P>0.05, Figure 9D), G50 and G100 (P>0.05, Figure 9D), G80 and G100 (P>0.05, Figure 9D, respectively.
 | Figure 9 RT-PCR was employed to evaluate the effects of gene expression. |
Cell viability
As shown in Figure 10, the cell viability of pure Ti, G20, G50, G80 and G100 was examined using CCK-8. The result of the control group was the highest (92.63±7.49). The cell viability of the four experimental groups were inversely proportional to the contents of GO and Ag (82.33±1.62, 80.80±6.80, 57.30±7.98, 41.17±1.70). And there was statistical difference between the groups, including between C and G50 (P<0.05), C and G80 (P<0.001), C and G100 (P<0.001), G20 and G80 (P<0.001), G20 and G100 (P<0.001), G50 and G80 (P<0.05), G50 and G100 (P<0.001), G80 and G100 (P<0.05).
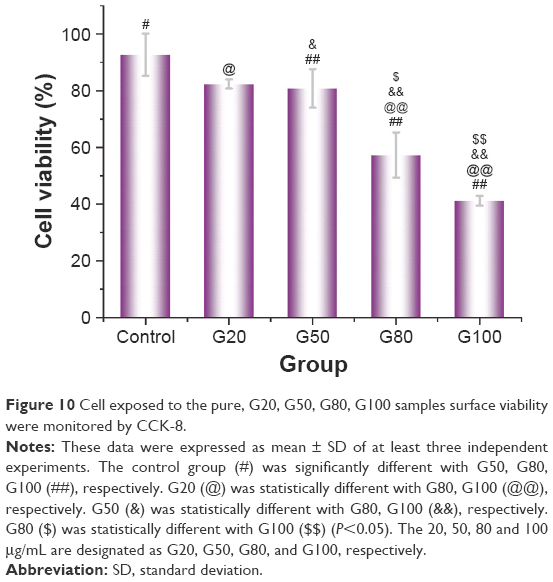 | Figure 10 Cell exposed to the pure, G20, G50, G80, G100 samples surface viability were monitored by CCK-8. |
Discussion
The main reason for the failure of the dental implant is the bone loss caused by the inflammation around the implants.4 It is generally known that bacteria are the main pathogenic factors of the peri-implantitis.39 Therefore, how to improve the biocompatibility and antimicrobial activity of the dental implant to reduce or eliminate the inflammatory response has become the key to enhance the success rate of implants. The purpose of the modification is to make the material have dual properties, such as biocompatibility, and antibacterial property.42–44 In the study, GO-Ag coatings are produced on the Ti surface via an economical and simple method, which is electroplating and UV reduction. Although it is reported45 that the antimicrobial effect of GO is prominent, it could promote the growth of bacteria, which is consistent with the results of Ruiz et al and Hui at al.46,47 Ruiz et al46 showed that GO does not have antimicrobial ability. It can be used as the framework of bacteria adhesion, and promote the growth, proliferation and formation of bacterial biofilm. Hui et al47 indicated that the bacterial survival rate is 97.95% when the Escherichia coli incubate in 200 μg/mL of GO and LB culture medium for 3 h. This is sos because GO can adsorb the protein of LB culture medium, bovine serum albumin and tryptophan by non-covalent. Therefore, silver as a classical antibacterial agent is introduced into the experimental design.
GO that is an oxide of graphene is brownish yellow. The color of its aqueous solution varies with the concentration of GO (Figure 1A). The Ti substrates surface show different color by electroplating, which is also due to the amount of GO (Figure 1B). And the results of Raman spectroscopy have demonstrated (Figure 3B). Although Ag also has a certain color, it cannot be distinguished by the naked eye. The results of FE-SEM indicate that the amount of Ag nanoparticles is different on the GO-Ti surface (Figure 2B4, C4, D4 and E4). Because GO is negatively charged and 20, 50, 80 and 100 μg/mL of GO have different positive charge, so they can absorb different amounts of Ag nanoparticles, which has been proven by XPS (Figure 4F). In addition, the distribution of Ag nanoparticles is more uniform on the GO-Ti surface. In the GO structure, there are many carboxyl, hydroxyl, and carbonyl, which are negatively charged. They may be combined with positively charged Ag ions in the aqueous solution. It is reported that Ag ions are reduced by HCOONH4 in site when Ag ions combine with carboxyl, hydroxyl, and carbonyl. In our study, Ag ions are reduced by UV-light.48 Many Ti surface antibacterial coatings are widely studied in the dental and orthopedic fields, including antibiotics, nonantibiotic organic antimicrobial agents, inorganic antimicrobial agents, biofunctionalization with antibacterial bioactive polymers, nitrogen monoxide, etc. An antimicrobial coating, which is doped with a proper amount of Ag nanoparticles has a good development and application prospect.30–33 In this study, Ag nanoparticles were deposited on the GO-Ti surface by UV reduction method (Figures 2 and 4). The antibacterial and relative adhesion rates against S. mutans and P. gingivalis are more obvious (Figure 5), especially for S. mutans, which is an anaerobic bacteria and easily affected by environmental and operational factors. Of course, the results could also provide evidence for the antibacterial ability of GO-Ag-Ti, which is similar to the results of Song.48 His findings suggest that antibacterial behavior of GO-Ag against both bacterial strains was dose and contact time dependent, and the antibacterial activity was more effective against E. coli than S. aureus. Additionally, Mei et al49 revealed that Ag is a superior antimicrobial agent, promotes fibroblasts and epithelial cells to proliferate and differentiate in vitro, and causes less inflammation in vivo. Also, He et al45 indicates that the antimicrobial effect of GO nanosheets is prominent against P. gingivalis. There are five explanations, including damaging DNA of bacteria, interrupting cell signal transduction,50 oxidative damage of reactive oxygen species,51 intracellular contents leaked out52 and dehydrogenase inactivation.53 The antibacterial effect could be obtained from the morphology and quantity of bacteria that adhere on the GO-Ag-Ti surface (Figures 6 and 7F). First, Ag nanoparticles or Ag+ are easily and slowly released in solution. Second, positively charged Ag+ are attracted by the lipids, which are negatively charged on bacteria cell membranes due to electrostatic attraction. Third, because Ag+ interact with phospholipid bilayer resulting in altering cell membrane permeability.54 As is known to all, the selective permeability of bacteria cell membrane is the foundation of substances transport and exchange. So, extracellular products leak in and intracellular contents leak out. In other words, the morphology and number of bacteria cells are greatly affected by GO-Ag. For example, Figure 6 (B, C, D, E) shows that bacterial structure is destroyed. Figure 7F (B, C, D, E) reveals that the number of bacteria cells is less than those on the control group surface.55 On the other hand, when Ag+ enters the cells, it comes in contact with intracellular enzyme, such as enzymes of the respiratory chain, and destroys the mitochondrial electron transport chain. Also, catalase and superoxide dismutase are formed.56 They are stronger oxidant, such as hydrogen peroxide and superoxide anion radical, etc, which are the main substances of oxidative stress reaction (reactive oxygen species [ROS]) in cells. When ROS occurs in the cell membrane, the phenomenon of denaturation, fracture, crosslinking, and death will come up (Figures 11). In a word, the results not only affect the bacteria on the GO-Ag-Ti substrates surface, but also affect the planktonic bacteria in the culture medium. The results of this study are consistent with those of other scholars.57–60
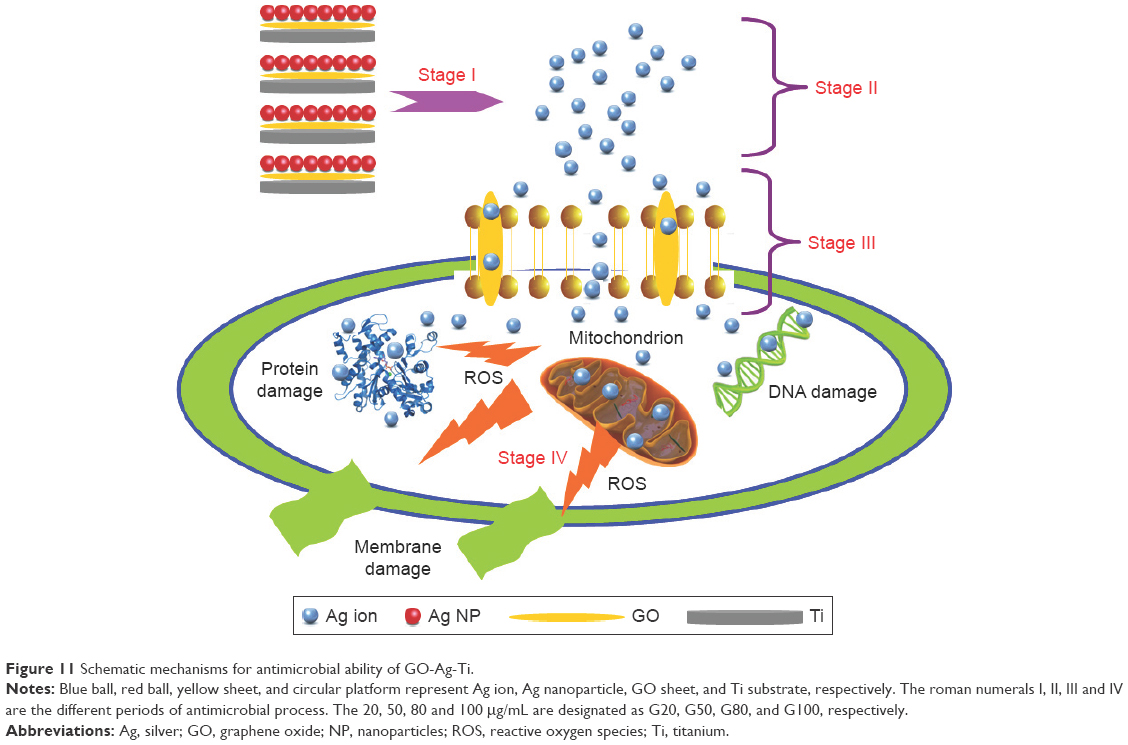 | Figure 11 Schematic mechanisms for antimicrobial ability of GO-Ag-Ti. |
Extracellular glucans of S. mutans are mostly synthetized by three GTFs (gtfB, gtfC, gtfD), which will influence bacteria adhesion, biofilm formation, occurrence and development of dental caries. Therefore, glucosyltransferase plays an important role in dental caries.61 The water insoluble glucans are catalyzed mainly by gtfB and gtfC genes, loci of which are adjacent. The gtfD encodes, which are separate from the two genes mentioned previously, synthetise water soluble glucans. So changes in the gtfB, gtfC, gtfD genes expression will influence glucan synthesis. In the experiment, the expression of GTF genes are all subject to decrease (Figure 9), especially gtfB and gtfC. Koo62 showed that gtfB, gtfC and gtfD expression in S. mutans are influenced by apigenin. The gtfB and gtfC genes expression of SM are reduced significantly in comparison with those in the control group. The results are the same as in Koo’s study. In contrast, the level of gtfD expression increases. This may be because the gtfD gene expression is affected by GO, Ag or pH. In Koo62 study, the bacteria grew in the planktonic state, and in our study, they are incubated on the Ti substrate surface. Additionally, the structure and function of fimbriae are unique, and synthetized by the FimA gene of P. gingivalis. However, it is one of the important bacteria causing the peri-implantitis.4 The expression of FimA gene is significantly down-regulated (Figure 9D), which also explains why there are almost no bacteria on the Ti sheet’s surface (Figure 7F).49
The cytotoxicity of carbon nanomaterials has been extensively studied and reported.63 Of course, GO and graphene family materials are also without exception. Toxicity of these materials is mainly related to the exposition time, concentration and presence of other factors, such as biocompatible molecules.64 In general, Ag nanomaterials have certain cytotoxicity as well as GO at high concentrations.65 In this study, the cell viability of G80 and G100 is lower than the control, G20 and G50 (Figure 10). The contents of GO and Ag on the Ti substrates surface of G80 and G100 are more than those in the control, G20 and G50 (Figures 2, 3B and 4F). In other words, more negative charges that can attract more Ag ions exist on the Ti sheet surface. Additionally, cytotoxicity is mainly caused by the Ag ions. In our previous study, after the four concentrations of GO (20, 50, 80 and 100 μg/mL) modified the Ti substrates surface, when they co-cultured with bacterials, they could promote different degrees of bacteria cell adhesion and growth. This is why we use Ag ions and GO to modify the Ti substrates surface. Although the concentration of 20, 50, 80 and 100 μm/mL of GO may induce cytotoxicity,66 GO is not fully loaded onto Ti substrates surface, which has been explained by the results of Figure 1A.
Conclusion
In summary, GO thin film and Ag nanoparticles are loaded onto Ti substrates surface via electroplating and UV reduction methods. The amount of GO thin film and Ag nanoparticles are characterized by different laboratory apparatus. The antimicrobial activity and relative adhesion rate of GO-Ag-Ti are very prominent against S. mutans and P. gingivalis. The bactericidal mechanism of GO-Ag-Ti are revealed by microstructures, quantities, membrane integrity, apoptosis, and relative gene expression of S. mutans and P. gingivalis. Also, the cytotoxicity of samples are shown. Thus, GO-Ag-Ti multiphase nanocomposite would be a promising biomedical material due to prevention of implant-associated infection.
Acknowledgment
This work was supported financially by the National Natural Science Foundation of China (Nos 81470742 and 81530051).
Disclosure
The authors report no conflicts of interest in the work.
References
Mohseni E, Zalnezhad E, Bushroa AR. Comparative investigation on the adhesion of hydroxyapatite coating on Ti–6Al–4V implant: a review paper. Int J Adhes Adhes. 2014;48:238–257. | ||
Kutty MG, De A, Bhaduri SB, Yaghoubi A. Microwave-assisted fabrication of titanium implants with controlled surface topography for rapid bone healing. ACS Appl Mater Interfaces. 2014;6(16):13587–13593. | ||
Elahinia MH, Hashemi M, Tabesh M, Bhaduri SB. Manufacturing and processing of NiTi implants: a review. Prog Mater Sci. 2012;57(5):911–946. | ||
de Avila ED, Lima BP, Sekiya T, et al. Effect of UV-photofunctionalization on oral bacterial attachment and biofilm formation to titanium implant material. Biomaterials. 2015;67:84–92. | ||
Fu J, Yamamoto A, Kim HY, Hosoda H, Miyazaki S. Novel Ti-base superelastic alloys with large recovery strain and excellent biocompatibility. Acta Biomater. 2015;17:56–67. | ||
Kim MH, Park K, Choi KH, et al. Cell adhesion and in vivo osseointegration of sandblasted/acid etched/anodized dental implants. Int J Mol Sci. 2015;16(5):10324–10336. | ||
Dolanmaz D, Saglam M, Inan O, et al. Monitoring bone morphogenetic protein -2 and -7, soluble receptor activator of nuclear factor-κB ligand and osteoprotegerin levels in the peri-implant sulcular fluid during the osseointegration of hydrophilic-modified sandblasted acid-etched and sandblasted acid-etched surface dental implants. J Periodontal Res. 2015;50(1):62–73. | ||
Butev E, Esen Z, Bor S. In vitro bioactivity investigation of alkali treated Ti6Al7Nb alloy foams. Appl Surf Sci. 2015;327:437–443. | ||
Trisi P, Berardini M, Colagiovanni M, Berardi D, Perfetti G. Laser-treated titanium implants: an in vivo histomorphometric and biomechanical analysis. Implant Dent. 2016;25(5):575–580. | ||
Jia Z, Xiu P, Li M, et al. Bioinspired anchoring AgNPs onto micro-nanoporous TiO 2 orthopedic coatings: trap-killing of bacteria, surface-regulated osteoblast functions and host responses. Biomaterials. 2016;75:203–222. | ||
Kulkarni M, Mazare A, Park J, et al. Protein interactions with layers of TiO 2 nanotube and nanopore arrays: morphology and surface charge influence. Acta Biomaterialia. 2016;45:357–366. | ||
Li JL, Tang B, Yuan B, Sun L, Wang XG. A review of optical imaging and therapy using nanosized graphene and graphene oxide. Biomaterials. 2013;34(37):9519–9534. | ||
Notley SM, Crawford RJ, Ivanova EP. Bacterial interaction with graphene particles and surfaces. In: Aliofkhazraei M, editor. Advances in Graphene Science. Croatia: InTech; 2013:99–118. | ||
Yang Y, Asiri AM, Tang Z, Du D, Lin Y. Graphene based materials for biomedical applications. Materials Today. 2013;16(10):365–373. | ||
Goenka S, Sant V, Sant S. Graphene-based nanomaterials for drug delivery and tissue engineering. J Control Release. 2014;173:75–88. | ||
Dreyer DR, Park S, Bielawski CW, Ruoff RS. The chemistry of graphene oxide. Chem Soc Rev. 2010;39(1):228-240. | ||
Andre Mkhoyan K, Contryman AW, Silcox J, et al. Atomic and electronic structure of graphene-oxide. Nano Lett. 2009;9(3):1058-1063. | ||
Kalbacova M, Broz A, Kong J, Kalbac M. Graphene substrates promote adherence of human osteoblasts and mesenchymal stromal cells. Carbon. 2010;48(15):4323-4329. | ||
Gao L, Li Q, Li R, et al. Highly sensitive detection for proteins using graphene oxide-aptamer based sensors. Nanoscale. 2015;7(25):10903-10907. | ||
Liu J, Fu S, Yuan B, Li Y, Deng Z. Toward a universal “adhesive nanosheet” for the assembly of multiple nanoparticles based on a protein-induced reduction/decoration of graphene oxide. J Am Chem Soc. 2010;132(21):7279-7281. | ||
Zhu Y, Murali S, Cai W, et al. Graphene and graphene oxide: synthesis, properties, and applications. Adv Mater. 2010;22(35):3906–3924. | ||
Gurunathan S, Han JW, Dayem AA, Eppakayala V, Kim JH. Oxidative stress-mediated antibacterial activity of graphene oxide and reduced graphene oxide in Pseudomonas aeruginosa. Int J Nanomedicine. 2012;7:5901–5914. | ||
Liu S, Zeng TH, Hofmann M, et al. Antibacterial activity of graphite, graphite oxide, graphene oxide, and reduced graphene oxide: membrane and oxidative stress. ACS Nano. 2011;5(9):6971–6980. | ||
Hajipour MJ, Fromm KM, Ashkarran AA, et al. Antibacterial properties of nanoparticles. Trends Biotechnol. 2012;30(10):499–511. | ||
Elsaka SE, Hamouda IM, Swain MV. Titanium dioxide nanoparticles addition to a conventional glass-ionomer restorative: influence on physical and antibacterial properties. J Dent. 2011;39(9):589–598. | ||
Zhong L, Yun K. Graphene oxide-modified ZnO particles: synthesis, characterization, and antibacterial properties. Internat J Nanomedicine. 2015;10:79–92. | ||
Al-Hazmi F, Alnowaiser F, Al-Ghamdi AA, et al. A new large–scale synthesis of magnesium oxide nanowires: structural and antibacterial properties. Superlattices Microstruct. 2012;52(2):200–209. | ||
MubarakAli D, Thajuddin N, Jeganathan K, Gunasekaran M. Plant extract mediated synthesis of silver and gold nanoparticles and its antibacterial activity against clinically isolated pathogens. Colloids Surf B Biointerfaces. 2011;85(2):360–365. | ||
Raffi M, Mehrwan S, Bhatti TM, et al. Investigations into the antibacterial behavior of copper nanoparticles against Escherichia coli. Ann Microbiol. 2010;60(1):75–80. | ||
Gao A, Hang R, Huang X, et al. The effects of titania nanotubes with embedded silver oxide nanoparticles on bacteria and osteoblasts. Biomaterials. 2014;35(13):4223–4235. | ||
Agarwal A, Weis TL, Schurr MJ, et al. Surfaces modified with nanometer-thick silver-impregnated polymeric films that kill bacteria but support growth of mammalian cells. Biomaterials. 2010;31(4):680als. | ||
Saifuddin N, Wong CW, Yasumira AA. Rapid biosynthesis of silver nanoparticles using culture supernatant of bacteria with microwave irradiation. J Chem. 2009;6(1):61–70. | ||
Reithofer MR, Lakshmanan A, Ping AT, Chin JM, Hauser CA. In situ synthesis of size-controlled, stable silver nanoparticles within ultrashort peptide hydrogels and their anti-bacterial properties. Biomaterials. 2014;35(26):7535–7542. | ||
Mukherjee SG, O’Claonadh N, Casey A, Chambers G. Comparative in vitro cytotoxicity study of silver nanoparticle on two mammalian cell lines. Toxicol In Vitro. 2012;26(2):238–251. | ||
Ramstedt M, Cheng N, Azzaroni O, Mossialos D, Mathieu HJ, Huck WT. Synthesis and characterization of poly (3-sulfopropylmethacrylate) brushes for potential antibacterial applications. Langmuir. 2007;23(6):3314–3321. | ||
Park EJ, Yi J, Kim Y, Choi K, Park K. Silver nanoparticles induce cytotoxicity by a Trojan-horse type mechanism. Toxicol In Vitro. 2010;24(3):872–878. | ||
Taheri S, Cavallaro A, Christo SN, et al. Substrate independent silver nanoparticle based antibacterial coatings. Biomaterials. 2014;35(16):4601–4609. | ||
Park MV, Neigh AM, Vermeulen JP, et al. The effect of particle size on the cytotoxicity, inflammation, developmental toxicity and genotoxicity of silver nanoparticles. Biomaterials. 2011;32(36):9810–9817. | ||
Zhao L, Wang H, Huo K, et al. Antibacterial nano-structured titania coating incorporated with silver nanoparticles. Biomaterials. 2011;32(24):5706–5716. | ||
Shibata Y, Suzuki D, Omori S, et al. The characteristics of in vitro biological activity of titanium surfaces anodically oxidized in chloride solutions. Biomaterials. 2010;31(33):8546–8555. | ||
Jin G, Qin H, Cao H, et al. Synergistic effects of dual Zn/Ag ion implantation in osteogenic activity and antibacterial ability of titanium. Biomaterials. 2014;35(27):7699–7713. | ||
Chua PH, Neoh KG, Kang ET, Wang W. Surface functionalization of titanium with hyaluronic acid/chitosan polyelectrolyte multilayers and RGD for promoting osteoblast functions and inhibiting bacterial adhesion. Biomaterials. 2008;29(10):1412–1421. | ||
Zhang F, Zhang Z, Zhu X, Kang ET, Neoh KG. Silk-functionalized titanium surfaces for enhancing osteoblast functions and reducing bacterial adhesion. Biomaterials. 2008;29(36):4751–4759. | ||
Harris LG, Tosatti S, Wieland M, Textor M, Richards RG. Staphylococcus aureus adhesion to titanium oxide surfaces coated with non-functionalized and peptide-functionalized poly (L-lysine)-grafted-poly (ethylene glycol) copolymers. Biomaterials. 2004;25(18):4135–4148. | ||
He J, Zhu X, Qi Z, et al. Killing dental pathogens using antibacterial graphene oxide. ACS Appl Mater Interfaces. 2015;7(9):5605–5611. | ||
Ruiz ON, Fernando KAS, Wang B, et al. Graphene oxide: a nonspecific enhancer of cellular growth. ACS Nano. 2011;5(10):8100–8107. | ||
Hui L, Piao JG, Auletta J, et al. Availability of the basal planes of graphene oxide determines whether it is antibacterial. ACS Appl Mater Interfaces. 2014;6(15):13183–13190. | ||
Song B, Zhang C, Zeng G, Gong J, Chang Y, Jiang Y. Antibacterial properties and mechanism of graphene oxide-silver nanocomposites as bactericidal agents for water disinfection. Arch Biochem Biophy. 2016;604:167–176. | ||
Mei S, Wang H, Wang W, et al. Antibacterial effects and biocompatibility of titanium surfaces with graded silver incorporation in titania nanotubes. Biomaterials. 2014;35(14):4255–4265. | ||
Shrivastava S, Bera T, Roy A, Singh G, Ramachandrarao P, Dash D. Characterization of enhanced antibacterial effects of novel silver nanoparticles. Nanotechnology. 2007;18(22):225103–225112. | ||
Pal S, Tak YK, Joardar J, et al. Nanocrystalline silver supported on activated carbon matrix from hydrosol: antibacterial mechanism under prolonged incubation conditions. J Nanosci Nanotechnol. 2009;9(3):2092–2103. | ||
Kim KJ, Sung WS, Suh BK, et al. Antifungal activity and mode of action of silver nano-particles on Candida albicans. Biometals. 2009;22(2):235–242. | ||
Matsumura Y, Yoshikata K, Kunisaki S, Tsuchido T. Mode of bactericidal action of silver zeolite and its comparison with that of silver nitrate. Appl Environ Microbiol. 2003;69(7):4278–4281. | ||
Su G, Zhou H, Mu Q, et al. Effective surface charge density determines the electrostatic attraction between nanoparticles and cells. J Phys Chem. 2012;116(8):4993–4998. | ||
Sondi I, Salopek-Sondi B. Silver nanoparticles as antimicrobial agent: a case study on E. coli as a model for Gram-negative bacteria. J Colloid Interface Sci. 2004;275(1):177–182. | ||
Holt KB, Bard AJ. Interaction of silver(I) ions with the respiratory chain of Escherichia coli: an electrochemical and scanning electrochemical microscopy study of the antimicrobial mechanism of micromolar Ag+. Biochemistry. 2005;44(39):13214–13223. | ||
Lambadi PR, Sharma TK, Kumar P, et al. Facile biofunctionalization of silver nanoparticles for enhanced antibacterial properties, endotoxin removal, and biofilm control. Int J Nanomedicine. 2015;10:2155–21171. | ||
Padalia H, Moteriya P, Chanda S. Green synthesis of silver nanoparticles from marigold flower and its synergistic antimicrobial potential. Arabian J Chem. 2015;8(5):732–741. | ||
Ghosh IN, Patil SD, Sharma TK, Srivastava SK, Pathania R, Navani NK. Synergistic action of cinnamaldehyde with silver nanoparticles against spore-forming bacteria: a case for judicious use of silver nanoparticles for antibacterial applications. Int J Nanomedicine. 2013;8:4721–4731. | ||
Sharma TK, Sapra M, Chopra A, et al. Interaction of bacteriocin-capped silver nanoparticles with food pathogens and their antibacterial effect. Int J Green Nanotechnol. 2012;4(2):93–110. | ||
Yamashita Y, Bowen WH, Burne RA, Kuramitsu HK. Role of the Streptococcus mutans gtf genes in caries induction in the specific-pathogen-free rat model. Infect Immun. 1993;61(9):3811–3817. | ||
Koo H, Seils J, Abranches J, Burne RA, Bowen WH, Quivey RG Jr. Influence of apigenin on gtf gene expression in Streptococcus mutans UA159. Antimicrob Agents Chemother. 2006;50(2):542–546. | ||
Sutariya VB, Pathak Y, eds. Biointeractions of Nanomaterials. London, UK: CRC Press; 2014. | ||
Chowdhury SM, Lalwani G, Zhang K, et al. Cell specific cytotoxicity and uptake of graphene nanoribbons[J]. Biomaterials. 2013;34(1): 283–293. | ||
Cao H, Liu X, Meng F, et al. Biological actions of silver nanoparticles embedded in titanium controlled by micro-galvanic effects. Biomaterials. 2011;32(3):693–705. | ||
Zhang Y, Ali SF, Dervishi E, et al. Cytotoxicity effects of graphene and single-wall carbon nanotubes in neural phaeochromocytoma-derived PC12 cells. ACS Nano. 2010;4(6):3181–3186. |
 © 2017 The Author(s). This work is published and licensed by Dove Medical Press Limited. The full terms of this license are available at https://www.dovepress.com/terms.php and incorporate the Creative Commons Attribution - Non Commercial (unported, v3.0) License.
By accessing the work you hereby accept the Terms. Non-commercial uses of the work are permitted without any further permission from Dove Medical Press Limited, provided the work is properly attributed. For permission for commercial use of this work, please see paragraphs 4.2 and 5 of our Terms.
© 2017 The Author(s). This work is published and licensed by Dove Medical Press Limited. The full terms of this license are available at https://www.dovepress.com/terms.php and incorporate the Creative Commons Attribution - Non Commercial (unported, v3.0) License.
By accessing the work you hereby accept the Terms. Non-commercial uses of the work are permitted without any further permission from Dove Medical Press Limited, provided the work is properly attributed. For permission for commercial use of this work, please see paragraphs 4.2 and 5 of our Terms.