")
Back to Journals » Breast Cancer: Targets and Therapy » Volume 11
Thyronamine regulation of TAAR1 expression in breast cancer cells and investigation of its influence on viability and migration
Authors Tremmel E , Hofmann S, Kuhn C, Heidegger H, Heublein S, Hermelink K, Wuerstlein R, Harbeck N , Mayr D, Mahner S, Ditsch N , Jeschke U , Vattai A
Received 29 June 2018
Accepted for publication 17 August 2018
Published 19 February 2019 Volume 2019:11 Pages 87—97
DOI https://doi.org/10.2147/BCTT.S178721
Checked for plagiarism Yes
Review by Single anonymous peer review
Peer reviewer comments 2
Editor who approved publication: Professor Pranela Rameshwar
Eileen Tremmel,1 Simone Hofmann,1 Christina Kuhn,1 Helene Heidegger,1 Sabine Heublein,2 Kerstin Hermelink,1 Rachel Wuerstlein,1 Nadia Harbeck,1 Doris Mayr,3 Sven Mahner,1 Nina Ditsch,1 Udo Jeschke,1 Aurelia Vattai1
1Breast Center, Department of Gynecology and Obstetrics and CCC Munich, University of Munich (LMU), 81377 Munich, Germany; 2Department of Gynecology and Obstetrics, University of Heidelberg, 69120 Heidelberg, Germany; 3Department of Pathology, Ludwig-Maximilians University of Munich, 81337 Munich, Germany
Objectives: A correlation exists between breast cancer and thyroid disorders, which are common in elderly women. Thyroid hormones are degraded into trace amines, which can bind to the G-protein-coupled receptor trace amine-associated receptor 1 (TAAR1) and thereby activate it. The transformation of thyroid hormones into trace amines is carried out by the ornithine decarboxylase. Previously, we showed that TAAR1 overexpression (IRS ≥6) was associated with a significantly longer OS in primary breast cancer patients during a long-term follow-up of up to 14 years. Aim of the present study was to analyze the regulation of TAAR1 in breast cancer cell lines and the influence of triiodothyronine (T3), thyronamines, and tetraiodothyroacetic acid (Tetrac) on the expression of TAAR1 in breast cancer cells.
Methods: The effect of T3, thyronamines, and Tetrac on the expression of TAAR1 in breast cancer cell lines MCF-7 and T47D was analyzed via PCR and Western blot. A MTT assay was performed to test the metabolic cell viability. A scratch assay was performed to analyze cell migration.
Results: Stimulation of MCF-7 cells with 10 nM 3-iodothyronamine (T1AM) significantly increased TAAR1 protein expression (P=0.008). In T47D cells, TAAR1 expression was significantly upregulated after the addition of 10 µg/mL estradiol to 10 nM T1AM (P=0.008). A significant (P=0.028) reduction in MCF-7 cell viability through the incubation with T1AM could be detected. Cell migration of MCF cells was significantly reduced through incubation with 10 nM T1AM.
Conclusion: A significant upregulation of TAAR1 induced by stimulation with T1AM may be a sign for an increased decarboxylation of thyroid hormones in breast cancer cells. In addition, there seems to be an influence of estradiol for the T1AM-induced upregulation of TAAR1 in T47D cells. TAAR1-related cell transduction mechanisms seem to be an interesting target for endocrine treatment options of breast cancer patients.
Keywords: breast cancer, TAAR1, 3-iodothyronamine, Tetrac, MCF7, T47D
Introduction
Breast cancer is the most common malignant tumor in women worldwide.1 In 2012, about 1.7 million patients worldwide were diagnosed with breast cancer and almost half a million people died from it.2,3 There is evidence that a correlation exists between breast cancer and thyroid disorders, and patients with thyroid dysfunctions have higher breast cancer incidences in comparison to healthy women.4–6 The specific role of thyroidal hormones in breast cancer is still unclear, and future investigations are required to clarify it.7 Thyrotrophin (TSH) and fT4 levels seem to be predictive for therapeutic response and prognosis of patients with recurrent breast cancer.8 Ditsch et al9 observed that blood levels of the thyroid hormones fT3 and fT4 and concentrations of TSH and antibodies against thyroidal peroxidase are significantly elevated at the time of primary diagnosis in breast cancer patients. Especially in elderly women, those thyroid markers show a thyroid disorder.10
In our study, we investigated the influence of thyroid hormones and their degradation products on breast cancer cells. Dysfunction of the thyroid gland is common in elderly women,10 especially after the menopause.11–13 The highest occurrence of hypothyroidism and cancer of the thyroid gland takes place in postmenopausal women.13 The occurrence of dysfunction is 5–20 times higher in women than in men.13 Alternation in the amount of thyroid hormones is associated with aging. Especially TSH and thyroid antibodies are increasing in women over the age of 45 years.10 Thyroid hormones influence normal breast cell differentiation as well as breast cancer cell proliferation. Thyroid hormones in general stimulate the angiogenesis of various cancer cells. Thyroid dysfunctions, especially high levels of fT4 or antibodies, are associated with the development of breast cancer. In a previous study, it could be shown that triiodothyronine (T3) levels are positively related to the incidence of breast cancer in postmenopausal women.11
Thyroid hormones are degraded into trace amines (TAs), also referred to as thyronamines or endogenous amines.14 The enzyme ornithine decarboxylase (ODC) is a rate-limiting enzyme for the biosynthesis of polyamines, and it is probably responsible for the transformation of thyroid hormones into endogenous thyronamines (3-iodothyronamine [T1AM] and T0AM) through a deiodization process and a decarboxylation process.15 Compared to classical thyroid hormones, which act epigenetically, decarboxylated thyroid hormones are able to act through rapid actions such as rapid lowering of body temperature and heart rate.16 T1AM and its metabolites T0AM and TA1 are able to modify the brain, heart, pancreatic islets, and other tissues via the trace amine-associated receptor 1 (TAAR1),15 which is a G-protein-coupled receptor.16 Upon activation of adenyl cyclase, TAAR1 leads to a rise of the intracellular cAMP level.13,14 TAAR1 is expressed by various tissues including breast, cancer tissue, placenta, brain, spinal cord, stomach, pancreatic β cells, and immune cells such as macrophages, leukocytes, and dendritic cells.17–20 Different compounds, including adrenergic, dopaminergic, and serotonergic classes, and a wide spectrum of agonists can activate TAAR1.21–23
TAAR1 has mostly been investigated in the neurological field, and it was shown that TAAR1 is able to modulate the serotonergic and dopaminergic systems in the brain.17 Current clinical studies analyze TAAR1 in schizophrenia and other psychiatric disorders.24 The TAAR1 agonist T1AM is being tested in numerous experimental animal studies including its cardiac effects, prevention of ischemia-associated insults such as strokes, and many other functions.21,22
In a recently published study, we analyzed the regulation of TAAR1 in tumor tissue of primary breast cancer patients (M0) and identified that TAAR1 is an independent predictor for OS in early breast cancer.20 TAAR1 overexpression (IRS ≥6) was associated with a significantly longer OS in primary breast cancer patients (P=0.02) during long-term follow-up of up to 14 years.20 Therefore, TAAR1 has a favorable effect on OS in early breast cancer.20
The aim of our present study was to analyze the influence of thyronamines and T3 on TAAR1 expression in different breast cancer cells and to assess its influence on the viability and migration of breast cancer cell lines.
Methods
Cell culturing and stimulation
Ductal breast cancer cell lines MCF7 and T47D (both ECACC, Salisbury, UK) were used for the experiments. The cells were cultured in DMEM (3.7 g/L NaHCO3, 4.5 g/L d-glucose, 1.028 g/L stable glutamine, and Na-pyruvate; Biochrom, Berlin, Germany) adding 10% heat-inactivated fetal calf serum (FCS; Biochrom) to the medium, and the solution was incubated at an atmospheric CO2 concentration of 5% and at a temperature of 37°C.
For the PCR and Western blot stimulation, MCF7 and T47D cells were separately grown on sterile 12 multiwell slides at a density of 500,000 cells/mL DMEM with 10% FCS. Medium was changed after 4 hours to pure DMEM without FCS. After 16 hours, each group of cells was stimulated with 0.01 or 0.1 nM T1AM (Cayman Chemical, Ann Arbor, USA), T3 (Sigma-Aldrich Co., St Louis, MO, USA), and tetraiodothyroacetic acid (Tetrac) (Sigma-Aldrich Co.) for 2 hours in case of TaqMan® PCR experiments. For Western blot lysates, each group of cells was stimulated with 1 or 10 nM T1AM, T3, and Tetrac for 24 hours. 10 µg/mL of estradiol (Sigma-Aldrich Co.) was added to T47D cells, which were stimulated with 10 nM T1AM.
Control cells were incubated under the same conditions without stimulants.
TaqMan® Real-time PCR
The NucleoSpinRNAII (Macherey-Nagel, Düren, Germany) was used for RNA isolation of MCF7 and T47D cells. RNA samples were quantified and analyzed with the NanoPhotometer (Implen, Munich, Germany). Reverse transcription was performed using the High-Capacity cDNA reverse transcription kit (Thermo Fisher Scientific, Waltham, MA, USA) with a temperature protocol of 25°C for 10 minutes, 37°C for 2 hours, 85°C for 5 seconds, followed by final cooling at 4°C.
TaqMan® PCR took place in 96-well reaction plates holding a volume of 20 µL in each well. The mixture consisted of 1 µL of TaqMan® Gene Expression Assay 20× (Thermo Fisher Scientific), 10 µL of TaqMan® Universal PCR Master Mix 2× (Thermo Fisher Scientific), 8 µL of H2O (containing 0.1% diethylpyrocarbonate (DEPC)-treated distilled water; Sigma-Aldrich Co.), and 1 µL of RNA sample. For the PCR assay, ABI Prism 7500 Fast (Thermo Fisher Scientific) was used with the thermal cycling conditions of 20 seconds at 95°C, followed by 40 cycles of amplification with 3 seconds at 95°C and 30 seconds at 60°C. The 2−ΔΔCT method was used for quantification of the relative RNA expression applying β-actin as the housekeeping gene. Each experiment was validated three times (n=3).
Western blot
Stimulated and control cells were lysed for 30 minutes at 4°C with 200 µL buffer solution, consisting of a 1:100 dilution of protease inhibitor (Sigma-Aldrich Co.) in RIPA buffer (Sigma-Aldrich Co.). After centrifugation of the lysates with thermo centrifuge, a Bradford protein assay was performed to identify the protein amount. The proteins were separated according to their molecular weight using SDS-PAGE and transferred onto a polyvinylidenfluorid membrane (EMD Millipore, Billerica, MA, USA). The membrane was blocked for 1 hour in a receptacle consisting of 1× casein solution (Vector Laboratories, Burlingame, CA, USA), to prevent nonspecific binding of the antibodies. The primary antibodies anti-β-actin (clone AC-15, mouse IgG; Sigma-Aldrich Co.) and anti-TAAR1 (PA5-23141, rabbit IgG; Thermo Fisher Scientific) were equally rarefied in a 1× casein solution and then applied onto the membrane for 16 hours at 4°C. Afterward, the membrane with the β-actin antibody was incubated with biotinylated anti-mouse IgG antibody and ABC-AmP reagent (both VECTASTAIN ABC-AmP Kit for rabbit IgG; Vector Laboratories) and the TAAR1 antibody membrane was incubated with biotinylated anti-rabbit IgG antibody and ABC-AmP reagent (both VECTASTAIN ABC-AmP Kit for rabbit IgG; Vector Laboratories), according to the manufacturer’s protocol. Staining was performed using the 5-bromo-4-chloro-3-indolylphosphate/nitroblue tetrazolium chromogenic substrate (Vectastain ABC-AmP Kit; Vector Laboratories). Detection was performed with Bio-Rad Universal Hood II (Bio-Rad Laboratories Inc., Hercules, CA, USA), and the findings were quantified using the Quantity One Software (Bio-Rad Laboratories Inc,). Each Western blot experiment was validated nine times (n=9, three times in three lanes).
MTT assay
MCF7 and T47D cells were separately grown on sterile 98 multiwell slides at a density of 10,000 cells/mL DMEM containing 10% FCS. The medium was changed after 4 hours to pure DMEM. After 16 hours, cells were stimulated for 48 hours with 0.01, 0.1, or 10 nM T1AM. Control groups were incubated in pure DMEM or in a predilution of DMSO, in which T1AM was liquidated. After the stimulation period, the MTT reagent (Sigma-Aldrich Co.) was applied in order to specify the mitochondrial succinate-tetrazolium dehydrogenase system of the stimulated cells. After 30 minutes of incubation with MTT in the incubator, cell viability was measured with a multiwell spectrophotometer at a wavelength of 420–480 nm. Each experiment was validated three times (n=3).
Wound healing assay
MCF7 and T47D cells were grown on 48 multiwell plates at a density of 200,000 cells/mL DMEM with 10% FCS. After 4 hours, DMEM with FCS was substituted by pure DMEM and the incubation was lasted for another 20 hours until the well contained a confluent cell layer. Next, a straight line was scratched into the middle of the monolayer with a p100 pipet tip (Biozym, Hessisch Oldendorf, Germany). Afterward, the well was carefully rinsed with 1 mL of PBS to remove the debris and the well was again filled with pure DMEM. Stimulation of the cells with 10 nM T1AM followed and the control group was incubated without stimulants. The dish was placed in a culture incubator at 37°C and 5% CO2. Digital images of the scratch assays were taken exactly at 0, 24, 48, 72, and 96 hours after stimulation. The recording contained always the same area of the scratched cells. Digital images were taken until the scratch was nearly closed. The acquired images were evaluated using the ImageJ software (Laboratory for Optical and Computational Instrumentation [LOCI] of the University of Wisconsin-Madison, Madison, WI, USA; http://imagej.net/). Each experiment was validated three times (n=3).
Statistics
Data collection, processing, and analysis of statistical data were transacted with IBM SPSS Statistics for Windows, Version 22.0 (IBM Corporation, Armonk, NY, USA). A two-sided significance level of 5% was used for all statistical tests. Two sample t-tests were performed for statistical analysis of cell culture experiments. For the real-time PCR analysis, we used the 2−ΔΔCT formula to calculate relative values. The bar charts show the mean of relative expression and not the raw data. Therefore, the presentation of error bars is not applicable in this case.25
Results
Influence of T1AM, Tetrac, and T3 on TAAR1 mRNA expression in MCF7 and T47D breast cancer model cells
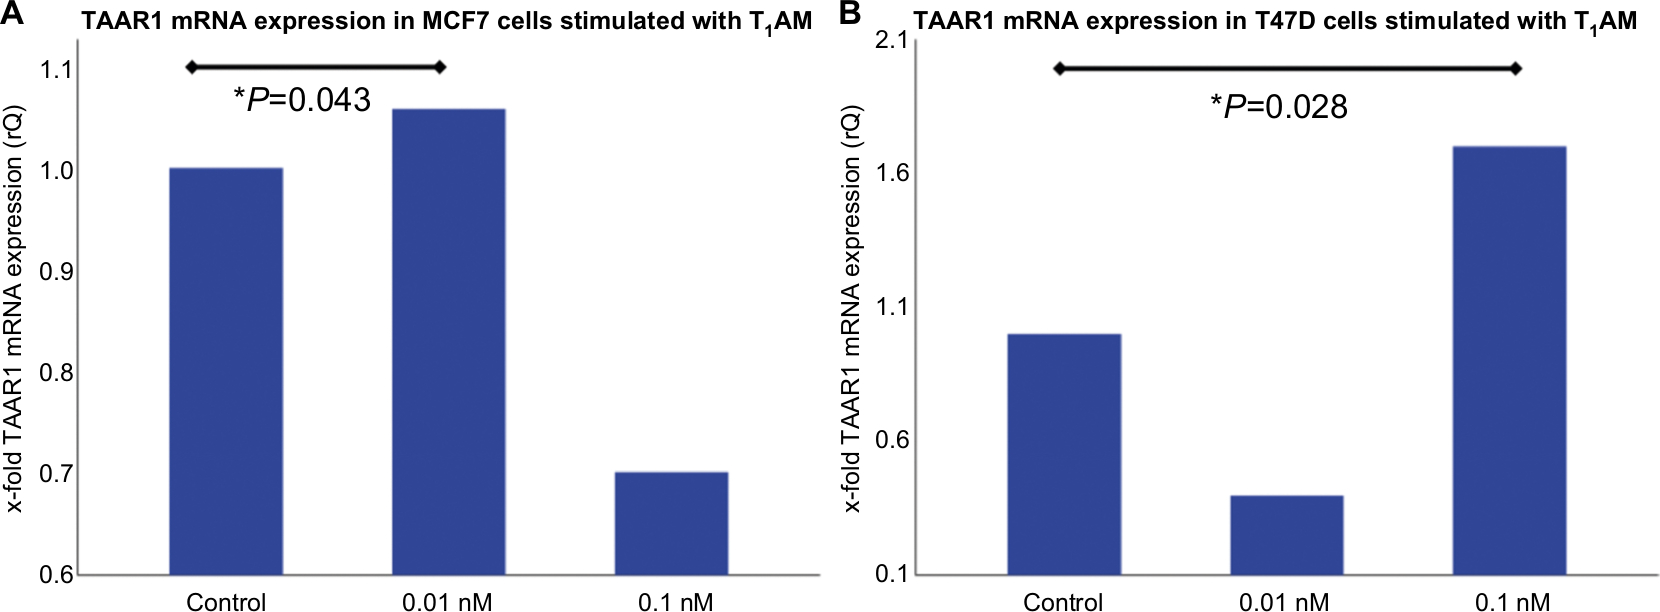
Incubation of MCF7 cells with 0.01 nM T1AM for 2 hours induced a significantly (P=0.043) increased TAAR1 mRNA expression compared to the control condition (Figure 1A). In T47D cells, 0.1 nM T1AM led to a significant (P=0.028) upregulation of TAAR1 mRNA expression after an incubation time of 2 hours (Figure 1B). The other concentrations of T1AM, which had been tested, had no significant influence on TAAR1 expression (Figure S1).
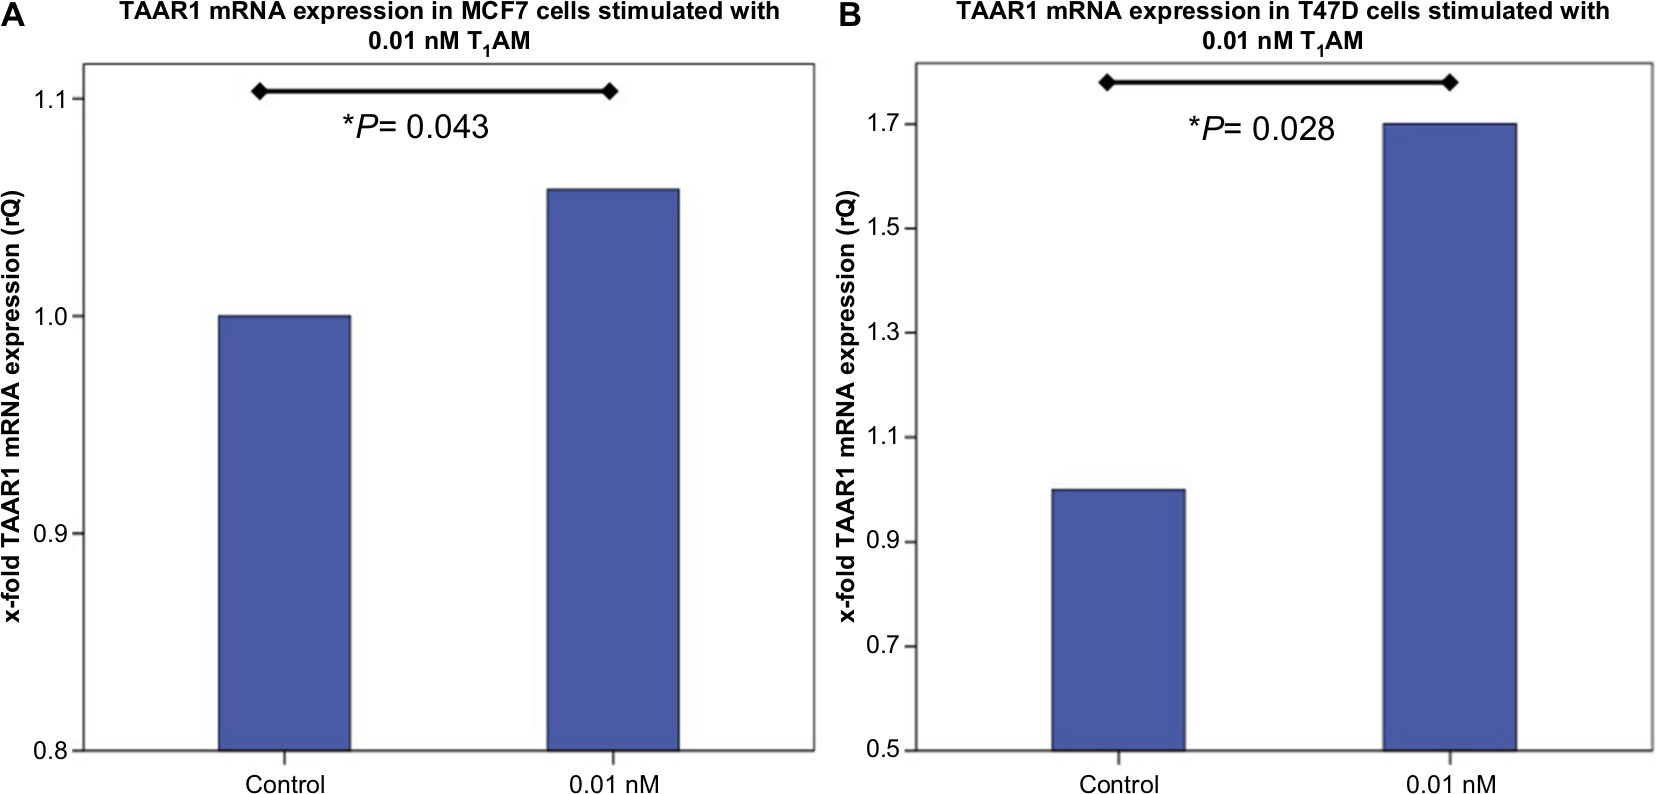 | Figure 1 TaqMan® Real-time PCR in MCF7 and T47D cells after stimulation with T1AM. Notes: (A) Bar chart as a relative representation of TAAR1 mRNA expression in MCF7 cells after incubation with T1AM for 2 hours detected via TaqMan® Real-time PCR. 0.01 nM T1AM induced a significant upregulation of TAAR1 expression (P=0.043). (B) Bar chart of TAAR1 mRNA expression in T47D cells after incubation with T1AM for 2 hours detected via TaqMan® Real-time PCR. 0.1 nM T1AM induced a significant upregulation of TAAR1 expression (P=0.028). This bar graph shows the mean of relative TAAR1 expression; therefore, the presentation of error bars is not appropriate. *P<0.05. Abbreviation: T1AM, 3-iodothyronamine. |
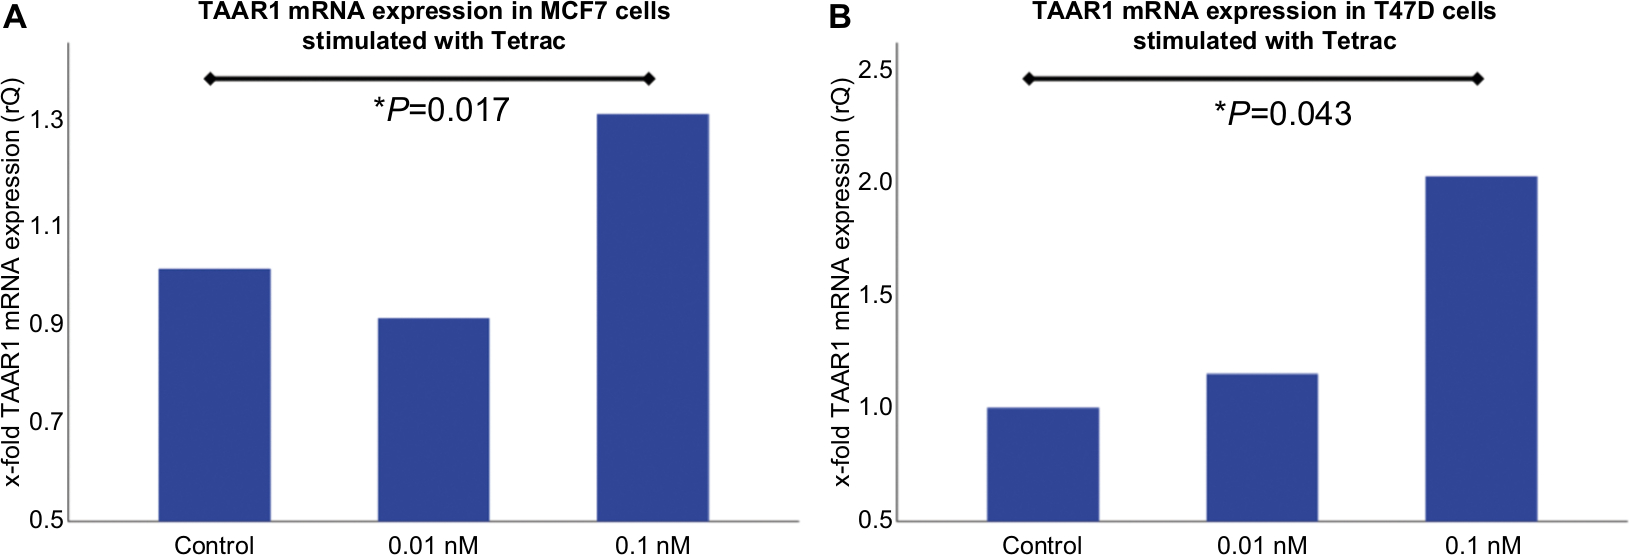
Tetrac induced a significant upregulation of TAAR1 mRNA expression in MCF7 cells (P=0.017) (Figure 2A) and in T47D (P=0.043) (Figure 2B) after an incubation time of 2 hours and at a concentration of 0.1 nM. Other tested concentrations of Tetrac had no significant influence on TAAR1 expression (Figure S2).
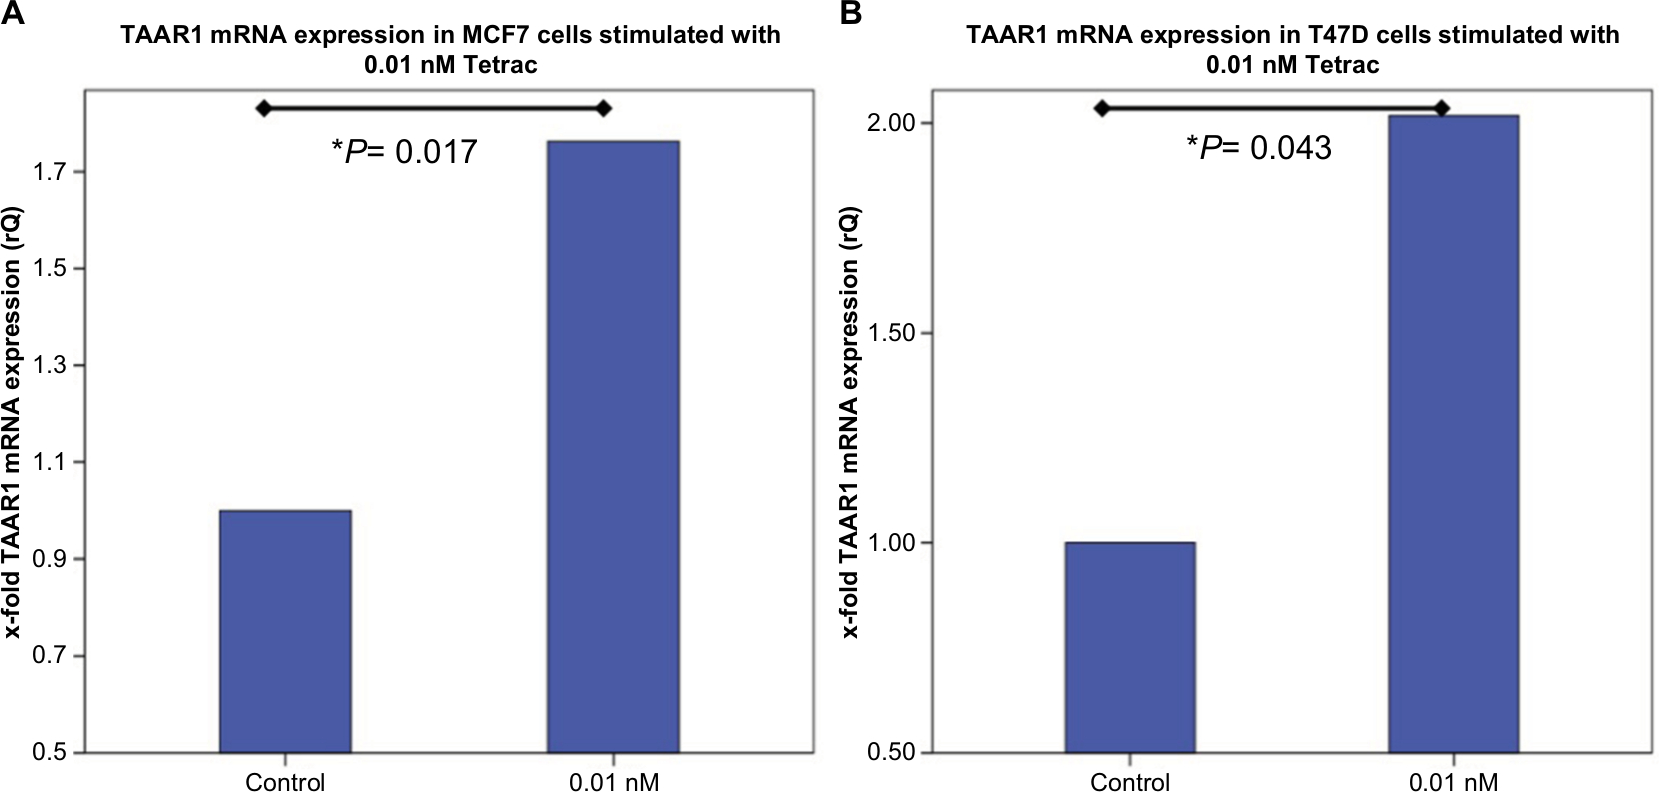 | Figure 2 TaqMan® Real-time PCR in MCF7 and T47D cells after stimulation with Tetrac. Notes: (A) Bar chart of TAAR1 mRNA expression in MCF7 cells after incubation with Tetrac detected via TaqMan® Real-time PCR. 0.1 nM Tetrac for 2 hours led to a significant increase in TAAR1 expression in MCF7 cells (P=0.017). (B) Bar chart of TAAR1 mRNA expression in T47D cells after incubation with Tetrac for 2 hours detected via TaqMan® Real-time PCR. 0.1 nM Tetrac induced a significant upregulation of TAAR1 expression (P=0.043). This bar graph shows the mean of relative TAAR1 expression; therefore, the presentation of error bars is not appropriate. *P<0.05. Abbreviation: Tetrac, tetraiodothyroacetic acid. |
Stimulation with T3 had a significant influence on TAAR1 mRNA expression neither in MCF7 cells (P=0.249 for 0.01 nM T3; P=0.345 for 0.1 nM T3) nor in T47D cells (P=0.917 for 0.01 nM T3; P=0.068 for 0.1 nM T3).
Influence of T1AM, Tetrac, and T3 on TAAR1 protein expression in MCF7 and T47D breast cancer model cells
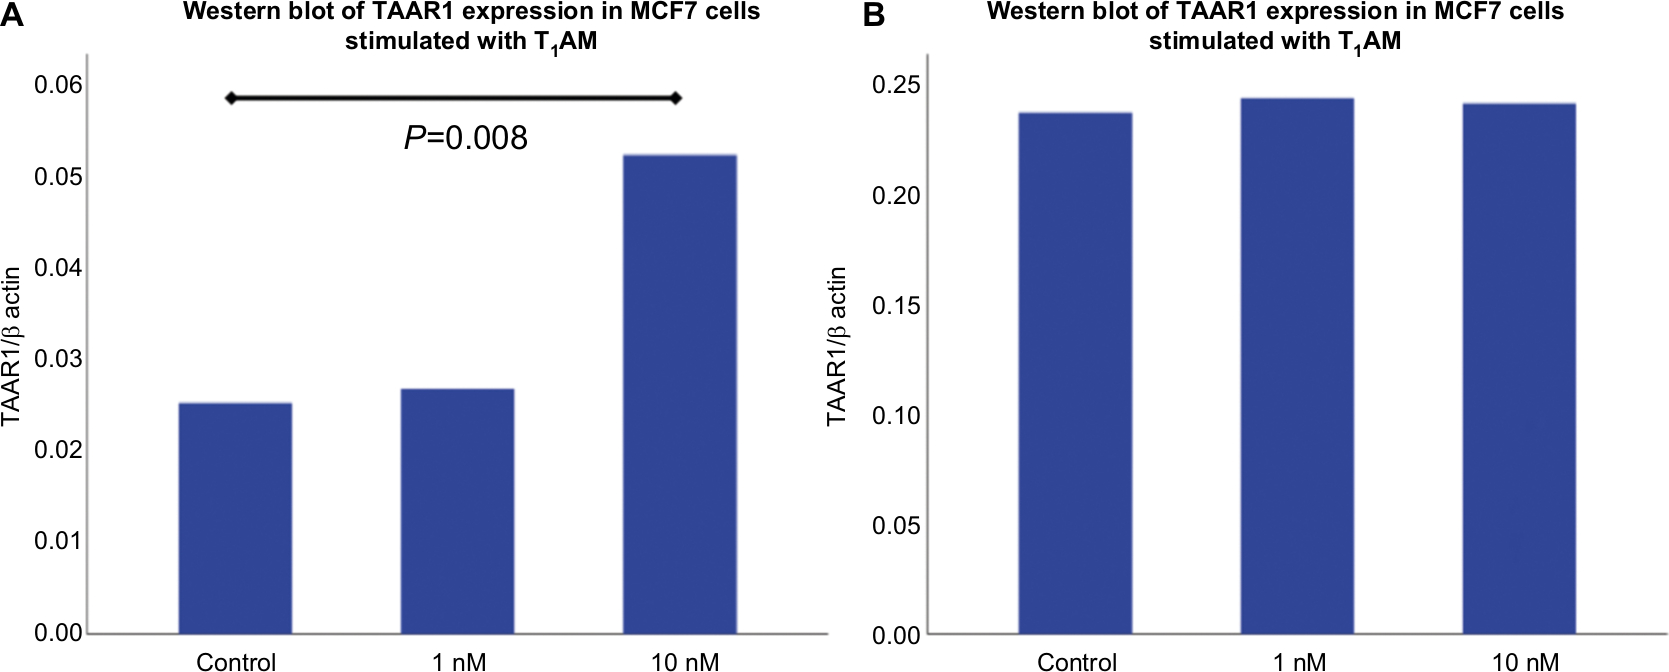
Incubation of MCF7 cells with 10 nM T1AM for 24 hours induced a significant upregulation of TAAR1 protein expression (P=0.008) (Figures 3A and 4A, B). Stimulation with 1 nM T1AM did not have a significant influence on TAAR1 expression (Figure S3). In T47D cells, no significant change in TAAR1 protein expression could be observed through the incubation with 10 nM T1AM for 24 hours (P=0.678) (Figures 3B and 4C, D).
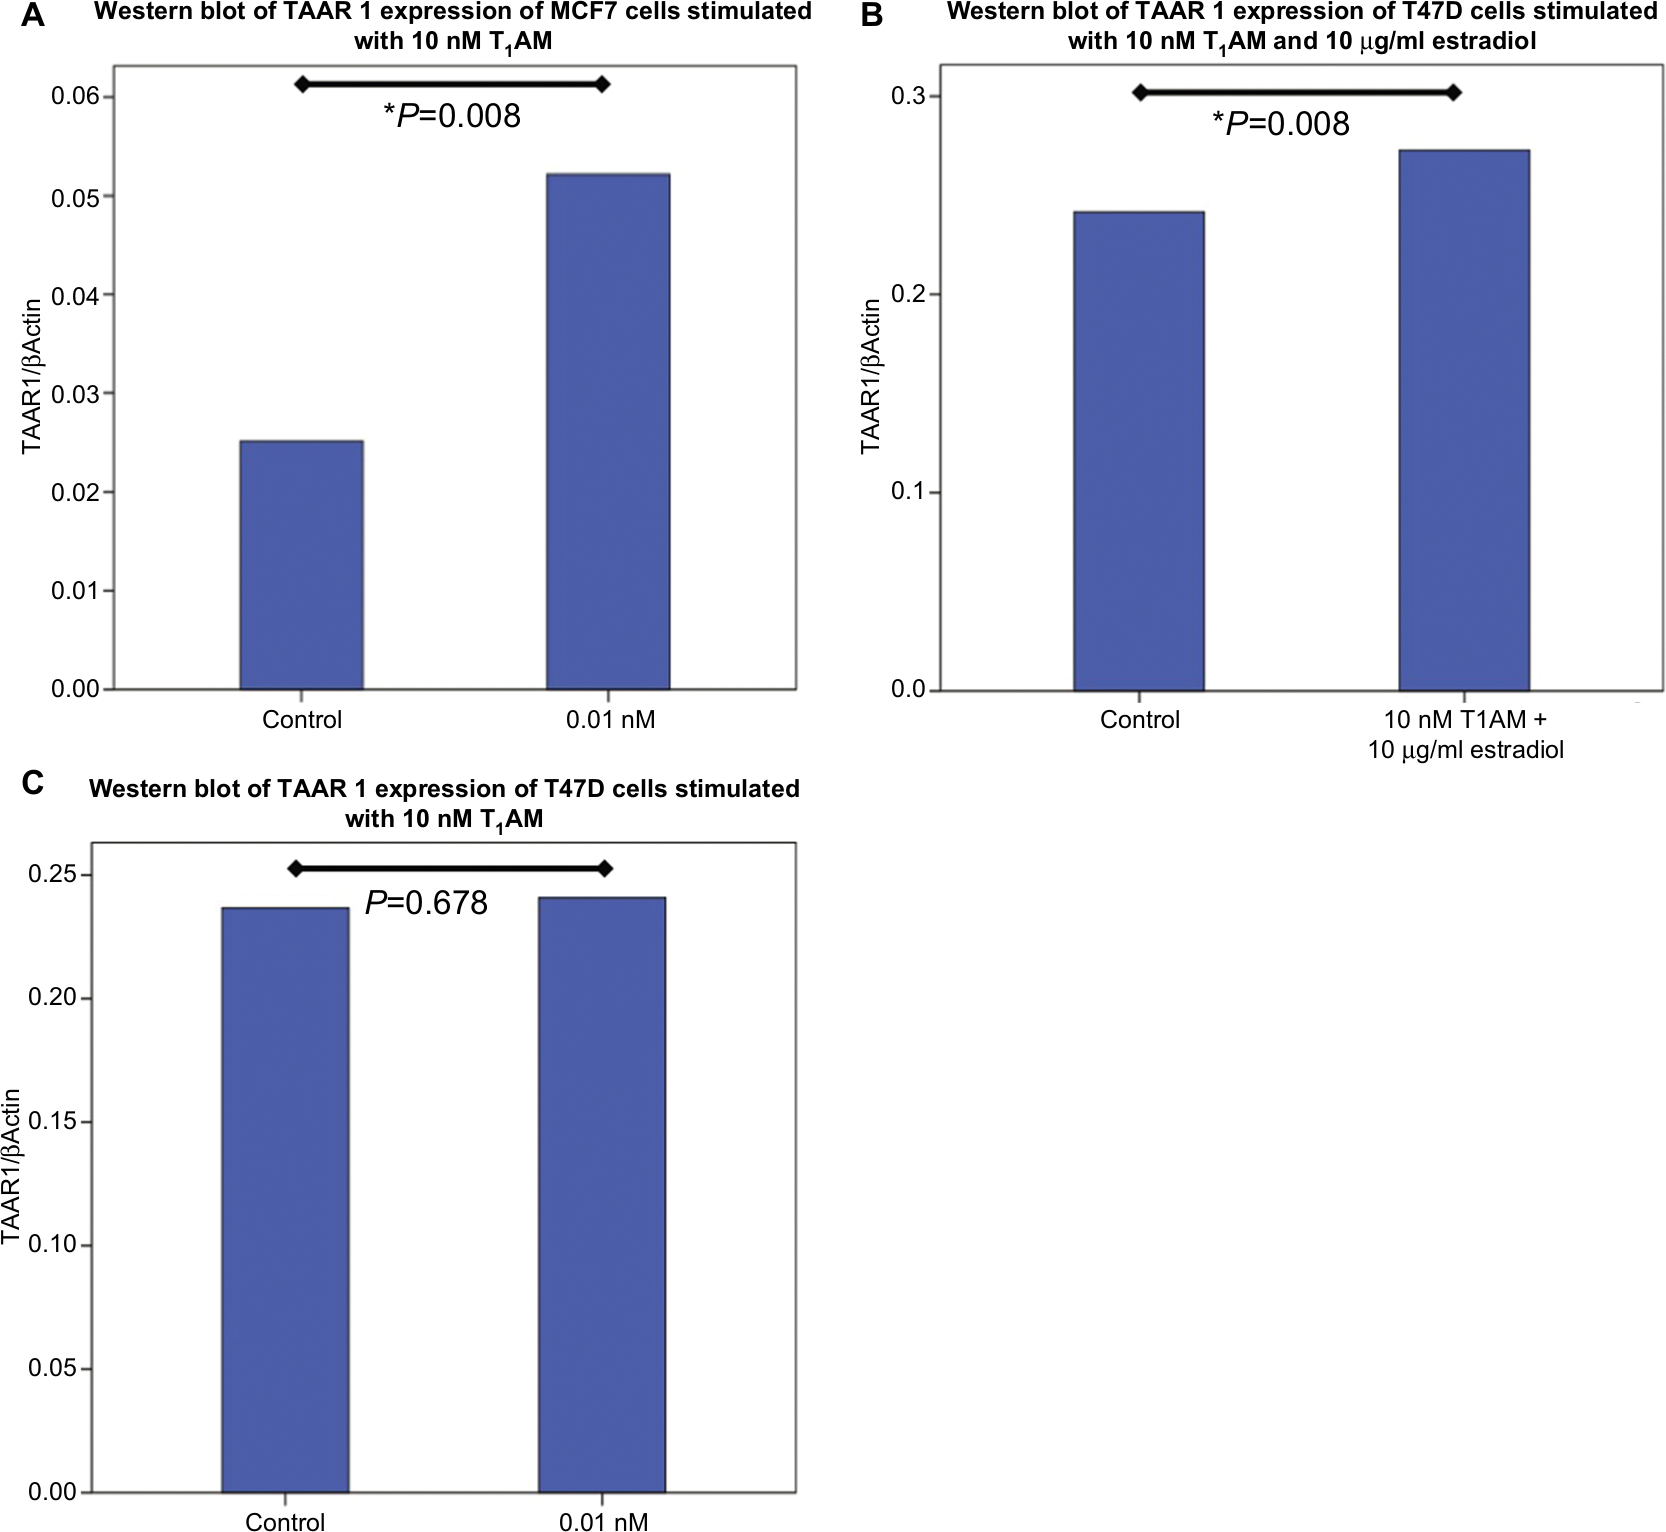 | Figure 3 Western blot analysis of TAAR1 protein expression in MCF7 and T47D cells after stimulation with T1AM. Notes: (A) Bar chart of TAAR1 expression in MCF7 cells after incubation with 10 nM T1AM for 2 hours. T1AM induced a significant upregulation of TAAR1 protein expression (P=0.008). (B) Bar chart of TAAR1 expression in T47D cells after incubation with 10 nM T1AM and 10 µg/mL estradiol for 2 hours. T1AM led to a significant increase in TAAR1 protein expression (P=0.008). (C) Bar chart of TAAR1 expression in T47D cells after incubation with 10 nM T1AM for 2 hours. No significant change in TAAR1 protein expression could be observed after stimulation with T1AM (P=0.678). This bar graph shows the mean of relative TAAR1 expression; therefore, the presentation of error bars is not appropriate. *P<0.05. Abbreviation: T1AM, 3-iodothyronamine. |
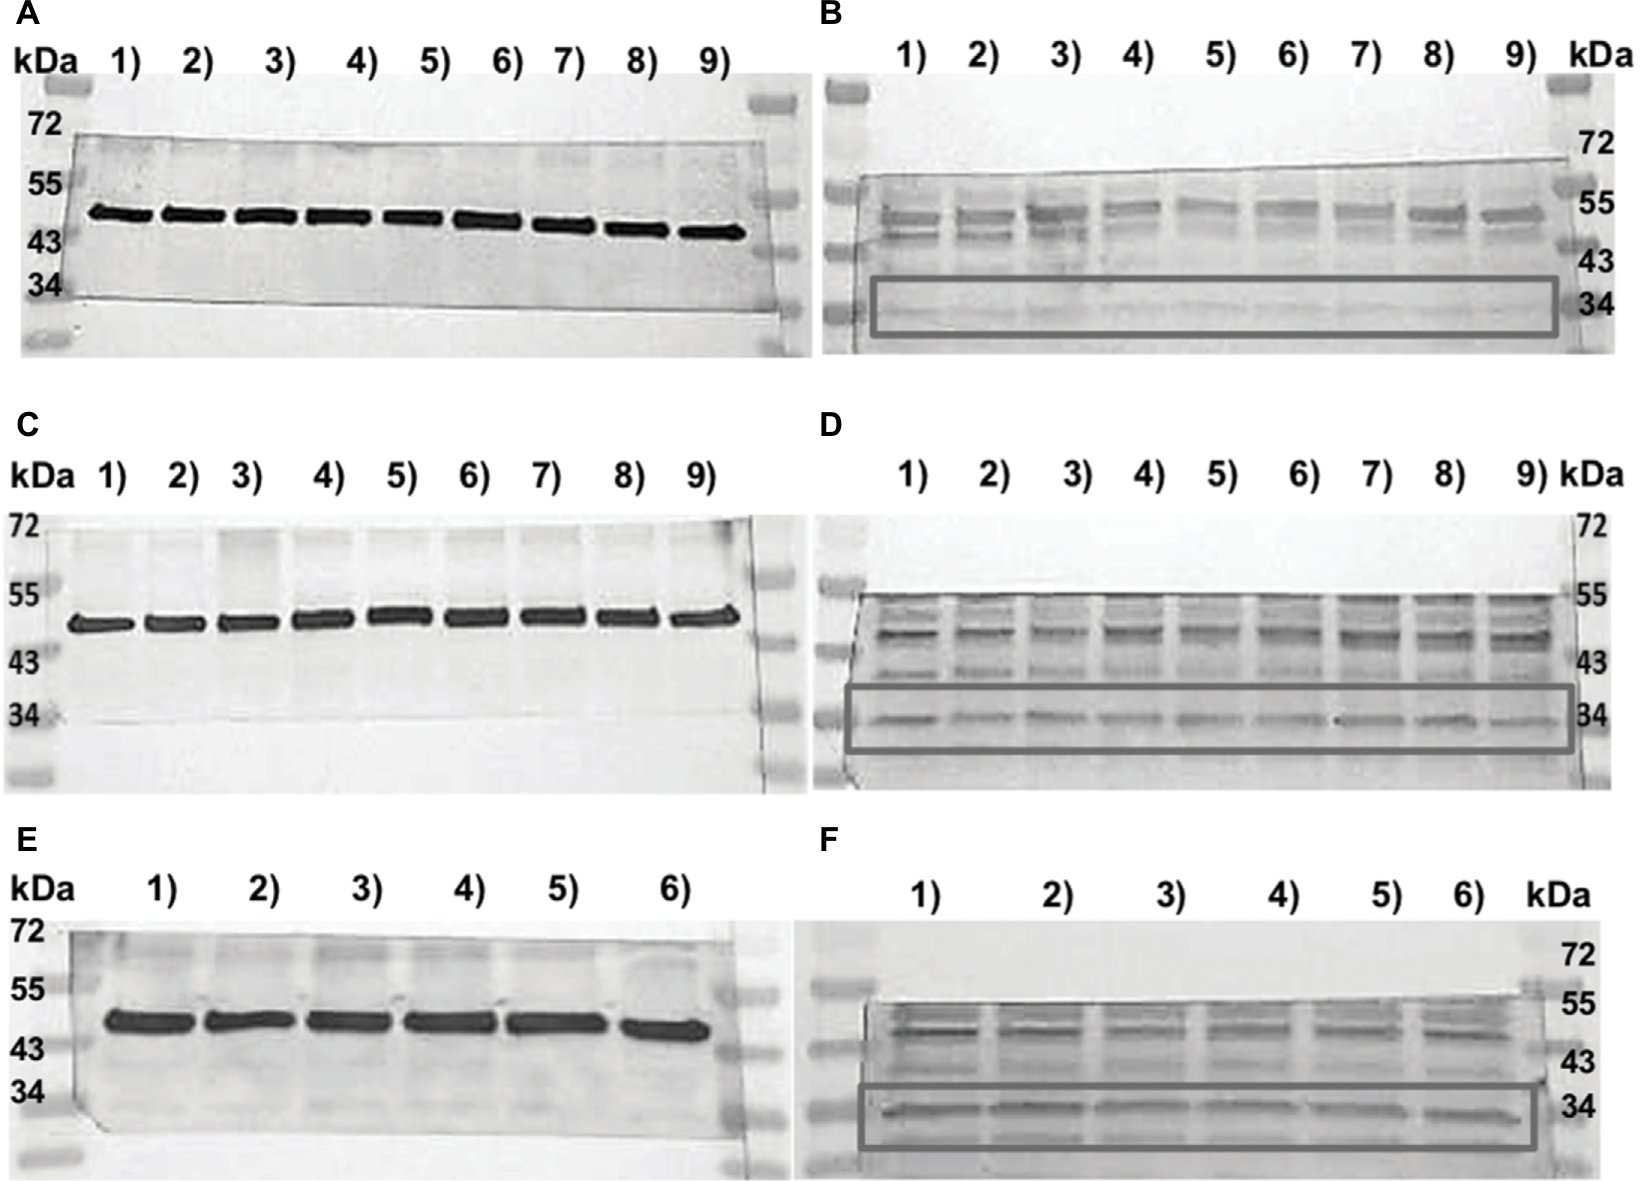 | Figure 4 Western blot analysis of TAAR1 protein expression in MCF7 and T47D cells after stimulation with T1AM. Notes: Image of Western blot membranes with standard protein ladder (Page Ruler Prestained Protein ladder; # 26616; Thermo Fisher Scientific, Waltham, MA, USA); (A, C, and E) (left) Control membrane with b-actin. (B, D, and F) (right) Membrane incubated with TAAR1. Gray boxes mark the binding region of the TAAR1 antibody according to its molecular weight. (A and B) Nine samples of MCF7 cells: MCF7 cell control groups in columns 1), 4), and 7) and MCF7 cells stimulated with 1 nM T1AM in columns 2), 5), and 8) and stimulated with 10 nM T1AM in columns 3), 6), and 9). (C and D) Nine samples of T47D cells: T47D cell control groups in columns 1), 4), and 7) and T47D cells stimulated with 1 nM T1AM in columns 2), 5), and 8) and stimulated with 10 nM T1AM in columns 3), 6), and 9). (E and F) Six samples of T47D: T47D cell control groups in columns 1), 3), and 5) and cells stimulated with 10 nM T1AM and 10 µg/mL estradiol in columns 2), 4), and 6). Abbreviation: T1AM, 3-iodothyronamine. |
The addition of 10 µg/mL of estradiol to T47D cells co-stimulated with T1AM led to a significant upregulation of TAAR1 protein expression (P=0.008) (Figures 3C and 4E, F). TAAR1 protein expression in MCF7 and T47D cells was not influenced by either T3 or Tetrac.
Viability and migration of MCF7 and T47D after stimulation with T1AM and T3
MTT test
Stimulation of both cell lines (MCF7 and T47D) with 0.1 nM T1AM for 48 hours led to a significantly decreased viability of MCF7 cells (P=0.028) in comparison to unstimulated control MCF7 cells (Figure 5A). Other tested concentrations of T1AM showed no influence.
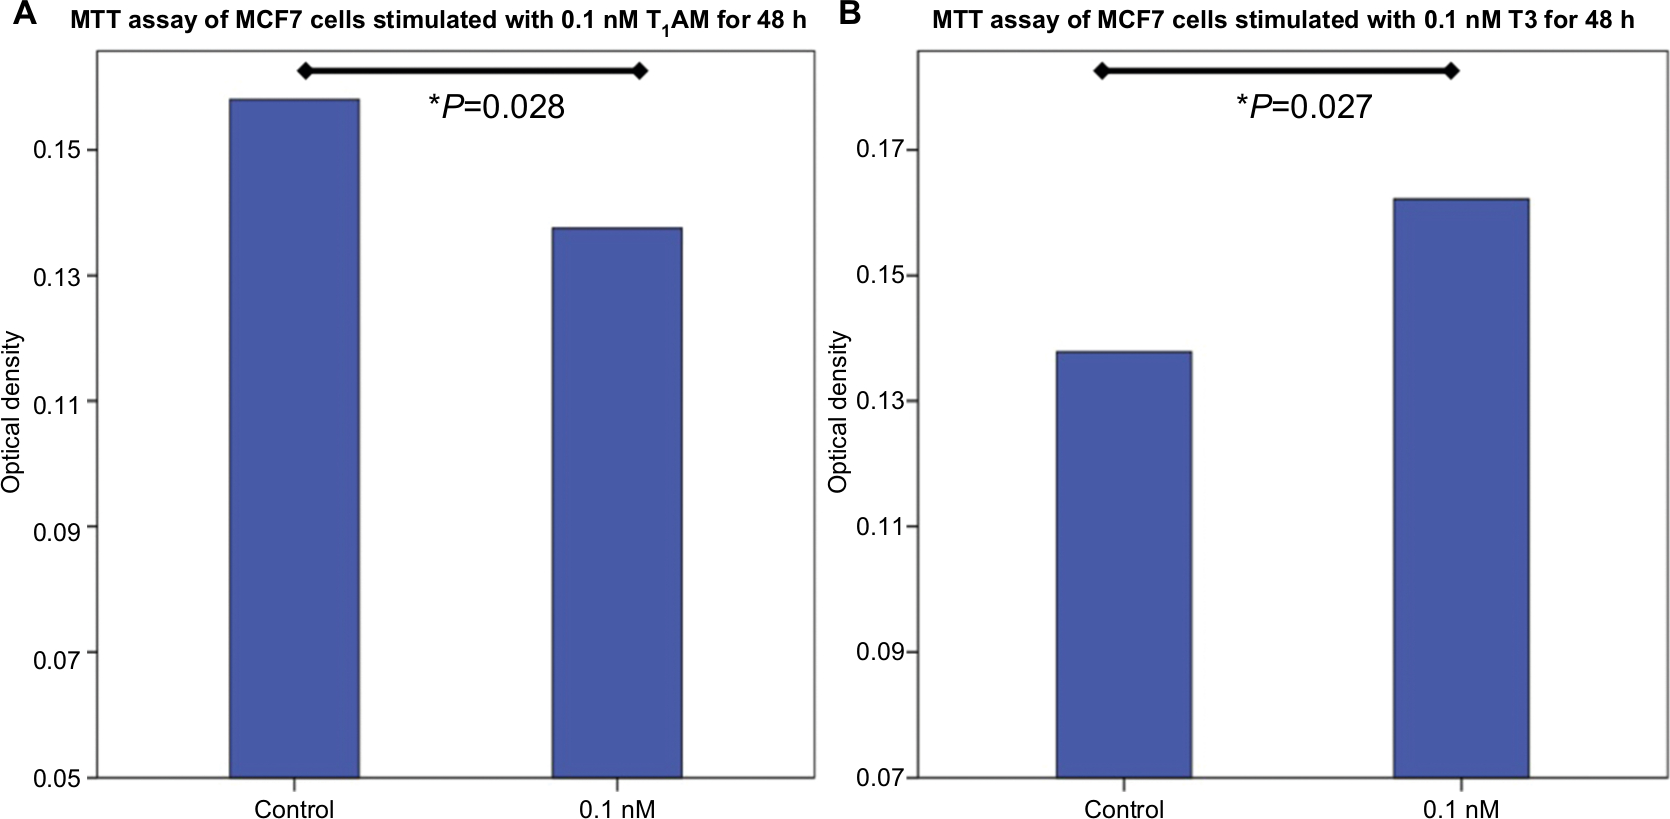 | Figure 5 MTT assay of MCF7 cells stimulated with T1AM and T3. Notes: (A) Bar chart of OD of MCF7 cells after incubation with 0.1 nM T1AM for 24 hours. T1AM induced a decrease in cell proliferation (P=0.028). (B) Bar chart of OD of MCF7 cells after incubation with 0.1 nM T3 for 24 hours. T3 induced an increase in cell proliferation (P=0.027). This bar graph shows the mean of relative OD; therefore, the presentation of error bars is not appropriate. Abbreviations: OD, optical density; T1AM, 3-iodothyronamine. |
The stimulant T3 at a concentration of 0.1 nM induced a significantly increased viability of MCF7 cells (P=0.027) (Figure 5B).
No effect of T1AM and T3 could be observed in T47D cells.
Wound healing assay
Cell migration of MCF cells was significantly reduced through incubation with 10 nM T1AM for 12 hours (P=0.004) (Figure 6A) and 24 hours (P=0.016) (Figure 6B). The scratch was closed more slowly through stimulated cells in comparison to unstimulated cells (Figure 7). T1AM had no influence on the migration of T47D cells after 24, 48, 72, or 96 hours. No effect could be observed in T47D cells.
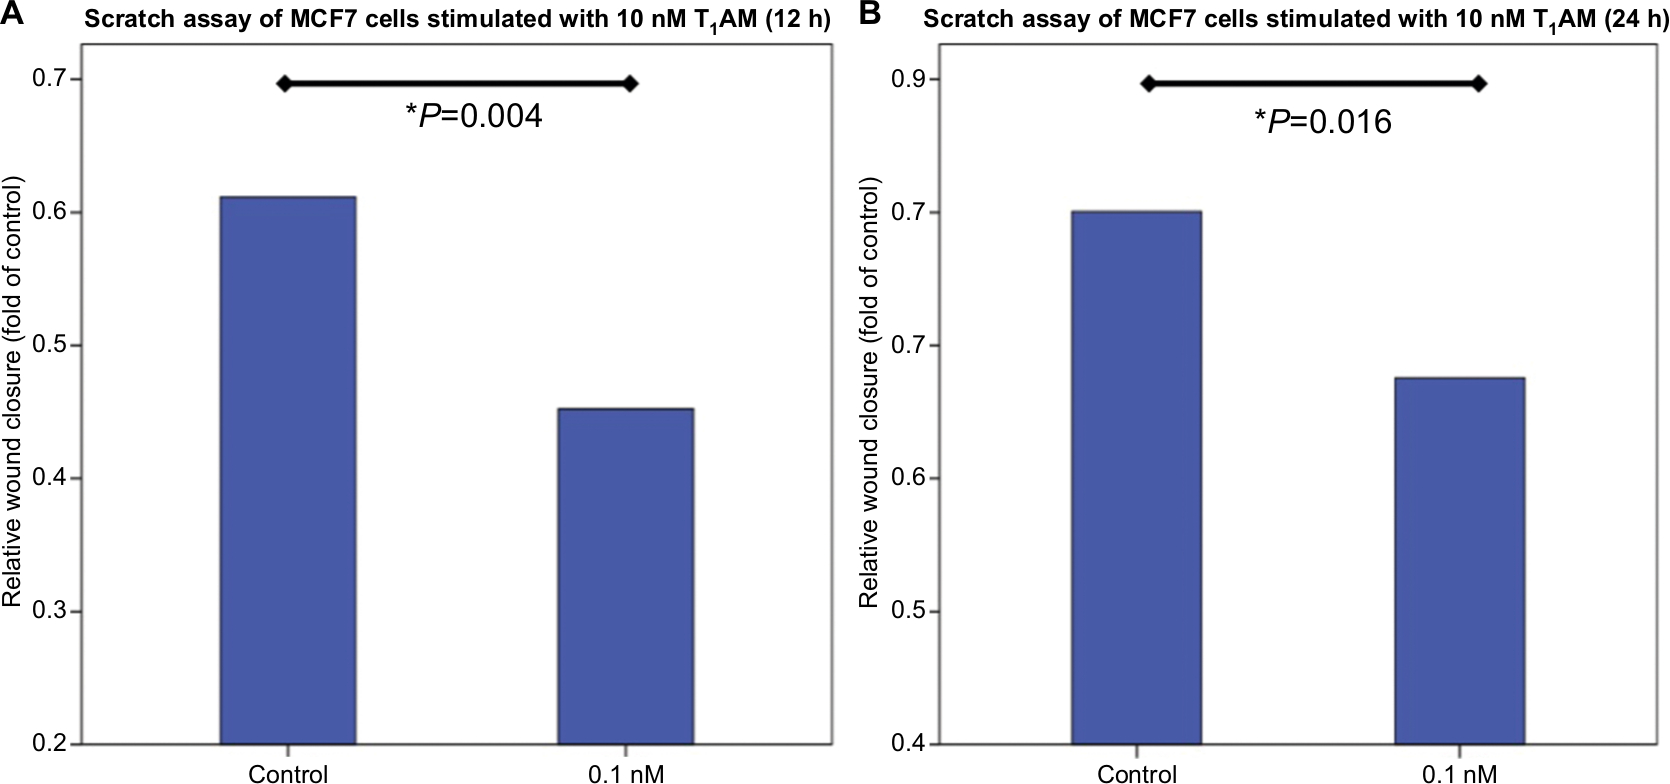 | Figure 6 Wound healing assay of MCF7 cells stimulated with T1AM. Notes: (A) Bar chart of the scratch area of MCF7 cells after incubation with 10 nM T1AM for 12 hours. T1AM induced a significant downregulation of cell migration (P=0.004) in comparison to control cells. (B) Bar chart of the scratch area of MCF7 cells after incubation with 10 nM T1AM for 24 hours. T1AM induced a significant downregulation of cell migration (P=0.016) in comparison to unstimulated control cells. This bar graph shows the mean of relative wound closure; therefore, the presentation of error bars is not appropriate. Abbreviation: T1AM, 3-iodothyronamine. |
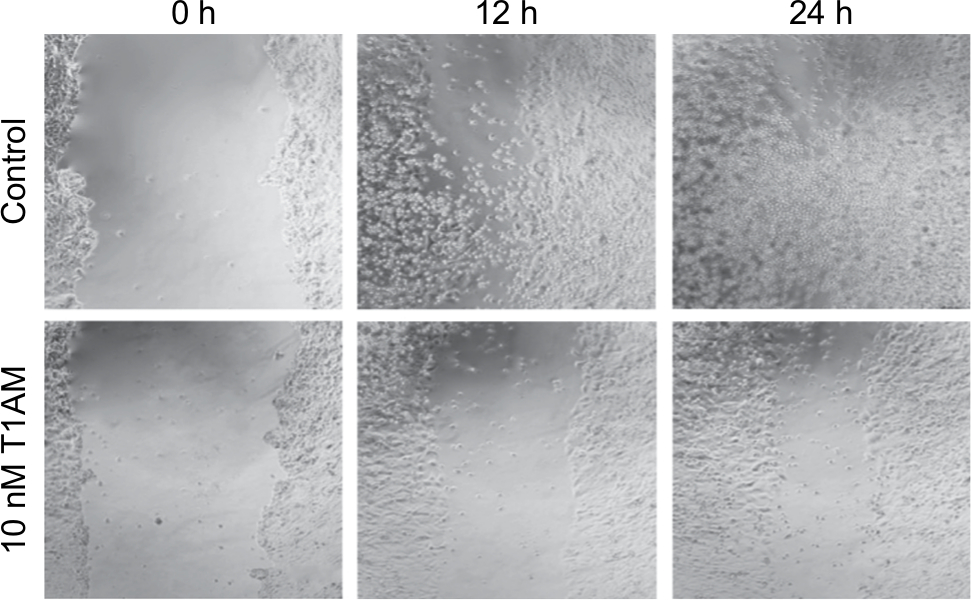 | Figure 7 Wound healing assay of MCF7 control and stimulated cells. Notes: Images show cell migration into the scratch in control and stimulated cells. Migration of MCF7 cells is significantly inhibited through incubation with 10 nM T1AM for 12 hours (P=0.004). Migration of MCF7 cells is significantly inhibited through incubation with 10 nM T1AM for 24 hours (P=0.016). Abbreviation: T1AM, 3-iodothyronamine. |
Discussion
In this study, the influence of T3 and thyronamines (T1AM) on TAAR1 expression has been analyzed in MCF-7 and T47D breast cancer cell lines. In a previous study, we found that TAAR1 overexpression (IRS ≥6) was favorably associated with OS in primary breast cancer; therefore, TAAR1 is a positive prognostic marker for OS in early breast cancer. Decarboxylation of thyroid hormones through the ODC leads to an excess of thyronamines, which presumably leads to the upregulation of TAAR1. Hence, the results of our MTT test, which detects the metabolic cell activity and showed a reduced cell viability of MCF7 cells through T1AM, are in line with our former findings as enhanced TAAR1 expression has a positive predictive effect on OS in breast cancer patients. Those findings are in line with recent results of Rogowski et al (2017),26 who showed that incubation of MCF7 cells with T1AM resulted in a significant reduction in cell viability.
T1AM directly stimulates the G-protein-coupled membrane receptor TAAR1, which is expressed by breast cancer cells. T1AM can be synthetized from T3 through decarboxylation and deiodation, and also Tetrac can be synthesized from T3 through deamination. Therefore, there might be an indirect influence of T3 and Tetrac on the signal transduction processes stimulated by TAAR1. Therefore, the aim of our study was to find out a potential influence of T3 or Tetrac on T1AM signal transduction in breast cancer cells in vitro. Based on the results of our study, we can rule out a direct influence of T3 or Tetrac on T1AM signaling.
TAAR1 belongs to the group of G-protein-coupled receptors.20 In some cases, antibodies produced against these targets are not very immunogenic. Therefore, Berry et al (2017)24 proposed that the commercially available anti-TAAR1 antibodies are not optimal as specific antibodies for some of the experiments they had been employed in. In this study, the antibody anti-TAAR1 (PA5-23141, rabbit IgG), which has been used for cell culture experiments showed to be more specific in comparison to the monoclonal mouse IgG TAAR1 antibody (sc-514311; Santa Cruz Biotechnology Inc., Dallas, TX, USA) and the polyclonal rabbit IgG antibody (ab65633; Abcam, Cambridge, UK).
In recent years, a keen research interest could be observed for thyroid hormone derivatives in the therapy of breast cancer. Bharali et al (2013)27 examined Tetrac, a thyroid hormone analogy of l-thyroxin, conjugated to poly(lactic-co-glycolic acid) nanoparticles (T-PLGA-NPs) both in vitro and in vivo for the treatment of drug-resistant breast cancer. They showed that Tetrac T-PLGA-NPs enhanced the inhibition of tumour-cell proliferation; and in in vivo studies, treatment with either Tetrac or T-PLGA-NPs resulted in a three- to fivefold inhibition of tumour weight.27
In our investigation, we could show that T1AM has a different effect on TAAR1 expression in MCF7 compared to T47D cells. T47D cells seem to function only in comparison to MCF7 cells after estrogen supplementation. Stimulation with T1AM induced a significant upregulation of TAAR1 in MCF7 cells, whereas no impact could be observed for T1AM on TAAR1 expression in T47D cells. TAAR1 mRNA expression was significantly increased in T47D cells after additional co-stimulation with estradiol. Sex steroids, such as estrogen, regulate the growth and development of the mammary gland as well as the development of breast neoplasms.28 In vitro studies showed that stimulation with estrogen induces the proliferation of hormone-dependent breast cancer cells.24,25 T47D and MCF7 cell lines vary in their expression of progesterone receptor (PR) and estrogen receptor (ER). MCF7 cells express a higher level of ER than PR, whereas T47D cells express a higher level of PR.24,25 Estrogen in itself is able to up- or downregulate the ER. The direction of regulation depends on the interaction of the estrogen-response elements (ERE) at the DNA strand with the three available ER DNA promotors.29,30 As shown in numerous studies, estrogen leads to a downregulation of ER in MCF7 cells and to an upregulation of ER in T47D.26,27 This fact could explain the diversity of responses observed for the same stimulant in different breast cancer tumor cell lines.29 Our results verify the evidence of Zaretsky et al showing that, for T47D cells, an exogenous additional supplement of estrogen is necessary to activate the expression of proteins.26 In our case, the additional estrogen stimulation induced an upregulation of TAAR1 expression in T1AM-stimulated T47D cells.
Modulation of TAAR1 may represent a novel targeting strategy for breast cancer prevention and therapy. Hoefig et al. (2016)15 claim that one of the most important points for future thyronamine research is the development of a quantitative assay for T1AM and its derivates in blood and other body fluids to gain a better understanding of T1AM metabolism and signal transduction. Before clinical implications are being considered, the complexity of the field and the technical challenges need to be mastered.
Aims of future studies include further investigation of the functional interaction between TAAR1 and the ODC in breast cancer tissue and cells. TAAR1 may represent a novel target for the prevention and treatment of breast cancer. Further studies are required to analyze the signaling pathways of the endogenous ligands of TAAR1 and to possibly re-examine thyroid hormone signaling in breast cancer.31
Acknowledgments
In memory, we thank Sandra Schulze for her excellent technical assistance in this article. The study was funded by the Bayerische Gleichstellungsförderung grant (2016/2017) of Bavaria, Germany, and by the Foundation of the Frankfurter Allgemeinen Zeitung (FAZIT) foundation grant (2017/2018) of Germany.
Author contributions
AV, UJ, ET, and ND conceived and designed the experiments. ET, CK, and SiH performed the experiments. AV, UJ, ET, CK, SiH, and KH analyzed the data. ET, AV, UJ, and KH wrote the research article. SM, KH, SH, HH, DM, NH, RW, and ND interpreted the results and revised the manuscript. All authors contributed to data analysis, drafting and revising the article, gave final approval of the version to be published, and agree to be accountable for all aspects of the work.
Disclosure
The authors report no conflicts of interest in this work.
References
Harbeck N, Gnant M. Breast cancer. Lancet. 2017;389(10074):1134–1150. | ||
Torre LA, Bray F, Siegel RL, Ferlay J, Lortet-Tieulent J, Jemal A. Global cancer statistics, 2012. CA Cancer J Clin. 2015;65(2):87–108. | ||
Ferlay J, Soerjomataram I, Dikshit R, et al. Cancer incidence and mortality worldwide: sources, methods and major patterns in GLOBOCAN 2012. Int J Cancer. 2015;136(5):E359–E386. | ||
Turken O, Narin Y, Demirbas S, et al. Breast cancer in association with thyroid disorders. Breast Cancer Res. 2003;5(5):R110–113. | ||
Rasmusson B, Feldt-Rasmussen U, Hegedüs L, Perrild H, Bech K, Høier-Madsen M. Thyroid function in patients with breast cancer. Eur J Cancer Clin Oncol. 1987;23(5):553–556. | ||
Kuijpens JL, Nyklíctek I, Louwman MW, Weetman TA, Pop VJ, Coebergh JW. Hypothyroidism might be related to breast cancer in post-menopausal women. Thyroid. 2005;15(11):1253–1259. | ||
Heublein S, Mayr D, Meindl A, et al. Thyroid Hormone Receptors Predict Prognosis in BRCA1 Associated Breast Cancer in Opposing Ways. PLoS One. 2015;10(6):e0127072. | ||
Yokoe T, Iino Y, Takei H, et al. Relationship between thyroid-pituitary function and response to therapy in patients with recurrent breast cancer. Anticancer Res. 1996;16(4A):2069–2072. | ||
Ditsch N, Liebhardt S, von Koch F, et al. Thyroid function in breast cancer patients. Anticancer Res. 2010;30(5):1713–1717. | ||
Bensenor IM, Olmos RD, Lotufo PA. Hypothyroidism in the elderly: diagnosis and management. Clin Interv Aging. 2012;7:97–111. | ||
Tosovic A, Becker C, Bondeson AG et al. Prospectively measured thyroid hormones and thyroid peroxidase antibodies in relation to breast cancer risk. Int J Cancer. 2012;131(9):2126–33. | ||
Parle JV, Franklyn JA, Cross KW, Jones SC, Sheppard MC. Prevalence and follow-up of abnormal thyrotrophin (TSH) concentrations in the elderly in the United Kingdom. Clin Endocrinol. 1991;34(1):77–83. | ||
Gietka-Czernel M. The thyroid gland in postmenopausal women: physiology and diseases. Prz Menopauzalny. 2017;16(2):33–37. | ||
Harmeier A, Obermueller S, Meyer CA, et al. Trace amine-associated receptor 1 activation silences GSK3β signaling of TAAR1 and D2R heteromers. Eur Neuropsychopharmacol. 2015;25(11):2049–2061. | ||
Hoefig CS, Zucchi R, Köhrle J. Thyronamines and Derivatives: Physiological Relevance, Pharmacological Actions, and Future Research Directions. Thyroid. 2016;26(12):1656–1673. | ||
Brix K, Führer D, Biebermann H. Molecules important for thyroid hormone synthesis and action - known facts and future perspectives. Thyroid Res. 2011;4(Suppl 1):S9. | ||
Lam VM, Espinoza S, Gerasimov AS, Gainetdinov RR, Salahpour A. In-vivo pharmacology of Trace-Amine Associated Receptor 1. Eur J Pharmacol. 2015;763(Pt B):136–142. | ||
Gozal EA, O’Neill BE, Sawchuk MA, et al. Anatomical and functional evidence for trace amines as unique modulators of locomotor function in the mammalian spinal cord. Front Neural Circuits. 2014;8:134. | ||
Babusyte A, Kotthoff M, Fiedler J, Krautwurst D. Biogenic amines activate blood leukocytes via trace amine-associated receptors TAAR1 and TAAR2. J Leukoc Biol. 2013;93(3):387–394. | ||
Vattai A, Akyol E, Kuhn C, et al. Increased trace amine-associated receptor 1 (TAAR1) expression is associated with a positive survival rate in patients with breast cancer. J Cancer Res Clin Oncol. 2017;143(9):1637–1647. | ||
Scanlan TS, Suchland KL, Hart ME, et al. 3-Iodothyronamine is an endogenous and rapid-acting derivative of thyroid hormone. Nat Med. 2004;10(6):638–642. | ||
Bunzow JR, Sonders MS, Arttamangkul S, et al. Amphetamine, 3,4-methylenedioxymethamphetamine, lysergic acid diethylamide, and metabolites of the catecholamine neurotransmitters are agonists of a rat trace amine receptor. Mol Pharmacol. 2001;60(6):1181–1188. | ||
Sotnikova TD, Caron MG, Gainetdinov RR. Trace amine-associated receptors as emerging therapeutic targets. Mol Pharmacol. 2009;76(2):229–235. | ||
Berry MD, Gainetdinov RR, Hoener MC, Shahid M. Pharmacology of human trace amine-associated receptors: Therapeutic opportunities and challenges. Pharmacol Ther. 2017;180:161–180. | ||
Kolben TM, Rogatsch E, Vattai A, Hester A, et al. PPARγ Expression Is Diminished in Macrophages of Recurrent Miscarriage Placentas. Int J Mol Sci. 2018;19(7):E1872 | ||
Zaretsky JZ, Barnea I, Aylon Y, Gorivodsky M, Wreschner DH, Keydar I. MUC1 gene overexpressed in breast cancer: structure and transcriptional activity of the MUC1 promoter and role of estrogen receptor alpha (ERalpha) in regulation of the MUC1 gene expression. Mol Cancer. 2006;5:57. | ||
Bharali DJ, Yalcin M, Davis PJ, Mousa SA. Tetraiodothyroacetic acid-conjugated PLGA nanoparticles: a nanomedicine approach to treat drug-resistant breast cancer. Nanomedicine. 2013;8(12):1943–1954. | ||
King RJ. A discussion of the roles of oestrogen and progestin in human mammary carcinogenesis. J Steroid Biochem Mol Biol. 1991;39(5B):811–818. | ||
Donaghue C, Westley BR, May FE, Feb M. Selective promoter usage of the human estrogen receptor-alpha gene and its regulation by estrogen. Mol Endocrinol. 1999;13(11):1934–1950. | ||
Klinge CM. Estrogen receptor interaction with estrogen response elements. Nucleic Acids Res. 2001;29(14):2905–2919. | ||
Grandy DK. Trace amine-associated receptor 1-Family archetype or iconoclast? Pharmacol Ther. 2007;116(3):355–390. |
Supplementary materials
 | Figure S1 Real-time TaqMan® PCR in MCF7- and T47D- cells after stimulation with T1AM. Notes: (A) Bar chart as a relative representation of TAAR1 mRNA expression in MCF7 cells after incubation with T1AM for 2h detected via Real-time TaqMan® PCR. 0.01nM T1AM induced a significant upregulation of TAAR1 expression (P=0.043). 0.1nM T1AM showed no significant influence on TAAR1 expression (P=0.398). (B) Bar chart of TAAR1 mRNA expression in T47D cells after incubation with T1AM for 2h detected via Real-time TaqMan PCR. 0.1nM T1AM induced a significant upregulation of TAAR1 expression (P=0.028). 0.01nM T1AM showed no significant influence on TAAR1 expression (P=0.144). This bar graph shows the mean of relative TAAR1 expression; therefore, the presentation of error bars is not appropriate. *P<0.05. Abbreviation: T1AM, 3-iodothyronamine. |
 | Figure S2 Real-time TaqMan® PCR in MCF7- and T47D- cells after stimulation with Tetrac. Notes: (A) Bar chart of TAAR1 mRNA expression in MCF7 cells after incubation with Tetrac detected via Real-time TaqMan® PCR. 0.1nM Tetrac for 2h led to a significant increase of TAAR1 expression in MCF7 cells (P=0.017). 0.01nM Tetrac showed no significant influence on TAAR1 expression (P=0.345). (B) Bar chart of TAAR1 mRNA expression in T47D cells after incubation with Tetrac for 2h detected via Real-time TaqMan PCR. 0.1nM Tetrac induced a significant upregulation of TAAR1 expression (P=0.043). 0.01nM Tetrac showed no significant influence on TAAR1 expression (P=0.917). This bar graph shows the mean of relative TAAR1 expression; therefore, the presentation of error bars is not appropriate. *P<0.05. Abbreviation: Tetrac, tetraiodothyroacetic acid. |
 | Figure S3 Western Blot analysis of TAAR1 protein expression in MCF7 and T47D cells after stimulation with T1AM. Notes: (A) Bar chart of TAAR1 expression in MCF7 cells after incubation with 10nM T1AM for 2h. T1AM induced a significant upregulation of TAAR1 protein expression (P=0.008). 1 nM T1AM showed no significant influence on TAAR1 protein expression (P=0.767). (B) Bar chart of TAAR1 expression in T47D cells after incubation with 1nM and 10nM T1AM for 2h. No significant change in TAAR1 protein expression could be observed (1nM: P=0.441; 10nM: P=0.678). This bar graph shows the mean of relative TAAR1 expression; therefore, the presentation of error bars is not appropriate. Abbreviation: T1AM, 3-iodothyronamine. |
 © 2019 The Author(s). This work is published and licensed by Dove Medical Press Limited. The full terms of this license are available at https://www.dovepress.com/terms.php and incorporate the Creative Commons Attribution - Non Commercial (unported, v3.0) License.
By accessing the work you hereby accept the Terms. Non-commercial uses of the work are permitted without any further permission from Dove Medical Press Limited, provided the work is properly attributed. For permission for commercial use of this work, please see paragraphs 4.2 and 5 of our Terms.
© 2019 The Author(s). This work is published and licensed by Dove Medical Press Limited. The full terms of this license are available at https://www.dovepress.com/terms.php and incorporate the Creative Commons Attribution - Non Commercial (unported, v3.0) License.
By accessing the work you hereby accept the Terms. Non-commercial uses of the work are permitted without any further permission from Dove Medical Press Limited, provided the work is properly attributed. For permission for commercial use of this work, please see paragraphs 4.2 and 5 of our Terms.