")
Back to Journals » Advances and Applications in Bioinformatics and Chemistry » Volume 7
Three-dimensional quantitative structure–activity relationship and docking studies in a series of anthocyanin derivatives as cytochrome P450 3A4 inhibitors
Authors Shityakov S, Puskás I, Roewer N, Förster C, Broscheit J
Received 24 October 2013
Accepted for publication 26 November 2013
Published 25 March 2014 Volume 2014:7 Pages 11—21
DOI https://doi.org/10.2147/AABC.S56478
Checked for plagiarism Yes
Review by Single anonymous peer review
Peer reviewer comments 3
Sergey Shityakov,1 István Puskás,2 Norbert Roewer,1 Carola Förster,1 Jens Broscheit1
1Department of Anesthesia and Critical Care, University of Würzburg, Würzburg, Germany; 2CycloLab Cyclodextrin Research and Development Laboratory Ltd, Budapest, Hungary
Abstract: The cytochrome P450 (CYP)3A4 enzyme affects the metabolism of most drug-like substances, and its inhibition may influence drug safety. Modulation of CYP3A4 by flavonoids, such as anthocyanins, has been shown to inhibit the mutagenic activity of mammalian cells. Considering the previous investigations addressing CYP3A4 inhibition by these substances, we studied the three-dimensional quantitative structure–activity relationship (3D-QSAR) in a series of anthocyanin derivatives as CYP3A4 inhibitors. For the training dataset (n=12), comparative molecular field analysis (CoMFA) and comparative molecular similarity index analysis (CoMSIA) yielded crossvalidated and non-crossvalidated models with a q2 of 0.795 (0.687) and r2 of 0.962 (0.948), respectively. The models were also validated by an external test set of four compounds with r2 of 0.821 (CoMFA) and r2 of 0.812 (CoMSIA). The binding affinity modes associated with experimentally derived IC50 (half maximal inhibitory concentration) values were confirmed by molecular docking into the CYP3A4 active site with r2 of 0.66. The results obtained from this study are useful for a better understanding of the effects of anthocyanin derivatives on inhibition of carcinogen activation and cellular DNA damage.
Keywords: three-dimensional quantitative structure–activity relationship, cytochrome P450 3A4, comparative molecular field analysis, comparative molecular similarity index analysis, anthocyanin derivatives, molecular docking, carcinogen activation
Introduction
Cytochrome P450 (CYP) proteins play important roles in metabolism in many species. These enzymes are involved in the detoxification of not only endogenous molecules, but also various exogenous substances, such as biogenic amines,1 cytostatic agents,2 and steroids.3 A substantial fraction of the CYP family is CYP3A, which comprises up to 30% of the total liver CYP enzyme pool in humans.4 Moreover, its 3A4 isoenzyme is believed to be responsible for approximately 60% of metabolic drug changes.5
Notwithstanding the membrane-associated state of mammalian CYPs and difficulties in their crystallization, significant progress has been made recently in this direction by obtaining precise and detailed information about CYP structures.6–8 In addition, a number of three-dimensional quantitative structure–activity relationship (3D-QSAR) studies, including comparative molecular field analysis (CoMFA) and comparative molecular similarity index analysis (CoMSIA), have been performed on the different CYP inhibitors to predict, correlate, and interpret experimentally determined inhibition values and assess substrate selectivity.9–11 These methods are based on the assumption that the changes in inhibition activity of chemical substances are related to changes in structural properties represented by molecular fields.12
Several flavonoids have been shown to modulate the CYP system and alter the pharmacokinetics and pharmacodynamics of many commonly prescribed drug substances.13,14 These water-soluble glycosidic derivatives of flavylium salts are most prevalent in various fruit and vegetables, such as cabbage, grapes, and berries.15 It was previously reported by Dreiseitel et al that CYP3A4 inhibition by a series of anthocyanin derivatives, including their aglycones and proanthocyanidins, is achieved in a concentration-dependent manner.14 However, it was suggested by the same authors that their inhibitory potencies were adversely correlated with the number of sugar moieties responsible for a decrease in the effects of anthocyanidins on CYP3A4.14
The antimutagenic activity of anthocyanidins was earlier established by Gasiorowski et al, whose results revealed that these compounds, isolated from the fruit of Aronia melanocarpa, sufficiently inhibit the mutagenic activity of benzo(a)pyrene and 2-aminofluorene in the Ames test.16 Hence, CYP inhibition by anthocyanin compounds might be considered as antimutagenic, given that these enzymes contribute to carcinogenesis in several organs17–20 and increase DNA toxicity and damage.21
Therefore, in order to evaluate a series of anthocyanin derivatives as CYP3A4 inhibitors, two computational approaches were used in the present study, ie, 3D-QSAR and molecular docking techniques, to analyze and match experimentally derived CYP3A4 half maximal inhibitory concentration (IC50) values to their predicted ones together with the binding affinity modes. To our knowledge, this work presents the first 3D-QSAR and docking methods that might be of interest to determine the most appropriate CoMFA and CoMSIA prediction models for selective CYP inhibition and to block the mutagenic and carcinogenic activity mediated by CYP activation mechanisms.
Computational methods
The chemical formulae of 16 anthocyanin derivatives were obtained from research papers published elsewhere.14,18 The two-dimensional structures of the compounds were drawn using the MarvinSketch version 5.2 program (ChemAxon, Budapest, Hungary). After the two-dimensional sketches were converted into three-dimensional images, explicit hydrogen molecules were added and recorded in PDB (Protein Data Bank) format; 3D-QSAR modeling was done using Sybyl-X 1.1 software (Tripos International, St Louis, MO, USA). Rigid body alignment of anthocyanin derivatives was performed using a maximum common substructure by the PyMol software (Schrödinger LLC, Rockville, MD, USA)22 to build the CoMFA and CoMSIA models. CoMSIA similarity indices (AF,K) for a molecule j with atoms i at a grid point q were calculated as follows:
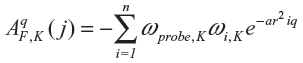
where K represents the following physicochemical properties: steric and electrostatic descriptors; ωprobe,K indicates probe atom; α is an attenuation factor; ωi,K is the actual value of the physicochemical property K of atom i; and r2iq is the mutual distance between the probe atom at grid point q, and atom i of the test molecule.
The compounds were divided into a training dataset (compounds 1–12, Figure 1) and test dataset (compounds 13–16, Figure 2) using a random selection method that is part of the Strike 1.9 module integrated in the Maestro 9.1 molecular modeling suite (Schrödinger LLC, Rockville, MD, USA). A 75% compound separation irrespective of inhibition activity or structural composition was achieved for the whole dataset. Gasteiger–Hückel charges were added before the molecular field calculations and model elaboration. Energy minimization was performed using the Tripos force-field23,24 with a distance-dependent conjugate gradient algorithm. The minimum gradient of 0.05 kcal*mol-1 was set as a convergence criterion.24 Default values were used with a 2.0 Å grid spacing using the common sp3 carbon atom hybridization with a +1 point charge as a probe to investigate the steric and electrostatic interactions at the lattice grid points. Meanwhile, a default value of 0.3 was used as the attenuation factor, and a distance-dependent Gaussian-type functional form was used between the grid point q and each atom i in the molecular structure. This setting can avoid singularities at the atomic positions and the dramatic changes of potential energy caused by the grid in surface proximity.25 The column filtering value was set to 2.0 kcal*mol-1. Statistical analysis was performed in the Sybyl-X program (Tripos International, St Louis, MO, USA) using the partial least square method. Crossvalidated (q2) and non-crossvalidated (r2) values were determined for the models using linear regression analysis with variances represented as the standard error of estimation.26 For the number of components, a consecutive default (six components) was provided in the Sybyl-X program based on the crossvalidated accuracy of the model; the resulting model q2 might be subject to overfitting by parameter selection. Therefore, we reduced this number to 5 and increased the statistical significance of the q2 (0.6) and r2 (0.8) values, which were previously considered to be statistically significant even at 0.3 for q2 and 0.7 for r2.26
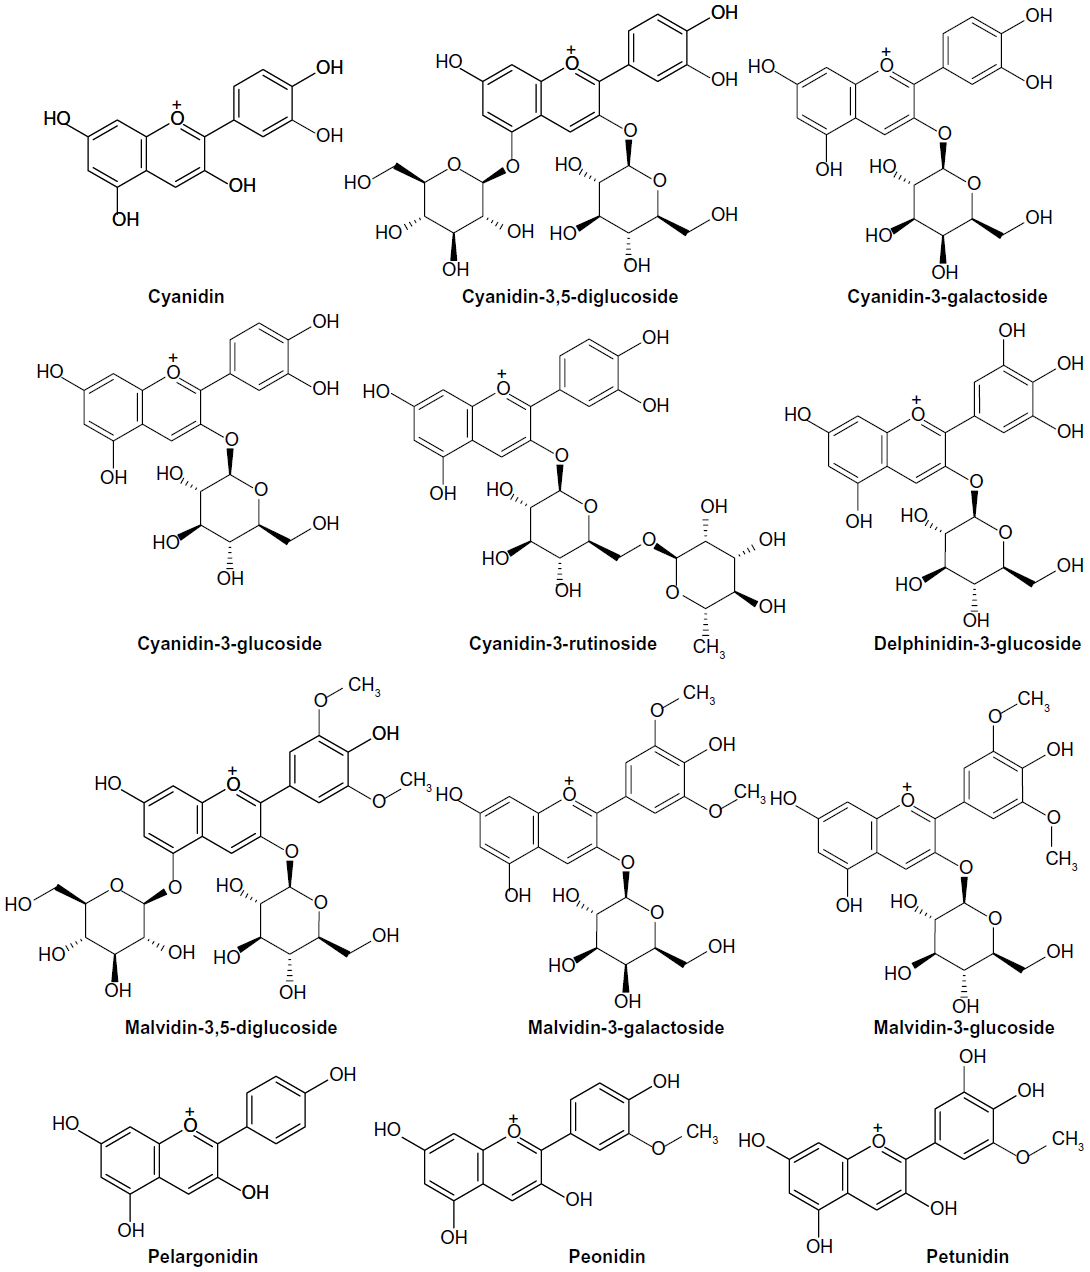 | Figure 1 Chemical structure of anthocyanin derivatives used as a training set for the three-dimensional quantitative structure–activity relationship study. |
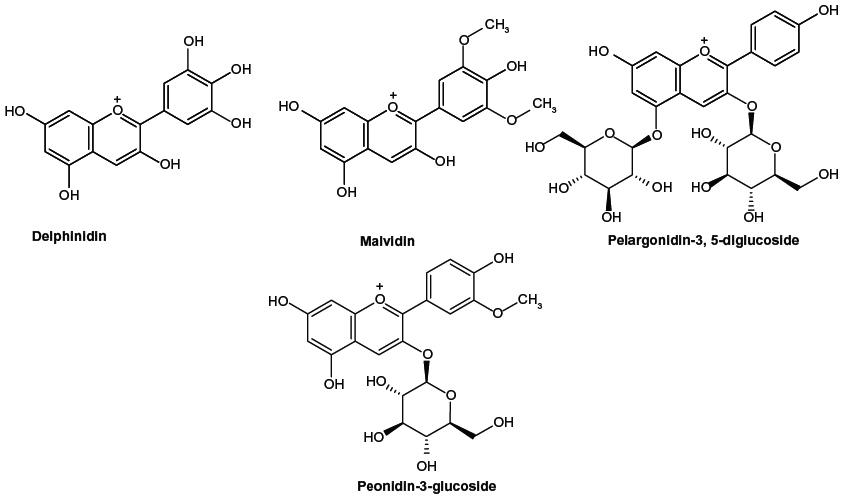 | Figure 2 Chemical structure of anthocyanin derivatives used as a test set for the three-dimensional quantitative structure–activity relationship study. |
The electron diffraction of human microsomal CYP3A4 as a holostructure (PDB ID: 1TQN) at 2.05 Å resolution with the heme cofactor was retrieved from the Protein Data Bank as a PDB file.27 Structural refinement and molecular docking studies were performed on the CYP3A4 crystal structure using DockingServer (Virtua Drug Ltd, Budapest, Hungary), which allows for the carrying out of highly efficient and robust docking calculations in one comprehensive web service.28 The ligand preparation included Gasteiger partial charges assignment and rotatable bonds definition before all nonpolar hydrogen atoms were merged. All necessary solvation parameters were added with the aid of AutoDock tools (Scripps Research Institute, San Diego, CA, USA).29 Rigid-flexible molecular docking was applied to the center of the heme-associated binding cavity using the following Cartesian coordinates: x =–15.67 Å, y =–22.49 Å, and z =–11.2 Å. The AutoDock output results represented the docking scores as Gibbs free energy of binding (ΔG) values, further converted to the predicted inhibition constants (Ki (pred)). Affinity grid maps of 20×20×20 Å grid points, and 0.375 Å spacing were generated using the AutoGrid program (Scripps Research Institute, San Diego, CA, USA).29 AutoDock parameter set-dependent and distance-dependent dielectric functions were used in the calculation of the van der Waals and electrostatic terms, respectively. Docking simulations were performed using the Lamarckian genetic algorithm and the Solis and Wets local search method.30 Initial position, orientation, and torsions of the ligand molecules were set randomly. All rotatable torsions were released during docking. Each docking experiment was derived from ten different runs that were set to terminate after a maximum of 250,000 energy evaluations while the population size was set to 150. During the search, a translational step of 0.2 Å, and quaternion and torsion steps of 5 were also applied.
The IC50 values were obtained from the study reported by Dreiseitel et al, as determined when investigating the inhibition of CYP3A4 activity in a concentration-dependent manner using a chemiluminescent assay.14 The biological data was further converted to pKi (exp) (negative decimal logarithm of experimental inhibition constant) parameters using the pIC50 value calculator31 according to the Michaelis–Menten enzyme–substrate interaction equation for noncompetitive species:32

where S is the substrate concentration and Km is the Michaelis–Menten constant. Molecular graphics and visualizations were performed using Chimera version 1.6.2 software (Resource for Biocomputing, Visualization, and Informatics, San Francisco, CA, USA). The electrostatic potential maps were calculated with DelPhi version 5.1 (Computational Biophysics and Bioinformatics, Clemson University, SC, USA) using a finite difference solution to the Poisson-Boltzmann equation.33 The interactive two-dimensional diagrams were constructed from Cartesian three-dimensional coordinates with the aid of Molecular Operating Environment 2010.10 software (Chemical Computing Group Inc., Montreal, QC, Canada). Statistical analyses were conducted using a linear regression analysis followed by graphical representation with the aid of GraphPad Prism version 4 (GraphPad Software, San Diego, CA, USA).
Results and discussion
The statistical parameters of the standard CoMFA model were constructed using rigid body alignment with all charges assigned to the molecules. To emphasize the differences between the minimal-energy conformations of anthocyanin derivatives, we aligned these compounds with the pelargonidin structure used as a common scaffold, and measured the root-mean-square deviation values. The root-mean-square deviation parameters significantly correlated in an inverse manner with the experimentally determined inhibitory constants (pKi (exp)); structural deviation decreased with an increase in compound activity and vice versa (Figure 3A–C). The most deviated substances (root-mean-square deviation >0.1 Å), such as cyanidin-3,5-diglucoside, cyanidin-3-rutinoside, cyanidin-3-galactoside, malvidin-3,5-diglucoside, and peonidin-3-glucoside, had additional sugar moieties in their structure that mainly contributed to the conformational mismatch. The sugar residues changed their spatial orientation as a result of significant conformational rearrangements caused by rotations around the ω1 (C2-C3-O-sugar) and ω2 (C6-C5-O-sugar) dihedral angles.
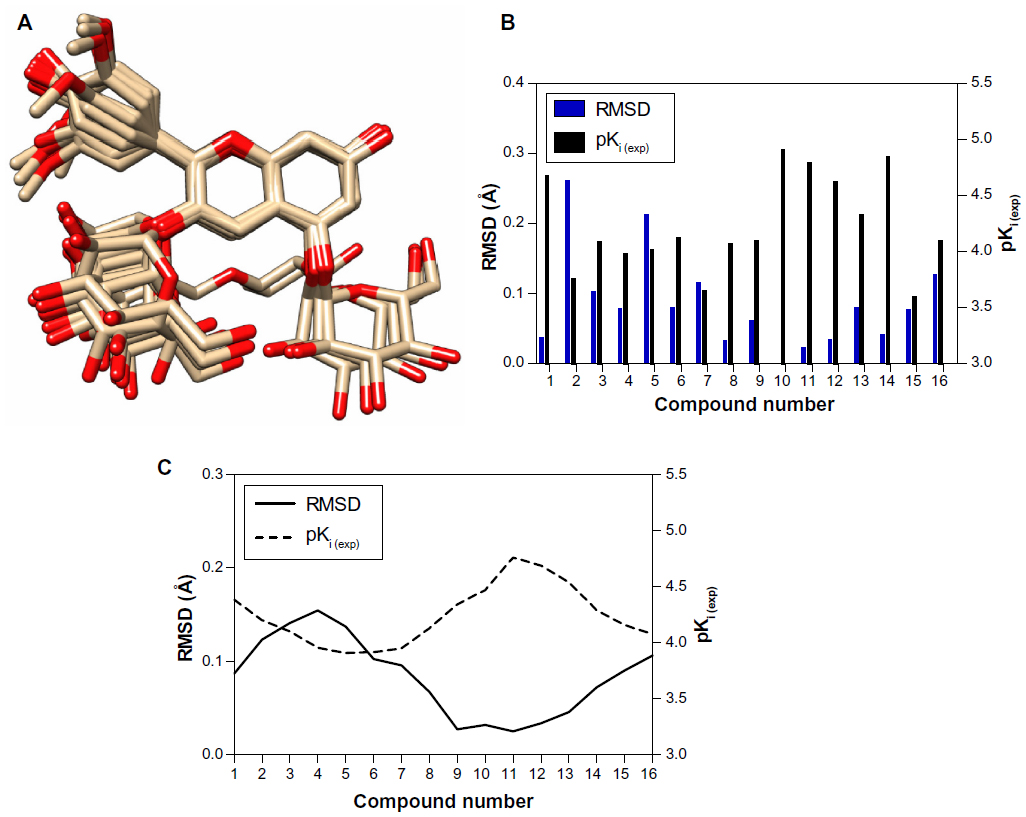 | Figure 3 (A) Rigid body alignment of the anthocyanin compounds used in this study. Hydrogen atoms are omitted for clarity. A bar chart for the compound numbers (B) and schematic data smoothing (C) were utilized to compare the values and produce a fitting curve for the RMSD and pKi (exp) comparison. |
The q2, r2, F, and standard error of estimation values were computed as defined in the Sybyl-X suite. The training set was preliminarily checked for outliers. Examination of the residuals from the crossvalidated predictions indicated that there were no outliers in the CoMFA model. According to the results from the CoMFA analysis shown in Tables 1 and 2, the crossvalidated partial least square (q2) was found to be 0.795 with five components, indicating that the CoMFA model is statistically significant and highly predictive. The non-crossvalidated regression value showed a conventional r2 of 0.962, an F of 250.8, and a standard error of estimation of 0.083 (P<0.0001), suggesting that the model could correctly predict compound activity in 96% of cases (Figure 4A). The contributions from the steric and electrostatic fields were detected to be 67% and 33%, respectively. This observation was unexpected given that the anthocyanin derivatives used to build up the CoMFA model were all positively charged. Therefore, their positive charges contribute mainly to electrostatic fields but not to the steric hindrance, which might be due to the volume restrictions associated with the narrow binding cavities.
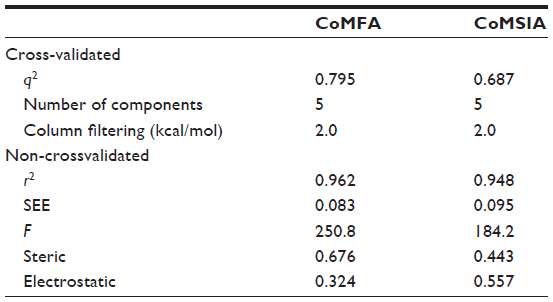 | Table 1 Results from the three-dimensional quantitative structure–activity relationship analysis for the training dataset |
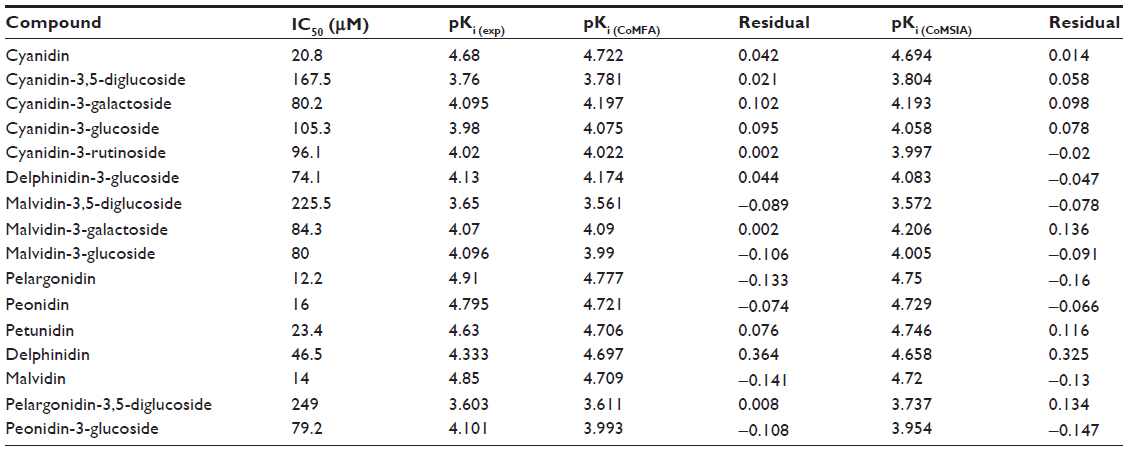 | Table 2 Predicted affinities for CoMFA and CoMSIA models of anthocyanin derivatives |
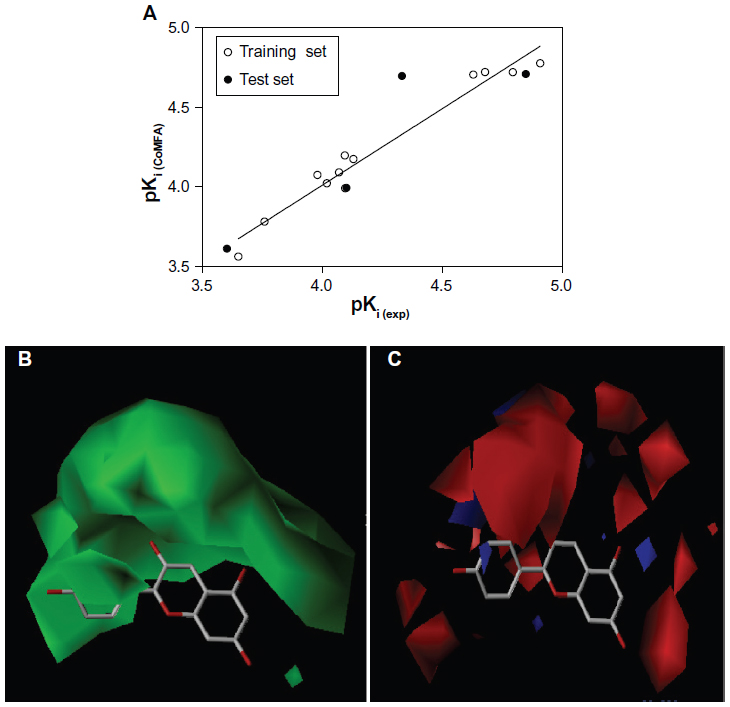 | Figure 4 (A) Predicted and experimental pKi values from the comparative molecular field analysis model correlated with each other by linear regression analysis. The comparative molecular field analysis maps are shown in respect to pelargonidin as a reference molecule. (B) Steric maps are colored in green for steric bulk areas with an increased activity. (C) Electrostatic maps are colored in blue for positively charged areas with an increased activity and red ones for negatively charged areas. Hydrogen atoms are omitted for clarity. |
In the next step, the CoMFA model was validated by the external test set of four compounds, ie, delphinidin, malvidin, pelargonidin-3,5-diglucoside, and peonidin-3-glucoside. It can be seen from Tables 2 and 3 that the CoMFA model could correctly predict the compound affinity with an r2 of 0.821, an F of 9.117, and a standard error of estimation of 0.281 (P<0.0939), suggesting that the CoMFA model could accurately predict compound activity in 82% of cases. The pelargonidin molecule as the strongest CYP3A4 inhibitor (IC50 12.2 μM) is shown in Figure 4B and C with the CoMFA steric and electrostatic maps. The green maps represent the areas where increasing bulk would likely lead to an increase in activity, while the yellow steric regions (if any) indicate areas with decreased compound activity. We observed that there is a zone of optimal steric favor that surrounds the hydroxyl groups of 4-hydroxyphenyl and chromenylium-3,5,7-triol moieties. The blue and red electrostatic maps indicate the positively and negatively charged areas with an increase and decrease in activity, respectively. Interestingly, the large red area was located at the 4-hydroxyphenyl part of the molecule, indicating only minor contribution to the inhibition effect due to its conformational flexibility. This flexibility might be explained by the phenomenon of aglycone internal rotation around the θ angle (O1-C2-C1’-C2’), which defines the coplanarity of the A, B, and C rings. In general, the maps represent a molecular state that is close to optimal for binding to the CYP3A4 protein when it was detected as IC50 in the previous experiments.14
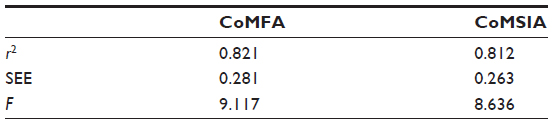 | Table 3 Results from the three-dimensional quantitative structure–activity relationship analysis for the test dataset |
The results of the CoMSIA analysis are shown in Tables 1 and 2. Similarly to the CoMFA model, we used the steric and electrostatic fields in the CoMSIA analysis. Partial least square crossvalidation showed a regression value (q2) of 0.687, which indicates a good predictive model. The optimal number of components (five) was found from previous crossvalidation analysis to build up the nonvalidated linear regression model with a high Pearson’s correlation coefficient (r2) of 0.948, an F of 184.2, and a standard error of estimation of 0.095 (P<0.0001, Figure 5A). The relative contributions from the steric and electrostatic fields were detected to be 44% and 56%, respectively. In this case, all molecular charges contributing to the electrostatic fields were dominating over the steric effect. The latter parameter was decreased as a result of the relatively large size of the CYP3A4 binding cavity that might release the steric hindrance in various sizes and shapes of ligand structures.
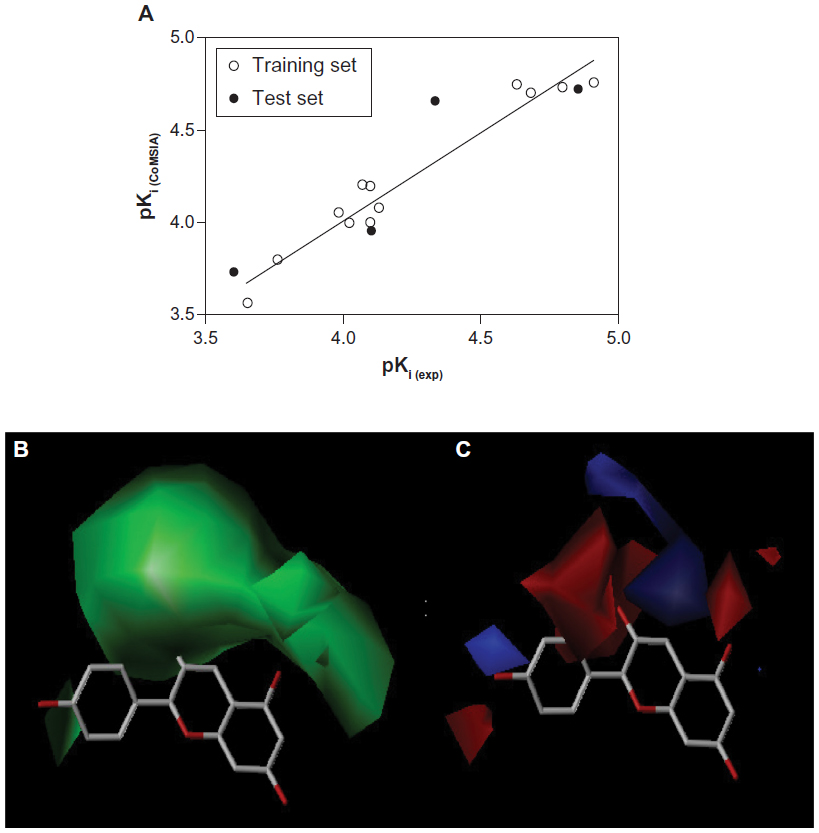 | Figure 5 (A) Predicted and experimental pKi values from the comparative molecular similarity index analysis model correlated with each other by linear regression analysis. The comparative molecular similarity index analysis maps are shown in respect to pelargonidin as a reference molecule. (B) Steric maps are colored in green for steric bulk areas with an increased activity and yellow ones, where steric bulk will likely to lead to a decrease in activity. (C) Electrostatic maps are colored in blue for positively charged areas with increased activity and red ones for negatively charged areas. Hydrogen atoms are omitted for clarity. |
It can also be seen from Tables 2 and 3 that the CoMSIA model was validated by the external test set of the same four compounds with an r2 of 0.812, an F of 8.636, and a standard error of estimation of 0.263 (P<0.0989), suggesting that the CoMSIA model could accurately predict compound activity in 81% of cases.
As compared with the CoMSIA model, the CoMFA model appeared to be more predictive, partly due to the small deviation molecular alignment and also the fact that CoMSIA relies on explicit hydrophobic and hydrogen bond donor or acceptor field descriptors.
The CoMSIA model is shown in Figure 5B and C with the pelargonidin structure used as a reference molecule. The green maps indicate areas where addition of bulky steric chemical groups would presumably impose an increase in compound activity, while the yellow ones would reverse this effect, as already observed in the previous CoMFA model. Additionally, there was an increase in positively charged areas with higher activity colored in blue in the vicinity of the hydroxyl group in the 4-hydroxyphenyl moiety and the hydroxyl group in the 3′-position of the C-ring of the flavonoid backbone.
To gain some insight into the binding characteristics of anthocyanin derivatives as CYP3A4 inhibitors, we docked them into the heme cofactor-associated binding cavity of CYP3A4. During the docking process, the protein was considered to be rigid while the ligands were flexible. The structure of CYP3A4 turned out to be much more open in the proximity of the heme ion, resulting in more uniform distribution of the cavity volume and easier ligand binding.27
Eventually, only 40% of the total binding cavity area was occupied by all docked compounds, reflecting the relatively large size of the active cavity, which is a well established characteristic of CYP3A4.6,34 Thus, this enhances simultaneous molecular occupancy, which occurs near the catalytic center of the enzyme that contributes to heterotrophic cooperativity by facilitating alternative binding modes for CYP3A4 inhibitors, as shown experimentally in many studies.35–37 However, anthocyanin derivatives occupy different binding regions within the same binding cavity (Figure 6A), with different amino acid residues involved because of their dihedral rotation and conformational mismatch.
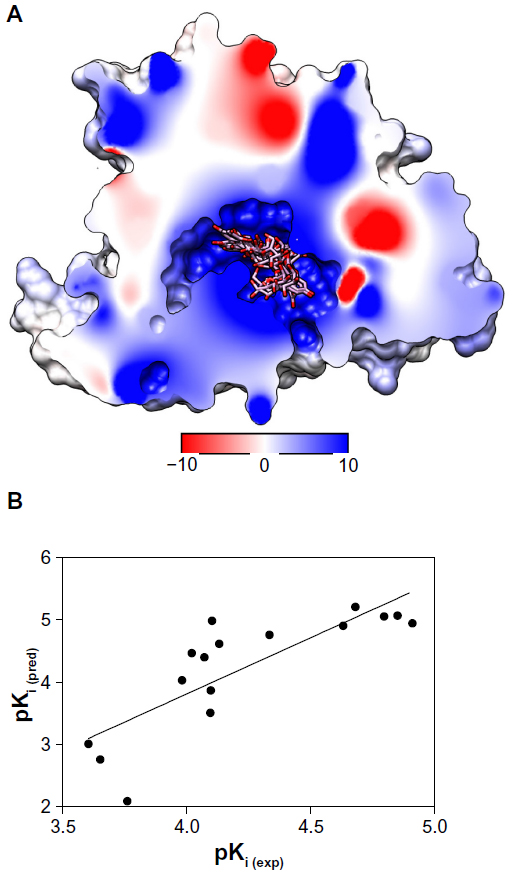 | Figure 6 (A) Rigid-flexible docking of anthocyanin derivatives into the binding site of the cytochrome P450 3A4 molecule. The molecular surface is divided by the frontal plane to visualize a binding channel of the protein structure. Red and blue colors are depicted for negative and positive electrostatic potentials; while zero potential is in white. Ligands are colored according to their atom types. Hydrogen atoms are omitted for clarity. (B) Relationship between predicted binding constants calculated from the docking studies with cytochrome P450 3A4 and experimental ones determined by a sensitive chemiluminescence assay for 16 anthocyanin derivatives. |
In order to find common similarities in the CYP3A4 ligand interaction modes for the strongest inhibitors, we selected pelargonidin as the best experimental CYP3A4 inhibitor with a pKi (exp) of 4.91 and cyanidin as the best predicted CYP3A4 binder with a pKi (pred) of 5.21. Taken together, we found that the Phe447 and Phe435 aromatic rings of CYP3A4 interact with these two molecules by establishing π-π stacking with the A ring for pelargonidin and the B ring for cyanidin (Figure 7A and B). Similarly, previous theoretical and experimental studies have elucidated the effect of π-π stacking between phenylalanine groups and aromatic rings of various CYP3A4 substrates and inhibitors.38,39 In addition, the cyanidin hydroxyl functional group at position 4 of the B ring (3,4-dihydroxyphenyl moiety) forms an H-bond with the backbone acceptor oxygen atom of Pro434, thereby contributing to an increase in binding affinity.
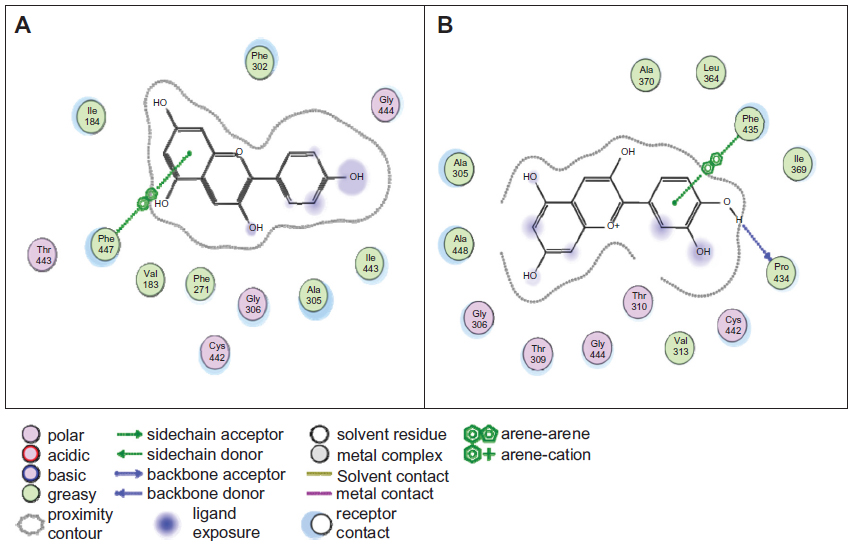 | Figure 7 Two-dimensional interaction maps showing important amino acid residues playing a role in binding of pelargonidin (A) and cyanidin (B) molecules to cytochrome P450 3A4. |
In the molecular docking procedure, a cysteine amino acid (residue number 442) presents at the binding pocket, which is a strong nucleophile and participates easily in covalent interactions with other compounds. Furthermore, there are some reports in the literature of cysteine residues in the CXXCH motif of CYP acting to form covalent thioether bonds.40,41 Therefore, there might be some opportunity for a covalent interaction to occur between the Cys442 residue and the ligands.
The next step was to explore whether or not the experimental values (Ki (exp) or pKi (exp)) can correlate with the ΔG-derived inhibition constants (Ki (pred) or pKi (pred), Table 4). The Michaelis–Menten enzyme–substrate interaction equation was applied to the inhibitory activities represented as IC50 values. Consequently, a model with r2 of 0.66 was obtained for 16 compounds (Figure 6B), which indicates that the correlation was statistically significant, for the theoretical molecular docking study, thus demonstrating the applicability of this method. This model eventually confirmed the previous observations found in our CoMFA/CoMSIA models and previously published experimental results14,42 that anthocyanin derivatives, generally occurring as 3-O-glycosides, have bioactivity attributable to the aglycone but not to the sugar moiety or other binding species.
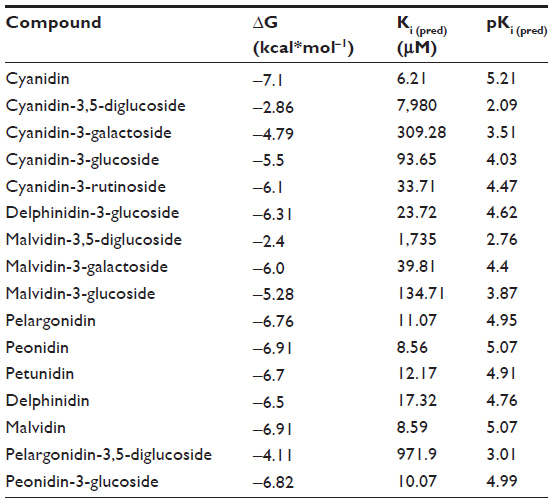 | Table 4 Predicted binding affinities for anthocyanin derivatives |
Conclusion
In this paper, we describe the development of 3D-QSAR models with CoMFA and CoMSIA methods and molecular docking procedures to explain the inhibition of anthocyanin derivatives on CYP3A4. Initial attempts at using a ligand-based method for construction of the CoMFA and CoMSIA models were based on the 16 reported anthocyanin derivatives through additions of hydroxyl groups and glycoside residues in different positions and this resulted in models with over 80% predictability. Switching to the protein-based docking method, the predicted binding energy from AutoDock provided a correlation with the experimental IC50 values of at least 66%. The π-π stackings with Phe447 and Phe435 were indicated as key interactions for the anthocyanin derivatives. The hydrogen bond interaction between Pro434 and the hydroxyl group on the cyanidin B ring was also considered to contribute to the increased binding affinity.
Overall, in the present investigation, the number of sugar residues predicted and confirmed a “structural prerequisite” for a decline in the anthocyanin inhibition effect on CYP3A4, which underscores the urgent need for more detailed analysis of the structure–activity relationship.
Finally, we emphasize the importance of structure–activity relationship models in the development of CYP inhibitors. These models could be a valuable tool in the design of drug-like molecules, which are targeted for use as inhibitors of cytochromes, which are the enzymes responsible for carcinogen activation and cellular DNA damage.
Acknowledgments
Special thanks are extended to Dr Nigel Aminake from Aachen University and Anna Poon from the City College of New York for their assistance in the writing of this paper. The authors are grateful to the Bundesministerium für Bildung und Forschung for its support of this work by providing grants (BMBF01, EO1004) to CF.
Disclosure
The authors report no conflicts of interest in this work.
References
Sánchez-Jiménez F, Ruiz-Pérez MV, Urdiales JL, Medina MA. Pharmacological potential of biogenic amine-polyamine interplay beyond neurotransmission. Br J Pharmacol. 2013;170(1):4–16. | |
Evteev VA, Shcherbak NP, Kobliakov VA. [A comparative study of induction regulation in cytochromes family 1 P450 in cell cultures at different stages of tumor transformation]. Tsitologiia. 2006;48(9):717–722. Russian. | |
Yamazaki H, Shaw PM, Guengerich FP, Shimada T. Roles of cytochromes P450 1A2 and 3A4 in the oxidation of estradiol and estrone in human liver microsomes. Chem Res Toxicol. 1998;11(6):659–665. | |
Shimada T, Yamazaki H, Mimura M, Inui Y, Guengerich FP. Interindividual variations in human liver cytochrome P-450 enzymes involved in the oxidation of drugs, carcinogens and toxic chemicals: studies with liver microsomes of 30 Japanese and 30 Caucasians. J Pharmacol Exp Ther. 1994;270(1):414–423. | |
Girennavar B, Jayaprakasha GK, Jadegoud Y, Nagana Gowda GA, Patil BS. Radical scavenging and cytochrome P450 3A4 inhibitory activity of bergaptol and geranylcoumarin from grapefruit. Bioorg Med Chem. 2007;15(11):3684–3691. | |
Ekroos M, Sjögren T. Structural basis for ligand promiscuity in cytochrome P450 3A4. Proc Natl Acad Sci U S A. 2006;103(37):13682–13687. | |
DeVore NM, Scott EE. Nicotine and 4-(methylnitrosamino)-1-(3-pyridyl)-1-butanone binding and access channel in human cytochrome P450 2A6 and 2A13 enzymes. J Biol Chem. 2012;287(32):26576–26585. | |
Zhang H, Gay SC, Shah M, et al. Potent mechanism-based inactivation of cytochrome P450 2B4 by 9-ethynylphenanthrene: implications for allosteric modulation of cytochrome P450 catalysis. Biochemistry. 2013;52(2):355–364. | |
Handa K, Nakagome I, Yamaotsu N, Gouda H, Hirono S. Three-dimensional quantitative structure-activity relationship analysis of inhibitors of human and rat cytochrome P4503A enzymes. Drug Metab Pharmacokinet. 2013;28(4):345–355. | |
Ekins S, Bravi G, Binkley S, et al. Three- and four-dimensional quantitative structure activity relationship analyses of cytochrome P-450 3A4 inhibitors. J Pharmacol Exp Ther. 1999;290(1):429–438. | |
Roy PP, Roy K. Classical and 3D-QSAR studies of cytochrome 17 inhibitor imidazole substituted biphenyls. Mol Simul. 2010;36:311–3257. | |
Giraud F, Loge C, Le Borgne M, Pagniez F, Na YM, Le Pape P. A 3D-QSAR CoMSIA study on 3-azolylmethylindoles as anti-leishmanial agents. SAR QSAR Environ Res. 2006;17(3):299–309. | |
Moon YJ, Wang X, Morris ME. Dietary flavonoids: effects on xenobiotic and carcinogen metabolism. Toxicol In Vitro. 2006;20(2):187–210. | |
Dreiseitel A, Schreier P, Oehme A, Locher S, Hajak G, Sand PG. Anthocyanins and their metabolites are weak inhibitors of cytochrome P450 3A4. Mol Nutr Food Res. 2008;52(12):1428–1433. | |
Cooke D, Steward WP, Gescher AJ, Marczylo T. Anthocyans from fruits and vegetables – does bright colour signal cancer chemopreventive activity? Eur J Cancer. 2005;41(13):1931–1940. | |
Gasiorowski K, Szyba K, Brokos B, Kołaczyńska B, Jankowiak-Włodarczyk M, Oszmiański J. Antimutagenic activity of anthocyanins isolated from Aronia melanocarpa fruits. Cancer Lett. 1997;119(1):37–46. | |
Tatemichi M, Nomura S, Ogura T, Sone H, Nagata H, Esumi H. Mutagenic activation of environmental carcinogens by microsomes of gastric mucosa with intestinal metaplasia. Cancer Res. 1999;59(16):3893–3898. | |
Bei R, Masuelli L, Turriziani M, Volti GL, Malaguarnera M, Galvano F. Impaired expression and function of signaling pathway enzymes by anthocyanins: role on cancer prevention and progression. Curr Enzym Inhib. 2009;5(4):184–197. | |
Anttila S, Raunio H, Hakkola J. Cytochrome P450-mediated pulmonary metabolism of carcinogens: regulation and cross-talk in lung carcinogenesis. Am J Respir Cell Mol Biol. 2011;44(5):583–590. | |
Mitra R, Guo Z, Milani M, et al. CYP3A4 mediates growth of estrogen receptor-positive breast cancer cells in part by inducing nuclear translocation of phospho-Stat3 through biosynthesis of (±)-14,15-epoxyeicosatrienoic acid (EET). J Biol Chem. 2011;286(20):17543–17559. | |
Voso MT, Fabiani E, D’Alo’ F, et al. Increased risk of acute myeloid leukaemia due to polymorphisms in detoxification and DNA repair enzymes. Ann Oncol. 2007;18(9):1523–1528. | |
DeLano WL. The PyMOL Molecular Graphics System. San Carlos, CA, USA: DeLano Scientific; 2002. | |
Gasteiger J, Marsili M. Iterative partial equalization of orbital electronegativity – a rapid access to atomic charges. Tetrahedron. 1980;36:3219–3228. | |
Clark M, Cramer RD, Opdenbosch NV. Validation of the general purpose Tripos 5.2 force field. J Comput Chem. 1989;10:982–1012. | |
Zaheer-ul H, Uddin R, Yuan H, Petukhov PA, Choudhary MI, Madura JD. Receptor-based modeling and 3D-QSAR for a quantitative production of the butyrylcholinesterase inhibitors based on genetic algorithm. J Chem Inf Model. 2008;48(5):1092–1103. | |
Geldenhuys WJ, Allen DD, Lockman PR. 3-D-QSAR and docking studies on the neuronal choline transporter. Bioorg Med Chem Lett. 2010;20(16):4870–4877. | |
Yano JK, Wester MR, Schoch GA, Griffin KJ, Stout CD, Johnson EF. The structure of human microsomal cytochrome P450 3A4 determined by X-ray crystallography to 2.05-A resolution. J Biol Chem. 2004; 279(37):38091–38094. | |
Bikadi Z, Hazai E. Application of the PM6 semi-empirical method to modeling proteins enhances docking accuracy of AutoDock. J Cheminform. 2009;1:15. | |
Morris GM, Goodsell DS, Halliday RS, et al. Automated docking using a Lamarckian genetic algorithm and an empirical binding free energy function. J Comput Chem. 1998;19(14):1639–1662. | |
Solis FJ, Wets RJB. Minimization by random search techniques. Mathematics of Operations Research. 1981;6(1):19–30. | |
Selvaraj C, Tripathi SK, Reddy KK, Singh SK. Tool development for prediction of pIC50 values from the IC50 values – a pIC50 value calculator. Curr Trends Biotechnol Pharm. 2011;5(2):1104–1109. | |
Huang X. Fluorescence polarization competition assay: the range of resolvable inhibitor potency is limited by the affinity of the fluorescent ligand. J Biomol Screen. 2003;8(1):34–38. | |
Rocchia W, Sridharan S, Nicholls A, Alexov E, Chiabrera A, Honig B. Rapid grid-based construction of the molecular surface and the use of induced surface charge to calculate reaction field energies: applications to the molecular systems and geometric objects. J Comput Chem. 2002;23(1):128–137. | |
Mannu J, Jenardhanan P, Mathur PP. A computational study of CYP3A4 mediated drug interaction profiles for anti-HIV drugs. J Mol Model. 2011;17(8):1847–1854. | |
He YA, Roussel F, Halpert JR. Analysis of homotropic and heterotropic cooperativity of diazepam oxidation by CYP3A4 using site-directed mutagenesis and kinetic modeling. Arch Biochem Biophys. 2003;409(1):92–101. | |
Roberts AG, Atkins WM. Energetics of heterotropic cooperativity between alpha-naphthoflavone and testosterone binding to CYP3A4. Arch Biochem Biophys. 2007;463(1):89–101. | |
Roberts AG, Yang J, Halpert JR, Nelson SD, Thummel KT, Atkins WM. The structural basis for homotropic and heterotropic cooperativity of midazolam metabolism by human cytochrome P450 3A4. Biochemistry. 2011;50(50):10804–10818. | |
Williams PA, Cosme J, Ward A, et al. Crystal structure of human cytochrome P450 2C9 with bound warfarin. Nature. 2003;424(6947):464–468. | |
Fishelovitch D, Shaik S, Wolfson HJ, Nussinov R. Theoretical characterization of substrate access/exit channels in the human cytochrome P450 3A4 enzyme: involvement of phenylalanine residues in the gating mechanism. J Phys Chem B. 2009;113(39):13018–13025. | |
Allen JW, Leach N, Ferguson SJ. The histidine of the c-type cytochrome CXXCH haem-binding motif is essential for haem attachment by the Escherichia coli cytochrome c maturation (Ccm) apparatus. Biochem J. 2005;389 Pt 2:587–592. | |
Corvest V, Murrey DA, Bernard DG, Knaff DB, Guiard B, Hamel PP. c-type cytochrome assembly in Saccharomyces cerevisiae: a key residue for apocytochrome c1/lyase interaction. Genetics. 2010;186(2):561–571. | |
Sakakibara H, Ashida H, Kanazawa K. A novel method using 8-hydroperoxy-2′-deoxyguanosine formation for evaluating antioxidative potency. Free Radic Res. 2002;36(3):307–316. |
 © 2014 The Author(s). This work is published and licensed by Dove Medical Press Limited. The full terms of this license are available at https://www.dovepress.com/terms.php and incorporate the Creative Commons Attribution - Non Commercial (unported, v3.0) License.
By accessing the work you hereby accept the Terms. Non-commercial uses of the work are permitted without any further permission from Dove Medical Press Limited, provided the work is properly attributed. For permission for commercial use of this work, please see paragraphs 4.2 and 5 of our Terms.
© 2014 The Author(s). This work is published and licensed by Dove Medical Press Limited. The full terms of this license are available at https://www.dovepress.com/terms.php and incorporate the Creative Commons Attribution - Non Commercial (unported, v3.0) License.
By accessing the work you hereby accept the Terms. Non-commercial uses of the work are permitted without any further permission from Dove Medical Press Limited, provided the work is properly attributed. For permission for commercial use of this work, please see paragraphs 4.2 and 5 of our Terms.