")
Back to Journals » Cancer Management and Research » Volume 11
Three-Dimensional CT Texture Analysis to Differentiate Colorectal Signet-Ring Cell Carcinoma and Adenocarcinoma
Authors Yue Y , Hu F, Hu T, Sun Y, Tong T, Gu Y
Received 6 October 2019
Accepted for publication 19 November 2019
Published 13 December 2019 Volume 2019:11 Pages 10445—10453
DOI https://doi.org/10.2147/CMAR.S233595
Checked for plagiarism Yes
Review by Single anonymous peer review
Peer reviewer comments 2
Editor who approved publication: Professor Rudolph Navari
Yali Yue,* Feixiang Hu,* Tingdan Hu, Yiqun Sun, Tong Tong, Yajia Gu
Department of Radiology, Fudan University Shanghai Cancer Center, Shanghai 200032, People’s Republic of China
*These authors contributed equally to this work
Correspondence: Yajia Gu; Tong Tong
Department of Radiology, Fudan University Shanghai Cancer Center, No. 270 Dongan Road, Shanghai 200032, People’s Republic of China
Tel +8618121299466
; +8617349786369
Fax +862164174774
Email [email protected]; [email protected]
Purpose: The objective of this research was to validate the diagnostic value of three-dimensional texture parameters and clinical characteristics in the differentiation of colorectal signet-ring cell carcinoma (SRCC) and adenocarcinoma (AC).
Methods: We retrospectively analyzed data from 102 patients with SRCC or AC confirmed by pathology, including 51 SRCC (from January 2015 to July 2019) and 51 AC patients (from January 2019 to July 2019). CT findings and clinical data, including age, gender, clinical symptoms, serological biomarkers, tumor size, and tumor location, were compared between SRCC and AC. CT texture features were quantified on portal phase images using three-dimensional analysis. A list of texture parameters was generated with MaZda software for the classification of tumors. The texture features, clinical data and CT findings were statistically analyzed for the discrimination ability of SRCC and AC, and the potential predictive parameters that may be used to differentiate the two groups were subsequently tested using the least absolute shrinkage and selection operator (LASSO) and logistic regression analyses. The receiver operating characteristic curve (ROC) provided a range of values for establishing the cutoff value, as well as the sensitivity and specificity of prediction for each significant variable.
Results: SRCC occurred more often in men than AC did (80.39% vs 49.02%, P < 0.01). The patients were younger in the SRCC group than in the AC group, without a statistically significant difference (55.84 vs 59.20 years, P = 0.216). There were no significant differences in the clinical symptoms, tumor size, or tumor location between the two groups (P=0.505, P=0.19, P=0.843, respectively). The elevation of serological biomarker CA724 was more common in SRCC than in AC (P< 0.001). Perc.01%3D, Perc.10%3D and s(1,0,0) SumAverg were lower in the SRCC group than in the AC group during the portal phase, with the areas under curve (AUCs) of 0.892–0.929, sensitivity of 76.5–84.3% and specificity of 88.2–96.1%. In the differentiation between SRCC and AC, the 1-NN minimal classification error (MCR) was 29.41%.
Conclusion: Three-dimensional texture parameters, including Perc.01%3D, Perc.10%3D and s(1,0,0) SumAverg, exhibited a favorable discriminatory ability to distinguish SRCC from AC.
Keywords: computed tomography, colorectal signet-ring cell carcinoma, adenocarcinoma, texture analysis, three-dimensional
Introduction
Colorectal cancer (CRC) is a major public health issue with a high prevalence of cancer-related morbidity and mortality, being the third most common malignancy worldwide.1 Most colorectal cancers represent conventional adenocarcinomas (ACs). Relatively rare pathological subtypes contain signet-ring cell carcinoma (SRCC) and mucinous adenocarcinoma (MAC). SRCC is a rare subtype of CRC, observed in approximately 1% of patients with colorectal cancer.2 SRCC presents with greater than 50% of tumor cells showing abundant intracellular mucin, resulting in the eccentric displacement of the nuclei.3 SRCC of the colorectum was reported for the first time in 1951.4 Detecting the expression of various histological subtypes has important significance in accurate diagnosis, the judgment of biological behavior, and prognosis prediction for patients with colorectal cancer. Detection of histological subtypes may be a promising approach to guide clinical management.
Compared to other histological subtypes, SRCC has been linked to a higher risk of death and poorer prognosis. SRCC tends to present with more advanced stages mainly due to its late development of clinical symptoms.5 Dismal prognosis after potentially curative surgery for colorectal SRCC remains a significant clinical problem compared with the prognosis for AC. When SRCC is clearly diagnosed, wider surgical resection and systemic preoperative radiotherapeutic treatment should be performed.6 Therefore, correctly identifying SRCC and AC is important for clinical decision-making.7
Texture analysis, a potential noninvasive imaging biomarker, is a useful technique to assess the heterogeneity in routinely acquired images. To date, texture analysis has been widely applied in many kinds of tumors, including colorectal cancer, lung cancer, hepatic metastasis of colon cancer, esophageal cancer, etc., as a promising imaging biomarker of tumor treatment response and disease prognosis.8–12 According to recently published reports, texture analysis of computed tomography (CT) was helpful for discriminating primary colon cancer from hepatic metastases and assessing survivability and chemotherapy response in patients with primary CRC.8,13
Texture analysis refers to the quantitative technique used to evaluate the characterizations of an ROI in a group of images. The proposed method is characterized by analyzing the distribution and relationship of pixel or voxel-gray levels, which may provide a measure of tumor heterogeneity.14,15
Thus far, no report on the differences in texture features between SRCC and AC has been published. Because of the poor tolerance of tumor patients, texture analysis is superior to invasive examinations such as colonoscopy and biopsy. Therefore, we aim to investigate the performance and diagnostic value of three-dimensional texture analysis in differentiating SRCC from AC on CT images.
Materials and Methods
Patient Population
We identified 102 patients with pathologically diagnosed SRCCs between January 2015 and July 2019. 21 patients were excluded due to single-phase examination or poor image quality, 17 patients were excluded because of the history of other malignancies and 13 patients with preoperative treatment were excluded. Between January 2019 and July 2019, 118 patients, who were pathologically diagnosed with ACs enrolled in this study. 17 patients with a history of other malignancies were excluded. 21 patients were excluded due to a single-phase examination or poor image quality and 19 patients were excluded due to preoperative treatment. ACs were randomly selected age-matched controls with SRCC in a 1:1ratio. Finally, 51 patients with AC and 51 patients with SRCC were included in our study. The inclusion criteria were as follows: 1) all diagnosis cases were verified by surgical resection or biopsy as AC or SRCC; 2) clinical features available; and 3) comprehensive CT data and medical history information. The following are the exclusion criteria: 1) single-phase scan or image quality does not meet the diagnostic requirements; 2) history of other malignancies within 5 years; 3) preoperative chemotherapy, radiation therapy or other local treatments. Finally, 102 patients (51 with AC and 51 with SRCC) were included in our study (Figure 1). This study was approved by the medical ethics committee of Fudan university cancer hospital. Written informed consents were obtained from patients before enrolling in the study. We also have complied with the World Medical Association Declaration of Helsinki regarding the ethical conduct of research involving human subjects.
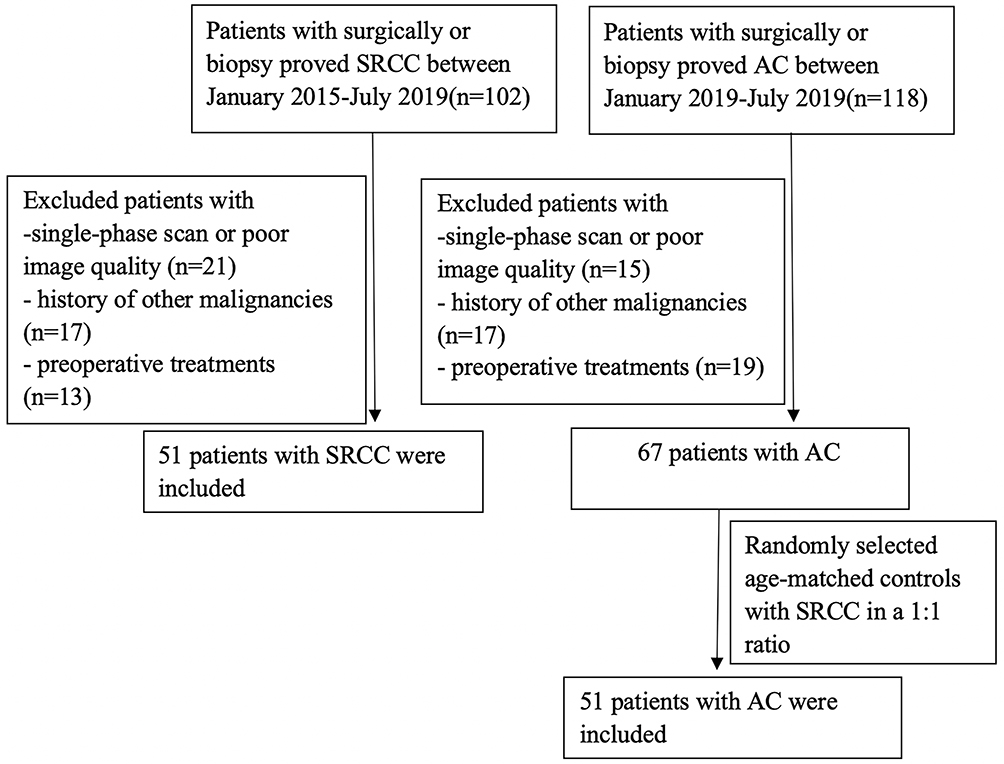 |
Figure 1 Flow diagram of patient inclusion. Abbreviations: SRCC, signet-ring cell carcinoma; AC, adenocarcinoma. |
CT Examination
Patients underwent a multidetector CT examination (Somatom Definition, Siemens, Erlangern, Germany) in a head-first supine position following a standard operating procedure. The patients fasted for 8–12 hrs prior to CT scanning. All patients received plain, arterial, and portal venous phase CT scanning. Standard acquisition settings were as follows: automatic tube current modulation 160–251 mAs; tube voltage 120 kVp; slice thickness was set to 5.0 mm; helical pitch 1; and the reconstruction slice thickness was set to 1.25 mm for diagnostic reading. Iodohydrin (300 gI/mL) was administered at a dose of 1.5 mL/kg during contrast-enhanced CT scan. A bolus-triggered technique was used to determine the scanning time, which was 30 s after the abdominal aorta reached a 100 HU triggering threshold, to perform portal venous phase axial images.
CT Image Analysis
All images were independently reviewed by two radiologists (with 3 and 13 years of clinical experience in gastrointestinal CT, respectively) who specialized in gastrointestinal imaging. Readers were blinded to the pathological findings of each case. The imaging parameters of tumor location and size were reviewed for each patient by independent radiologists on the portal venous phase images. On the multiplanar reconstruction, the size was calculated by selecting the long diameter.
CT Texture Analysis
MaZda software (Version 4.6, Instytut Elektroniki, available at http://www.eletel.p.lodz.pl/mazda/) was used to delineate morphological tumor volumes in 3D on images. Images were stored in the Picture Archiving and Communication Systems (PACS) and imported into the software for analysis. CT images of the portal venous phase of all patients were ROI selected by consensus of the two attending radiologists. ROIs were manually drawn along the outline of the lesion on each consecutive slice to contain the entire tumor volume, avoiding air, peripheral vessels, and necrotic tissue and other irrelevant components during the delineation process (Figure 2). After the tumor segmentation was completed, the VOI (volume of interest) images were imported into MaZda software for feature extraction and analysis.
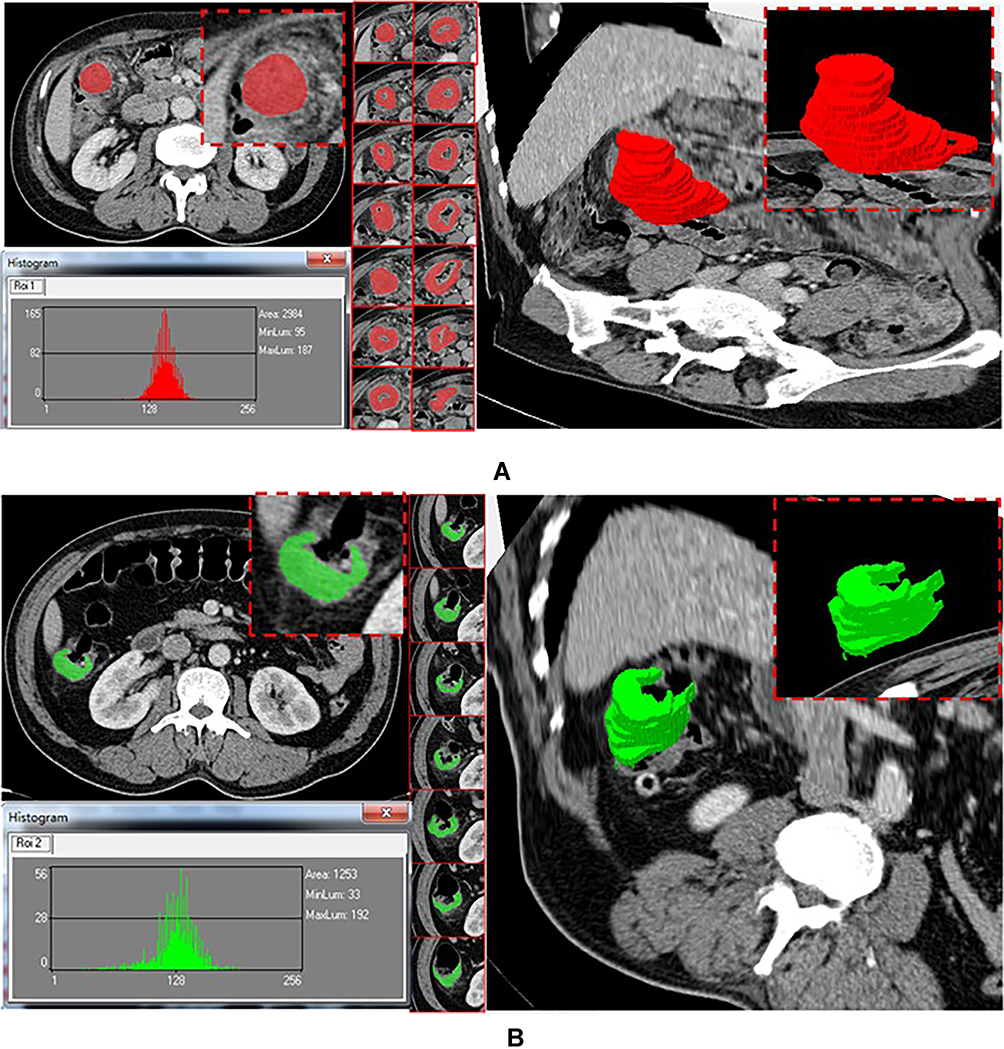 |
Figure 2 Texture analysis software program. (A) 67-year-old man, AC; (B) 59-year-old man, SRCC. |
The following aspects were the main ways to extract texture parameters: histogram (information concerning the pixel intensities rather than the spatial relationship between gray values); gradient (information regarding the intensity distribution of an image); run-length matrix (adjacent or consecutive pixels/voxels runs with the specified gray-level values in a given direction); the cooccurrence matrix (information concerning changes in the gray-level value distribution of pixel pairs with increasing distance); and autoregressive model (texture description based on statistical correlations among multiple pixels). MaZda used the following criteria: the Fisher coefficient [Fisher], combination of classification error and correlation coefficient [probability of classification error (POE) + average correlation coefficients (ACC)], mutual information and a selection of optimal feature subsets with minimal classification error (MCR) of the 1-nearest neighbor (1-NN) classifier. The first 10 texture features were chosen to constitute a feature subcategory for the subsequent discriminant in each discriminant group. Next, the linear discriminant analysis was used to identify the optimal discriminant features for classification. Based on the feature subcategory extracted formerly, the 1-nearest neighbor (1-NN) classifier analysis was used to calculate minimal classification error (MCR). MCR (%) = total number of misdiagnosed cases/total number of cases in the differential group×100%. According to MCR, the discrimination ability was divided into five grades: MCR < 10% is excellent, 10% <MCR < 20% is good, 20% <MCR < 30% is medium, 30% <MCR < 40% is general, and MCR>40% is poor.
Statistical Analysis
Mazda software can only filter the first 10 texture parameters, while the minimum absolute contraction selection operator (LASSO) algorithm can filter the most distinguishable predictive radiomics features. Single-factor logistic regression analysis was used to test the texture parameters and clinical characteristics. The potential predictive parameters to differentiate SRCC from AC were subsequently tested using multiple-factor logistic regression analysis. The diagnostic efficacy to differentiate SRCC from AC was assessed by ROC curve analysis. The data were analyzed using SPSS software (version 19, SPSS Inc., Chicago, IL, USA). Use R software (version 3.3.3; http://www.Rproject.org) for statistical analysis. P < 0.05 was considered to indicate a statistically significant difference for the two groups.
Results
The patient characteristics are listed in Table 1. The patients in the SRCC group were more likely to be men than those in the AC group (80.39% vs 49.02%, P < 0.05). The patients in the group with SRCC were younger than those with AC were, without a statistically significant difference (55.84 vs 59.20 years, P = 0.216). The clinical symptoms, tumor size and tumor location between the two groups showed no significant difference (P=0.505, P=0.19, P=0.843, respectively). The elevation of serological biomarker CA724 was more common in SRCC than in AC (P< 0.001). No differences were observed in elevated serological biomarkers, including CEA, CA199, CA125, CA50 and CA242, between the SRCC and AC groups (P>0.05).
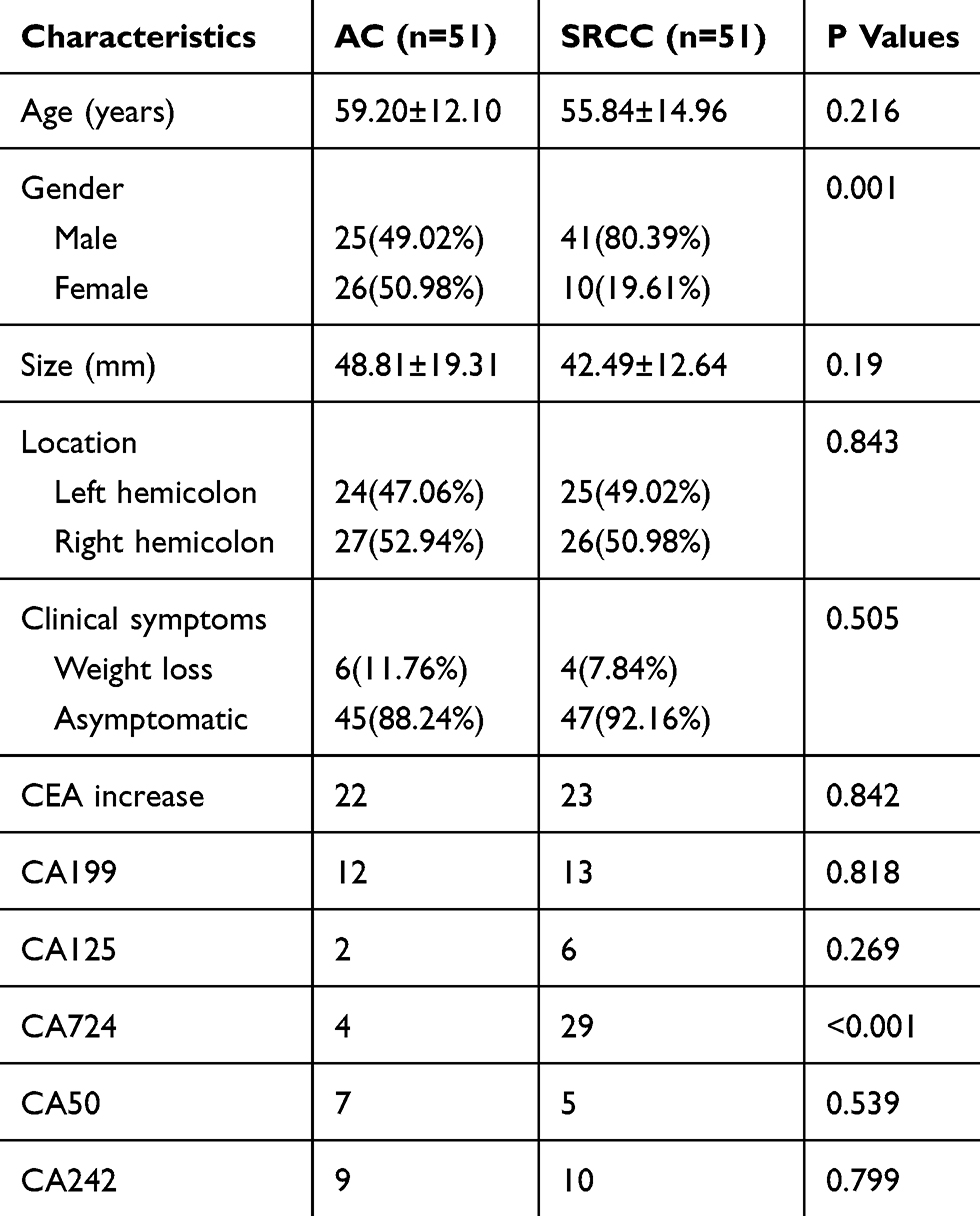 |
Table 1 Clinical Features and CT Texture of SRCC and AC |
The LASSO process is shown in Figure 3. Perc.01%3D, Perc.10%3D and s(1,0,0) SumAverg were chosen by Lasso. The chosen parameters were predominantly extracted from the histogram, gradient and cooccurrence matrix. Table 2 summarizes the area under the curve (AUC), specificity and sensitivity, and 95% confidence intervals were determined for clinical and texture features, which could be used to distinguish SRCC from AC. CT texture analysis has good sensitivity and specificity in distinguishing SRCC from AC, which ranged from 76.5% to 84.3% and from 88.2% to 96.1%, respectively. The ROC analysis results are presented in Figure 4. The AUC ranged from 0.892 to 0.929. In the differentiation between SRCC and AC, the 1-NN minimal classification error (MCR) was 29.41% (Figure 5).
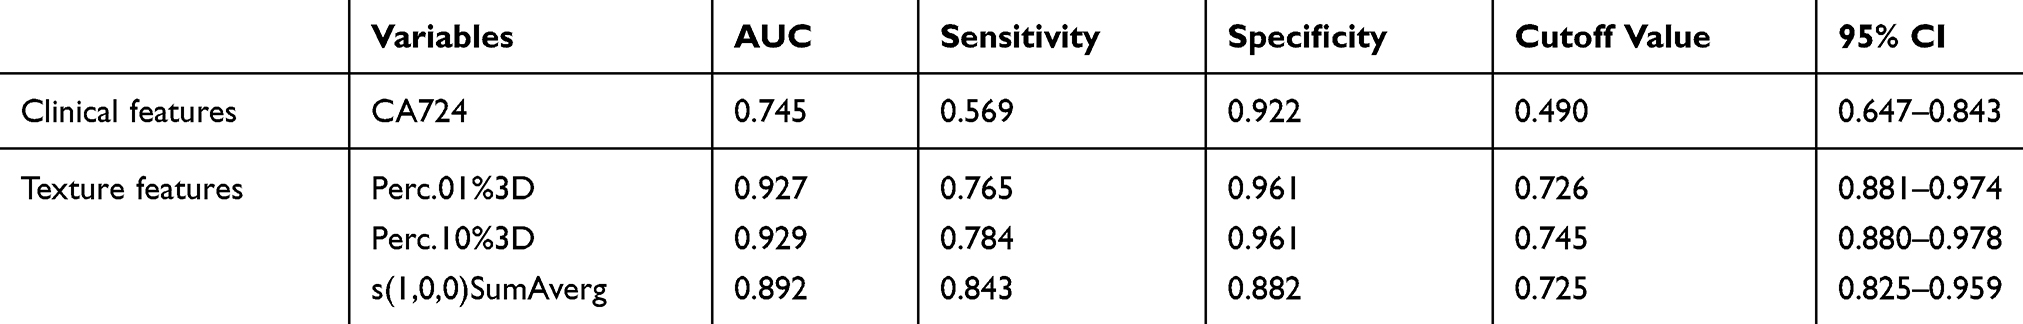 |
Table 2 Diagnostic Performance of Clinical Features and CT Texture for Differentiating SRCC from AC |
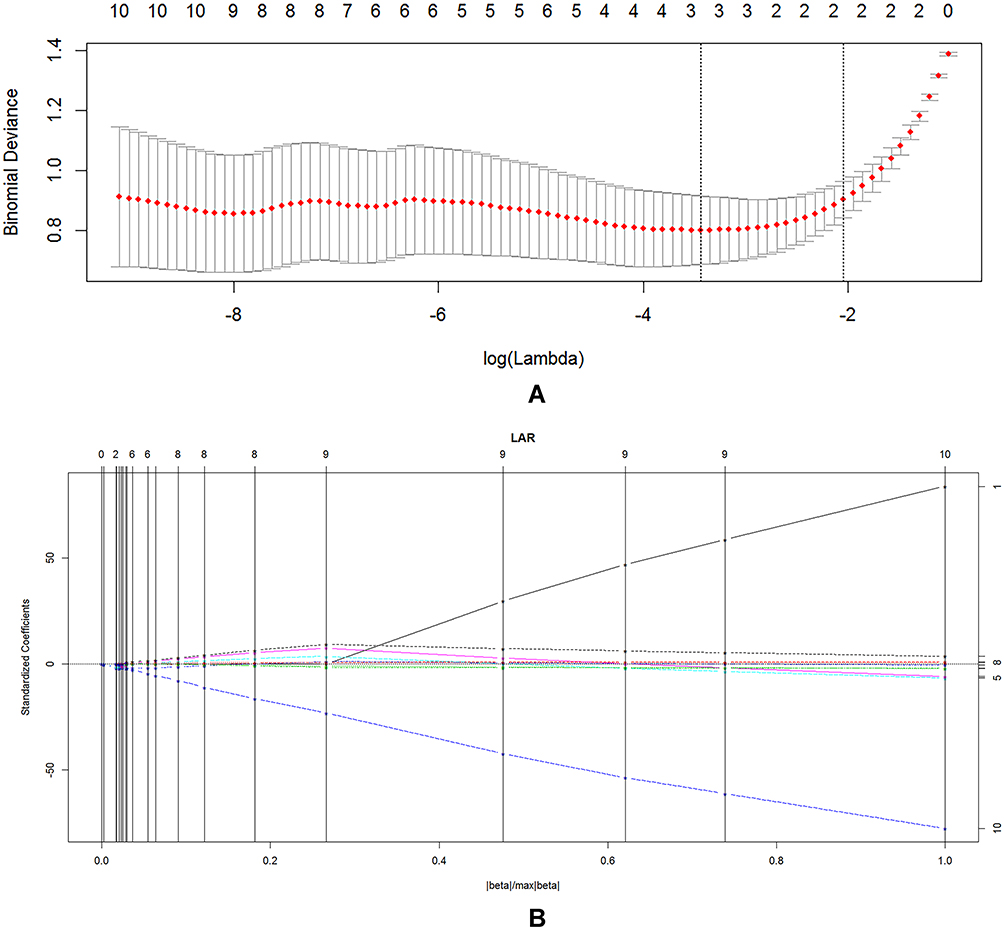 |
Figure 3 Radiomics feature selection using the LASSO regression. LASSO, least absolute shrinkage and selection operator. (A) Tuning parameter (λ) selection in the LASSO logistic model. The binominal deviance curve was generated vs log (λ). The minimum criteria for tenfold cross-validation were applied to λ selection. The optimal values of the LASSO tuning parameter (λ) are indicated by the dotted vertical lines. (B) The vertical line corresponds to the number of iterations in lasso, and the independent variable nonzero coefficients are selected. |
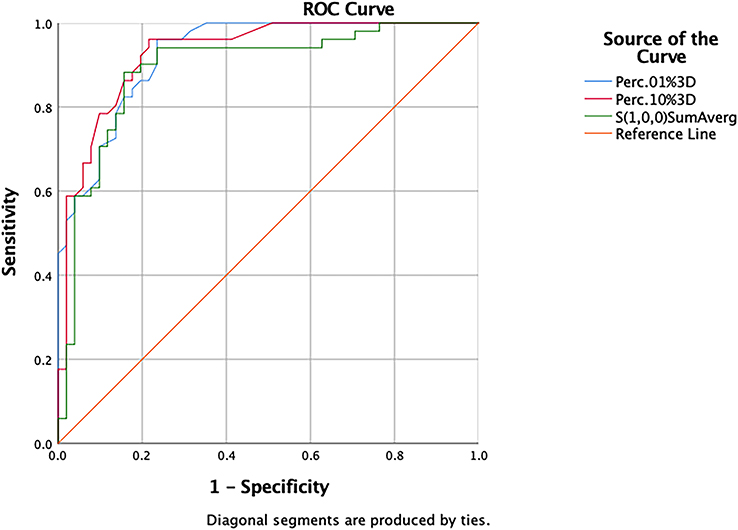 |
Figure 4 The ROC analysis of Perc.01%3D, Perc.10%3D and s(1,0,0) SumAverg for differentiation SRCC from AC. Abbreviation: ROC, receiver operating characteristic. |
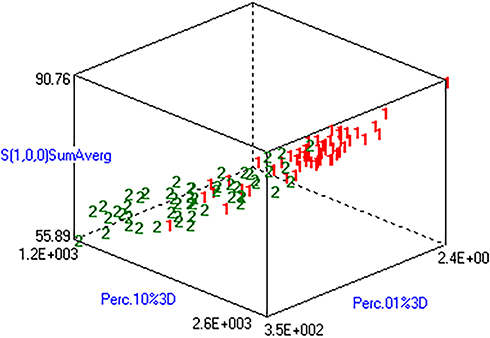 |
Figure 5 Texture analysis based on portal venous phase image to distinguish SRCC from AC. 1 for AC, 2 for SRCC. The difference between “l” and “2” is obvious, indicating excellent texture analysis and discrimination ability. |
Discussion
SRCC is a rare subtype of CRC, and patients with SRCC tend to present with a poorer prognosis than those with AC do.16 Different histological subtypes of colorectal cancer have different biological behaviors, and thus the treatment response is not the same.17,18 If the pathological subtypes can be predicted before treatment, it is expected to treat colorectal cancer with different biological behaviors by selecting a reasonable individualized treatment strategy.
CT texture analysis has been widely applied as a promising imaging biomarker in colorectal cancer.19 Early studies have reported the application value of CT texture analysis in forecasting pathological characteristics, treatment response and patient prognosis.8,20,21 However, no studies have been investigated into the texture analysis of SRCC alone or the texture comparison between SRCC and AC. In this study, we found that CT texture analysis obtained better performance in terms of differential diagnosis. Although CT texture analysis cannot replace pathological assessment, confirming tumor histological subtypes may be beneficial in preoperative evaluation of tumor aggressiveness and in determining therapeutic strategies.
Our data show that males dominated in the SRCC group, whereas the location of the tumor did not show significant differences between SRCC and AC. While previous studies reported that SRCC was more commonly found in the right-sided colon and had a male predominance.22 In our study, s(1,0,0) SumAverg was lower in the SRCC group than in the AC group. The parameter s(1,0,0) SumAverg can be extracted from the cooccurrence matrix, which is used to reflect uniformity/heterogeneity of tissue density by describing varies density variation with increasing distance in an ROI.21,23 Our data demonstrate that SRCC seems to behave as a heterogeneous tumor compared with AC, which was in agreement with a previous report.24 The results of our study indicate that low Perc.01%3D and Perc.10%3D parameters were more frequent in the SRCC group than in the AC group. The 1st and 10th percentiles are measures that contain 1% and 10% minimum of the CT values in the observed data, which may represent the portion of tiny tumor necrosis that cannot be recognized by conventional imaging in SRCC. This was consistent with a previous study reporting AC was more likely to have high-degree contrast enhancement than SRCC.25 The degree of contrast enhancement was correlated with vascular angiogenesis, microvessel density and extracellular vascular penetrability.15,26,27 We speculate that SRCC induces less neovascularity and blood perfusion, which may be related to an aggressive phenotype and resistance to both radiotherapy and chemotherapy. Medium texture analysis was obtained based on the low value of the 1-NN misclassified rate (MCR 29.41%) in the differentiation between SRCC and AC, indicating that CT texture analysis can be used as an auxiliary method to distinguish SRCC from AC.
At present, there is no fixed standard for the selection of scanning phase in CT image texture analysis. In our study, the texture characteristics were performed on portal phase images according to a previous report, as the portal phase can better display the lesion scope and help to distinguish the relationship between the lesion and the mucosal surface.28 In addition, a routine portal phase scan was required during monitoring and follow-up of CRC patients. In this study, the evaluation of SRCC and AC was performed on the entire tumor, as entire tumor analysis provides a more representative evaluation of tumor heterogeneity. Previous studies have compared two-dimensional vs three-dimensional measurements of single lesions. Some reports showing that three-dimensional is no better than two-dimensional measurements, as more layers of ROI will contain more invalid components.29 While others report that the analysis of three-dimensional measurements contains the whole volume of the tumor and may reflect more information about tumor heterogeneity.30
To our knowledge, this study was the first to compare CT imaging texture features of patients between SRCC and AC. However, the limitations of this paper include the following. First, the sample size for the SRCC group is small, owing to the rarity of SRCC. Therefore, the training cohort and validation cohort were not involved in our study. Second, the texture characteristics were performed on portal phase images, as the portal phase can better display the lesion scope. Further studies that include a larger study population and multiphase CT imaging are necessary to confirm the findings of our study. Third, our study analyzed adenocarcinoma and signet-ring cell carcinoma, and mucinous adenocarcinoma was excluded due to mucus composition. Finally, only three-dimensional measurements were assessed, which may represent the heterogeneous characteristics of the whole tumor. The comparison between 2D and 3D measurements will be studied in the future.
Conclusion
In conclusion, our data indicate that SRCC usually occurs more often in men than AC does. In addition, our data also show that texture parameters on portal phase images, including Perc.01%3D, Perc.10%3D and s(1,0,0) SumAverg, may be regarded as promising data to assess the differentiation between SRCC and AC.
Acknowledgements
We thank all staff involved in the acquisition of data. We are grateful to all involved cancer patients for their participation in the study. Also, we thank American Journal Experts for their support in the linguistic edit of the manuscript.
Author Contributions
All authors contributed to data analysis, drafting or revising the article, gave final approval of the version to be published, and agree to be accountable for all aspects of the work. Yali Yue and Feixiang Hu are co-first authors.
Disclosure
The authors report no conflicts of interest in this work.
References
1. Siegel RL, Miller KD, Jemal A. Cancer statistics, 2019. CA Cancer J Clin. 2019;69(1):7–34. doi:10.3322/caac.v69.1
2. Hugen N, Verhoeven RH, Lemmens VE, et al. Colorectal signet-ring cell carcinoma: benefit from adjuvant chemotherapy but a poor prognostic factor. Int J Cancer. 2015;136(2):333–339. doi:10.1002/ijc.28981
3. Inamura K, Yamauchi M, Nishihara R, et al. Prognostic significance and molecular features of signet-ring cell and mucinous components in colorectal carcinoma. Ann Surg Oncol. 2015;22(4):1226–1235. doi:10.1245/s10434-014-4159-7
4. Laufman H, Saphir O. Primary linitis plastica type of carcinoma of the colon. AMA Arch Surg. 1951;62(1):79–91. doi:10.1001/archsurg.1951.01250030082009
5. Kim JH, Park SJ, Park MI, Moon W, Kim SE. Early-stage primary signet ring cell carcinoma of the colon. World J Gastroenterol. 2013;19(24):3895–3898. doi:10.3748/wjg.v19.i24.3895
6. Wu SG, Zhang WW, Sun JY, He ZY, Su GQ, Li FY. Preoperative radiotherapy improves survival in rectal signet-ring cell carcinoma-a population-based study. Radiat Oncol. 2017;12(1):141. doi:10.1186/s13014-017-0874-0
7. Yun SO, Cho YB, Lee WY, et al. Clinical significance of signet-ring-cell colorectal cancer as a prognostic factor. Ann Coloproctol. 2017;33(6):232–238. doi:10.3393/ac.2017.33.6.232
8. Ng F, Ganeshan B, Kozarski R, Miles KA, Goh V. Assessment of primary colorectal cancer heterogeneity by using whole-tumor texture analysis: contrast-enhanced CT texture as a biomarker of 5-year survival. Radiology. 2013;266(1):177–184. doi:10.1148/radiol.12120254
9. Ganeshan B, Panayiotou E, Burnand K, Dizdarevic S, Miles K. Tumour heterogeneity in non-small cell lung carcinoma assessed by CT texture analysis: a potential marker of survival. Eur Radiol. 2012;22(4):796–802. doi:10.1007/s00330-011-2319-8
10. Yip C, Landau D, Kozarski R, et al. Primary esophageal cancer: heterogeneity as potential prognostic biomarker in patients treated with definitive chemotherapy and radiation therapy. Radiology. 2014;270(1):141–148. doi:10.1148/radiol.13122869
11. Zhang H, Graham CM, Elci O, et al. Locally advanced squamous cell carcinoma of the head and neck: CT texture and histogram analysis allow independent prediction of overall survival in patients treated with induction chemotherapy. Radiology. 2013;269(3):801–809. doi:10.1148/radiol.13130110
12. Goh V, Ganeshan B, Nathan P, Juttla JK, Vinayan A, Miles KA. Assessment of response to tyrosine kinase inhibitors in metastatic renal cell cancer: CT texture as a predictive biomarker. Radiology. 2011;261(1):165–171. doi:10.1148/radiol.11110264
13. Wagner F, Hakami YA, Warnock G, Fischer G, Huellner MW, Veit-Haibach P. Comparison of contrast-enhanced CT and [(18)F]FDG PET/CT analysis using kurtosis and skewness in patients with primary colorectal cancer. Mol Imaging Biol. 2017;19(5):795–803.
14. Ganeshan B, Miles KA. Quantifying tumour heterogeneity with CT. Cancer Imaging. 2013;13:140–149. doi:10.1102/1470-7330.2013.0015
15. Davnall F, Yip CS, Ljungqvist G, et al. Assessment of tumor heterogeneity: an emerging imaging tool for clinical practice? Insights Imaging. 2012;3(6):573–589. doi:10.1007/s13244-012-0196-6
16. Hyngstrom JR, Hu CY, Xing Y, et al. Clinicopathology and outcomes for mucinous and signet ring colorectal adenocarcinoma: analysis from the National Cancer Data Base. Ann Surg Oncol. 2012;19(9):2814–2821. doi:10.1245/s10434-012-2321-7
17. Hugen N, van de Velde CJ, de Wilt JH, Nagtegaal ID. Metastatic pattern in colorectal cancer is strongly influenced by histological subtype. Ann Oncol. 2014;25(3):651–657. doi:10.1093/annonc/mdt591
18. Klaver YL, Lemmens VE, Creemers GJ, Rutten HJ, Nienhuijs SW, de Hingh IH. Population-based survival of patients with peritoneal carcinomatosis from colorectal origin in the era of increasing use of palliative chemotherapy. Ann Oncol. 2011;22(10):2250–2256. doi:10.1093/annonc/mdq762
19. Lubner MG, Smith AD, Sandrasegaran K, Sahani DV, Pickhardt PJ. CT texture analysis: definitions, applications, biologic correlates, and challenges. Radiographics. 2017;37(5):1483–1503. doi:10.1148/rg.2017170056
20. Cui C, Cai H, Liu L, Li L, Tian H, Li L. Quantitative analysis and prediction of regional lymph node status in rectal cancer based on computed tomography imaging. Eur Radiol. 2011;21(11):2318–2325. doi:10.1007/s00330-011-2182-7
21. Miles KA, Ganeshan B, Griffiths MR, Young RC, Chatwin CR. Colorectal cancer: texture analysis of portal phase hepatic CT images as a potential marker of survival. Radiology. 2009;250(2):444–452. doi:10.1148/radiol.2502071879
22. Barresi V, Reggiani Bonetti L, Domati F, Baron L. Prognostic relevance of histopathological features in signet ring cell carcinoma of the colorectum. Virchows Arch. 2016;469(3):267–275. doi:10.1007/s00428-016-1983-0
23. Miles KA, Ganeshan B, Hayball MP. CT texture analysis using the filtration-histogram method: what do the measurements mean? Cancer Imaging. 2013;13(3):400–406. doi:10.1102/1470-7330.2013.9045
24. Chee CG, Kim YH, Lee KH, et al. CT texture analysis in patients with locally advanced rectal cancer treated with neoadjuvant chemoradiotherapy: a potential imaging biomarker for treatment response and prognosis. PLoS One. 2017;12(8):e0182883. doi:10.1371/journal.pone.0182883
25. Chen J, Cai R, Ren G, et al. Differences in clinicopathological characteristics and computed tomography findings between signet ring cell carcinoma and nonsignet ring cell carcinoma in early and advanced gastric cancer. Cancer Med. 2018;7(4):1160–1169. doi:10.1002/cam4.2018.7.issue-4
26. Ryu YJ, Choi SH, Park SJ, Yun TJ, Kim JH, Sohn CH. Glioma: application of whole-tumor texture analysis of diffusion-weighted imaging for the evaluation of tumor heterogeneity. PLoS One. 2014;9(9):e108335. doi:10.1371/journal.pone.0108335
27. Skogen K, Ganeshan B, Good C, Critchley G, Miles K. Measurements of heterogeneity in gliomas on computed tomography relationship to tumour grade. J Neurooncol. 2013;111(2):213–219. doi:10.1007/s11060-012-1010-5
28. Badic B, Desseroit MC, Hatt M, Visvikis D. Potential complementary value of noncontrast and contrast enhanced CT radiomics in colorectal cancers. Acad Radiol. 2019;26(4):469–479. doi:10.1016/j.acra.2018.06.004
29. Ahn SJ, Kim JH, Park SJ, Han JK. Prediction of the therapeutic response after FOLFOX and FOLFIRI treatment for patients with liver metastasis from colorectal cancer using computerized CT texture analysis. Eur J Radiol. 2016;85(10):1867–1874. doi:10.1016/j.ejrad.2016.08.014
30. Ng F, Kozarski R, Ganeshan B, Goh V. Assessment of tumor heterogeneity by CT texture analysis: can the largest cross-sectional area be used as an alternative to whole tumor analysis? Eur J Radiol. 2013;82(2):342–348. doi:10.1016/j.ejrad.2012.10.023
 © 2019 The Author(s). This work is published and licensed by Dove Medical Press Limited. The full terms of this license are available at https://www.dovepress.com/terms.php and incorporate the Creative Commons Attribution - Non Commercial (unported, v3.0) License.
By accessing the work you hereby accept the Terms. Non-commercial uses of the work are permitted without any further permission from Dove Medical Press Limited, provided the work is properly attributed. For permission for commercial use of this work, please see paragraphs 4.2 and 5 of our Terms.
© 2019 The Author(s). This work is published and licensed by Dove Medical Press Limited. The full terms of this license are available at https://www.dovepress.com/terms.php and incorporate the Creative Commons Attribution - Non Commercial (unported, v3.0) License.
By accessing the work you hereby accept the Terms. Non-commercial uses of the work are permitted without any further permission from Dove Medical Press Limited, provided the work is properly attributed. For permission for commercial use of this work, please see paragraphs 4.2 and 5 of our Terms.