")
Back to Journals » Clinical Epidemiology » Volume 10
Thirty-year trends in dementia: a nationwide population study of Swedish inpatient records
Authors Seblova D , Quiroga ML , Fors S, Johnell K, Lövdén M, Ponce de Leon A , Svensson AC, Wicks S, Lager A
Received 2 July 2018
Accepted for publication 6 September 2018
Published 16 November 2018 Volume 2018:10 Pages 1679—1693
DOI https://doi.org/10.2147/CLEP.S178955
Checked for plagiarism Yes
Review by Single anonymous peer review
Peer reviewer comments 3
Editor who approved publication: Professor Henrik Sørensen
Dominika Seblova,1,2 Maria Lopez Quiroga,3 Stefan Fors,1 Kristina Johnell,1 Martin Lövdén,1 Antonio Ponce de Leon,2,4 Anna Christina Svensson,2 Susanne Wicks,2,4 Anton Lager1,2,4
1Aging Research Center, Karolinska Institutet, Stockholm, Sweden; 2Department of Public Health Sciences, Karolinska Institutet, Stockholm, Sweden; 3Complutense University of Madrid, Madrid, Spain; 4Center for Epidemiology and Community Medicine, Stockholm County Council, Stockholm, Sweden
Background: The continuous growth of the current dementia epidemic is contingent on the stability of age- and sex-specific trends over time. However, recent evidence suggests declining or stable trends. The aim of this study was to evaluate the real-world changes in the burden of dementia in older adults in Sweden from 1987 to 2016 by estimating age- and sex-specific incidence of dementia diagnosis in hospital inpatient records (dementia incidence). Differences in trends by sex, age, and educational levels were also examined.
Methods: The entire Swedish population aged 65 years and older was followed up from 1987 to 2016. Age-, sex-, and education-stratified dementia incidence rates for every follow-up year were estimated using the National Patient Register. Hazard ratio of receiving a dementia diagnosis in the inpatient records per 1 calendar year increase was estimated with discrete time logistic models with a complementary log–log link.
Results: After increase, especially in those >85 years of age, dementia incidence started to decrease in the last 5 years of the study period. After 2011, 1 calendar year increase was associated with lower hazard ratio of receiving a hospital diagnosis of dementia. The decrease had the highest magnitude in 70–74-year-olds (–5.5%), followed by 75–79-year-olds (–4.5%) and 80–84-year-olds (–4.0%). The decrease was present in both sexes and at all educational levels up to 90 years of age. Age was associated with the level of dementia incidence, and the trends differed by age group. Educational gradient was observed. University-educated older adults had the lowest rates of dementia. However, the trend over time did not substantially differ by sex or educational level.
Conclusion: Our results provide more evidence that dementia incidence may be declining. They also suggest that at least in hospitals, the number of new patients with dementia may decrease in the future.
Keywords: incidence, Alzheimer’s, hospitalization, population study, heterogeneous association, education
Plain language summary
Dementia is an important global health issue. To tackle this challenge in the future, it is important to understand the trends in how many people live with dementia. Previous studies have suggested that such trends may differ by sex and age and that a higher level of education may be protective. Therefore, we examined differences in how many men and women in different age groups and with different levels of education had a dementia diagnosis at Swedish hospitals from 1987 to 2016. Over the whole period, 16.4% of those who survived up to 65 years were admitted to a hospital and received a diagnosis of dementia before 85 years of age. Furthermore, our results show that the number of adults with first hospital diagnosis of dementia increased until 2011, especially among the adults older than 85 years. However, in the last 5 years, the number of new diagnoses of dementia in hospitals has decreased. For example, in 2011, 62 of 10,000 women aged 65 years and older had a diagnosis of dementia according to the inpatient records. In 2016, this number had dropped to 50 of 10,000. The decrease in diagnosis of dementia was present for men and women until age 90. Throughout the entire study period, the number of people with dementia according to their hospital records was the lowest among those with at least some university education. Overall, our study suggests that, at least in Swedish hospitals, the number of new patients with dementia may decrease in the future, which would reflect an improvement in public health.
Introduction
Dementia poses a significant health burden for current and future societies. Today, about 47 million people worldwide have dementia.1 Dementia predominantly affects older adults, and its prevalence increases sharply with age.2 Thus, the great gains in life expectancy experienced over the past two centuries, alongside the population growth, mean that an increasing number of people reach ages at which the prevalence of neurodegenerative disorders is high.3,4 Accordingly, researchers forecast an even higher dementia burden in the future: it was estimated that 131.5 million people will be affected by 2050.1
Examining time trends in the burden of dementia is of key importance to understand the future demands on our societies. Yet, studying trends is complicated by changes in diagnostic criteria, demographics, and other factors. Typically, projections are based on estimates of dementia incidence or prevalence in relatively small research cohorts. Such studies have had mixed results. One found stable,5 others decreasing,6,7 and still others increasing rates.8,9 A recent narrative review suggested that the summarized evidence may challenge the current forecasts, because most studies reported declining or stable trends.10
To understand the future burden of dementia, it is also important to consider the protective or risk factors that could alter the trends. Previous studies suggest that trends may differ by sex.11–13 Educational level is one potentially modifiable factor associated with dementia; higher educational level is associated with lower or delayed onset of the syndrome.14 Yet, heterogeneity in the association between education and trends in dementia incidence remains largely unexamined because of insufficient statistical power.15
Analyzing trends in the burden of dementia using real-world data, such as population-based registers or electronic health records, is an alternative to smaller research cohort or survey studies.10,16 Studies of real-world data encompass large populations and may thus provide sufficient statistical power to examine heterogeneous associations. Furthermore, some registers such as the Swedish National Patient Register (NPR) provide long-term data with nearly complete coverage.17 Surveys, on the other hand, are based on samples, may suffer from nonresponse to baseline follow-up, and may be subjected to attrition over time. These factors can affect both the external and internal validity of the results.18 However, register data also have limitations. Rizzuto et al19 suggested that register data are likely to underestimate true incidence because of their moderate sensitivity (50%). Further, register data are more susceptible to changes in health care practices than the data from research cohorts.16 Nevertheless, the use of registers may facilitate time-trend analyses if the populations are representative and diagnostic procedures are stable16 or changes in health care practices are considered in the analyses. Moreover, analyses of register data provide information about the real-world situation in an entire country, which is also of vital importance.
Sweden is an ideal country in which to examine trends in the burden of dementia. Not only does information from national educational and medical registers provide long-term data on potential risk factors and dementia, but Sweden also has a remarkably aged population. For example, in 2015, it was the sixth oldest country in the world.20 Currently, approximately one-fifth of the population is older than 65 years.21 This study combined Sweden’s unique resources and analyzed trends in inpatient records to evaluate changes in the burden of dementia in older adults over time. In addition, differences in trends by sex, age, and educational levels were examined.
Methods
Study population and setting
For every calendar year between 1987 and 2016, all men and women who were at least 65 years and, according to the Total Population Register (RTB), resided in Sweden, were included in the study population. Those who had migrated repeatedly (had >1 migration) after 65 years of age were excluded, as it was unclear where they obtained their health care (0.64%). We also excluded those who had dementia before 65 years of age (0.19%). Otherwise, people were included either from the year they turned 65 years or the first year they were 65 years or older and registered as resident in Sweden. The RTB was also used to collect information on date of birth, sex, and yearly residency registration. The size of the study sample ranged from 972,167 in 1987 to 1,991,483 in 2016. Observations were censored at the first year a diagnosis of dementia appeared in the inpatient record (see “Dementia ascertainment” section), at death, at the first year for which residency information was missing, or at the end of the follow-up period. Information on year of death was obtained from the Cause of Death Register, which covers all those registered in Sweden at the time of death.22
Dementia ascertainment
Incidence of diagnosis of dementia in hospital inpatient records, hereafter referred to as dementia incidence, was ascertained with the NPR. The year of dementia incidence was defined as the year of first hospital diagnosis of dementia in or after 1987, the first year the NPR had national coverage.23 All hospital admissions were considered, regardless of the length of stay. The follow-up period spans two International Classification of Diseases systems (ICD9 and ICD10). Therefore, the following time-specific codes were used to ascertain a dementia diagnosis: 1) ICD10: F00.0, F00.1, F00.2, F00.9, F01.0, F01.1, F01.2, F01.3, F01.8, F01.9, F02.0, F02.3, F03.9, G30.1, G30.8, G30.9, G31.1, and G31.8A and 2) ICD9: 290, 249B, and 331A. The codes are similar to those used in the study by Gatz et al.24 All primary and secondary diagnoses were used. This multiple-cause approach to ascertaining dementia diagnosis has been employed previously.25
Education
Participant’s highest educational level was primarily derived from the Longitudinal Integration Database for Health Insurance and Labor Market Studies (LISA).26 If a person’s educational level was not available in LISA, data from the 1990 or 1970 census were used. Data from these sources were collapsed into three levels: elementary school, high school, and at least some university education. Those missing information on education (2.9% of the sample; range per year, 2.5%–3.7%) were included and analyzed as a separate category.
Statistical analyses
Dementia incidence per calendar year was estimated with data from the NPR. First, we estimated incidence rates per 10,000 people aged 65 years and older by 5-year age group strata. Second, we calculated incidence rates stratified by both age group and educational level. Third, the aforementioned rates were computed for men and women separately. Strata-specific 1-year incidence rates per 10,000 were calculated as the sum of events in a given calendar year and strata group, divided by the sum of person-years at risk in the given strata and year, times 10,000.
Dementia incidence can be influenced by improvements in survival. Therefore, we also calculated a cumulative incidence adjusted for competing risk of death, hereafter referred to only as cumulative incidence. Cumulative incidence estimates the probability of receiving a first hospital diagnosis of dementia given the current lifespan. It is important to take time of death into account in the analyses because life expectancy has been increasing over time. In other words, cumulative incidence captures a remaining lifetime risk per calendar year in the age groups. Cumulative incidence was expressed in percentage. Age group-stratified trends were used because we did not observe the same maximum age in all calendar years. A version of the Practical Incidence Estimator Macro, adapted to compute per-year dementia incidence, was used to compute these measures.27
Discrete time logistic models with a complementary log-log link (cloglog) function were used to estimate HR whether a person aged 65 years or older would receive a hospital diagnosis of dementia.28,29 The models were fitted on the individual-level data in a long format, with one observation for every calendar year in which the individual was a part of the study. We first estimated models for 1 calendar year increase for every age group strata. Next, we estimated the same models while controlling for age (continuous), sex, and several health care practices confounders (see below). The third set of models included education. The models were post hoc stratified by two time periods because of change in trends observed in graphical analysis.
We also estimated seven age-stratified models examining association of age (continuous), sex, and education with dementia incidence, while adjusting for calendar year. To examine heterogeneous trends, if there were significant main effects, we estimated up to three additional models for every age group. These models included an interaction between age (continuous), or sex, or educational level and calendar year. The significance of the interaction term was assessed using log likelihood-ratio test.
Because register data can be susceptible to changes in health care practices, several time-varying confounders were included. Since changes in the ICD system may alter diagnostic practices, and the two coding systems may have different sensitivity,30 a dummy indicating ICD period was included. The Swedish system of health care for older adults was reformed via the Elderly Reform Act (Ädelreformen) during the follow-up period. From January 1, 1992, the responsibility for social and some medical care for older adults shifted from county councils to municipalities. The reform may have affected hospitalizations. Hence, a dummy indicating prereform and postreform times was included. Finally, the likelihood of hospitalization may vary over time and by sex, age, and educational level. To limit the possibility that dementia incidence trends would be driven by trends in hospitalization in general, we calculated a proportion of all-cause hospitalizations in each calendar year during the follow-up per age group, sex, and educational level and included this proportion as a time-varying variable. The proportion was calculated in these strata because previous studies suggest that there are inequalities in all-cause hospitalization by these factors.31,32
Ethical approval
Data used in this study were pseudonymised, and the key that connects identification numbers to personal identity numbers is not available to the researchers. The Regional Ethical Review Board in Stockholm approved the study (DNR 2010/1185-31/5).
Results
Crude incidence of dementia
There were 45,716,399 person-years during the follow-up period. As expected, the crude dementia incidence in the inpatient register increased steeply with age (Table 1). For example, crude incidence in men increased from 8.45 per 10,000 in those aged 65–69 years to 269 per 10,000 in those aged 95+ years. In the young-olds, those younger than 85 years, the crude incidence was slightly higher in men than women. In men and women for whom educational data were available, crude incidence was lowest in those with at least some university education. However, none of these results controlled for the age structure and educational structure of the population, which changed substantially during the follow-up (Figure 1A and B). The proportion of older adults with elementary education has decreased substantially during the study period from 69% to 36%. At the same time, the proportion of older adults with high school or at least some university education increased. The crude yearly dementia incidence increased for both men and women during the entire follow-up period (Figure 2). From approximately 1993, women had higher crude dementia incidence. However, these results are not adjusted for age or education.
 | Table 1 Sex-stratified crude incidence rates per 10,000 by age group or educational level during the entire follow-up period (1987–2016) Notes: aFirst diagnosis of dementia in hospital inpatient records (ie, in the Swedish National Patient Register) during the study period. |
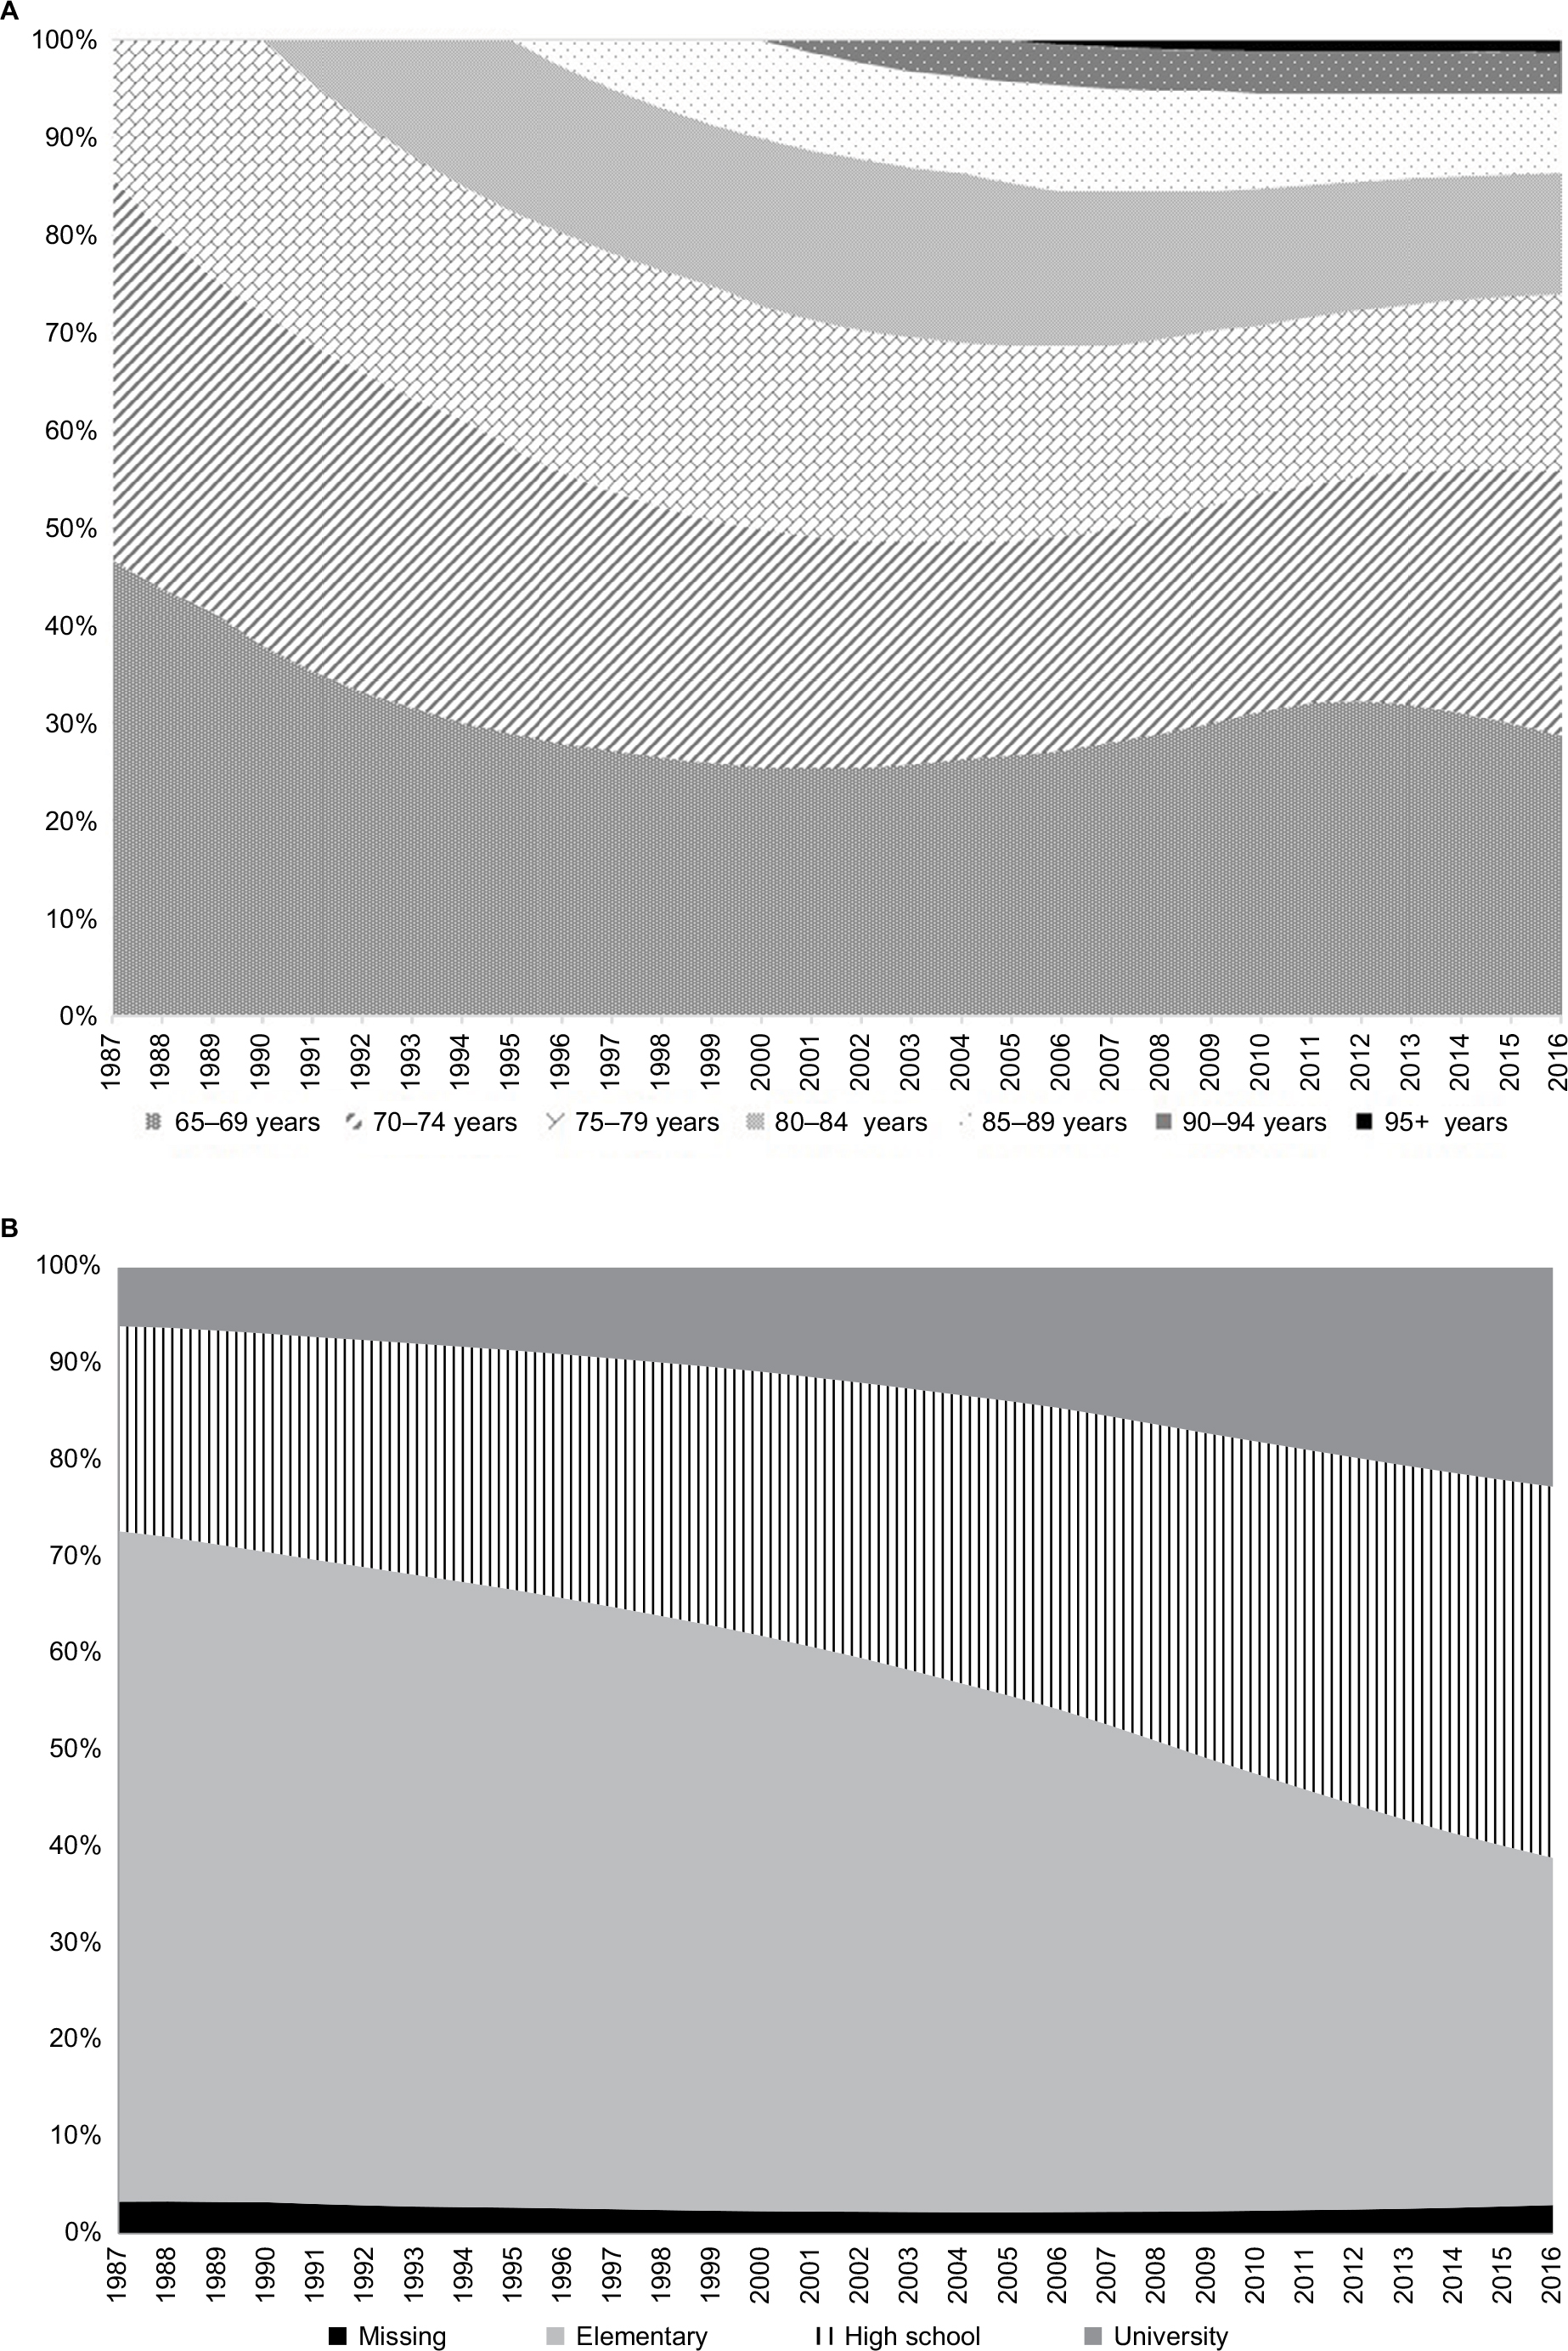 | Figure 1 (A) Composition of the sample in every follow-up year by 5-year age groups. (B) Composition of the sample in every follow-up year by the educational level. |
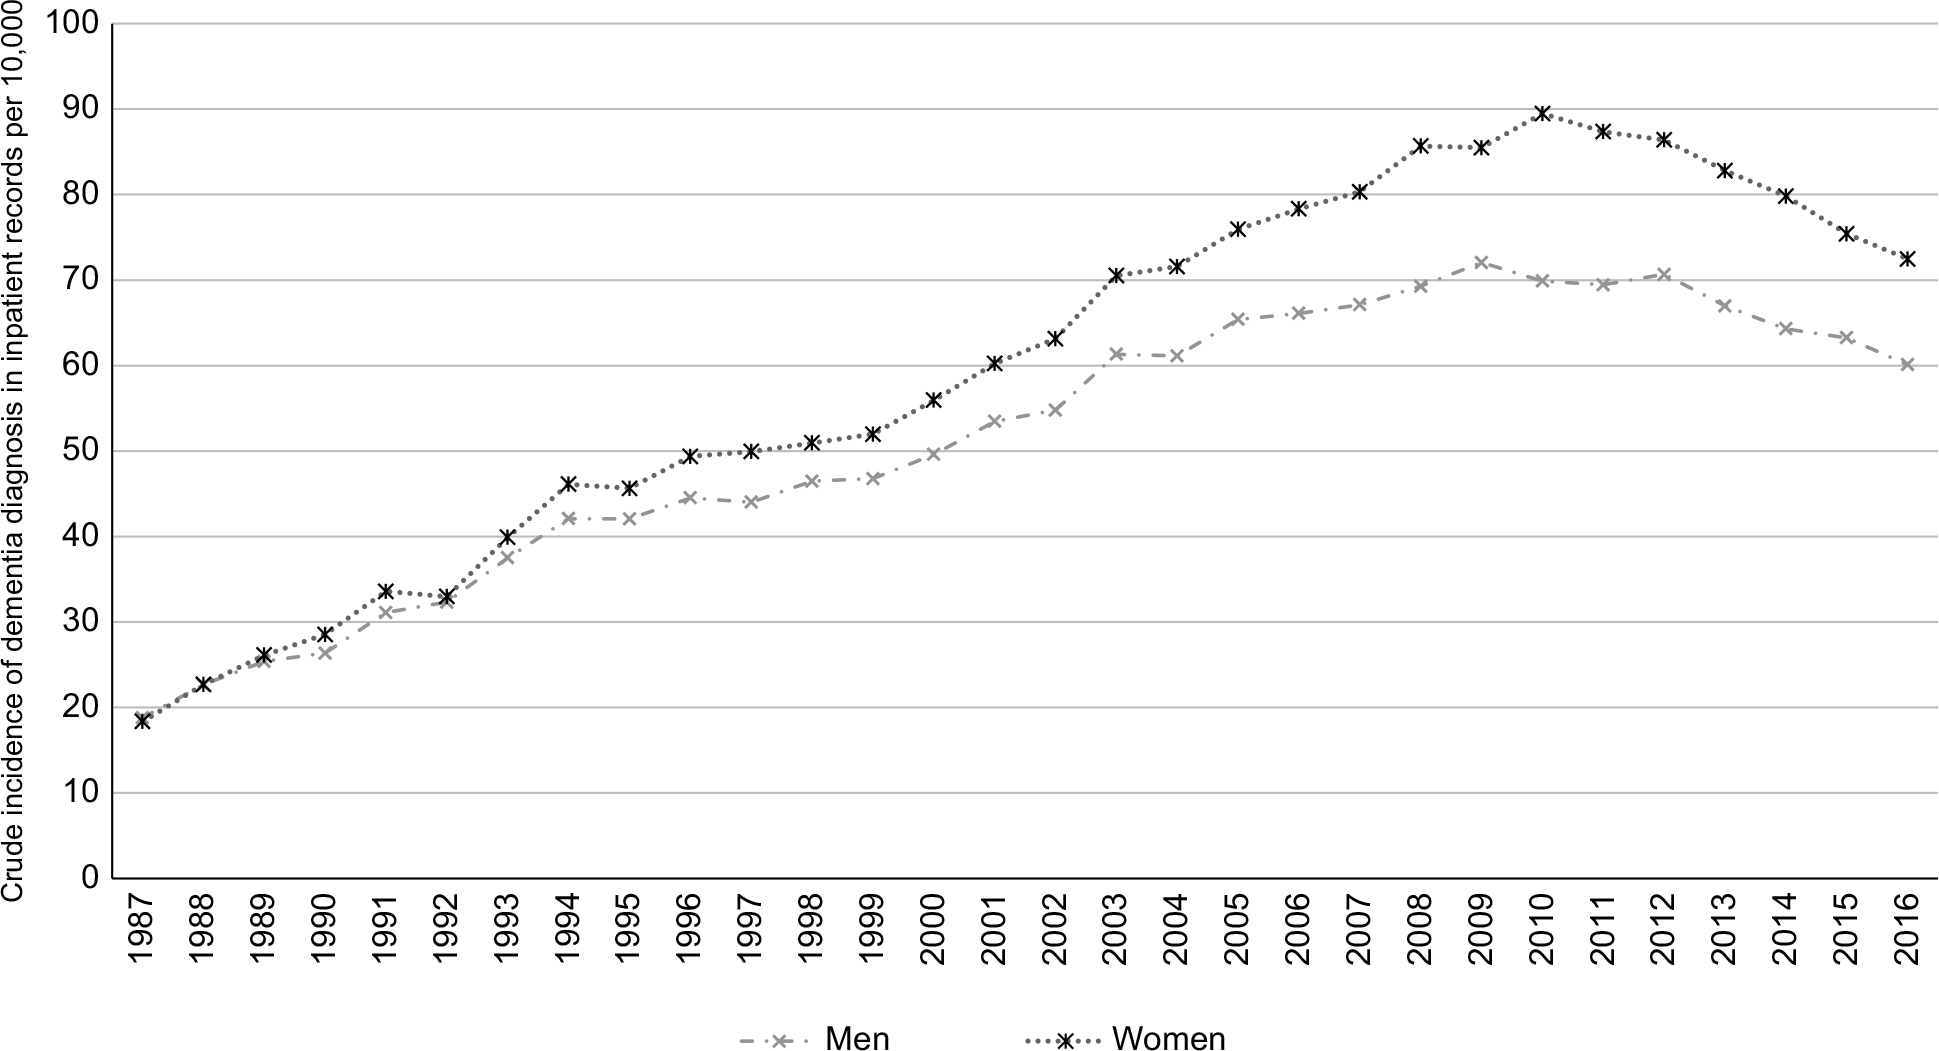 | Figure 2 Sex-specific incidence rates of dementia in inpatient register per 10,000 for every year of follow-up period. |
Temporal trends in dementia incidence
The age- and sex-stratified results show that the trend in dementia incidence over time differed by age group (Figure 3A and B). In the two youngest groups (65–69 and 70–74 years age groups), the trends were relatively stable. In the older age groups, dementia incidence increased until approximately 2011–2012. In the last 5 years of follow-up, dementia incidence measured in hospital inpatient records decreased.
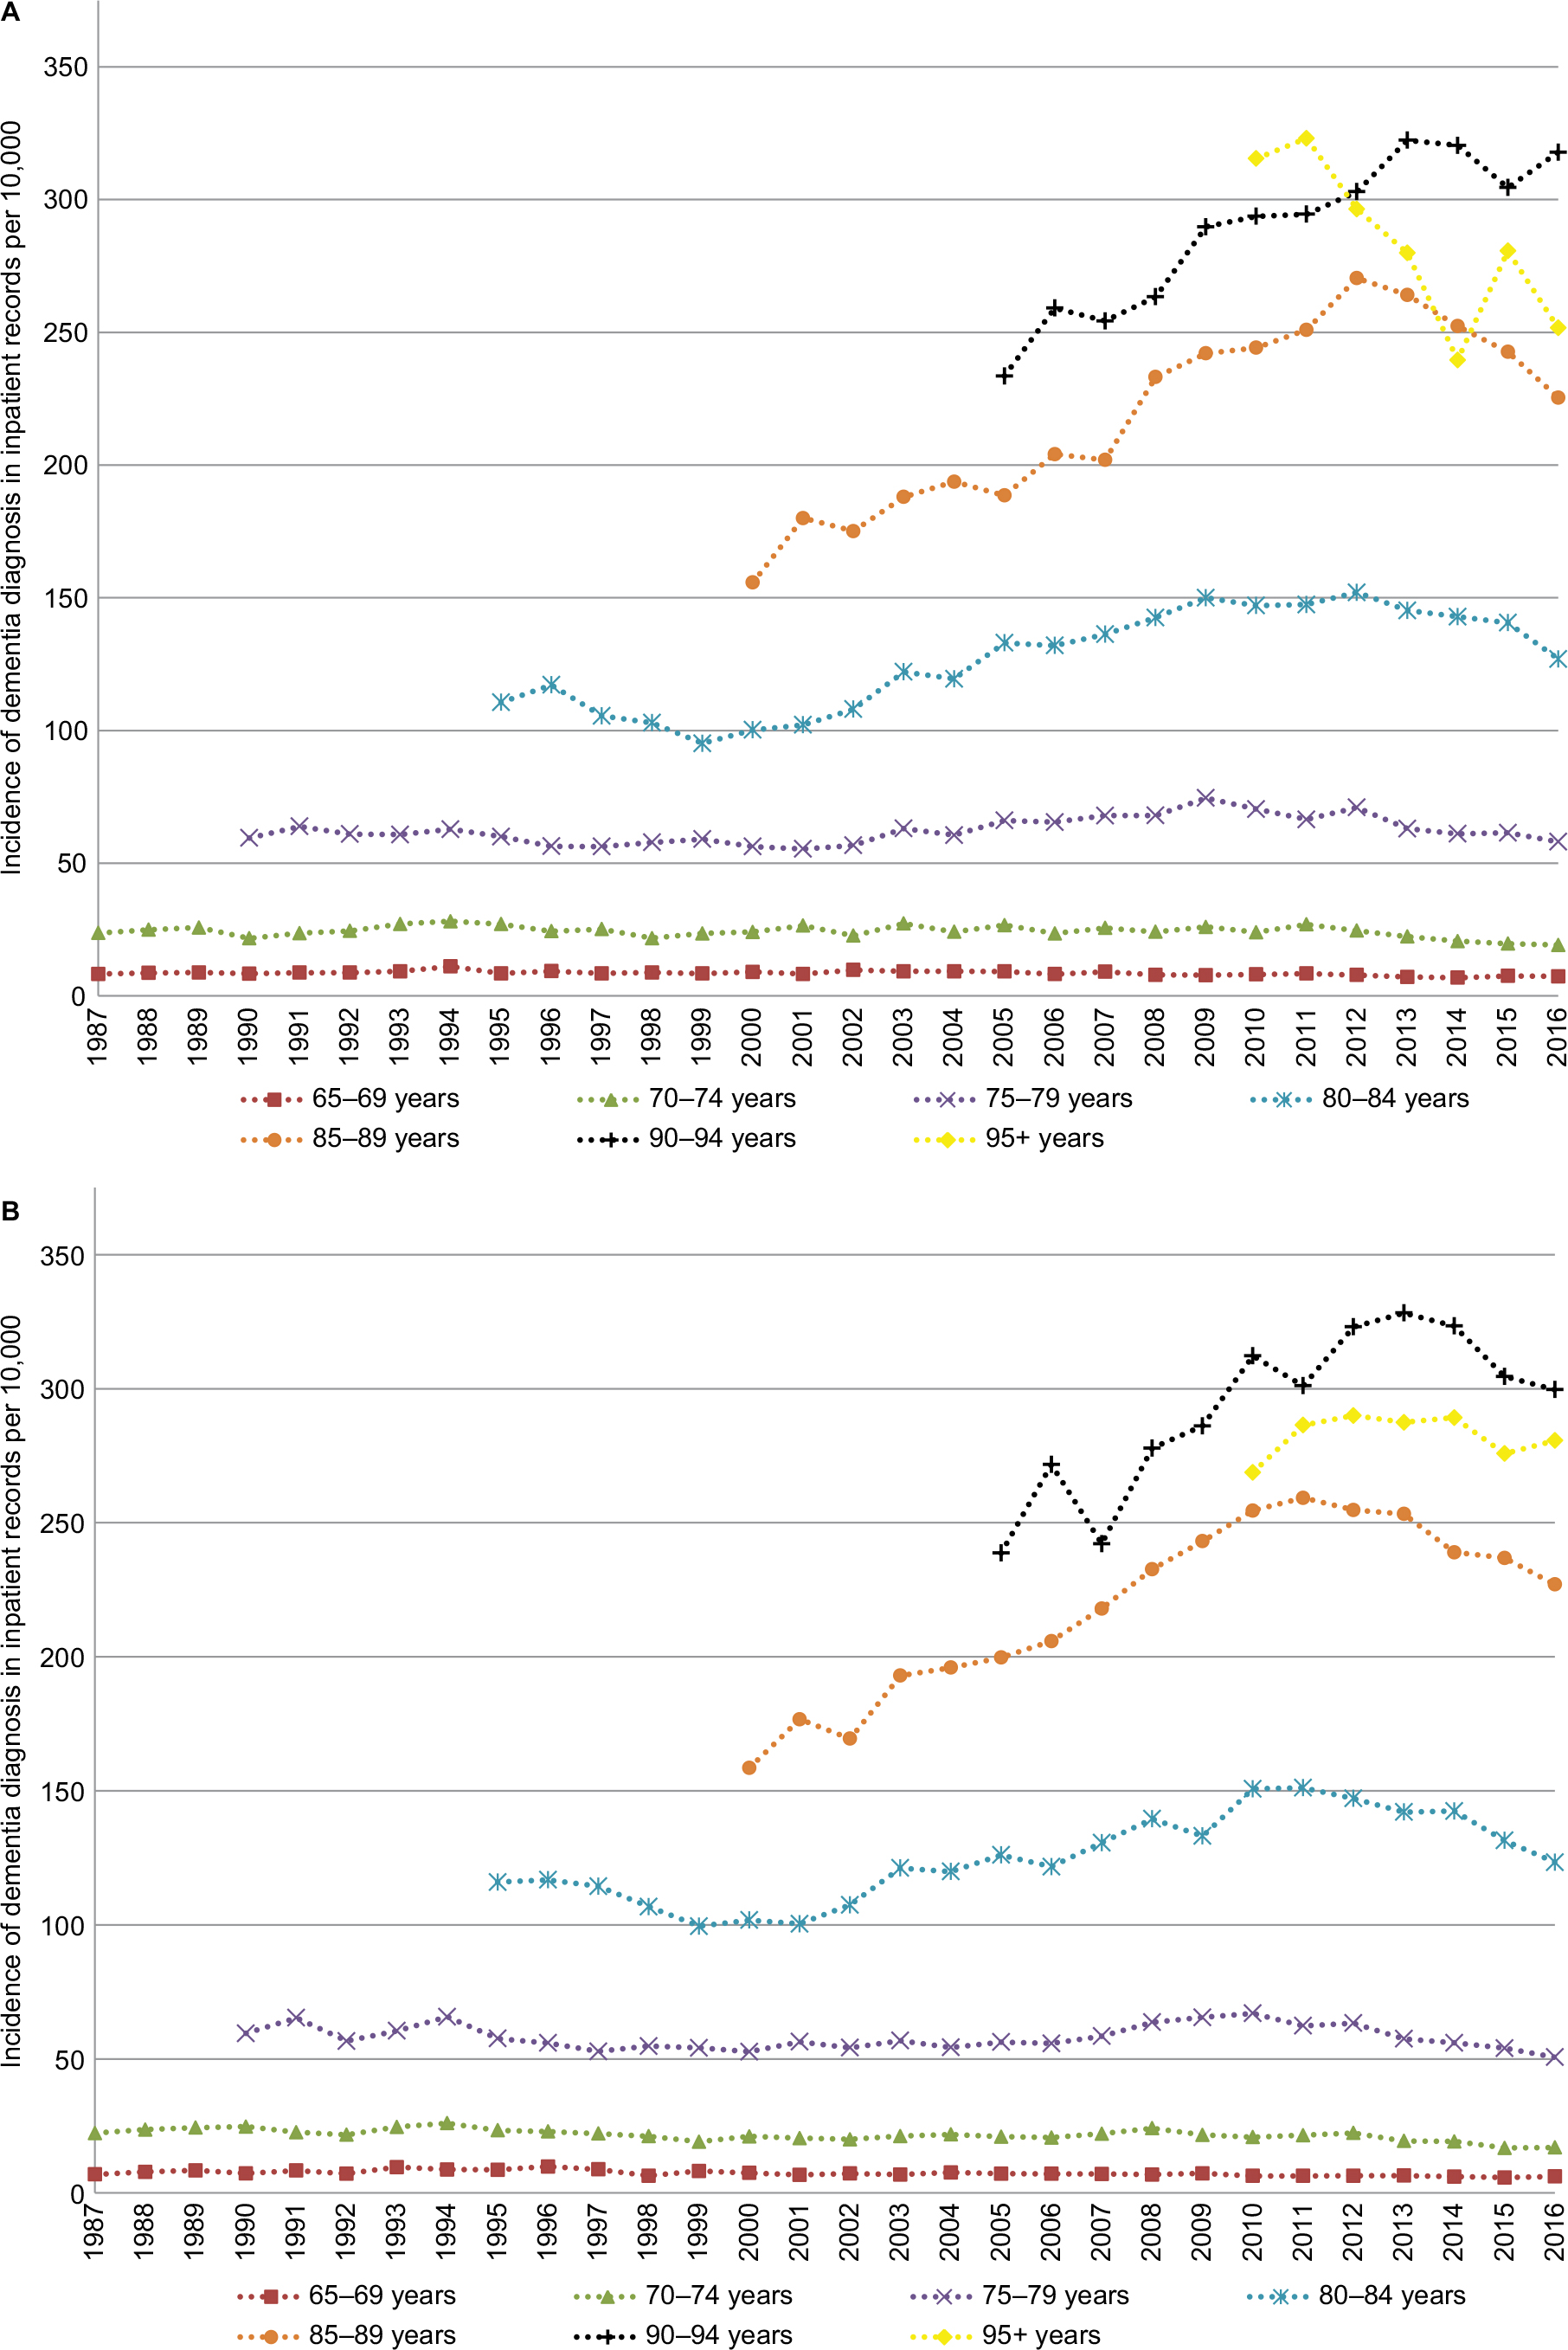 | Figure 3 (A) Age-stratified incidence rates (per 10,000) of first diagnosis of dementia in hospital inpatient records for every year of follow-up in men. (B) Age-stratified incidence rates (per 10,000) of first diagnosis of dementia in hospital inpatient records for every year of follow-up in women. |
The discrete time logistic models by age strata also show differences by age group and time period (Table 2). Results from model 2 indicate that 1 calendar year increase was associated with higher HR of receiving a hospital diagnosis of dementia before 2011. The increase was higher in each successive age group. For example, the increase was 0.8% in 65–69-year-olds, 4.2% in 85–89-year-olds, and 9.5% in those over 95 years (Table 2, Model 2). On the other hand, after 2011, 1 calendar year increase was associated with lower HR of receiving a hospital diagnosis of dementia. The decrease had the highest magnitude in 70–74–year-olds (–5.5%), followed by 75–79-year-olds (–4.5%) and 80–84-year-olds (–4.0%) (Table 2, Model 2).
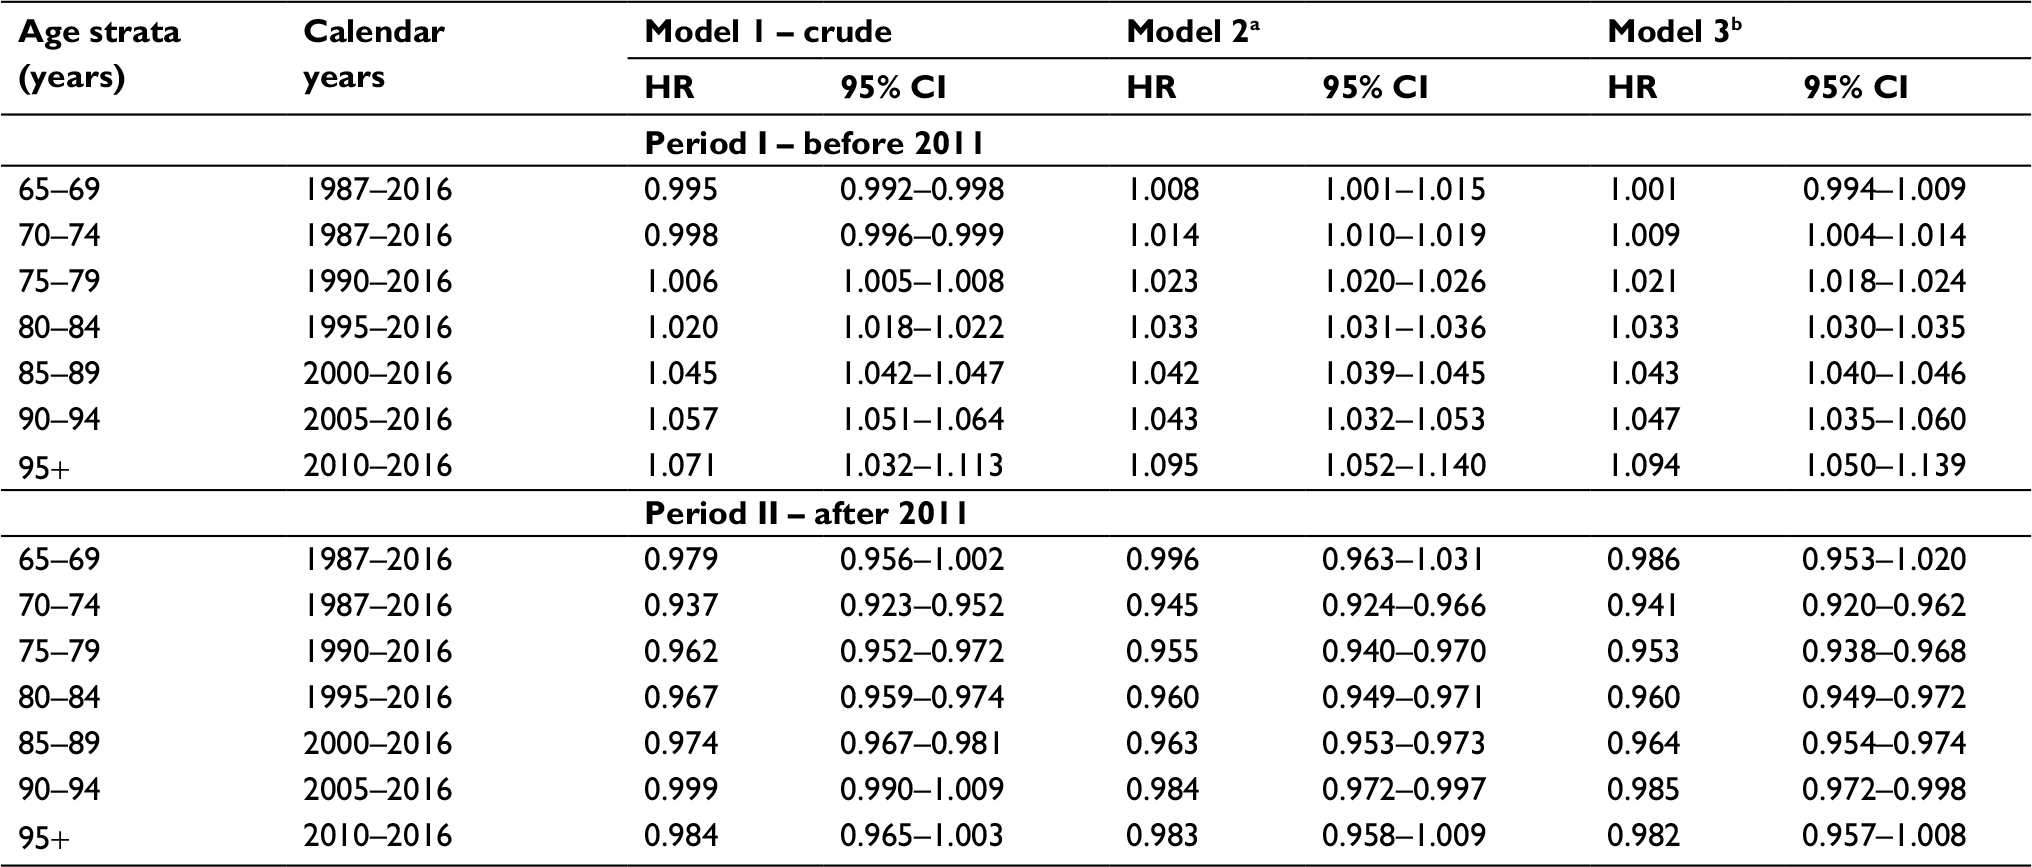 | Table 2 Results from stratified discrete time logistics models with a complementary log-log link function Notes: The models estimate hazard ratio (HR) that a person surviving to given age strata would receive a hospital diagnosis of dementia, per calendar year. The results were post hoc stratified by two periods to quantify the change in trends observed in graphs. aAdjusted for age (continuous within each age group strata); sex; the proportion of all-cause hospitalizations in each calendar year per age group, sex, and educational level; International Classification of Diseases (ICD) period; and pre- and post-Elderly Reform Act (Ädelreformen), if appropriate. bAdjusted for all variables in Model 2 and for the educational level. |
Incidence rates (per 10,000) stratified by 5-year age groups and educational level show an educational gradient up to age 90 years (Figure 4). In older adults younger than 90 years, those with at least some university education had the lowest dementia incidence in the inpatient records during the follow-up. Before 2011, adjusting for education in the models (Table 2, Model 3) attenuates the estimates of temporal change in those younger than 85 years. After 2011, adjusting for education results in higher magnitude of the decrease in those younger than 80 years (Table 2, Model 3). Therefore, educational level is associated with the temporal trends in both periods, at least among the young-olds.
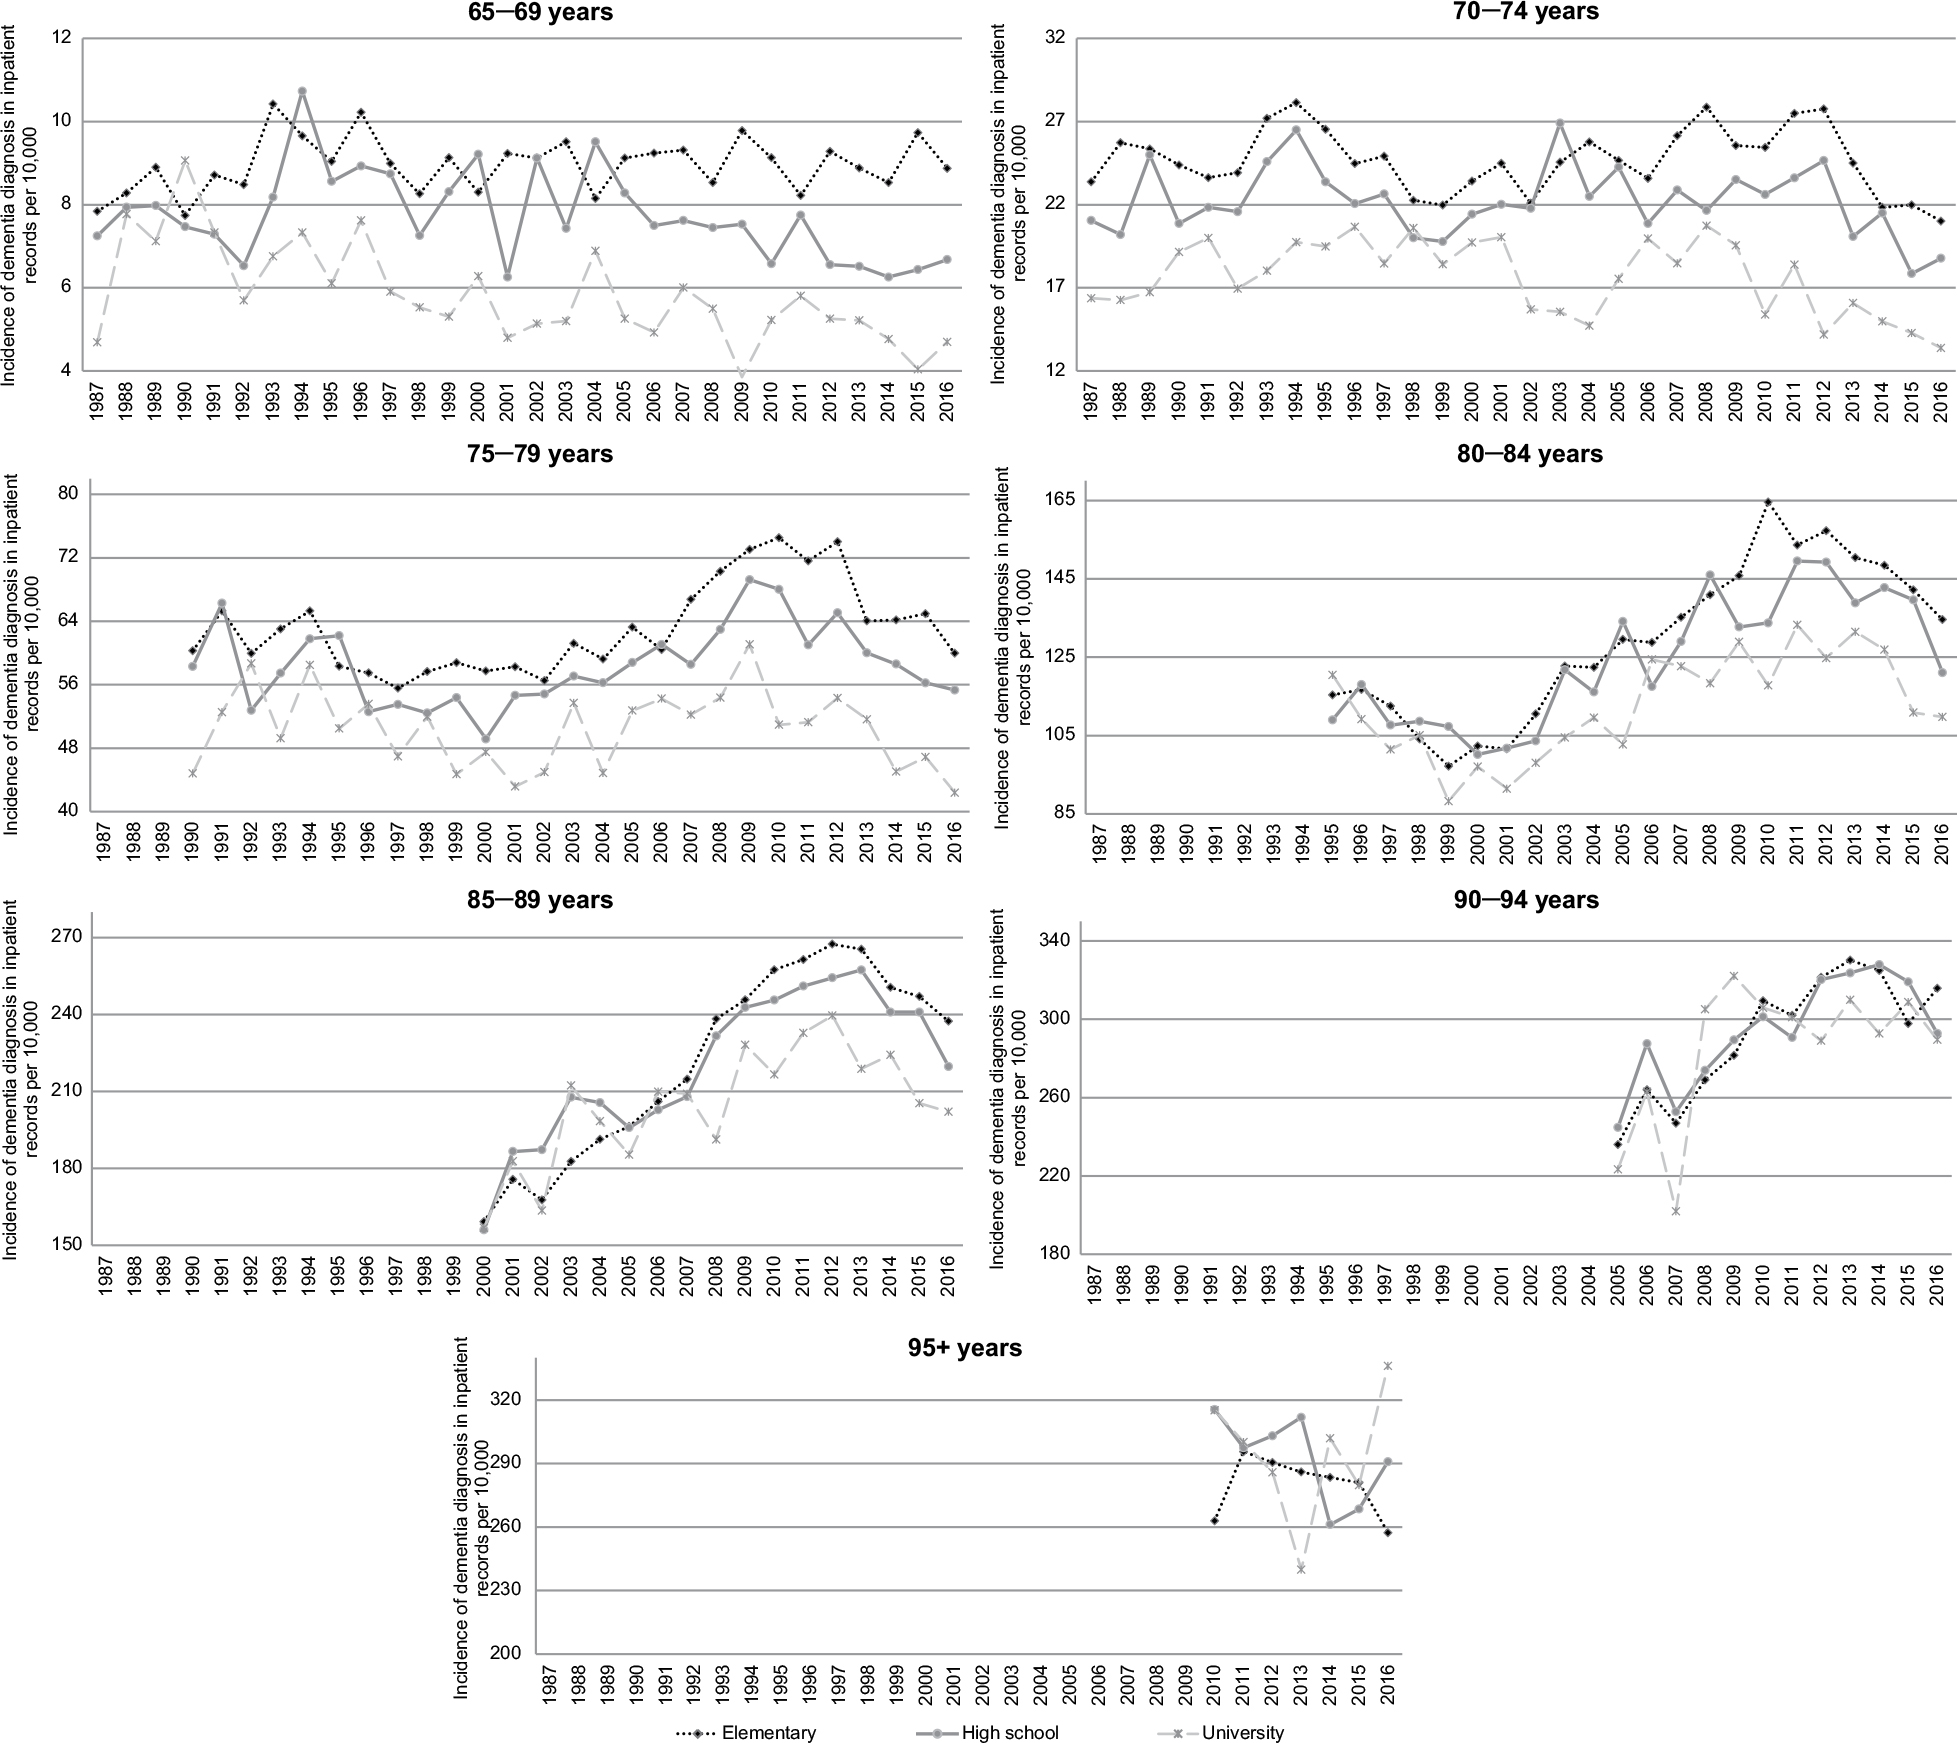 | Figure 4 Age- and education-stratified rates (per 10,000) of first diagnosis of dementia in hospital inpatient records for every year of follow-up. |
Association with age, sex, and education
The age- and sex-stratified plots (Figure 3A and B) suggest that the age is associated with the level of dementia incidence. The older the people are, the higher the incidence of a first dementia diagnosis in the inpatient records (range, 2–340 per 10,000), with the exception of those 95+ years. Age-stratified models (Table 3) show that, even within every age-group, a 1-year increase in age is associated with an increased HR of receiving a hospital diagnosis of dementia. The association is strongest in those aged 65–69 years and 70–74 years. The slope of increase dwindled in people in the older age strata. For example, the change was 14.2% in 80–84-year-olds, 7.7% in 85–89-year-olds, and 1.5% in 90–94-year-olds (Table 3). In people 95 years or older, the change in the HR of first dementia diagnosis decreased (–5.5%) for 1-year increase in age. In models adjusted for age and education and calendar year, women had significantly lower HR of receiving a hospital diagnosis of dementia until age of 85 years (Table 3). The results of the age-stratified models (Table 3) showed an educational gradient in the HR of receiving a dementia diagnosis up to 90 years of age, adjusting for age, sex, and calendar year.
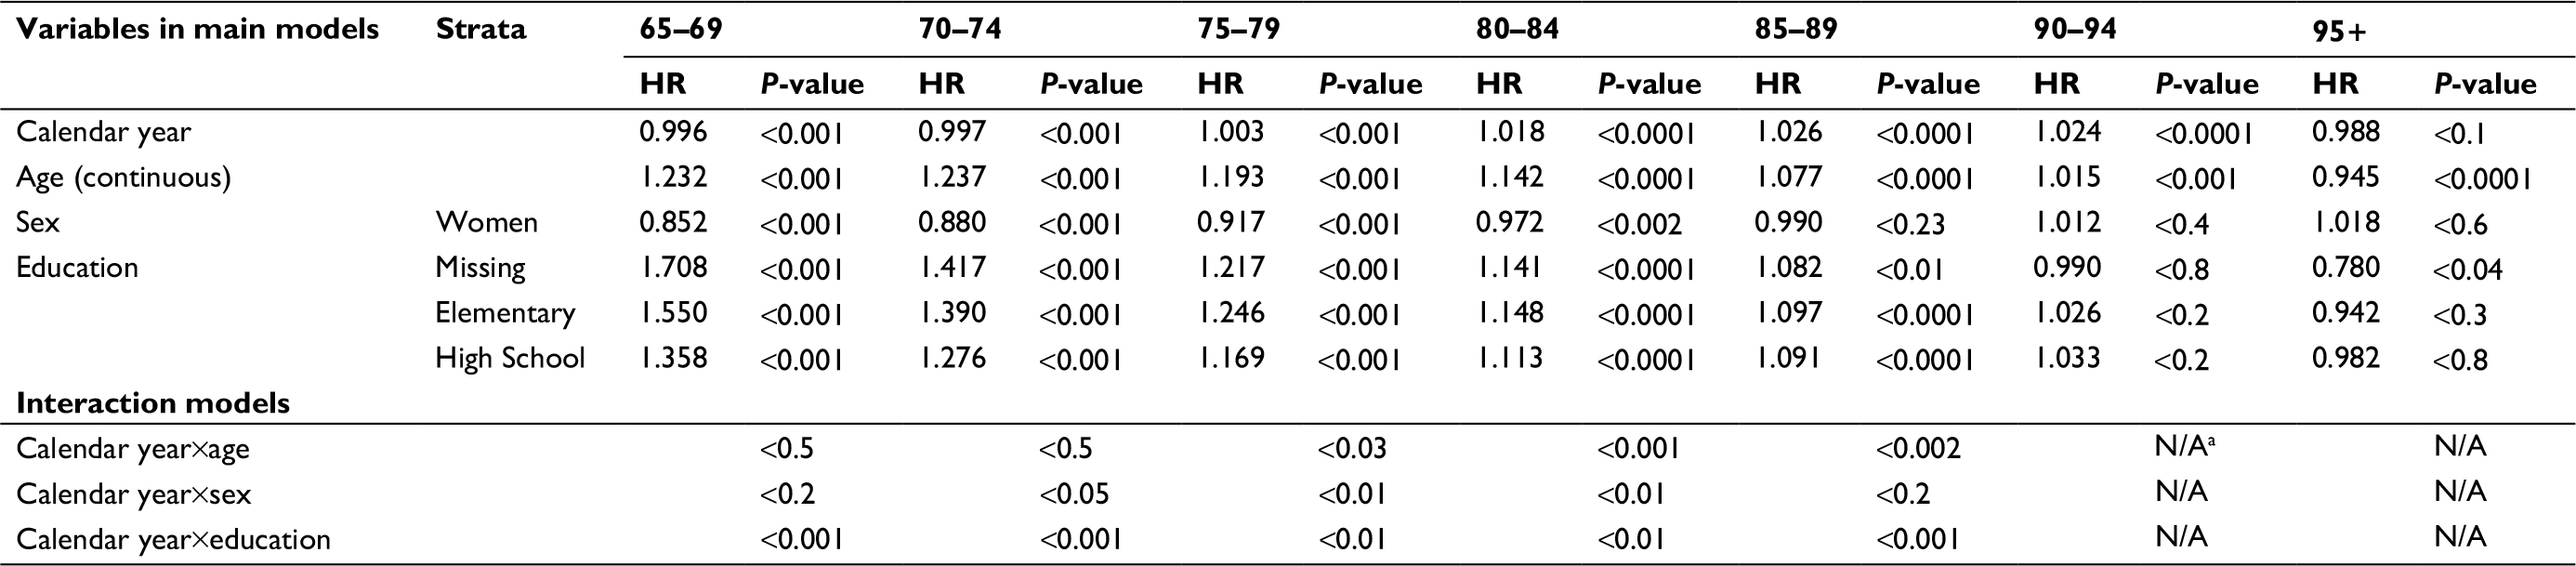 | Table 3 Results from discrete time logistics models with a complementary log-log link function stratified by age groups Notes: The main models estimate a hazard ratio (HR) that a person surviving to given age strata would receive a hospital diagnosis of dementia. If there were significant main effects, up to three interaction models were estimated for every age group strata. For simplicity, only P-values for interactions (from –2 log likelihood-ratio test) are reported. Interaction models estimates and CI estimates are available on request. aNonconvergence issue with the models due to small numbers of observations per year. |
Heterogeneity of trends
The trend in dementia incidence over time differed by age group, as described above. The heterogeneity by age group was observed for all people, for men and women separately, and for all educational levels (Figures 3 and 4). Plots stratified by sex, age, and educational level (data not presented) show that women younger than 95 years had lower dementia incidence than men in the corresponding age and educational categories. The plots do not indicate substantial differences in the trend by sex. Nevertheless, models stratified by age group (Table 3) show an interaction between sex and follow-up year (continuous) in 70–74 (P<0.05), 75–79 (P<0.01), and 80–84-year-olds (P<0.01). The plots (Figure 4) do not indicate substantial differences in the trend by educational level. Nevertheless, models stratified by age group (Table 3) indicate an interaction between educational level and follow-up year (continuous) for all age group strata below 90 years (P-values range from 0.01 to 0.001).
Cumulative incidence of dementia
The cumulative incidence of dementia, adjusted for the competing risk of death, was higher in each successive age group (Figure 5A and B). There were sex differences in cumulative incidence. In the young-olds, men had a slightly higher cumulative incidence of dementia than women. In the oldest-olds (those aged 85+ years), women had a higher lifetime risk of first diagnosis of dementia in inpatient records than men. The average gap in cumulative incidence of dementia between men and women increased with age. For example, the gap was approximately 2% in 85–89-year-olds, 3.4% in 90–94-year-olds, and 4% in 95+ year-olds. Nevertheless, the gap between the oldest-old men and women decreased during the follow-up period.
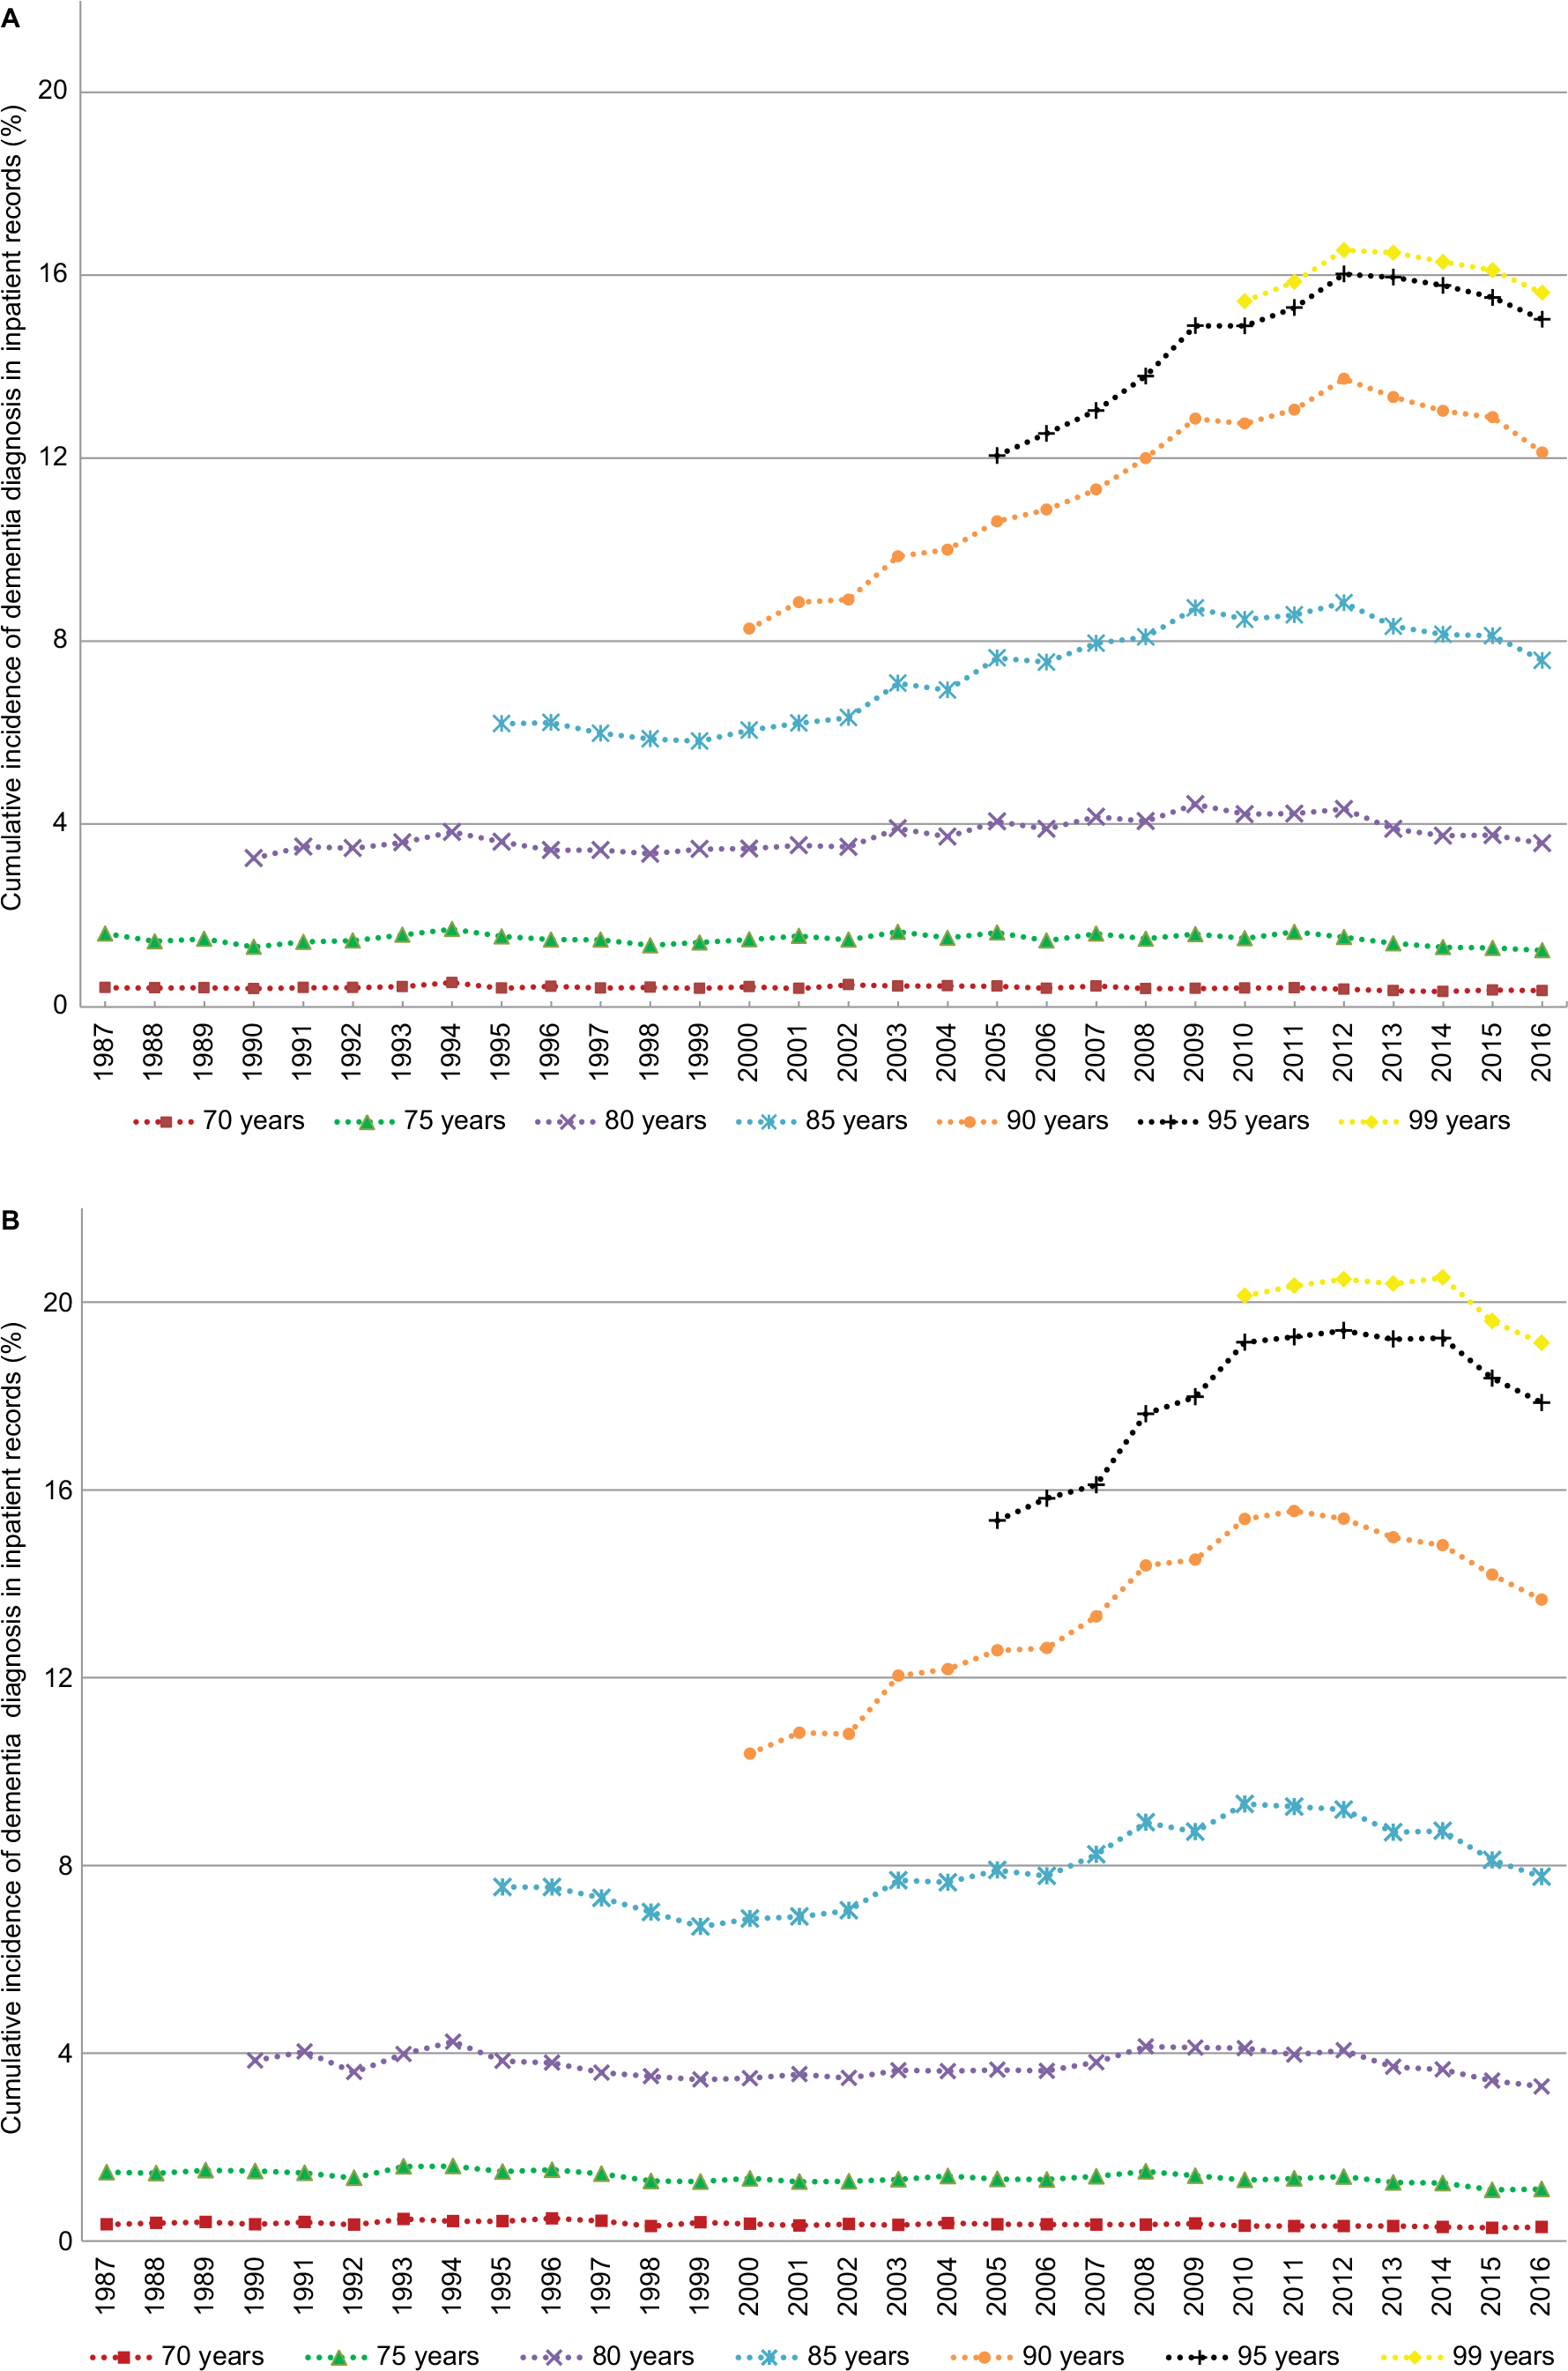 | Figure 5 (A) Age-stratified cumulative incidence (%) of first diagnosis of dementia in hospital inpatient records, adjusted for the competing risk of death, for every year of follow-up in men. (B) Age-stratified cumulative incidence (%) of first diagnosis of dementia in hospital inpatient records, adjusted for the competing risk of death, for every year of follow-up in women. |
Temporal changes in cumulative incidence varied by age group. For people in the two youngest age categories (65–69 and 70–74 years), cumulative incidence rates were relatively stable. Approximately 1.5% of those who survived up to 65 years received an inpatient diagnosis of dementia before they reached the age of 75 years. This number doubled (to 4%) by 80 years. Until approximately 2011 or 2012, cumulative incidence increased in people in the older age categories. The absolute increase in cumulative incidence was the highest for men (5.5%) and women (5.2%) younger than 90 years; it was next highest in those younger than 95 years (a 4% increase in both sexes). In the last 5 years of follow-up, cumulative incidence decreased in all age groups.
Discussion
This study aimed to evaluate the real-world changes in hospital dementia incidence in older adults in Sweden from 1987 to 2016. The results showed that after increase, especially in the oldest old, dementia incidence started to decrease in the last 5 years of the study period. The decrease occurred in both sexes and at all educational levels up to age 90 years. The actual probability of receiving a hospital diagnosis of dementia (cumulative incidence) also decreased during the final 5 years of the period, even though life expectancy increased.
Previous studies that used medical records or administrative data have predominantly reported trends over shorter periods of time (<10 years).10 One longer term (22 years of follow-up) study from 2017, which presented trends from Dutch primary health care data, found that dementia incidence was increasing.16 Several previous studies have used hospital records to examine the trends in dementia. Sposato et al33 reported that dementia incidence in Ontario, Canada, declined between 2002 and 2013, and Kosteniuk et al34 reported that dementia incidence declined between 2005 and 2013 in Saskatchewan, Canada. Three other studies that analyzed the trends between 1999 and 2010,35 1984 and 2001,36 and 1996 and 200337 found that dementia incidence increased over time in Wales, USA, and Taiwan, respectively. Varied follow-up periods, geographical regions, distribution of other risk factors, and methodologies can explain the diverse findings of the studies that examined health care records. Nevertheless, our results are in line with those of a narrative review, which found that dementia incidence had remained stable or begun to decline.10
One unique aspect of this study was our examination of differences in dementia incidence rates by educational level. On average, a higher educational level was associated with a lower incidence of dementia diagnosis in hospital inpatient records in older adults in Sweden up to age 90 years. To the best of our knowledge, none of the previous studies that used real-world data, such as registry data or electronic health records, have examined how dementia incidence trends differed by educational level, and only few smaller research cohort studies have done so. In the previously mentioned narrative review, only 4 of 14 cohort studies described how education was associated with time trends.10 Two studies showed that education did not alter the trend.13,38 The other two studies indicated that education was partly responsible for the observed decrease in dementia incidence.12,39 Our results also suggest that education is partly responsible, at least among the young olds. When we adjusted for education, the increase in dementia incidence in those younger than 85 years prior to 2011 was lower, and the decrease in dementia incidence after 2011 was enhanced in those younger than 80 years.
Yet, it is likely that other factors such as improved cardiovascular health, care of patients with cardiovascular problems, and lifestyle also play a role.40 For example, smoking rates among Swedish men have declined from 27% in 1988/1989 to 15% in 2004/2005.41 Furthermore, a previous study reported a decline (−1% to –1.3% per year) in stroke among men and women. Decline in myocardial infarction (–0.6%) was observed only in men during the last decade.42 In the Swedish oldest-olds, the risk of cardiovascular disease, stroke, and myocardial infarction also decreased and especially after 2001.43 Thus, about 10 years prior to our observed decline in dementia incidence, decreases in related risk factors were observed. To limit the possibility that our dementia trends are driven by hospitalization for other causes, we have adjusted for all-cause hospitalizations. The adjustment did not alter the observed dementia trends. However, despite the adjustment, we cannot exclude the possibility that dementia trends could be affected by changes in hospitalization for other causes.
In our graphical analysis, we did not find substantial differences in the temporal trend in dementia incidence by educational level. However, our models indicated that the trends might differ by education. Results from other studies are needed to shed more light on these findings. Yet, it seems that if the trends vary by education, these differences are small. Thus, we conclude that educational inequalities in dementia incidence, estimated using hospital inpatient records, have remained relatively stable. Since the proportion of people with only elementary education is decreasing over time, this group may be increasingly selected in terms of negative characteristics.44 Therefore, observing stability in relative inequalities may be viewed as positive development. However, due to the design of our study, we were unable to examine how our results are shaped by cohort replacement and to what extent they are shaped by contemporary social change. Delineating the impact of cohort and period effects is also an important venue for future research.
Age was strongly associated with dementia incidence. Our age-specific incidence rates over the entire follow-up period were lower than those based on European cohort studies. For example, incidence rates in England between 1989/1994 and 2008/2011 found by Matthews et al45 were nearly an order of magnitude larger than ours. Rates from a Dutch population-based study between 1990 and 2005 were twice as large as our estimates.7 In Sweden, a previous study inferred changes in incidence based on the relationship between prevalence and survival. Hence, no incidence rates were available for comparison.46 Identifying dementia cases from inpatient records is likely one of the reasons behind our lower rates. Rizzuto et al19 found that the Swedish inpatient records have about 50% sensitivity. Hence, nearly half of the dementia cases identified in population-based cohort studies may be missing in the NPR. This seems to be in line with the twice as large incidence rates reported in the Dutch study. However, our estimates fall within the CIs of incidence rates in the study that used primary care data.16
Our results also showed a leveling off of the HR of receiving hospital diagnosis of dementia in the oldest age strata. This is in contrast to the results of the majority of previous studies, which indicate that dementia incidence has increased in older adults of all ages.7,11–13 However, these studies have 85+ years as the oldest age category. Our oldest age stratum was 95+ years, and there were relatively few individuals (0.49% of the sample) in this category. Alternatively, our results may have been influenced by high rates of residence in nursing homes among the oldest old. Since care is often provided on-site, people living in institutions may be at a lower risk of hospitalization. According to a nationally representative Swedish study, 4% of the population older than 60 years lives in an institution,47 and many of these people likely have dementia.
We cannot exclude the possibility that the increase in dementia incidence up to 2011 or 2012 is driven, at least partly, by a growth in the proportion of older adults who live in the community rather than an institution. The number of beds in nursing homes decreased substantially during the study period. According to a government report, the number of nursing home beds for people aged 65+ years dropped by 30% between 1994 and 2011,48 and this decrease continued to 2015.49 At the same time, the number of older adults has increased. Even with these developments, the results of the current study show decreased incidence of dementia in the last half a decade, which suggests an improvement in public health. Our cumulative incidence results point to a similar conclusion. Even though life expectancy continued to increase, cumulative dementia incidence decreased over the last 5 years of the study period.
Previous studies reported mixed findings with regards to dementia incidence trends by sex. Grasset et al12 reported decrease in dementia incidence between 1988 and 1999 for women but not men. Matthews et al11 reported opposite results examining dementia incidence between 1991 and 2008. British study found that dementia incidence decreased in both sexes between 1985 and 2005, but the decrease was significant only for women.13 Even though our models indicated that the trends might differ by sex for those between 70 and 85 years of age, graphical analysis results did not show a substantial heterogeneity in dementia incidence trends by sex.
Our study found differences in incidence level by sex. For most age categories, the hospital records showed that women had a significantly lower dementia incidence than men, a result that contrasts with the findings of few other studies.11,13 Older women are likely to be informal caregivers to their spouses and assist their male spouses in obtaining care, which may influence the probability of receiving hospital dementia diagnosis for men. However, at older ages, women are more likely to live alone, which may in turn impact their number of hospitalizations and provision of dementia care.50 Alternatively, differences in mortality rate may explain these results. Women have a higher life expectancy than men. Subsequently, more men die before they reach 85 years. Thus, health selection may play a bigger role for men than women. Men’s life expectancy has increased more in the past several decades than women’s.10 Thus, if mortality played a role, inequalities between women and men in old age should be decreasing over time. We have indeed observed such a decrease, especially after 75 years of age, when comparing cumulative incidence (data not presented) and cumulative incidence adjusted for competing risk of death.
When comparing our results with those of previous studies, it is essential to keep in mind that possible differences may stem from our use of inpatient hospital data. For example, Rizzuto et al19 found a 5.5-year gap between dementia diagnosis in longitudinal studies and first hospital diagnosis of dementia. The age trends in our study may have been affected by such a delay, which could cause discrepancies between our results and those of other studies. Another major drawback was the moderate sensitivity (47.3%; 95% CI, 44.1%–50.55%) of the NPR in ascertaining dementia cases reported by Rizzuto et al. However, Rizzuto et al may have underestimated the sensitivity by including 23 years of follow-up when NPR did not have a national coverage. Nevertheless, there probably still is a substantial misclassification of the dementia outcome in our study. Thus, the denominator for our rates calculation (at risk population) includes dementia cases. This can be one reason behind our lower incidence rates when comparing to other studies. Yet, the validation study reported nearly perfect specificity of dementia diagnosis (99.8; 95% CI, 99.7–99.8).19 If the sensitivity of NPR has not changed over time, the trends observed in our study indeed reflect the temporal developments even if they do not capture the true levels of incidence.
However, if the sensitivity of the NPR has changed over time, the observed trends could be confounded. None of the health care factors we have examined substantially altered the observed trends in dementia incidence. Yet, we cannot exclude the possibility that other factors such as changes in medical reconciliation practices may have influenced our results. We hypothesize that hospital records are more likely to capture severe dementia cases. Due to increases in public and clinical awareness of dementia during the study period, we presumably underestimated the number of mild dementia cases. If the detection of mild cases has changed over time, this could have contributed to the observed increase prior to 2011. However, increased detection of mild cases would not explain the observed decrease in dementia incidence after 2011. Yet, it is possible that management of milder cases, for example, with medication, may influence symptoms and their detection in the hospital setting in the later years of our follow-up. The management of dementia has likely improved as a consequence of the first national guidelines on dementia care,51 which were published in 2010. However, due to the magnitude and abruptness of the 2011 change we believe other factors also must be at play.
The use of real-world data can be seen as both strength and weakness. One major weakness stemming from the real-world data is susceptibility to changes in health care practices. We considered the stability of diagnostic procedures by including a covariate that indicated ICD period, which did not alter the main findings. We also took into account changes in care that resulted from the Elderly Reform Act (Ädelreformen) and found no discontinuity in trends around the time the reform was implemented (1992). The reform decreased the number of hospital beds.52 However, it may have affected the length rather than the number of stays. A Canadian study found that 89% of home care clients with dementia had multimorbidity and that the risk of hospitalization increased with higher number of comorbid conditions.53 Therefore, we hypothesize that Swedish individuals with dementia, especially those with severe dementia, also likely have complications and comorbidities that require hospitalization and thus would not be missed in the NPR. We also considered changes in the proportion of all-cause hospitalization by age, sex, and educational level. In the majority of the models, the proportion was significantly associated with the HR of receiving a hospital diagnosis of dementia, but the main results remained stable.
This study also had many strengths. These included the long observation period (30 years) and the large number of person-years (approximately 46 million) and first hospital diagnoses of dementia (n=270,413). While susceptibility to changes in health care practices is a weakness of our study, our inclusion of health care practice confounders in the analysis of trends in dementia incidence in inpatient records is a strength compared to previous studies. Another strength was the national coverage of the data sources, which limited the selection and attrition. Limiting these factors was important since previous studies have found differences in dementia prevalence and incidence between participants and nonparticipants.54
Conclusion
Our results provide more evidence that dementia incidence may be declining during the last half a decade. They also suggest that at least in Swedish hospitals, the number of new patients with dementia may decline in the future. The decrease in dementia incidence was observed in both sexes and all educational levels up to 90 years of age, which suggests that those groups have experienced comparable trends. Nevertheless, we found educational inequalities in the level of dementia incidence in inpatient records, since higher levels of education were associated with lower dementia incidence.
Acknowledgments
The study reported in this article was originally a master’s thesis project of LMQ at Karolinska Institutet (2016), under the supervision of AL and DS.55 Furthermore, it was presented as an oral presentation at the Alzheimer’s Association International Conference (AAIC); July 22, 2018 in Chicago, IL, USA. This work was supported by a program grant from FORTE (2013–2277) and a “distinguished younger researcher” grant (to ML) from the Swedish Research Council (446-2013-7189). The funders had no role in study design, data collection and analysis, decision to publish, or preparation of the manuscript.
Author contributions
DS had full access to all the data, conceived and designed the study, performed the statistical analysis, interpreted the data, and drafted the manuscript. All authors contributed to interpretation of the data and critically revised the manuscript for important intellectual content. MLQ performed initial statistical analyses as a part of a master thesis project. APdL assisted in planning statistical analyses. SW assisted with data extraction and preparation. AL and ML obtained funding. All the authors gave approval for the final version of the manuscript and agreed that questions related to the accuracy or integrity of any part of the work will be appropriately investigated and resolved.
Disclosure
The authors report no conflicts of interest in this work.
References
Prince MJ, Wimo A, Guerchet MM, Ali GC, Wu YT, Prina M. World Alzheimer Report 2015 - The Global Impact of Dementia: An analysis of prevalence, incidence, cost and trends. London: Alzheimer’s Disease International; 2015. | ||
Ritchie K, Kildea D. Is senile dementia “age-related” or “ageing-related”? Evidence from meta-analysis of dementia prevalence in the oldest old. Lancet. 1995;346(8980):931–934. | ||
Larson EB, Yaffe K, Langa KM. New insights into the dementia epidemic. N Engl J Med. 2013;369(24):2275–2277. | ||
Christensen K, Doblhammer G, Rau R, Vaupel JW. Ageing populations: the challenges ahead. Lancet. 2009;374(9696):1196–1208. | ||
Rocca WA, Petersen RC, Knopman DS, et al. Trends in the incidence and prevalence of Alzheimer’s disease, dementia, and cognitive impairment in the United States. Alzheimers Dement. 2011;7(1):80–93. | ||
Manton KC, Gu XL, Ukraintseva SV. Declining prevalence of dementia in the U.S. elderly population. Adv Gerontol. 2005;16:30–37. | ||
Schrijvers EM, Verhaaren BF, Koudstaal PJ, Hofman A, Ikram MA, Breteler MM. Is dementia incidence declining?: Trends in dementia incidence since 1990 in the Rotterdam Study. Neurology. 2012;78(19):1456–1463. | ||
Mathillas J, Lövheim H, Gustafson Y. Increasing prevalence of dementia among very old people. Age Ageing. 2011;40(2):243–249. | ||
Li S, Yan F, Li G, et al. Is the dementia rate increasing in Beijing? Prevalence and incidence of dementia 10 years later in an urban elderly population. Acta Psychiatr Scand. 2007;115(1):73–79. | ||
Wu YT, Beiser AS, Breteler MMB, et al. The changing prevalence and incidence of dementia over time - current evidence. Nat Rev Neurol. 2017;13(6):327. | ||
Matthews FE, Arthur A, Barnes LE, et al. A two-decade comparison of prevalence of dementia in individuals aged 65 years and older from three geographical areas of England: results of the Cognitive Function and Ageing Study I and II. Lancet. 2013;382(9902):1405–1412. | ||
Grasset L, Brayne C, Joly P, et al. Trends in dementia incidence: Evolution over a 10-year period in France. Alzheimers Dement. 2016;12(3):272–280. | ||
Satizabal CL, Beiser AS, Chouraki V, Chêne G, Dufouil C, Seshadri S. Incidence of Dementia over Three Decades in the Framingham Heart Study. N Engl J Med. 2016;374(6):523–532. | ||
Livingston G, Sommerlad A, Orgeta V, et al. Dementia prevention, intervention, and care. Lancet. 2017;390(10113):2673–2734. | ||
Chibnik LB, Wolters FJ, Bäckman K, et al. Trends in the incidence of dementia: design and methods in the Alzheimer Cohorts Consortium. Eur J Epidemiol. 2017;32(10):931–938. | ||
van Bussel EF, Richard E, Arts DL, et al. Dementia incidence trend over 1992-2014 in the Netherlands: Analysis of primary care data. PLoS Med. 2017;14(3):e1002235. | ||
Ludvigsson JF, Andersson E, Ekbom A, et al. External review and validation of the Swedish national inpatient register. BMC Public Health. 2011;11(1):450. | ||
Barry AE. How attrition impacts the internal and external validity of longitudinal research. J Sch Health. 2005;75(7):267–270. | ||
Rizzuto D, Feldman AL, Karlsson IK, Dahl Aslan AK, Gatz M, Pedersen NL. Detection of Dementia Cases in Two Swedish Health Registers: A Validation Study. J Alzheimers Dis. 2018;61(4):1301–1310. | ||
Wg H, Daniel; Kowal P. An Aging World: 2015. United States Census Bureau; 2016. | ||
Statistics Sweden. Sveriges framtida befolkning 2017–2060 [The future population of Sweden 2017–2060]; 2018. Available from: https://www.scb.se/contentassets/fee6de8eb7dc43bd9b3f36da925b5458/be0401_2017i60_sm_be18sm1701.pdf. Accessed May 15, 2018. Swedish. | ||
Brooke HL, Talbäck M, Hörnblad J, et al. The Swedish cause of death register. Eur J Epidemiol. 2017;32(9):765–773. | ||
Ludvigsson JF, Andersson E, Ekbom A, et al. External review and validation of the Swedish national inpatient register. BMC Public Health. 2011;11:450. | ||
Gatz M, Fratiglioni L, Johansson B, et al. Complete ascertainment of dementia in the Swedish Twin Registry: the HARMONY study. Neurobiol Aging. 2005;26(4):439–447. | ||
Garcia-Ptacek S, Kåreholt I, Cermakova P, Rizzuto D, Religa D, Eriksdotter M. Causes of Death According to Death Certificates in Individuals with Dementia: A Cohort from the Swedish Dementia Registry. J Am Geriatr Soc. 2016;64(11):e137–e142. | ||
Statistics Sweden. Arbetsmarknad och utbildning bakgrundsfakta 2016:1; Longitudinell integrationsdatabas för Sjukförsäkrings- och Arbetsmarknadsstudier (LISA) 1990–2013 [Background Facts 2016:1, Integrated database for labour market research]; 2016. Available from: https://www.scb.se/Statistik/AM/AM9901/_dokument/AM9901_1990I13_BR_AM76BR1601.pdf. Accessed July 6, 2018. Swedish. | ||
Beiser A, D’Agostino RB, Seshadri S, Sullivan LM, Wolf PA. Computing estimates of incidence, including lifetime risk: Alzheimer’s disease in the Framingham Study. The Practical Incidence Estimators (PIE) macro. Stat Med. 2000;19(11-12):1495–1522. | ||
Allison PD. Survival Analysis Using SAS: A Practical Guide. Cary, NC: Sas Institute; 2010. | ||
Karampampa K, Ahlbom A, Michaëlsson K, Andersson T, Drefahl S, Modig K. Declining incidence trends for hip fractures have not been accompanied by improvements in lifetime risk or post-fracture survival--A nationwide study of the Swedish population 60 years and older. Bone. 2015;78:55–61. | ||
Quan H, Li B, Duncan Saunders L, et al. Assessing Validity of ICD-9-CM and ICD-10 Administrative Data in Recording Clinical Conditions in a Unique Dually Coded Database. Health Serv Res. 2008;43(4):1424–1441. | ||
Karampampa K, Andersson T, Drefahl S, Ahlbom A, Modig K. Does improved survival lead to a more fragile population: time trends in second and third hospital admissions among men and women above the age of 60 in Sweden. PLoS One. 2014;9(6):e99034. | ||
Torssander J, Ahlbom A, Modig K. Four decades of educational inequalities in hospitalization and mortality among older Swedes. PLoS One. 2016;11(3):e0152369. | ||
Sposato LA, Kapral MK, Fang J, et al. Declining incidence of stroke and dementia: coincidence or prevention opportunity? JAMA Neurol. 2015;72(12):1529–1531. | ||
Kosteniuk JG, Morgan DG, O’Connell ME, et al. Simultaneous temporal trends in dementia incidence and prevalence, 2005-2013: a population-based retrospective cohort study in Saskatchewan, Canada. Int Psychogeriatr. 2016;28(10):1643–1658. | ||
Ganiy Opeyemi Abdulrahman J. Alzheimer’s disease: Current trends in Wales. Oman Med J. 2014;29(4):280. | ||
Ukraintseva S, Sloan F, Arbeev K, Yashin A. Increasing rates of dementia at time of declining mortality from stroke. Stroke. 2006;37(5):1155–1159. | ||
Chien IC, Lin YC, Chou YJ, et al. Treated prevalence and incidence of dementia among National Health Insurance enrollees in Taiwan, 1996-2003. J Geriatr Psychiatry Neurol. 2008;21(2):142–148. | ||
de Bruijn RF, Bos MJ, Portegies ML, et al. The potential for prevention of dementia across two decades: the prospective, population-based Rotterdam Study. BMC Med. 2015;13(1):132. | ||
Langa KM, Larson EB, Crimmins EM, et al. A Comparison of the Prevalence of Dementia in the United States in 2000 and 2012. JAMA Intern Med. 2017;177(1):51–58. | ||
Deckers K, van Boxtel MP, Schiepers OJ, et al. Target risk factors for dementia prevention: a systematic review and Delphi consensus study on the evidence from observational studies. Int J Geriatr Psychiatry. 2015;30(3):234–246. | ||
National Board of Health and Welfare. Folkhälsorapport 2009 [Public Health Report 2009]. Stockholm: Socialstyrelsen; 2009. Swedish. | ||
Modig K, Drefahl S, Andersson T, Ahlbom A. The aging population in Sweden: can declining incidence rates in MI, stroke and cancer counterbalance the future demographic challenges? Eur J of Epidemiol. 2012;27(2):139–145.0 | ||
Modig K, Andersson T, Drefahl S, Ahlbom A. Age-specific trends in morbidity, mortality and case-fatality from cardiovascular disease, myocardial infarction and stroke in advanced age: evaluation in the Swedish population. PLoS One. 2013;8(5):e64928. | ||
Mackenbach JP. The persistence of health inequalities in modern welfare states: the explanation of a paradox. Soc Sci Med. 2012;75(4):761–769. | ||
Matthews FE, Stephan BC, Robinson L, et al. A two decade dementia incidence comparison from the Cognitive Function and Ageing Studies I and II. Nat Commun. 2016;7:11398. | ||
Qiu C, von Strauss E, Bäckman L, Winblad B, Fratiglioni L. Twenty-year changes in dementia occurrence suggest decreasing incidence in central Stockholm, Sweden. Neurology. 2013;80(20):1888–1894. | ||
Fratiglioni L, Ding M, Santoni G, et al. Demensförekomst i Sverige: geografiska och tidsmässiga trender 2001-2013. [Dementia occurrence in Sweden: geographical and temporal trends 2001–2013]. Aging Res Center. 2017. Available from: https://snacsweden.files.wordpress.com/2018/03/snac-rapport-demensfc3b6rekomst-i-sverige-geografiska-och-tidsmc3a4ssiga-trender-2001-2013.pdf. Accessed July 15, 2018. Swedish. | ||
National Board of Housing, Building, and Planning (Boverket). Utvärdering av investeringsstödet för äldreboende [Evaluation of investments into elderly housing]; 2013. Available from: https://www.boverket.se/globalassets/publikationer/dokument/2013/utvardering-investeringsstod-aldreboende.pdf. Accessed July 13, 2018. Swedish. | ||
National Board of Health and Welfare. Statistik om särskilt boende [Statistics on nursing homes]; 2016. Available from: https://www.socialstyrelsen.se/Lists/Artikelkatalog/Attachments/20404/2016-12-5.pdf. Accessed July 6, 2018. Swedish. | ||
Cermakova P, Nelson M, Secnik J, et al. Living Alone with Alzheimer’s Disease: Data from SveDem, the Swedish Dementia Registry. J Alzheimers Dis. 2017;58(4):1265–1272. | ||
National Board of Health and Welfare. Nationella riktlinjer för vård och omsorg vid demenssjukdom 2010 - stöd för styrning och ledning [The National Guidelines for Dementia Care 2010 - Support for Planning and Management]; 2010. Available from: http://www.demenscentrum.se/globalassets/utbildning_pdf/nationella_riktlinjer_vard_omsorg_vid_demens.pdf. Accessed October 26, 2018. | ||
Borgström A. Sverige har lägst antal vårdplatser i Europa [Sweden has the lowest number of healthcare places in Europe]. Läkartidningen [Journal of Swedish Medical Association]. 2007;104(6):396–397. Swedish. | ||
Mondor L, Maxwell CJ, Hogan DB, et al. Multimorbidity and healthcare utilization among home care clients with dementia in Ontario, Canada: A retrospective analysis of a population-based cohort. PLoS Med. 2017;14(3):e1002249. | ||
Knopman DS, Roberts RO, Pankratz VS, et al. Incidence of dementia among participants and nonparticipants in a longitudinal study of cognitive aging. Am J Epidemiol. 2014;180(4):414–423. | ||
Quiroga ML. Temporal trends for dementia hospitalisations in Sweden [master’s thesis]. Stockholm: Karolinska Institutet; 2016. Available from: https://openarchive.ki.se/xmlui/handle/10616/46519. Accessed October 16, 2018. |
 © 2018 The Author(s). This work is published and licensed by Dove Medical Press Limited. The full terms of this license are available at https://www.dovepress.com/terms.php and incorporate the Creative Commons Attribution - Non Commercial (unported, v3.0) License.
By accessing the work you hereby accept the Terms. Non-commercial uses of the work are permitted without any further permission from Dove Medical Press Limited, provided the work is properly attributed. For permission for commercial use of this work, please see paragraphs 4.2 and 5 of our Terms.
© 2018 The Author(s). This work is published and licensed by Dove Medical Press Limited. The full terms of this license are available at https://www.dovepress.com/terms.php and incorporate the Creative Commons Attribution - Non Commercial (unported, v3.0) License.
By accessing the work you hereby accept the Terms. Non-commercial uses of the work are permitted without any further permission from Dove Medical Press Limited, provided the work is properly attributed. For permission for commercial use of this work, please see paragraphs 4.2 and 5 of our Terms.