")
Back to Journals » Risk Management and Healthcare Policy » Volume 13
Thigh Circumference and Risk of All-Cause, Cardiovascular and Cerebrovascular Mortality: A Cohort Study
Authors Chen C , Liu L, Huang J, Yu Y , Shen G , Lo K , Huang Y, Feng Y
Received 28 May 2020
Accepted for publication 15 September 2020
Published 8 October 2020 Volume 2020:13 Pages 1977—1987
DOI https://doi.org/10.2147/RMHP.S264435
Checked for plagiarism Yes
Review by Single anonymous peer review
Peer reviewer comments 2
Editor who approved publication: Professor Marco Carotenuto
Chao-lei Chen,1,* Lin Liu,1,* Jia-yi Huang,1 Yu-ling Yu,1 Geng Shen,1 Kenneth Lo,1,2 Yu-qing Huang,1 Ying-qing Feng1
1Department of Cardiology, Hypertension Research Laboratory, Guangdong Provincial Key Laboratory of Coronary Heart Disease Prevention, Guangdong Cardiovascular Institute, Guangdong Provincial People’s Hospital, Guangdong Academy of Medical Sciences, Guangzhou 510080, People’s Republic of China; 2Centre for Global Cardiometabolic Health, Department of Epidemiology, Brown University, Providence, RI, USA
*These authors contributed equally to this work
Correspondence: Yu-qing Huang; Ying-qing Feng Department of Cardiology, Hypertension Research Laboratory, Guangdong Provincial Key Laboratory of Coronary Heart Disease Prevention, Guangdong Cardiovascular Institute
Guangdong Provincial People’s Hospital, Guangdong Academy of Medical Sciences, No. 106, Zhongshan Second Road, Yuexiu District, Guangzhou 510080, People’s Republic of China
Tel/Fax +86-20-83827812
Email [email protected]; [email protected]
Purpose: The relationship between thigh circumference and all-cause and cause-specific mortality has not been consistent. We aimed to examine how thigh circumference associates with all-cause, cardiovascular, and cerebrovascular mortality among US adults.
Patients and Methods: This cohort study included 19,885 US adults who participated in the 1999– 2006 National Health and Nutrition Examination Survey (NHANES) with thigh circumference being measured at baseline, and survival status was ascertained until 31 December 2015. We used Cox proportional hazards models to estimate adjusted hazard ratios (HRs) and 95% confidence intervals (CI) for mortality according to thigh circumference in quartiles. Kaplan–Meier survival curve and restricted cubic spline regression were performed to evaluate the prospective association. Finally, subgroup analyses by age, gender, body mass index (BMI), and medical history at baseline were conducted.
Results: During a median follow-up of 11.9 years, 3513 cases of death, 432 death cases due to cardiovascular disease, and 143 death cases due to cerebrovascular disease have occurred. Multivariate Cox regression indicated that every 1cm increase in thigh circumference was related to 4% and 6% decreased risk of all-cause mortality and cardiovascular mortality, respectively. Compared to the reference group, the highest quartile of thigh circumference significantly decreased all-cause mortality by 21% (HR 0.79, 95% CI 0.62– 1.00, P< 0.05). However, the association of thigh circumference with cerebrovascular mortality was not significant. BMI was a significant effect modifier among individuals with a BMI of less than 25 kg/m2 (P< 0.0001).
Conclusion: A low thigh circumference appears to be associated with increased risk of all-cause and cardiovascular mortality, but not cerebrovascular mortality.
Keywords: thigh circumference, all-cause mortality, cardiovascular mortality, cerebrovascular mortality
Introduction
Obesity is a growing health burden, which is associated with higher rates of mortality.1 Body mass index (BMI) is a commonly used indicator for adiposity in epidemiological research and clinical practice. Recent evidence from meta-analyses suggested some novel surrogates for abdominal obesity, such as waist circumference and waist-to-height ratio, have better screening power for cardiometabolic risk than BMI.2,3 Although central obesity plays an important role in obesity-related mortality, peripheral adiposity in lower body was found to have contrasting (i.e. beneficial vs. detrimental) associations with long-term blood pressure, subclinical atherosclerosis, and with the risk of incident diabetes comparing with upper body.4–6 Thigh circumference often reflects body muscle mass and peripheral subcutaneous fat.7 However, fewer studies have reported the relationship between thigh circumference and the risk of mortality.
Cardiovascular disease is one of the most common causes of death worldwide.8 As an easily measured anthropometric index, small thigh circumference was found to associate with increased morbidity from heart disease and higher risk of mortality in general population.9 Moreover, previous studies have demonstrated inverse association between thigh circumference and cardiometabolic diseases, including dyslipidemia, peripheral arterial disease, and type 2 diabetes.10–12 Small thigh circumference is also associated with the onset of dementia, a disease of growing prevalence and higher rates of mortality.13,14 However, to the best of our knowledge, most studies were conducted cross-sectionally or with small sample size. Few studies have examined the association of thigh circumference with all-cause and cause-specific mortality. Evidence from a large cohort among general population is needed to address the knowledge gap.
Methods
Study Population
The NHANES is a national representative survey of the civilian, non-institutionalized US population sponsored by the Centers for Disease Control and Prevention (CDC) and has been conducted for more than 50 years in the United States. In the 1999–2006 NHANES study, there were a total of 4,1474 participants. In our analysis, we included people aged ≥18 years old. However, subjects that did not have data on mortality status and thigh circumference were excluded. After applying the eligibility criteria, we included 19,885 participants for final analysis (Figure 1). The survival status of participants was followed through December 31, 2015. The survey protocol was approved by the Institutional Review Board of the Centers for Disease Control and Prevention. Written informed consent was obtained from all participants.
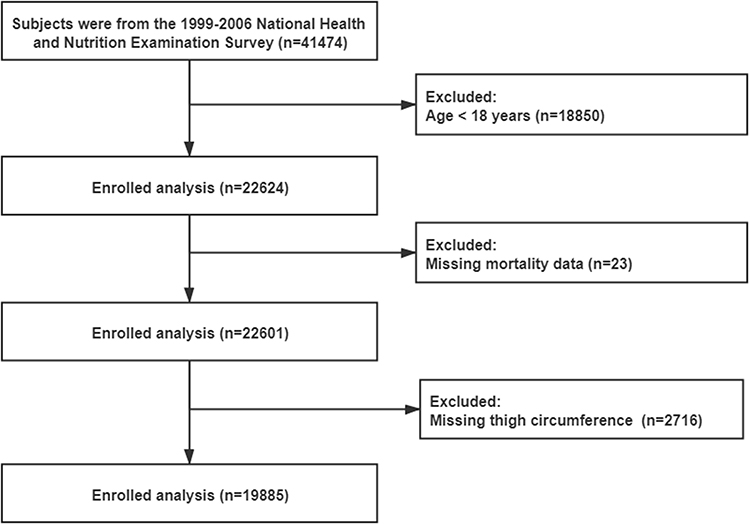 |
Figure 1 Flowchart of the patients who participated in the present study. |
Data Collection
Questionnaires were provided to participants at baseline to acquire demographics information (age, gender, and race), smoking status, alcohol consumption, levels of moderate physical activity, personal medical history (cardiovascular diseases, hypertension, diabetes and any cancer), and medication history (antihypertensive drugs and anti-diabetic drugs). Physical assessments and laboratory tests were performed to examine thigh circumference, waist circumference, systolic blood pressure (SBP), diastolic blood pressure (DBP), fasting blood glucose (FBG), total cholesterol (TC), triglyceride (TG), low-density lipoprotein cholesterol (LDL-C), high-density lipoprotein cholesterol (HDL-C), and estimated glomerular filtration rate (eGFR). BMI was calculated using mass (kg) divided by the square of height (m2). Diabetes was defined by FBG≥126 mg/dl, self-reported status, taking hypoglycemic agents or HbA1c ≥6.5%. Hypertension was defined by blood pressure ≥130/80mmHg, self-reported status or taking antihypertensive drugs, which was the definition according to the 2017 American College of Cardiology/American Heart Association (ACC/AHA) Guideline for the Prevention, Detection, Evaluation and Management of High Blood Pressure in Adults.15,16 Estimated GFR (eGFR) was computed using Modification of Diet in Renal Disease (MDRD) formula.17
The measurement of thigh circumference was performed by trained research staff using a standardized position, i.e. standing with most of the weight on the left leg with the right leg forward, knee slightly flexed, and soles of both feet flat on the floor. The measurements of thigh circumference were made on the right side of the mid-thigh. If participants have been amputated, had a medical condition or a medical appliance that prevented measurements from being taken on the right side of the thigh, measurements were taken on the left side. Detailed procedures can be referred to the website (https://wwwn.cdc.gov/nchs/nhanes/Default.aspx).
Clinical Outcome
Death cases from all-cause, cardiovascular disease or cerebrovascular disease until December 31, 2015, were the primary outcomes of interest. Mortality data were extracted from the 1999–2006 NHANES public-use linked mortality files. We examined the time from enrollment to mortality or censoring. International Classification of Diseases, Tenth Revision codes (I00-I09, I11, I13, I20-I51) were used to define cardiovascular deaths and (I60-I69) for cerebrovascular deaths. Participants who were not matched with any death records were considered to be alive throughout the follow-up period.
Statistical Analysis
Continuous variables were expressed as mean ± standard deviation (SD) for normally distributed variables or median (interquartile range) if the data were not normally distributed. Categorical variables were presented as number (n) and percentage (%). The One-Way ANOVA, Kruskal–Wallis H-test or chi-square tests were used to assess subgroup differences according to baseline thigh circumference in quartiles. Cox proportional hazards models were used to estimate adjusted hazard ratio (HR) and 95% confidence intervals (CI) for mortality according to baseline thigh circumference in quartiles (Q1, Q2, Q3, Q4). Age, gender, race, smoking status, alcohol consumption, BMI, moderate activity, waist circumference, TC, anti-diabetic drugs, eGFR, diabetes, hypertension, any cardiovascular diseases or cancer at baseline were included in the fully adjusted regression model. Kaplan–Meier survival curves for cumulative incidence of all-cause, cardiovascular and cerebrovascular mortality between different categories was plotted and was compared by Log rank tests. In addition, we used restricted cubic spline regression to explore the linearity in relationship after adjusting for age, gender, race, smoking status, alcohol consumption, BMI, moderate activity, waist circumference, SBP, TC, antihypertensive drugs, anti-diabetic drugs, eGFR, diabetes, hypertension, and any cardiovascular diseases or cancer at baseline. Three knots at quartiles 25th, 50th, and 75th were chosen. The interaction between thigh circumference and subgroup variables were inspected by the likelihood ratio test. In the interaction test, when analyzing the effect variable, except for the effect variable itself, all other confounding variables mentioned above were adjusted. To test the robustness of our results, sensitivity analyses were conducted by excluding participants with cancer at baseline. A two-sided P <0.05 was considered as statistically significant. All statistical analyses were performed using R version 3.3.2 (R Foundation for Statistical Computing, Vienna, Austria).
Results
Baseline Characteristics
Table 1 shows the baseline characteristics of the analytical cohort as stratified by thigh circumference in quartiles. In total, 19,885 patients (52.07% females) were included in this analysis with mean age of 45.62 ± 20.13 years. Of these, 19,460 (47.57%) participants were white, 9177 (51.75%) never smoked and 5241 (26.4%) had the habit of alcohol drinking. In addition, the proportion of participants with cardiovascular diseases, hypertension, diabetes, or any cancer at baseline accounted was 4.18%, 32.56%, 11.58%, and 7.5%, respectively. During a median follow-up of 11.9 years, 3513 cases of death, 432 death cases due to cardiovascular disease, and 143 death cases due to cerebrovascular disease have occurred. All baseline variables differed significantly among the thigh circumference in quartiles (all P<0.05).
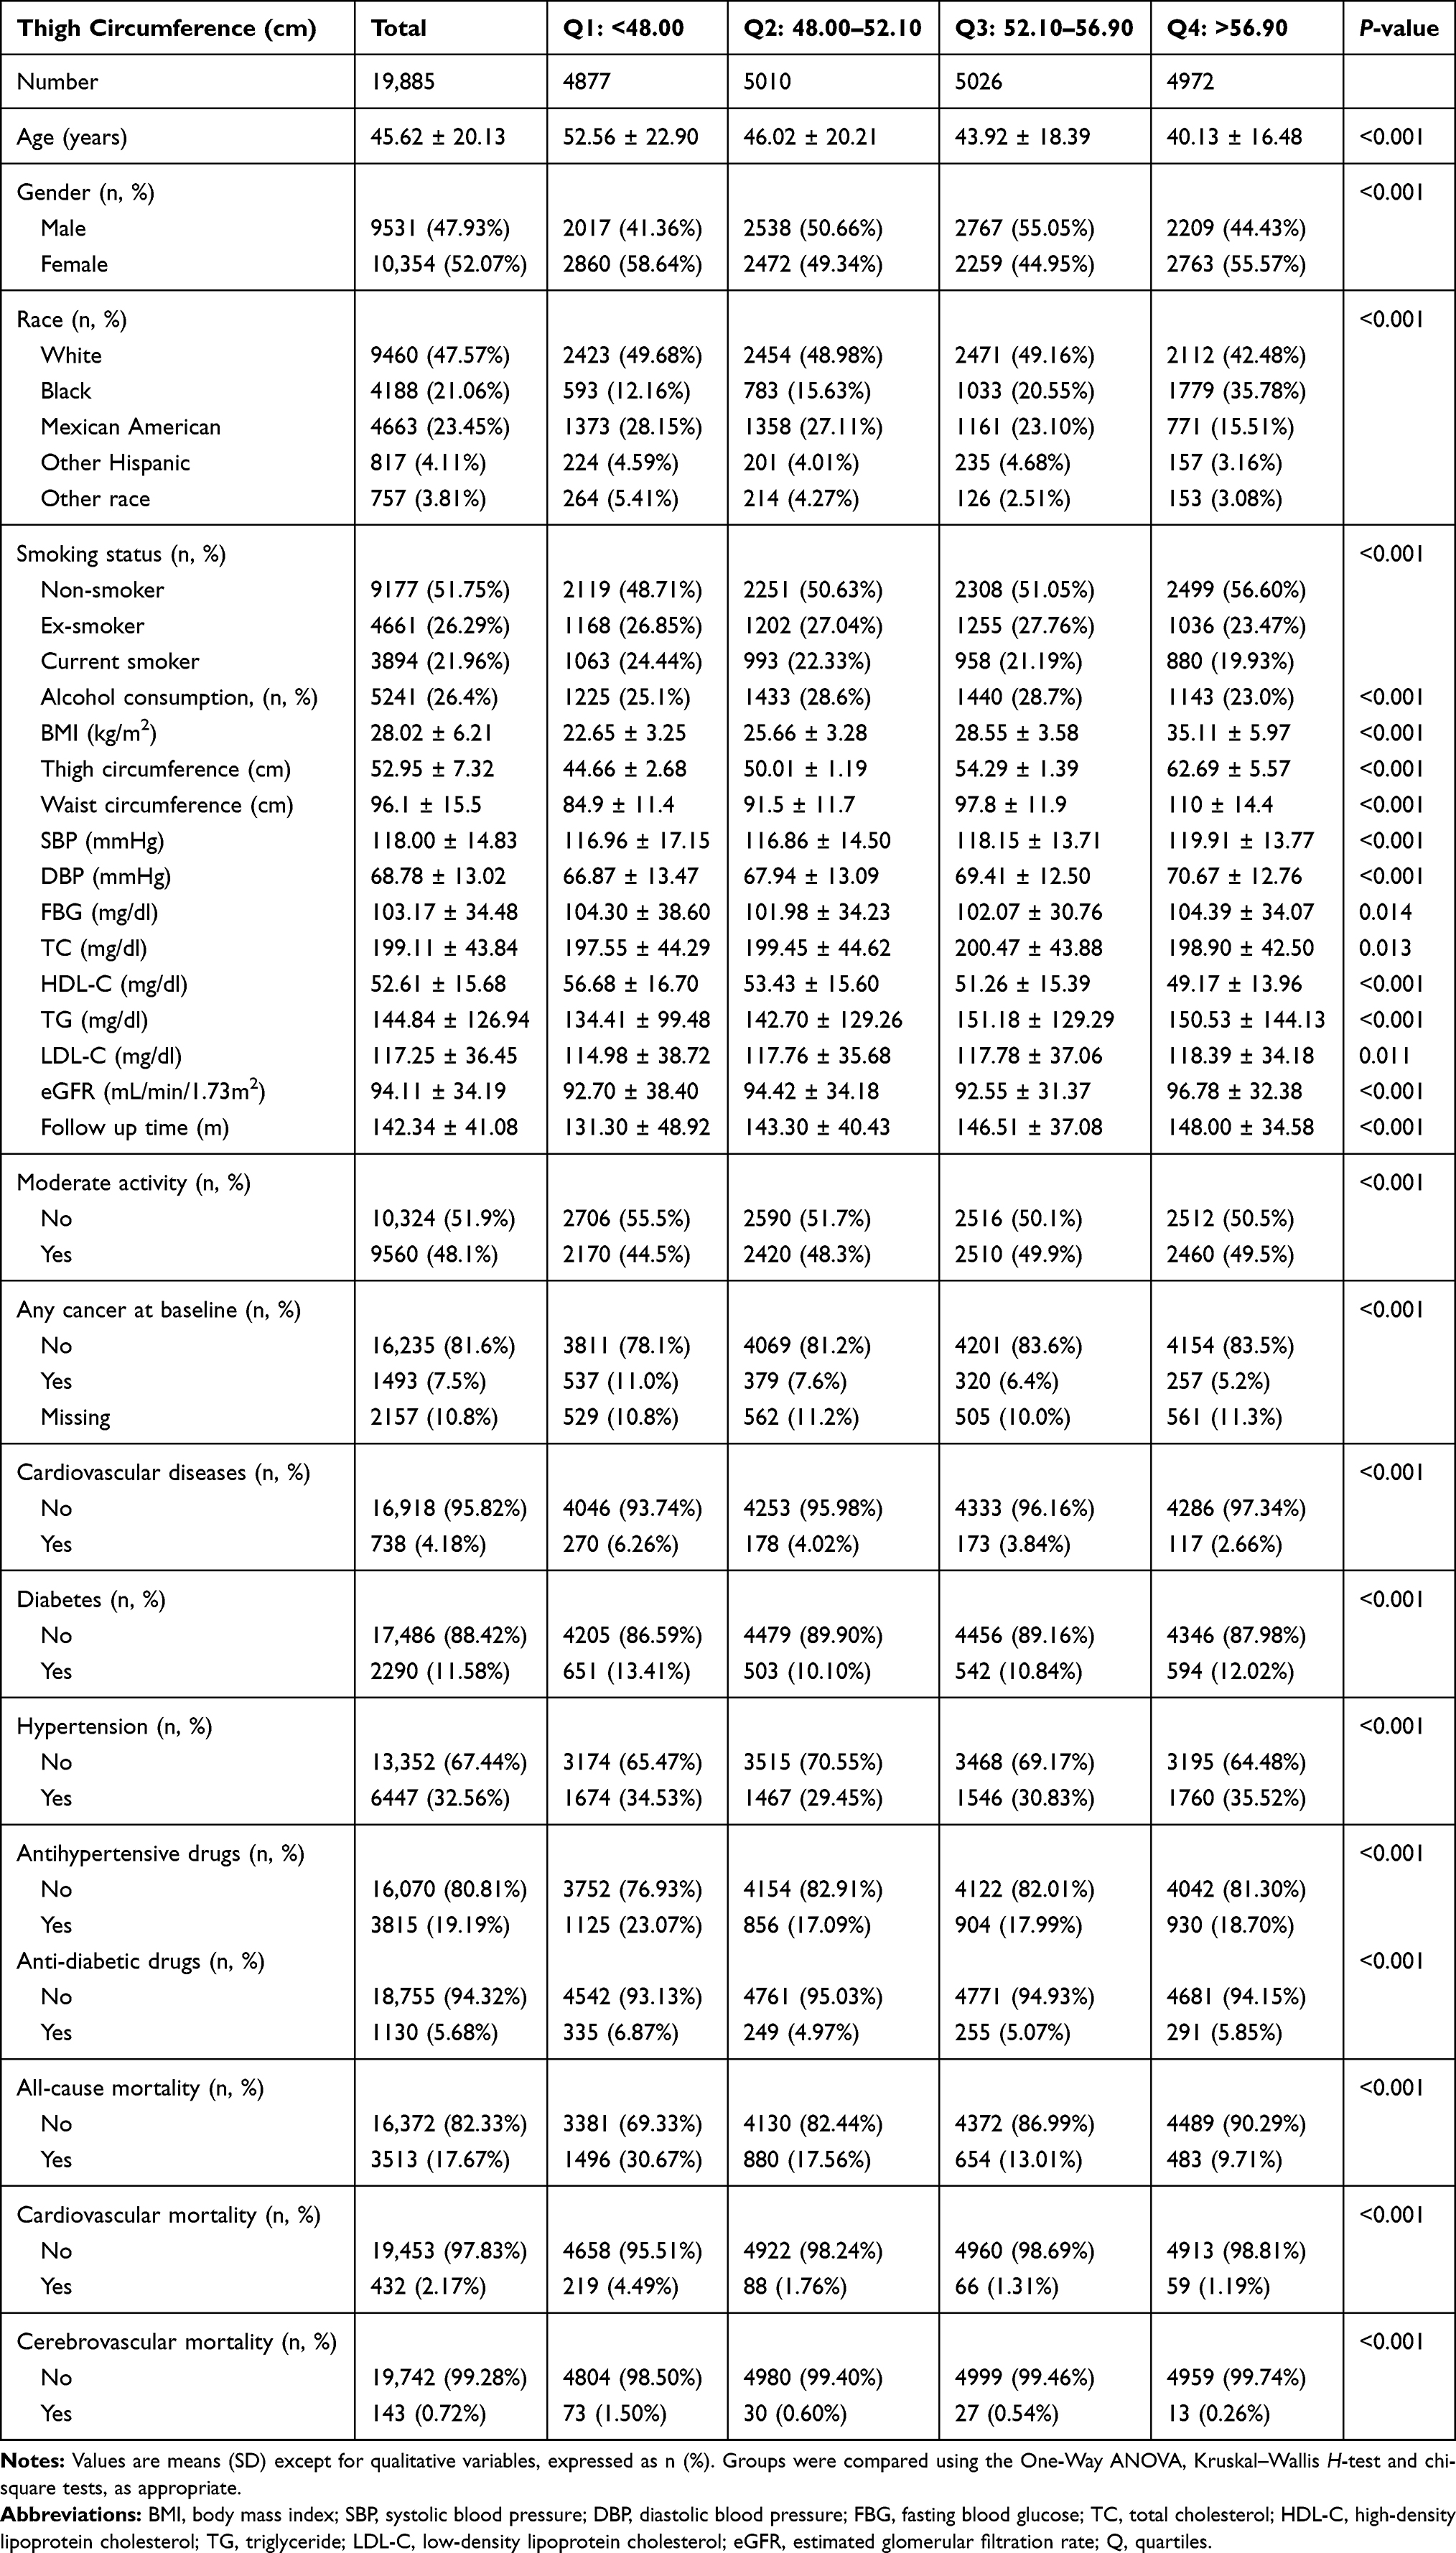 |
Table 1 Baseline Characteristics of the Study Participants by Quartiles of Thigh Circumference |
Hazard Ratios of Thigh Circumference for Mortality Risk
Table 2 summarizes the estimated HR and CIs according to quartiles of thigh circumference in relation to total, cardiovascular and cerebrovascular mortality. In the fully adjusted model, every 1cm increase in thigh circumference was associated with a 3% reduction in the risk of all-cause mortality (HR 0.97, 95% CI 0.96–0.98, P <0.0001) and 5% reduction in the risk of cardiovascular mortality (HR 0.95, 95% CI 0.92–0.98, P =0.001), but was not associated with any change in the risk of cerebrovascular mortality (P>0.05). Comparing with the lowest quartile of thigh circumference (Q1), the HRs for all-cause mortality from Q2 to Q4 in the fully adjusted model were 0.80 (0.72–0.88, P <0.001), 0.70 (0.62–0.80, P <0.0001), and 0.81 (0.68–0.97, P <0.001), respectively (P for trend <0.001). After adjusting for age, gender, race, smoking status, alcohol consumption, BMI, waist circumference, moderate activity, TC, anti-diabetic drugs, eGFR, diabetes, hypertension, baseline status of cancer and cardiovascular diseases, the HRs for cardiovascular mortality from Q2 to Q4 were 0.62 (0.46–0.84, P =0.001), 0.56 (0.38–0.82, P =0.0002), and 0.86 (0.51–1.44, P =0.550), respectively (P for trend =0.050). In addition, thigh circumference in continuous or categorical variable did not associate with the risk of cerebrovascular mortality (all P >0.05).
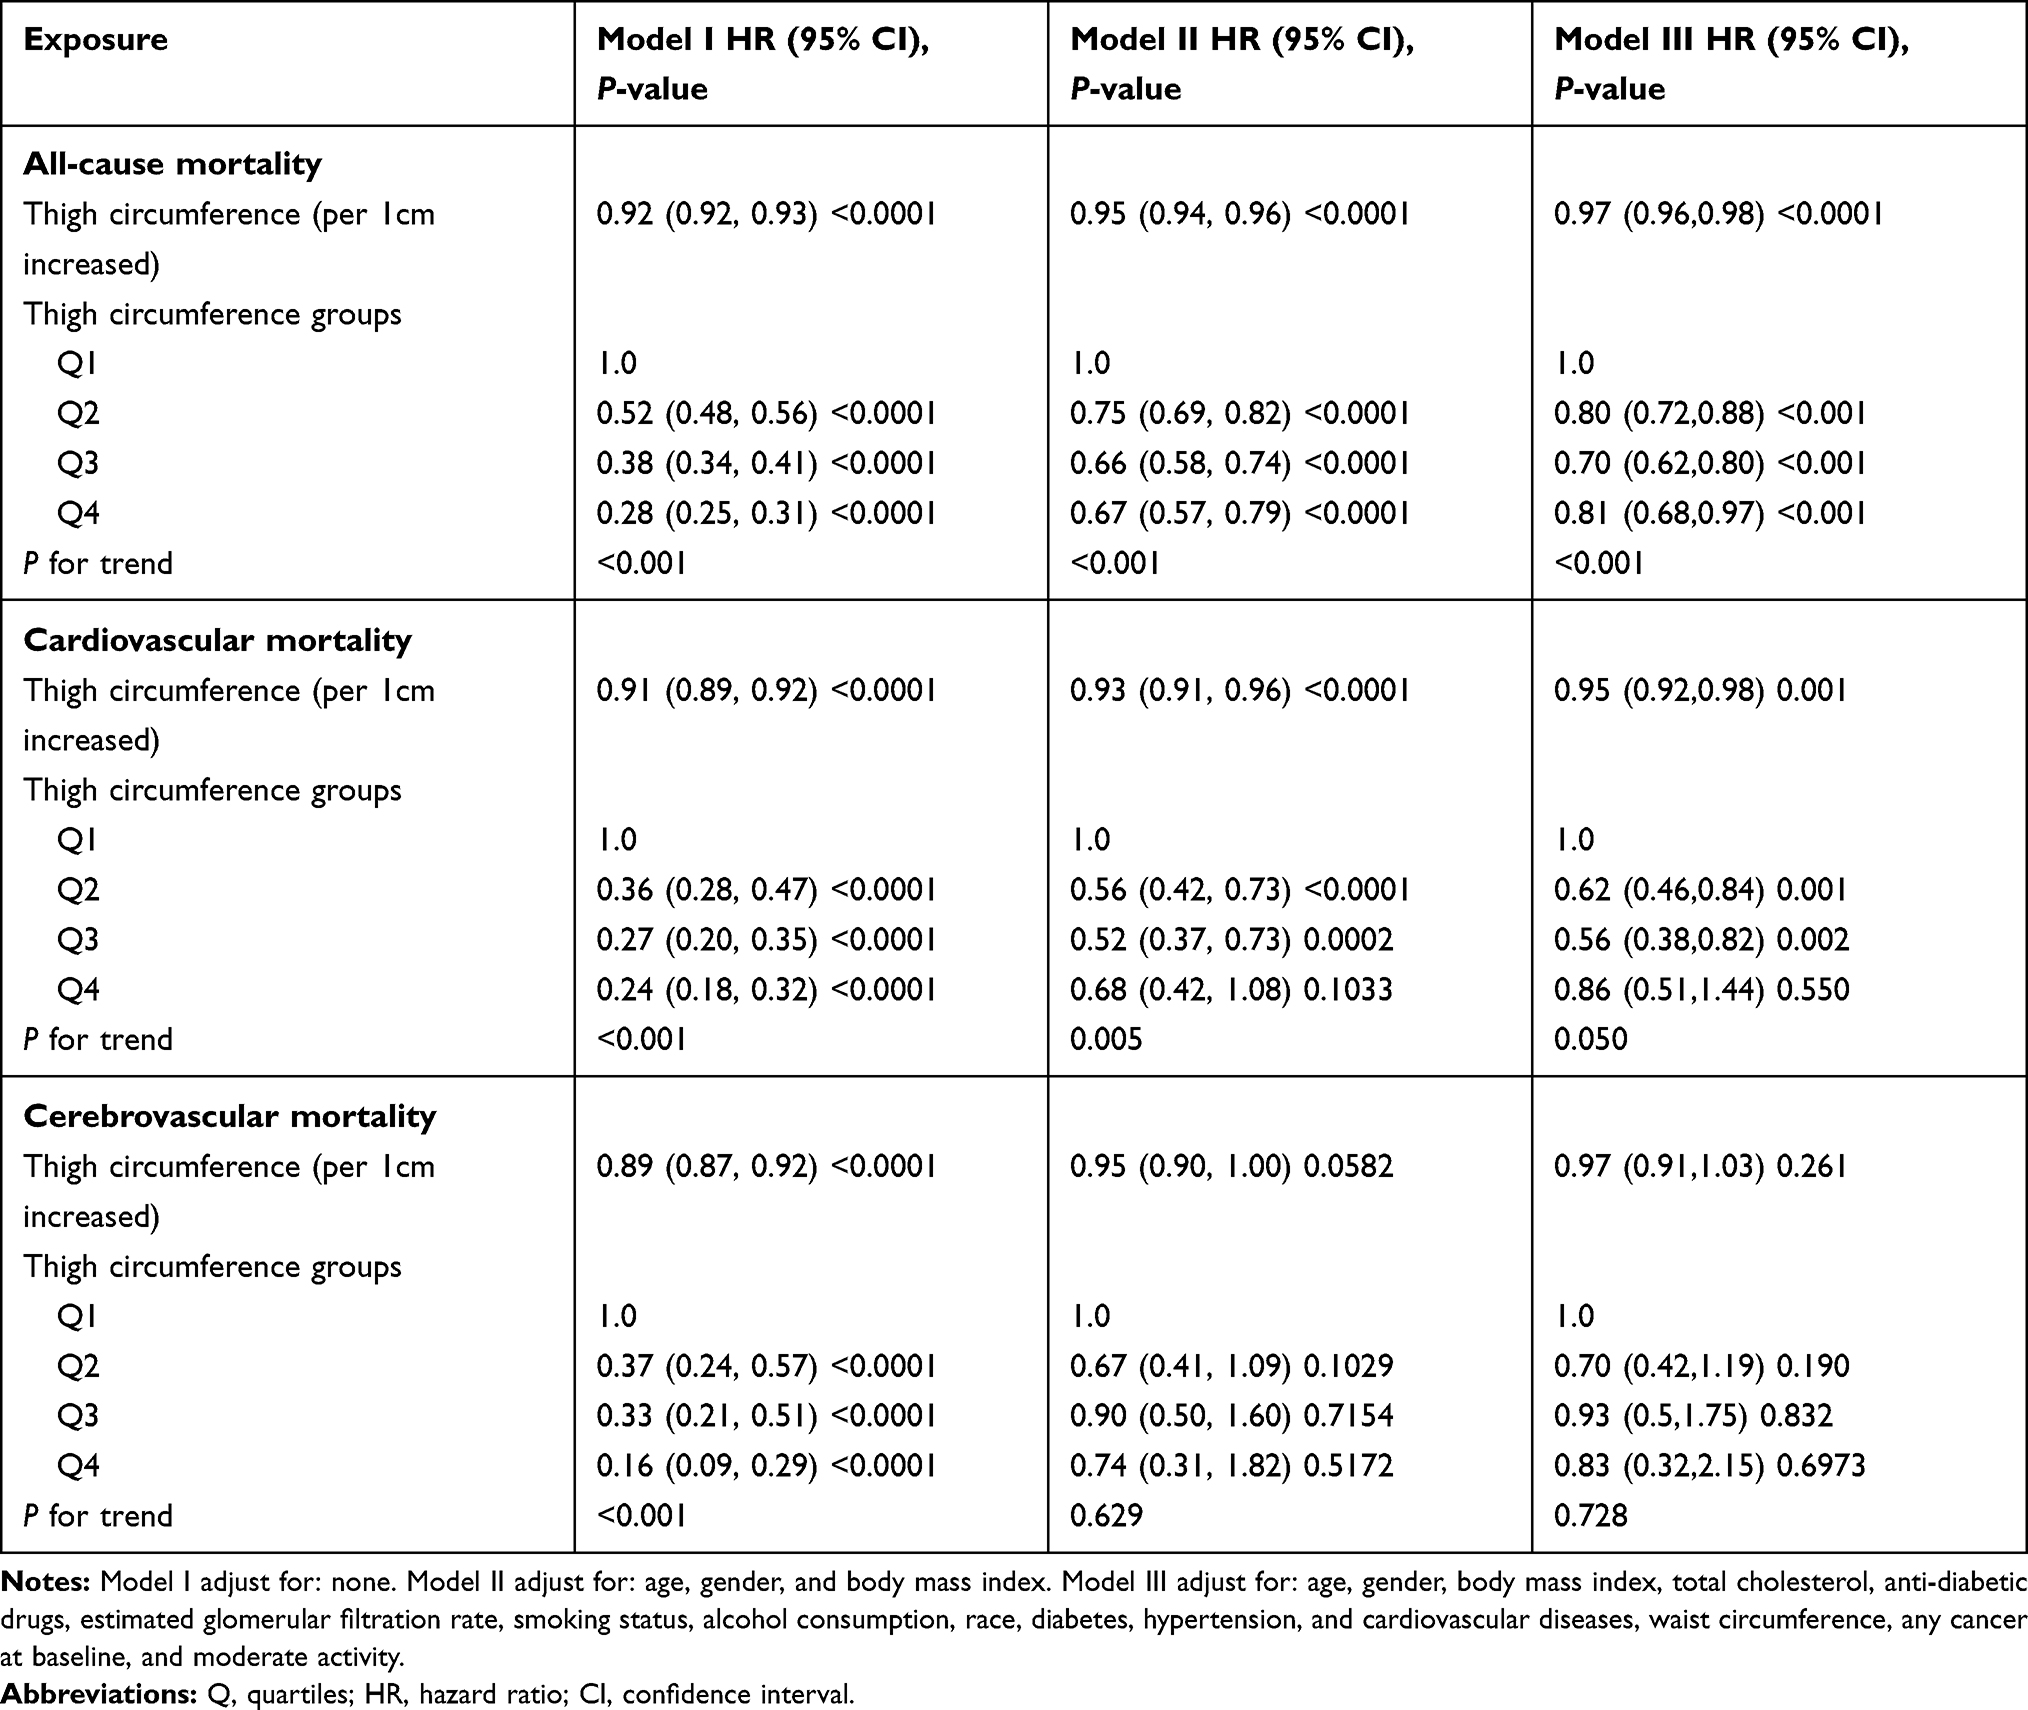 |
Table 2 Multivariate Cox Regression Analysis for All-Cause, Cardiovascular and Cerebrovascular Mortality |
As showed in Kaplan-Meier survival curves (Figure 2), there were significant differences in the occurrence of all-cause, cardiovascular, and cerebrovascular mortality (Log rank P <0.001) among the quartiles of thigh circumference. The results of multivariable adjusted restricted cubic spline regression are shown in Figure 3. Linear relationships between thigh circumference and all-cause mortality (Linear P <0.001) and cardiovascular mortality (Linear P =0.001) were found.
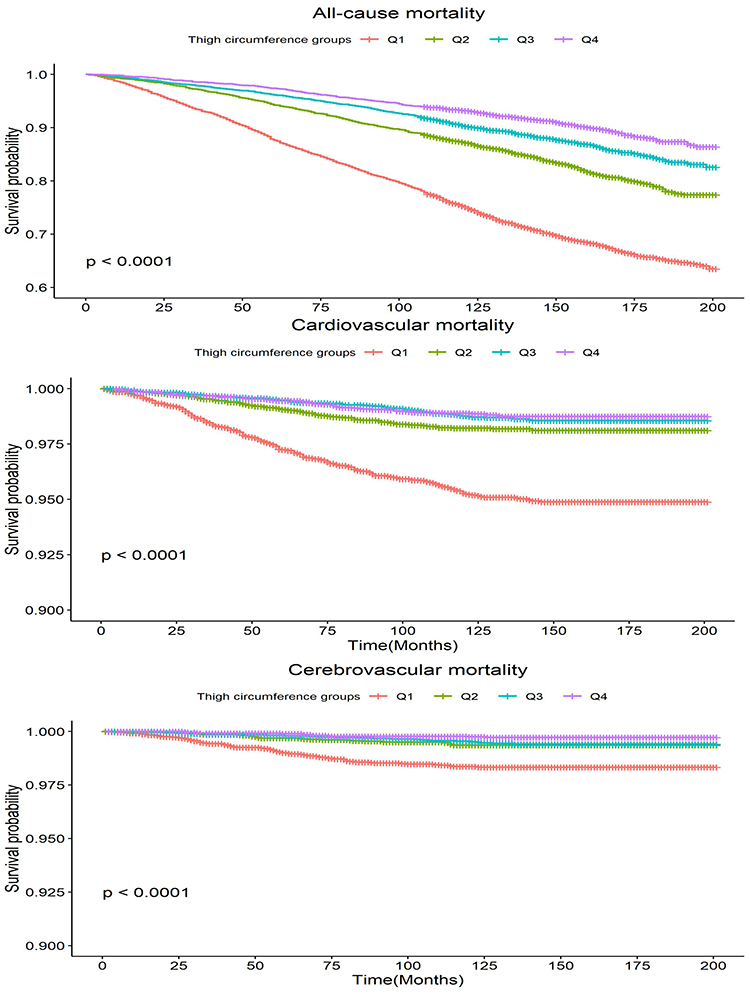 |
Figure 2 Kaplan–Meier estimated cumulative survival curves based on thigh circumference groups. |
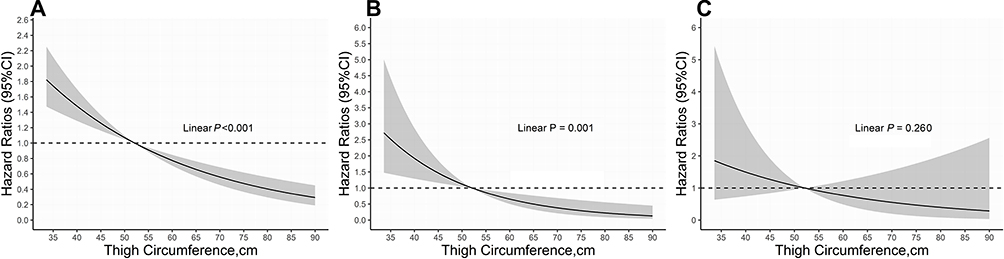 |
Figure 3 The relationship between thigh circumference and mortality of interest. The association of thigh circumference with all-cause mortality (A), cardiovascular mortality (B) and cerebrovascular mortality (C) were shown after controlling for age, gender, body mass index, waist circumference, moderate activity, total cholesterol, anti-diabetic drugs, estimated glomerular filtration rate, smoking status, race, baseline cancer, diabetes, hypertension, and cardiovascular diseases. The solid lines represented the hazard ratios of thigh circumference and the shadowed area represented the corresponding 95% confidence intervals. |
Subgroup Analyses
Table 3 has provided results of further analyses exploring the relationship between thigh circumference and all-cause and cardiovascular mortality as stratified by gender, age, BMI, and baseline medical history. The association was consistent across most subgrouping variables (P for interaction > 0.05). However, there was a significant interaction between thigh circumference and BMI (BMI <25 kg/m2 vs ≥25 kg/m2) for all-cause mortality (P for interaction <0.0001) and cardiovascular mortality (P for interaction <0.0001). People with higher thigh circumference and BMI ≥ 25kg/m2 were associated with lower risk of all-cause mortality. Similarly, larger thigh circumference was associated with lower risk of cardiovascular mortality in individuals with diabetes.
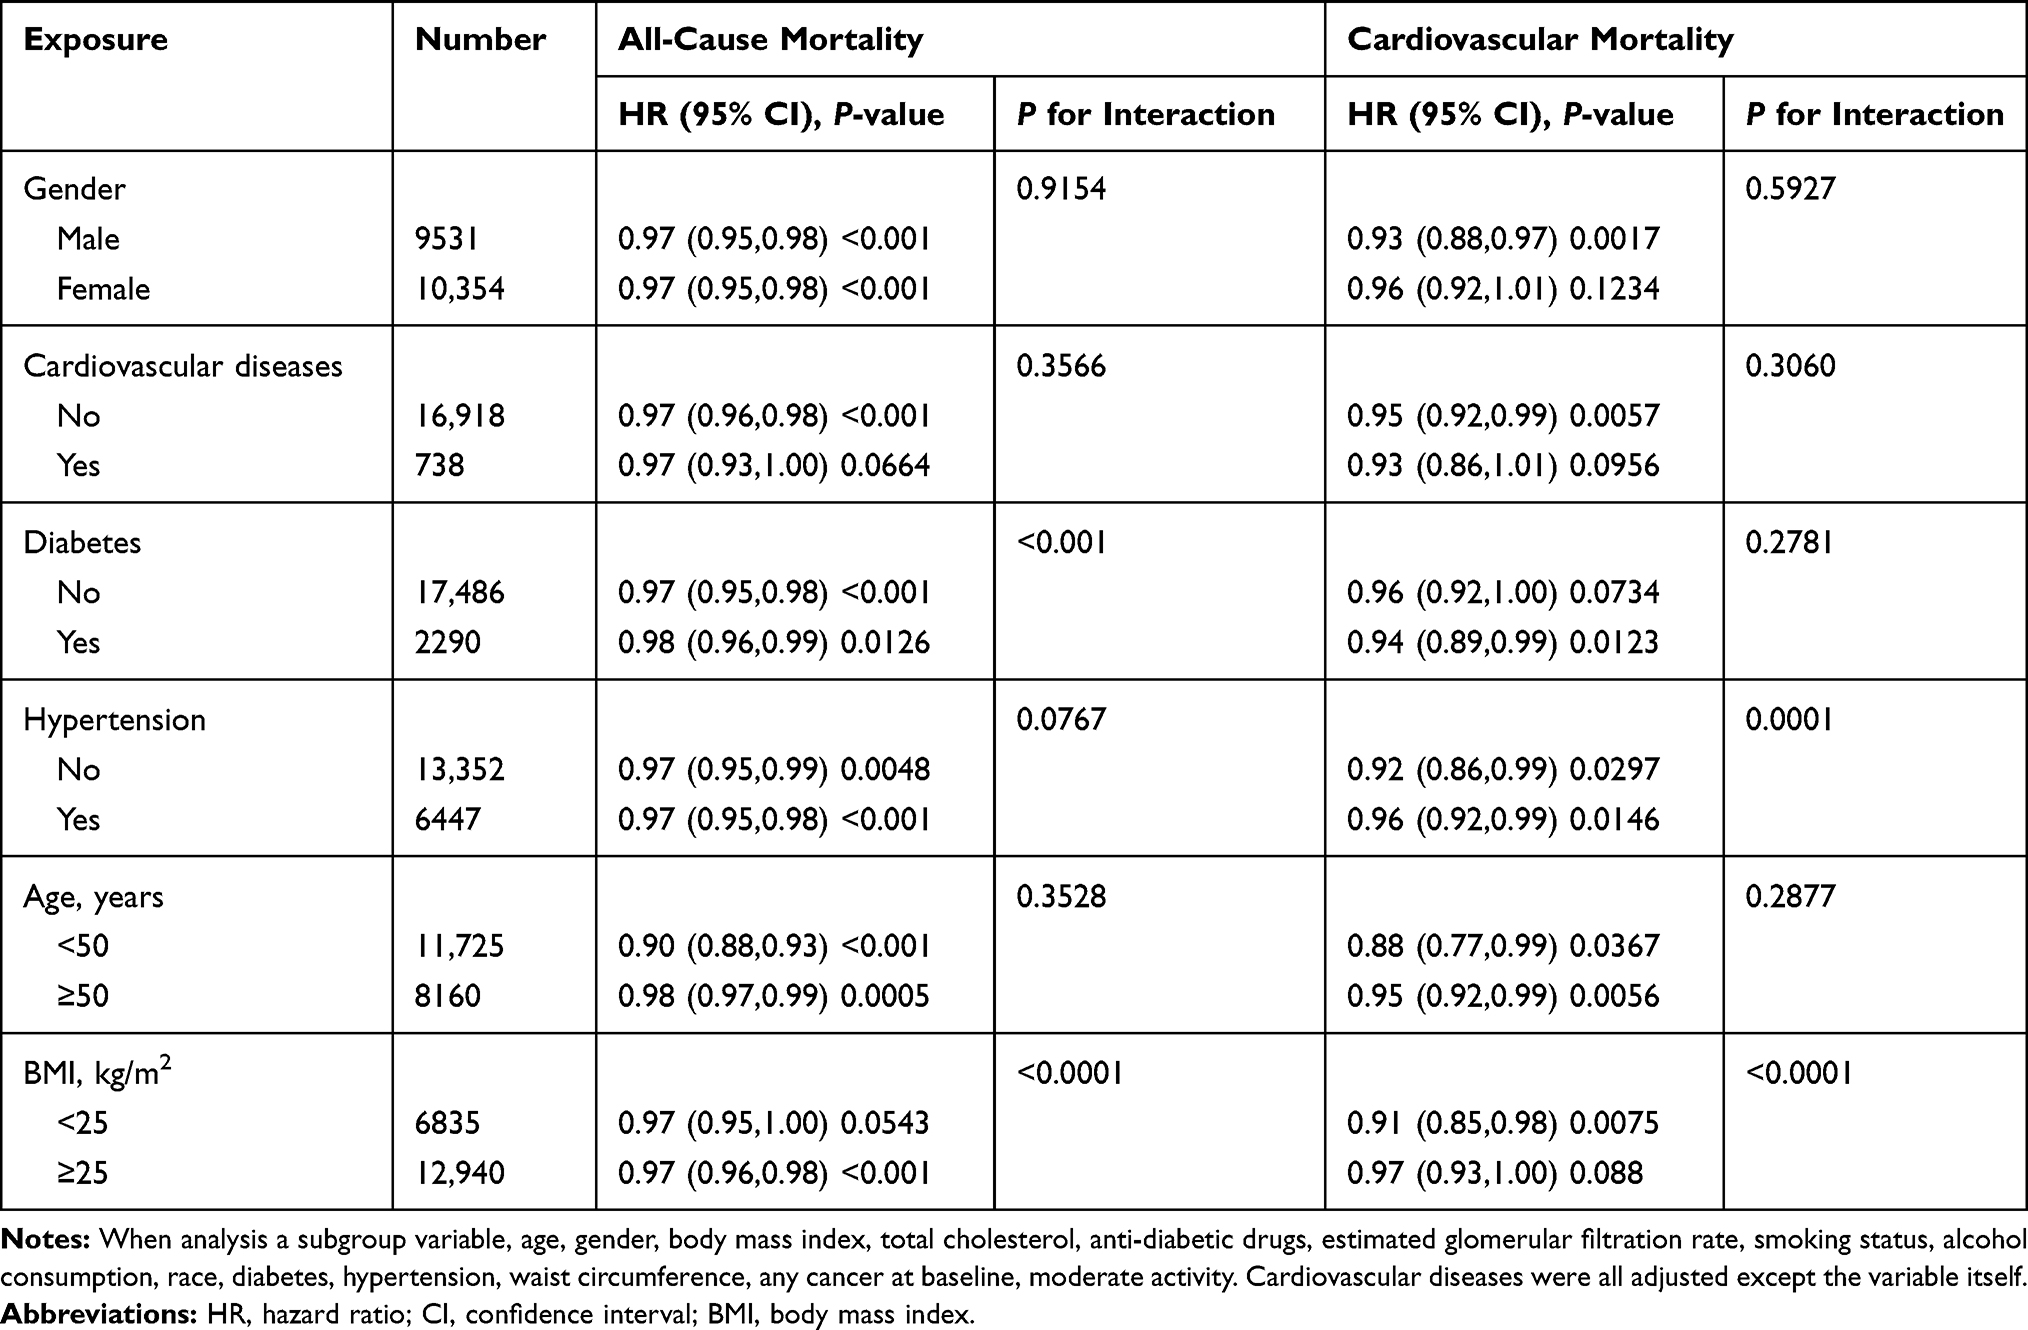 |
Table 3 Subgroup Analysis for Thigh Circumference with All-Cause and Cardiovascular Mortality |
Sensitivity Analyses
Table 4 presents the HRs with 95% CI for the association between thigh circumference and mortality risk by excluding participants with any cancer at baseline. The results were consistent with previous analyses. Larger thigh circumference was associated with a lower risk of all-cause mortality (HR for per 1 cm increase was 0.97; 95% CI, 0.96–0.98, P <0.001) and lower risk of cardiovascular mortality (HR for per 1 cm increase was 0.95; 95% CI, 0.92–0.99, P =0.0086), but not associated with the risk of cerebrovascular mortality (P >0.05).
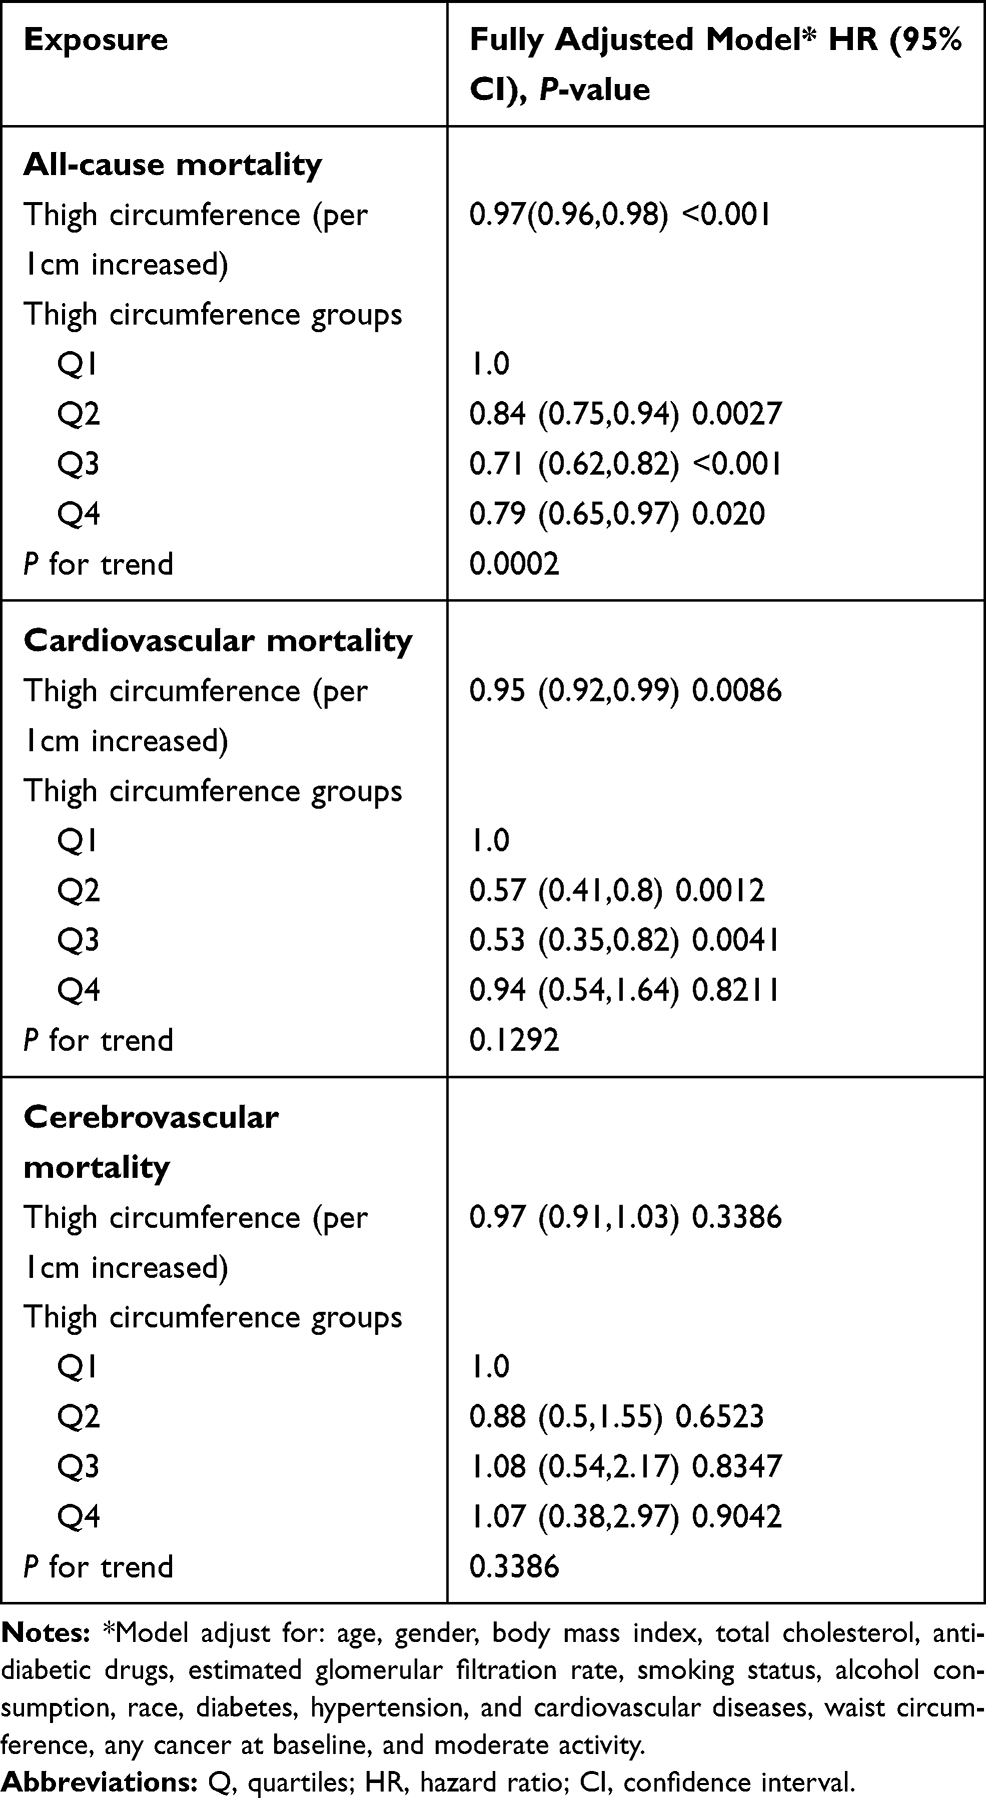 |
Table 4 Multivariate Cox Regression Analysis for All-Cause, Cardiovascular and Cerebrovascular Mortality by Excluding Participants with Any Cancer at Baseline |
Discussion
Using data from NHANES study 1999–2006, we found an independent and inverse association between thigh circumference, all-cause mortality and cardiovascular death in adults. The increased risk associated with smaller thigh circumference was seen independently of BMI and other cardiovascular factors for end points, suggesting that lower thigh circumference is a disadvantage to survival for both genders. Further analyses suggested that the linear relationship between thigh circumference and all-cause mortality was more profound among participants with BMI greater than 25 kg/m2 and the inverse association with cardiovascular mortality remained significant in overweight and obese rather than lean participants.
Thigh circumference has been widely used as an indicator for body muscle mass and peripheral subcutaneous fat and has been proved to be closely associated with insulin resistance, atherosclerosis and risk of type 2 diabetes.7,11,18 The Danish MONICA (monitoring trends in and determinants of cardiovascular disease) project has reported inverse associations between thigh circumference and all-cause mortality, as well as morbidity from cardiovascular disease in men and women.9 In our analysis, the increased risk between small thigh circumference and death was independent of other anthropometric indices, suggesting that smaller thigh was a disadvantage to health and survival for both sexes whatever they were lean or had excessive body weight. Our study agreed with some previous findings and added the evidence on the inverse association of thigh circumference and cardiovascular mortality.
Emerging clinical and epidemiological evidence indicates that the distribution of adiposity plays an important role in CVD risk, and is independent of the extent of general adiposity.19 For example, studies have shown that smaller leg muscle, but not arm muscle, could provoke insulin resistance and might have great relevance for developing diabetes.20,21 Results from a study among patients with chronic obstructive pulmonary disease argued that the cross-sectional area in mid-thigh muscle was a better predictor of mortality than BMI.22 These previous findings and our study both emphasized the importance of thigh area in predicting the risk of disease and death. These previous findings and our study both emphasized the importance of thigh area in predicting the risk of disease and death. Thigh muscle mass can be selectively increased by physical activity in lower body, which in turns and then decreased the risk of heart disease. A clear public health recommendation can be easily delivered to the society.
Similar to the MONICA study, our analysis showed that age did not modify the effect of thigh circumference on total mortality and cardiovascular mortality. However, there was a significant interaction between BMI and thigh circumference in our study. Participants with a BMI of 25 kg/m2 or higher and a small thigh circumference might not have a higher risk of cardiovascular death. Still, a strong negative association remained for lean participants (BMI <25 kg/m2). This finding was in line with a previous discovery that small thigh circumference was associated with diabetes, especially among participants with a BMI of less than 25 kg/m2.11 It is possible that larger thigh circumference was more protective amongst people with elevated BMI, which is a common cardiometabolic risk factor. Although the test for interaction was not significant, this hypothesis can explain the significant and inverse association between thigh circumference and cardiovascular mortality among people with diabetes but not for those without. Additionally, studies have shown that lean people have increased risk of surgical complications as well as cardiovascular diseases, and psychological disorders like suicide and then higher rate of total mortality and death from heart disease.23–25
The mechanisms linking thigh circumference and mortality have not been fully understood. A study showed that reduced leg fat was associated with increased risk of CVD among postmenopausal women with normal BMI.26 Lower body fat, however, might offer cardioprotection through endocrine secretion of various adipokines, such as adiponectin, a peptide with apparent anti-inflammatory properties.27 Adiponectin is secreted mainly from adipocytes and is positively correlated with thigh circumference.28 In addition, low thigh subcutaneous fat might also influence glucose and lipid metabolism in an inverse way.12 Low fat-free mass is also associated with the risk of cancer and all-cause mortality.29,30 The distribution of adipose tissue in the thigh differs according to BMI and thigh circumference and might not be representative of muscle mass when BMI decreases. From our perspective, thigh circumference represents both the fat mass and fat-free mass, although two tissues confer differently in mortality risk according to BMI categories. In addition, the underlying mechanisms regarding the non-significant relationship between thigh circumference and cerebrovascular mortality were unclear. One possible explanation was that the follow-up period of our study was relatively short, and the number of cerebrovascular deaths was relatively small. Well-designed studies with longer follow-up time are needed in the future to better understand the potential linkage of thigh circumference and cerebrovascular mortality.
Our study has several limitations. First, reverse causality cannot be excluded. However, the prospective design with linkage to national mortality data of the present study helps to elucidate causal relationship. Second, there were residual confounding effects that we were not able to account for, such as tumor history, mental condition, exercise and sleep. Despite this limitation, numerous confounding factors associated with mortality, including socio-demographic factors, lipids parameters, BMI, FBG, previous history of diseases, taking drugs, alcohol and smoking status were adjusted. Third, most of the covariates were self-reported, which might introduce inaccuracy and misclassification and were subject to recall bias. Fourth, we were not able to exclude pregnant and lactating women due to the lack of relevant information. Fifth, the study population was solely recruited in the United States, so the conclusions of this research may not be extrapolated to other populations. Moreover, we were not able to determine the sex-specific normal range of thigh circumference. Finally, NHANENS study did not measure fat mass and fat-free mass of the thighs.
Conclusion
In conclusion, the present cohort study revealed an inverse association between thigh circumference and all-cause and cardiovascular mortality. The increased risk of having smaller thighs was independent of BMI, waist circumference, lifestyle and cardiovascular risk factors such as blood pressure and lipids. The measure of thigh circumference might be a relevant anthropometric measure to help general practitioners to identify individuals with increased risk of mortality.
Ethical Statement
Our experimental study was approved by the institutional medical ethical committee the Guangdong General Hospital, Guangzhou, China. The authors are accountable for all aspects of the work in ensuring that questions related to the accuracy or integrity of any part of the work are appropriately investigated and resolved. Written informed consent was obtained from all participants.
Acknowledgments
We thank all the participants in this survey.
Funding
During the process of data collection, sorting, analysis, writing and submission of the article, this work was supported by the Science and Technology Program of Guangzhou (No.201604020143, No.201604020018, No.201604020186 and No.201803040012), the National Key Research and Development Program of China (No.2017YFC1307603, No.2016YFC1301305) and the Key Area R&D Program of Guangdong Province (No.2019B020227005).
Disclosure
The authors declare that they have no conflicts of interest for this work.
References
1. Flegal KM, Kit BK, Orpana H, et al. Association of all-cause mortality with overweight and obesity using standard body mass index categories: a systematic review and meta-analysis. JAMA. 2013;309(1):71–82. doi:10.1001/jama.2012.113905
2. Lo K, Wong M, Khalechelvam P, et al. Waist-to-height ratio, body mass index and waist circumference for screening paediatric cardio-metabolic risk factors: a meta-analysis. Obes Rev. 2016;17(12):1258–1275. doi:10.1111/obr.12456
3. Ashwell M, Gunn P, Gibson S. Waist-to-height ratio is a better screening tool than waist circumference and BMI for adult cardiometabolic risk factors: systematic review and meta-analysis. Obes Rev. 2012;13:275–286. doi:10.1111/j.1467-789X.2011.00952.x
4. Tatsukawa Y, Misumi M, Kim YM, et al. Body composition and development of diabetes: a 15-year follow-up study in a Japanese population. Eur J Clin Nutr. 2018;72:374–380. doi:10.1038/s41430-017-0077-7
5. Yano Y, Vongpatanasin W, Ayers C, et al. Regional fat distribution and blood pressure level and variability: the Dallas Heart Study. Hypertension. 2016;68:576–583. doi:10.1161/HYPERTENSIONAHA.116.07876
6. Lee M, Choh AC, Demerath EW, et al. Associations between trunk, leg and total body adiposity with arterial stiffness. Am J Hypertens. 2012;25(10):1131–1137. doi:10.1038/ajh.2012.92
7. Kwon HR, Han KA, Ahn HJ, et al. The correlations between extremity circumferences with total and regional amounts of skeletal muscle and muscle strength in obese women with type 2 diabetes. Diabetes Metab J. 2011;35(4):374–383. doi:10.4093/dmj.2011.35.4.374
8. Bourne RR. Global, regional, and national disability-adjusted life-years (DALYs) for 359 diseases and injuries and healthy life expectancy (HALE) for 195 countries and territories, 1990–2017: a systematic analysis for the Global Burden of Disease Study 2017. Lancet. 2018;392:1859–1922.
9. Heitmann BL, Frederiksen P. Thigh circumference and risk of heart disease and premature death: prospective cohort study. BMJ. 2009;339(sep03 2):b3292. doi:10.1136/bmj.b3292
10. Min J-Y, Cho J-S, Lee K-J, et al. Thigh circumference and low ankle brachial index in US adults: results from the National Health and Nutrition Examination Survey 1999–2004. Int J Cardiol. 2013;163(1):40–45. doi:10.1016/j.ijcard.2012.10.039
11. Jung KJ, Kimm H, Yun JE, et al. Thigh circumference and diabetes: obesity as a potential effect modifier. J Epidemiol. 2013;23(5):329–336. doi:10.2188/jea.JE20120174
12. Snijder MB, Visser M, Dekker JM, et al. Low subcutaneous thigh fat is a risk factor for unfavourable glucose and lipid levels, independently of high abdominal fat. The Health ABC Study. Diabetologia. 2005;48(2):301–308. doi:10.1007/s00125-004-1637-7
13. Liao PJ, Lin TY, Ting MK, et al. Chest width, waist circumference, and thigh circumference are predictors of dementia. Int J Geriatr Psychiatry. 2018;33:1019–1027. doi:10.1002/gps.4887
14. Prince M, Acosta D, Ferri CP, et al. Dementia incidence and mortality in middle-income countries, and associations with indicators of cognitive reserve: a 10/66 Dementia Research Group population-based cohort study. Lancet. 2012;380:50–58.
15. Whelton PK, Carey RM. The 2017 American College of Cardiology/American Heart Association Clinical Practice Guideline for High Blood Pressure in Adults. JAMA Cardiol. 2018;3:352–353. doi:10.1001/jamacardio.2018.0005
16. American Diabetes Association. Standards of medical care for patients with diabetes mellitus. Diabetes Care. 2003;26(Suppl Supplement 1):S33–S50. doi:10.2337/diacare.26.2007.S33
17. Levey AS, Coresh J, Bolton K. et al. K/DOQI clinical practice guidelines for chronic kidney disease: evaluation, classification, and stratification. Am J Kidney Dis. 2002;39:S1–S266.
18. Park JS, Cho MH, Ahn CW, et al. The association of insulin resistance and carotid atherosclerosis with thigh and calf circumference in patients with type 2 diabetes. Cardiovasc Diabetol. 2012;11(1):62. doi:10.1186/1475-2840-11-62
19. Canoy D, Boekholdt SM, Wareham N, et al. Body fat distribution and risk of coronary heart disease in men and women in the European Prospective Investigation Into Cancer and Nutrition in Norfolk cohort: a population-based prospective study. Circulation. 2007;116(25):2933–2943. doi:10.1161/CIRCULATIONAHA.106.673756
20. Sacchetti M, Olsen DB, Saltin B, et al. Heterogeneity in limb fatty acid kinetics in type 2 diabetes. Diabetologia. 2005;48(5):938–945. doi:10.1007/s00125-005-1727-1
21. Olsen DB, Sacchetti M, Dela F, et al. Glucose clearance is higher in arm than leg muscle in type 2 diabetes. J Physiol. 2005;565(2):555–562. doi:10.1113/jphysiol.2004.081356
22. Marquis KDR, Debigaré R, Lacasse Y, LeBlanc P, Jobin J, Carrier G. Midthigh muscle cross-sectional area is a better predictor of mortality than body mass index in patients with chronic obstructive pulmonary disease. Am J Respir Crit Care Med. 2002;166(6):809–813. doi:10.1164/rccm.2107031
23. Dobner J, Kaser S. Body mass index and the risk of infection - from underweight to obesity. Clin Microbiol Infect. 2018;24:24–28. doi:10.1016/j.cmi.2017.02.013
24. Perera S, Eisen RB, Dennis BB, et al. Body mass index is an important predictor for suicide: results from a systematic review and meta-analysis. Suicide Life Threat Behav. 2016;46:697–736. doi:10.1111/sltb.12244
25. Di Angelantonio E, Bhupathiraju SN, Wormser D, et al. Body-mass index and all-cause mortality: individual-participant-data meta-analysis of 239 prospective studies in four continents. Lancet. 388;2016:776–786. doi:10.1016/S0140-6736(16)30175-1
26. Chen GC, Arthur R, Iyengar NM, et al. Association between regional body fat and cardiovascular disease risk among postmenopausal women with normal body mass index. Eur Heart J. 2019;40:2849–2855. doi:10.1093/eurheartj/ehz391
27. Brotman DJGJ. Can glucocortiocoid homeostasis explane the antiatherogenic effect of peripheral adiposity? Circulation. 2003;108:e61. doi:10.1161/01.CIR.0000086784.14560.C3
28. Manolopoulos KN, Karpe F, Frayn KN. Gluteofemoral body fat as a determinant of metabolic health. Int J Obes (Lond). 2010;34:949–959. doi:10.1038/ijo.2009.286
29. Lee DH, Keum N, Hu FB, et al. Predicted lean body mass, fat mass, and all cause and cause specific mortality in men: prospective US cohort study. BMJ. 2018;362:k2575. doi:10.1136/bmj.k2575
30. Hsu KH, Shih CP, Liao PJ. Waist-to-thigh ratio is a predictor of internal organ cancers in humans: findings from a cohort study. Ann Epidemiol. 2013;23:342–348. doi:10.1016/j.annepidem.2013.04.004
 © 2020 The Author(s). This work is published and licensed by Dove Medical Press Limited. The full terms of this license are available at https://www.dovepress.com/terms.php and incorporate the Creative Commons Attribution - Non Commercial (unported, v3.0) License.
By accessing the work you hereby accept the Terms. Non-commercial uses of the work are permitted without any further permission from Dove Medical Press Limited, provided the work is properly attributed. For permission for commercial use of this work, please see paragraphs 4.2 and 5 of our Terms.
© 2020 The Author(s). This work is published and licensed by Dove Medical Press Limited. The full terms of this license are available at https://www.dovepress.com/terms.php and incorporate the Creative Commons Attribution - Non Commercial (unported, v3.0) License.
By accessing the work you hereby accept the Terms. Non-commercial uses of the work are permitted without any further permission from Dove Medical Press Limited, provided the work is properly attributed. For permission for commercial use of this work, please see paragraphs 4.2 and 5 of our Terms.