")
Back to Journals » Nanotechnology, Science and Applications » Volume 12
Thermodynamics and kinetic analysis of carbon nanofibers as nanozymes
Authors Bahreini M , Movahedi M, Peyvandi M, Nematollahi F, Sepasi Tehrani H
Received 16 March 2019
Accepted for publication 5 June 2019
Published 16 July 2019 Volume 2019:12 Pages 3—10
DOI https://doi.org/10.2147/NSA.S208310
Checked for plagiarism Yes
Review by Single anonymous peer review
Peer reviewer comments 2
Editor who approved publication: Professor Israel (Rudi) Rubinstein
Maziar Bahreini,1 Monireh Movahedi,2 Maryam Peyvandi,3 Fereshteh Nematollahi,4 Hessam Sepasi Tehrani2
1Department of Chemistry, North Tehran Branch, Islamic Azad University, Tehran, Iran; 2Department of Cellular and Molecular, Faculty of Biological Sciences, North Tehran Branch, Islamic Azad University, Tehran, Iran; 3Department of Biology, Faculty of Biological Sciences, North Tehran Branch, Islamic Azad University, Tehran, Iran; 4Department of Chemistry, East Tehran Branch, Islamic Azad University, Tehran, Iran
Purpose: Evaluation of structural features, thermodynamics and kinetic properties of carbon nanofibers (CNFs) as artificial nanoscale enzymes (nanozyme).
Methods: Synthesis of CNFs was done using chemical vapor deposition, and transmission electron microscopy (TEM), field emission scanning electron microscopy (FE-SEM) and energy-dispersive x-ray spectroscopy (EDX) were used to provide information on the morphology, elemental monitoring and impurity assay of the CNFs. The thermal features of the CNFs were evaluated using differential thermal analysis (DTA), differential scanning calorimetry (DSC), thermogravimetric analysis (TGA) derivative and TGA. The calculated thermo-physical parameters were melting temperature (Tm), weight loss maximum temperature (Tmax) and enthalpy of fusion (ΔHfusion). Catalytic activity was assayed by a 4-aminoantypyrine (4-AAP)-H2O2 coupled colorimetric system by UV-visible spectroscopy.
Results: FE-SEM and TEM analysis demonstrated parallel graphitic layers and uniformity of atomic orientation and morphology. The EDX spectra approved carbon element as major signal and presence of partial Ti as impurities of CNFs during CVD process. The DTA thermogram showed the endothermic process had a maximum temperature of 82.27°C at −15.48 mV and that thermal decomposition occurred at about 200°C. The TGA-differential gravimetric analysis thermogram showed that Tmax was 700°C. The DSC heat flow curve showed a melting temperature (Tm) of 254.52°C, ΔHfusion of 3.84 J^.g−1, area under the curve of 58.58 mJ and Te (onset) and Tf (end set) temperatures of 246.60°C and 285.67°C, respectively. The peroxidase activity of the CNFs obeyed the Michaelis–Menten equation with a double-reciprocal curve and the calculated Km, Kcat and Vmax kinetic parameters.
Conclusion: CNFs as peroxidase nanozymes are intrinsically strong and stable nanocatalysts under difficult thermal conditions. The peroxidase activity was demonstrated, making these CNFs candidates for analytical tools under extreme conditions.
Keywords: nanozyme, carbon nanofibers, 4-AAP
Introduction
Thermal analysis is a collection of methods used to qualitative and quantitative information on the effect of heat on various types of materials, including chemical compounds, polymers (rubber, plastics and composites), ceramics, alloys, bio-macromolecules, food and medicine. Investigating the thermodynamics of nanoscale materials in bioscience can help create a basis for better understanding of these phenomena from the perspective of thermo-physical variables for wider and better applications using different biological materials. In this regard, nanozymes, newly emerging nanoscale enzyme mimics, can be used to surpass the limitations of natural enzymes. They can be applied for diagnostic biomedical, biotechnological and industrial applications.1–3
Nanoscale artificial enzymes are highly stable structures that can be synthesized at low cost with good potential as replacements for natural enzymes. Carbon nanofibers (CNFs) are carbon-based nanostructures that are examples of such structures which can be prepared by catalytic chemical vapor desorption (CCVD) and electrospinning. Notable CNFs that are prepared by CCVD are cup-stacked and platelet CNFs. Depending on the shape of the transition of the metal structures, CNFs can take different forms.4,5 Recently, a carbon nitride nanozyme of bifunctional glucose oxidase-peroxidase has been proposed for use in biomedicine.6 Another group of researchers have proposed and designed a thermal quantum machine to work as a nanozyme that can catalyze dependent temperature reactions.7
The single-atom nanozyme has been introduced as a carbon-based homogenous catalyst for wound disinfection and antibacterial applications.8 Quantum dots have been defined as peroxidase-like activities in addition to large-scale graphene oxides to catalyze biological reactions.9 The subject of this research is the thermal and kinetic analysis of CNFs as peroxidase mimics nanozymes using DTA, DSC and TGA-DTG as thermal experimental methods and kinetic activity based on colorimetric assay methods.
Experimental
CNF synthesis
CNFs were synthesized by chemical vapor deposition (CVD) under reduced catalysts at 900°C with a 200°C/min flow rate. Acetylene (C2H2) gas was set up at 120 mL/min for 35 mins at a temperature of 900 K.
Field emission scanning electron microscopy (FE-SEM), energy-dispersive x-ray spectroscopy (EDX) and transmission electron microscopy (TEM)
Images were taken using a Mira 3-XMH electron microscope and a low-vacuum secondary electron Tescan detector with 1.5 nm at 30 kV resolution. The system was operated with Mira TC on a Windows platform and an accelerating/landing voltage of 50 V to 30 kV with beam deceleration technology. The morphology and surface atomic orientation of the CNFs were detected using a Philips CM200 TEM with a LaB6 emitter operated at 200 kV. The samples were dispersed in chloroform and deposited on holey carbon film supported on a Cu grid.
Differential thermal analysis (DTA)
To determine the phase transition and thermal behavior of the nano-CNF powder sample, the temperature region of 25–1500°C was used with programmed cycles up to 50 K min−1. The mass flow controller (MFC) was set at a flow rate of 0–200 mL min−1 and MCF resolution was 1 mL min−1. The system differential thermocouple was of the K type with a sensitivity of <0.0005 µV. Thermal testing was carried out in air and N2 gas and heating occurred in one furnace.
Thermogravimetric analysis and differential gravimetric analysis (TGA/DTG)
To monitor mass loss, a Netzsch TG 209 F1 Iris TGA system used. The gas flow rate was set to 10°C/min and Proteus software at a temperature range of 45–800°C. The heating and cooling rates were from 0.001 K min−1 to 200 K min−1, andthe sample crucible volume was 80 µL and system resolution was set at 0.1 µg.
Differential scanning calorimetry (DSC)
The evaluation of the thermal features of the CNFs, DSC (Mettler Toledo) was carried out based on ASTM E1269-11 protocol. The standard volume of the aluminum crucible for the sample was 40 µL. The heating rate was room temperature to 700°C and temperature precision was 0.5°C. The thermal analysis software used was STARe 14.0.
Peroxidase mimic kinetics assay
The peroxidase mimic activity of the CNFs was evaluated using the 4-aminoantypyrine (4-AAP-H2O2) colorimetric system and Varian Cary Bio-100 spectroscopy. The kinetics of the enzyme mimic reaction was assayed using 5 μg mL−1 of CNFs as the peroxidase mimic in phosphate-buffered saline solution. The plot was drawn with the assumption that nanocarbon has a ping-pong mechanism.
Results and discussion
FE-SEM-TEM-EDX
The FE-SEM and TEM micrographs are shown in Figures 1 and 2 which show that the graphitic layers are oriented parallel to the axis. The lengths of CNFs were 50–80 µm and the TEM micrographs confirmed that the carbonized parallel layers of the CNFs were of the relatively parallel ribbon type. The formation of non-tubular carbon was inevitable during CVD and was detected using EDX to determine the elemental mapping and the variety of impurities. The system can detect elements from boron up in the periodic table. EDX theory states that the difference in the energy of the excited electrons generated by x-rays can identify each element present in the sample.
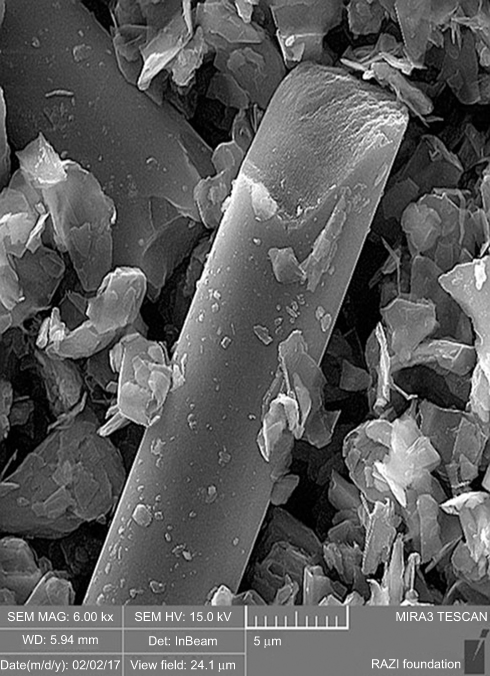 |
Figure 1 FE-SEM micrographs show CNFs and NTCs structures.Abbreviations: CNF, carbon nanofiber; FE-SEM, field emission scanning electron microscopy; NTC, nontubular carbons. |
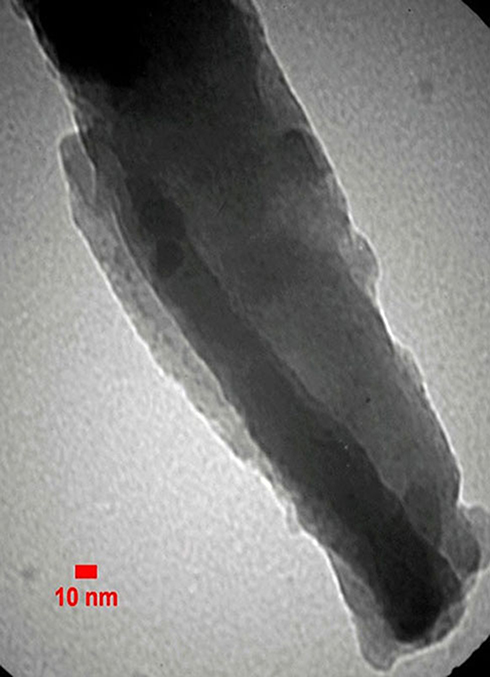 |
Figure 2 TEM micrographs of CNFs represented overlapped parallel carbonized graphitic layers and partial amorphous phases were detectable.Abbreviations: CNF, carbon nanofiber; TEM, transmission electron microscopy. |
Figure 3 shows elemental analysis of the EDX spectra of CNFs and indicates that the C Kα signal determines the carbon atoms as the major phase of the CNF structure with the O Kα signal identifying the surface groups on the CNFs. Other signals included Ti Kα, Ti Kβ and Ti Lα, which represent the Ti residual metal catalyst after CVD. The spectra showed no other significant signal for impurities.
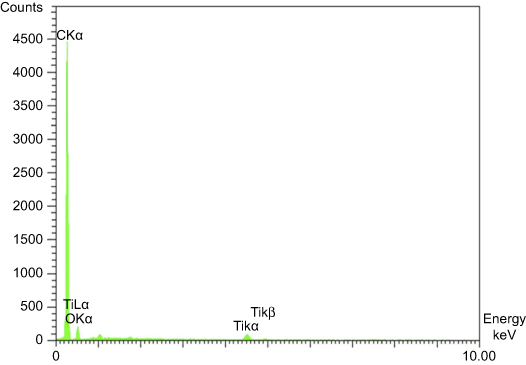 |
Figure 3 EDX spectra of synthesized CNFs. Abbreviations: CNF, carbon nanofiber; EDX, energy-dispersive x-ray spectroscopy. |
Further testing can show that the differences in the surface structure of the parallel and fishbone graphitic architecture of the CNFs may produce different nanozyme activity. This appears to be the initial step toward surface reactivity of carbon-based nanozymes and the bioinspired catalytic mechanism of CNFs. It is therefore important to increase our understanding of the surface structure, including the cavities and bridge sides of the CNFs.
DTA
The DTA thermogram shows the temperature differences in the sample and the reference in which the DTA signal is defined as a function of temperature. The DTA thermogram shows that the Tm of the pick at the maximum point is 82.27°C at −15.48 mV and that maximum thermal decomposition occurred at about 200°C as an endothermic process. In Figure 4, after the temperature increased to 500°C, the thermogram increased. In Figure 5, at a temperature of more than 600°C, the DTA signal decreased and the curve descended, then the signal increased and the curve ascended. For the deviation from baseline, the AUC and the shape of thermogram were used as the interpretation criteria for the DTA and DSC thermograms. DTA can measure temperature differences (ΔT) between the sample and reference. While DSC can directly measure the energy of a sample, DTA quantitative measurements such as enthalpy calculation can be monitored by converting AUC to ΔH using a calibration factor. The pick orientation of DTA, DSC and TGA depends on the system manufacturer and conventions.10,11
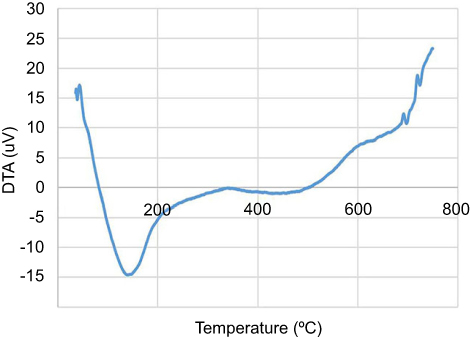 |
Figure 4 DTA thermogram by air in the range of (0–800)°C. Abbreviation: DTA, differential thermal analysis. |
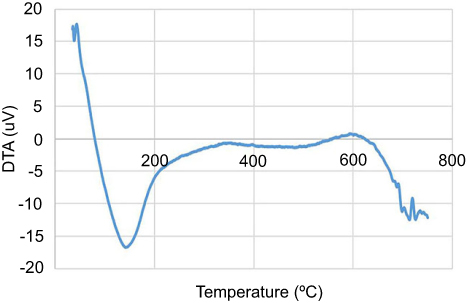 |
Figure 5 DTA thermogram by N2 gas in the range of (0–800)°C. Abbreviation: DTA, differential thermal analysis. |
TGA-DTG
The TGA-DTG thermogram shows the onset of thermal decomposition at temperatures of up to 510°C. Mass loss was completed at about 780°C. Tmax was 700°C. The TGA/DTG curve can be seen in Figure 6. Thermal decomposition proceeds differently in terms of the pattern based on how the reduction of mass occurs; consequently, the TGA curve will vary in terms of the number of stages. TGA is used to measure the mass loss of samples as a function of temperature for continuous measurement of weight loss due to decomposition or loss of water and weight gain due to absorption or oxidation. The DTG curve can provide eye-tracking TG curve information more readily. DTG is the first derivative of the TGA curve. It allows Tmax to be set quickly to provide the values of Te and Tf. All three temperatures change with a change in experimental conditions. The AUC of the DTG curve is directly proportional to the time derivative of the change in mass. The height of the DTG curve at any temperature gives the rate of mass decomposition kinetics.12,13
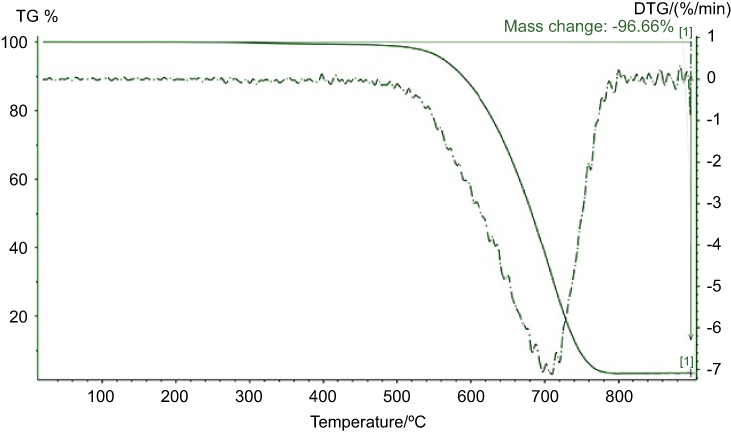 |
Figure 6 TGA/DTG thermogram indicates mass decomposition process so that weight loss maximum temperature (TMax) is 700°C and thermal decomposition was mass change 96.66% and 3.34% was nondecomposable. Abbreviations: DTG, differential gravimetric analysis; TG, thermogravimetric; TGA, thermogravimetric analysis. |
DSC
By definition, the amount of heat needed to increase a unit temperature of one degree determines the heat capacity (Cp). According to this definition, the boundary level shown by the DSC curve and the baseline during the interval is the thermal capacity. It is possible with the help of the DSC that, in the time elapsed, the sample only absorbs the energy required to increase the temperature by 1 degree.14,15
Evaluation of the heat flow temperature DSC curve (Figure 7) showed that Tm was 254.52°C and ΔHfusion was 3.84 J^.g−1. The AUC was 58.58 mJ and Te and Tf were 246.60°C and 285.67°C, respectively. Analysis of the Cp temperature curve (Figure 8) showed that maximum heat capacity coincides with the curve at 250–260°C set to 1.4–1.6 Jg−1°C–1.
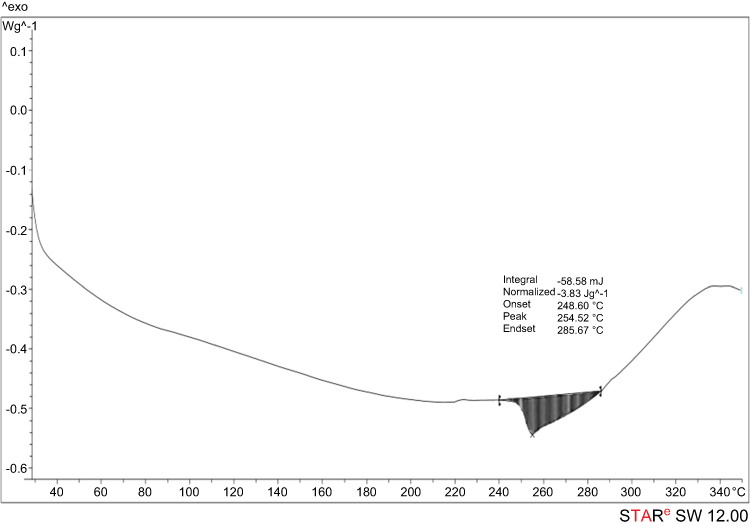 |
Figure 7 DSC thermogram shows calculated thermophysical parameters such as enthalpy of fusion and melting temperature. Abbreviation: DSC, differential scanning calorimetry. |
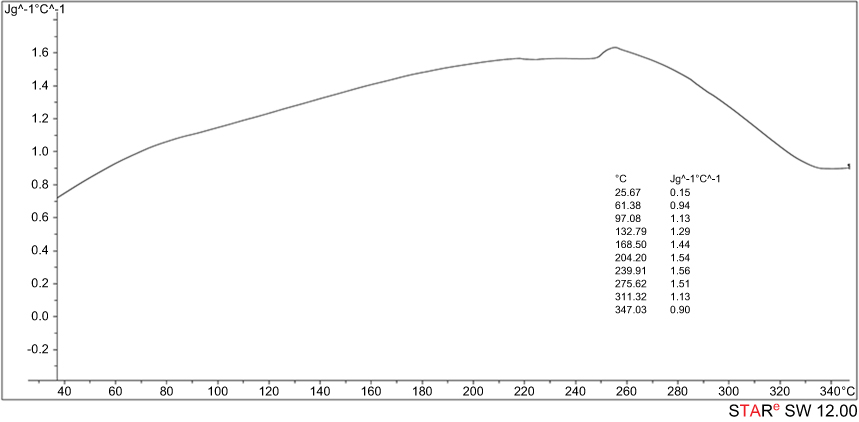 |
Figure 8 Cp curve shows the maximum amount of heat capacity coincided in the curve at a temperature range of 250°C to 260°C which is set to (1.4–1.6) Jg–1°C–1. Note: Cp, specific heat capacity is thermophysical parameter which is is equivalent to the amount of heat needed to get a specified amount of material to rise to one unit. |
Peroxidase mimic kinetics assay
The peroxidase mimic activity of the CNFs was assayed at different pH and temperature values. Figures 9 and 10 show that the maximum enzyme activity occurred at pH 7 and at temperature about 70°C. The curves indicate that catalytic activity occurred over a wider range in terms of temperature and pH in comparison with natural peroxidase, which makes it a candidate for use in extreme conditions. The general mean of the rate of enzymatic reaction obtained by measuring the absorption changes as a function of time as calculated by the Michaelis–Menten equation.
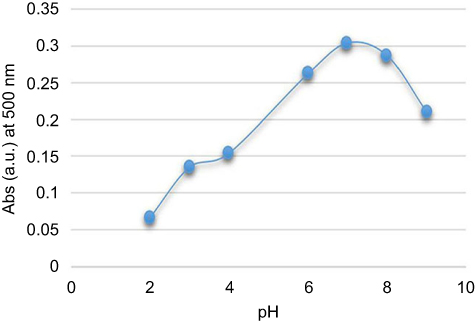 |
Figure 9 Peroxidase mimic activity of CNFs at different pH.Abbreviations: Abs, absorbance; CNF, carbon nanofiber. |
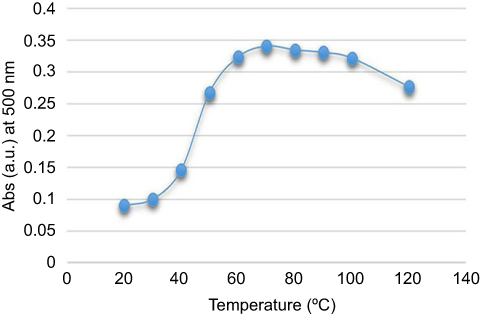 |
Figure 10 Peroxidase mimic activity of CNFs at different temperatures. Abbreviations: Abs, absorbance; CNF, carbon nanofiber. |
To demonstrate that peroxidase mimics activity of CNFs in a quinone imine production reaction, the double reciprocal was plotted based on the Michaelis–Menten equation. Figures 11 and 12 show that the double-reciprocal kinetic curves of enzymatic activity of the CNFs studied under constant concentrations of 4-AAP with a change in the concentration of the second substrate (H2O2). In the second plot, the concentration of H2O2 was held constant and the 4-AAP concentration as the second substrate was varied. The kinetics indicate hyperbolic behavior for peroxidase mimic activity of the CNFs as nanozymes.
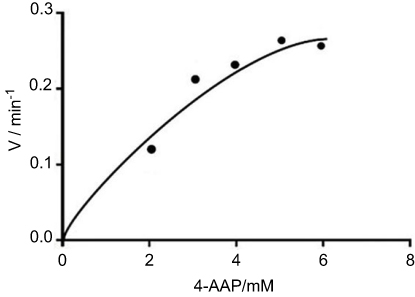 |
Figure 11 Steady-state kinetic curve based on constant H2O2 and differed 4-AAP. Abbreviation: 4-AAP, 4-amino antipyrine is chromogenic agent which is used biochemical assay. |
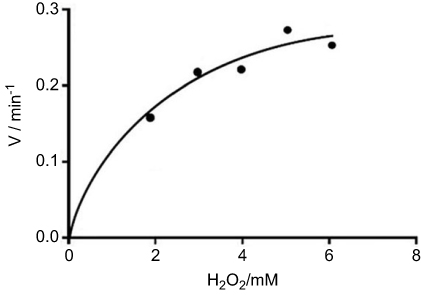 |
Figure 12 Steady-state kinetic curve based on constant 4-AAP and differed H2O2.Abbreviation: 4-AAP, 4-amino antipyrine is chromogenic agent which is used biochemical assay. |
The level of CNF peroxidase activity is related to the amount of quinone imine accumulation as the production of reaction. The rate of the reaction can be explained by the steady-state kinetic parameters in Table 1. The results showed vmax, Km and Kcat in comparison with natural peroxidase had lower values. The 4-AAP reacts with the hydrogen peroxide to produce a quinone imine dye (λmax =500 nm) in the presence of CNFs as the nanozyme (Figure 13). Spectrophotometric full-scan analysis revealed the status of the enzymatic reaction. Quinone imine as the final product can be detected in 500 nm and absorption in the region below 300 nm was for hydrogen peroxide and phenol as coupling agents of reaction (Figure 14).
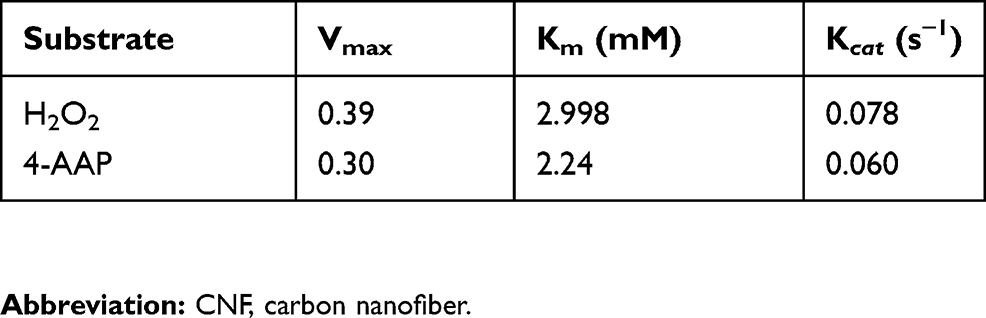 |
Table 1 Steady-state kinetic parameters of CNFs in PBS buffer |
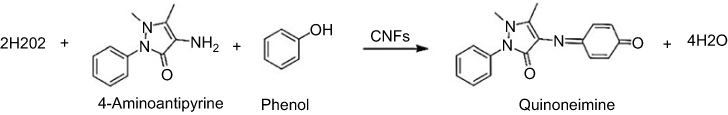 |
Figure 13 Scheme of enzymatic reaction of quinoneimine production in the presence of CNFs as peroxidase nanozyme. Abbreviation: CNF, carbon nanofiber. |
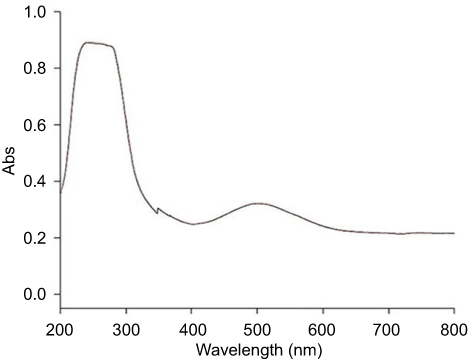 |
Figure 14 Full-scan spectrum includes absorptions of quinoneimine at λ=500 nm, H2O2 at λ=280 nm and phenol at λ=270 nm. Abbreviation: Abs, absorbance. |
Previous reports showed peroxidase mimics activity of hemin-functionalized graphene nanosheets that was evaluated by colorimetric assay.16 Wang et al reported on porphyrin functionalized carbon nanoparticles, intrinsic peroxidase-like catalytic activity and its application. The C-Dots have been evaluated as peroxidase mimic nanozymes by other researchers.17 Mahajan et al reported on the thermal features of multi-wall carbon nanotubes that the change in morphology for the isothermal condition occurred at about 400°C.18 The catalytic activity of graphene nanosheets as nanozymes was demonstrated. It was determined that optimum peroxidase activity was in the acidic range and the zeta potential titration curve conformed to a sixth-order polynomial curve.19 Other researchers have investigated carbon nitride dots as peroxidase nanozymes by TMB-H2O2 reaction.20–22
Conclusion
The structural, thermal and kinetic features of CNFs were investigated in this project. The results verified the uniformity and parallel graphitic layers of CNFs. The patterns of change of the DTA and DSC thermograms were in accordance and was demonstrated to be an endothermic process. Evaluation of mass decomposition by TGA/DTG showed high thermal stability which is valuable under extreme conditions. The 4-AAP-H2O2 catalytic assay of CNFs as peroxidase nanozymes shows that the lower limits of detection substrate concentration are more appropriate in comparison with natural peroxidase and that the catalytic process relatively obeyed Michaelis–Menten kinetic model with valid fitness. These achievements can be a solution for the application of carbon-based peroxidase nanozyme under physical and thermal conditions for applications such as having low catalytic efficiency. Other derivatives of carbon-based nanozymes and their applications require extensive study.
Acknowledgment
We would like to express our gratitude to our colleagues who helped us to complete this project.
Disclosure
The authors report no conflicts of interest in regard to this project.
References
1. Wang X, Guo W, Hu Y, Wu J, Wei H. Nanozymes: Next Wave of Artificial Enzyme.
2. Shin HY, Jung PT, Kim MR. Recent research trends and future prospects in nanozymes. J Nanomater. 2015;2015:756278.
3. Hui W, Erkang W. Nanomaterials with enzyme-like characteristics (nanozymes): next-generation artificial enzyme. Chem Soc Rev. 2013;14:1–10.
4. Feng L, Xie N, Zhong J. Carbon nanofibers and their composites: a review of synthesizing, properties and applications. Materials. 2014;7:3919–3945. doi:10.3390/ma7053919
5. Yan Z, Zhao FM, Yuting ZZ, et al. Low-cost nano carbon-based peroxidases from graphite and carbon fibers. Appl Sci. 2017;7:924. doi:10.3390/app7090924
6. Zhang P, Sun D, Cho A, et al. Modified carbon nitride nanozyme as bifunctional glucose oxidase-peroxidase for metal-free bioinspired cascade photocatalysis. Nat Commun. 2019;10:940.
7. Hatakeyama R, Shimizu A. Thermal quantum machine. eprintarXiv. 2019;1904:06081.
8. Xu B, Wang H, Wang W, et al. A single-atom nanozyme for wound disinfection applications. Angew Chem Int Ed Engl. 2019;58:4911–4916. doi:10.1002/anie.201813994
9. Wu J, Wang X, Wang Q, et al. Nanomaterials with enzyme-like characteristics (nanozymes): next-generation artificial enzymes (II). Chem Soc Rev. 2019;48:1004–1076. doi:10.1039/c8cs00457a
10. Klančnik G, Medved J, Mrvar P. Differential thermal analysis (DTA) and differential scanning calorimetry (DSC) as a method of material investigation, RMZ. Mat Geo Env. 2010;57(1):127–142.
11. Boettinger W, Kattner J, Moon UR. DTA and heat-flux DSC measurements of alloy melting and freezing; metallurgy division, material science and engineering laboratory. 1st ed. Washington DC: National Institute of Standards and Technology; 2006.
12. Skoog DA, Holler FJ, Crouch SR. Principles of Instrumental Analysis. 6th ed. Belmont: Thomson Brooks/Cole; 2007.
13. Young V. Instrumental methods of analysis. J Chem Edu. 1989;66(1):40–46.
14. Pijpers MFJ, Mathot VBF. Optimization of instrument response and resolution of standard and high-speed power compensation DSC. Jtac. 2008;93:319–327.
15. Brown ME. Hand book of Thermal Analysis and Calorimetry: Principles and Practice. 1st ed. Atlanta: Elsevier; 1998.
16. Guo Y, Li J, Dong S. Hemin functionalized graphene nano sheets-based dual biosensor platforms for hydrogen peroxide and glucose. Sens Actuators B Chem. 2001;160:295–300. doi:10.1016/j.snb.2011.07.050
17. Bhaskar G, Tanuja B. Carbon nanodots as peroxidase nanozymes for biosensing. Molecules. 2016;21(12):1–17.
18. Mahajan A, Kingon A, Kukovecz Á, Konya ZM, Vilarinho P. Studies on the thermal decomposition of multiwall carbon nanotubes under different atmospheres. Mat Lett. 2013;90:165–168. doi:10.1016/j.matlet.2012.08.120
19. Bahreini M, Movahedi M, Peyvandi M, Nematollahi F, Sepasi Tehrani H. Correlation assessment of zeta potential and catalytic activity of graphene nano sheets as nanozyme. Eurasian J Anal Chem. 2018;13(5):47. doi:10.29333/ejac/94451
20. Liu S, Tian J, Wang L, Luo Y, Sun X. A general strategy for the production of photo luminescent carbon nitride dots from organic amines and their application as novel peroxidase-like catalysts for colorimetric detection of H2O2 and glucose. RSC Adv. 2012;2:411–413. doi:10.1039/C1RA00709B
21. Garg B, Bisht T, Ling Y-C. Graphene-based nanomaterials as efficient peroxidase mimetic catalysts for biosensing applications: an overview. Molecules. 2015;20:14155–14190. doi:10.3390/molecules200814155
22. Wang X, Qu K, Xu B, Ren J, Qu X. Multicolor luminescent carbon nanoparticles: synthesis, supramolecular assembly with porphyrin, intrinsic peroxidase-like catalytic activity and applications. Nano Res. 2011;4(9):908–920. doi:10.1007/s12274-011-0147-4
 © 2019 The Author(s). This work is published and licensed by Dove Medical Press Limited. The full terms of this license are available at https://www.dovepress.com/terms.php and incorporate the Creative Commons Attribution - Non Commercial (unported, v3.0) License.
By accessing the work you hereby accept the Terms. Non-commercial uses of the work are permitted without any further permission from Dove Medical Press Limited, provided the work is properly attributed. For permission for commercial use of this work, please see paragraphs 4.2 and 5 of our Terms.
© 2019 The Author(s). This work is published and licensed by Dove Medical Press Limited. The full terms of this license are available at https://www.dovepress.com/terms.php and incorporate the Creative Commons Attribution - Non Commercial (unported, v3.0) License.
By accessing the work you hereby accept the Terms. Non-commercial uses of the work are permitted without any further permission from Dove Medical Press Limited, provided the work is properly attributed. For permission for commercial use of this work, please see paragraphs 4.2 and 5 of our Terms.