")
Back to Journals » Journal of Pain Research » Volume 10
Thermal camera as a pain monitor
Received 11 September 2017
Accepted for publication 15 November 2017
Published 14 December 2017 Volume 2017:10 Pages 2827—2832
DOI https://doi.org/10.2147/JPR.S151370
Checked for plagiarism Yes
Review by Single anonymous peer review
Peer reviewer comments 4
Editor who approved publication: Dr Katherine Hanlon
Varlik K Erel,1 Heval Selman Özkan2
1Department of Anaesthesiology and Reanimation, 2Department of Plastic Surgery, School of Medicine, Adnan Menderes University, Aydin, Turkey
Objectives: Today, many subjective methods are used to measure pain. Wong Baker and Hicks Facial Pain Scale is one of the most commonly used method. Clinicians grade pain according to the facial mimetic reaction of the patient. Unfortunately, there is no objective measure for monitoring pain. By using the same principle of the Wong Baker and Hicks Facial Pain Scale, in this study, we aimed to objectively measure pain by using a thermal camera to detect instant facial temperature changes.
Materials and methods: Thirty volunteers who attended blood collection unit were subjected to facial thermal monitoring and measurements were obtained 5 minutes before needle puncture (BNP), during needle puncture (DNP), and after needle puncture (ANP). Data were processed with TestoIRSoft 3.8 software program and mean temperatures of the whole face (FFM) and highest temperature points (HP), horizontal line (HOR) between two pupils and first glabellar wrinkle, and bilateral lines starting from the nasolabial sulcus to oral commissure (NLS-1 at right, NLS-2 at left) were evaluated. All data were statistically analyzed with paired sample t-test.
Results: Statistically, temperature measurements of HOR, NLS-1, NLS-2, HP, and FFM were significantly higher between BNP and DNP, significantly lower between ANP and DNP, and significantly higher between BNP and ANP (p<0.05). The most interesting result in our analysis was that the HP point was between the two eyebrows in 26 of the 30 volunteers.
Conclusion: Our results suggest that a thermal camera can be used to objectively monitor pain and in follow-up. However, further studies involving non-healthy volunteers (especially high-fever patients, children, immunosuppressive patients, and cancer and intensive care patients) should be performed.
Keywords: pain, thermal camera, analgesia, facial temperature
Introduction
Pain is among of the most common symptoms that everyone experiences in lifetime. Today, the severity of pain is assessed by many subjective methods. Some of the methods are patient dependent like verbal pain scale (VPS); other methods are evaluated by the clinician, like Wong-Baker and Hicks Facial Pain Scale. Effective monitoring of pain is essential to improve the quality of care. Quality indicators are quantitative measures of clinical practice that can monitor, evaluate, and guide the quality of care provided to patients.1 However, all these scales are mostly scored by evaluating subjective measures. A wide range of behavioral pain scales such as COMFORT, CHEOPS, FLACC, and rFLACC have been developed for children and for intensive care patients.2–7 There have been many studies on skin conductance and thermal changes in pain monitoring in children.8–10
Thermal camera has been a subject of research in determining not only the reliability of vascular anastomosis in coronary artery bypass graft operations but also some malignancy studies and sports medicine.11–17 Mozanski et al18 proposed and used thermal camera as an objective measure in paravertebral block patients, but currently there are no objective techniques used in clinical settings to evaluate pain.
Our main aim was to determine thermal changes in facial animation following painful stimuli by using the same principle of the Wong-Baker and Hicks Facial Pain Scale and to see if it contributes to an objective pain monitoring in order to detect pain early and to prevent it from being exacerbated.
Materials and methods
Volunteers between ages 18 and 40 years in ASA1-2 groups without any acute or chronic pain and who were admitted to anesthesiology day clinic of Adnan Menderes University Hospital were included in the study. An informed consent form was signed by each patient. We obtained permission from Adnan Menderes University Interventional Clinical Research Ethics Board (protocol 2016/836 and 38 no) to carry out this study.
Patients with acute and chronic pain, cardiac problems and hypertension (systolic arterial pressure [SAP] 160 mmHg, diastolic arterial pressure 100 mmHg), hypotension (SAP <90 mmHg), fever above 37°C, mental retardation, and those who were uncooperative were not included in the study.
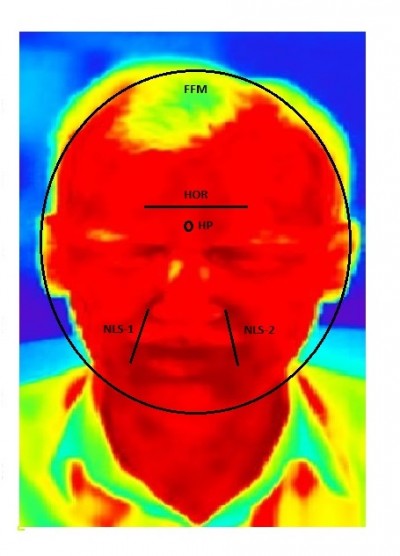
Measurements of the first thermal camera image of patients on blood collection chair were determined as before the needle puncture (BNP), after 5 seconds following the needle attempt as during the needle puncture (DNP), and after 15 seconds following needle removal as after the needle puncture (ANP). Thermal camera recordings were recorded with Testo 885® (Testo SE & Co. KGaA, Nuremberg, Germany). TestoIRSoft 3.8 software program was used to process and analyze data. Using mathematical algorithms in the program, the regions with the most color change and variation were detected. These regions consisted of the highest temperature point (HP), a horizontal line (HOR) extending along the first forehead crease between the two pupils, a line extending from the nasolabial sulcus to the modiolus (NLS-1, NLS-2), and average temperature of the whole face (FFM). NLS-1 is at the right side and NLS-2 at the left side. (Figure 1).
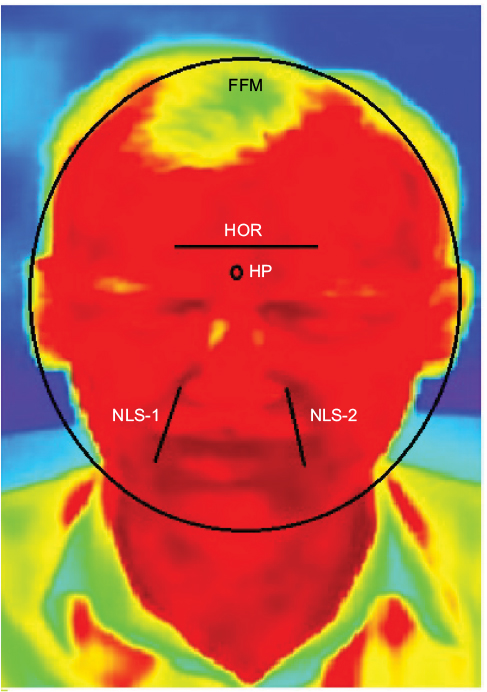 | Figure 1 Temperature measurement regions. Abbreviations: HP, high point; HOR, horizontal; NLS-1 and NLS-2, nasolabial sulcus 1 and 2; FFM, full face mean. |
Statistical analysis
The first six volunteers underwent a pilot study G*Power 3.0.1019 with a priori evaluation of effect size: 2.4804591 for temperature changes before and after needle entry. According to the pilot study, the power of the study was found to be df: 8 total sample size: 10 actual power: 0.97. Therefore, we planned to include 30 volunteers in this study.
SPSS 22.0 program (IBM Corporation, Armonk, NY, USA) was used to analyze the data. Paired samples t-test was applied to compare the data and to compare the groups. Data were analyzed at 95% confidence level and p<0.05 was considered significant.
Results
Twenty of the volunteers were male and 10 were female. There was no statistical difference between the temperature measurements in five regions in terms of age and sex (p>0.05). Statistically, the temperature measurements of HOR, NLS-1, NLS-2, HP, FFM points of the volunteers were significantly higher between BNP and DNP, significantly lower between ANP and DNP, and significantly higher between BNP and ANP (p<0.05). The most interesting result in our analysis was that the HP point was between the two eyebrows in 26 of the 30 volunteers. In the study, HP increased by 1.63% between BNP and DNP, by 1.23% between DNP and ANP, and by 0.39% between BNP and ANP. On the HOR line, an average increase of 2.20% between BNP and DNP, an average decrease of 1.50% between DNP and ANP, and a mean increase of 0.71% between BNP and ANP were detected. On the NLS-1 line, a mean increase of 1.63% between BNP and DNP, an average decrease of 1.27% between DNP and ANP, and an average increase of 0.32% between BNP and ANP were detected. On the NLS-2 line, a mean increase of 1.80% between BNP and DNP, an average decrease of 1.40% between DNP and ANP, and an average increase of 0.43% between BNP and ANP were detected.
At FFM temperatures, an average increase of 1.80% between BNP and DNP, an average decrease of 1.39% between DNP and ANP, and an average increase of 0.45% between BNP and ANP were observed. Statistically significant increases (p<0.05) were found between BNP and DNP and BNP and ANP temperatures at all measurement sites. DNP and ANP temperatures were also significantly lower in all measurement regions (p<0.05) (Figure 2).
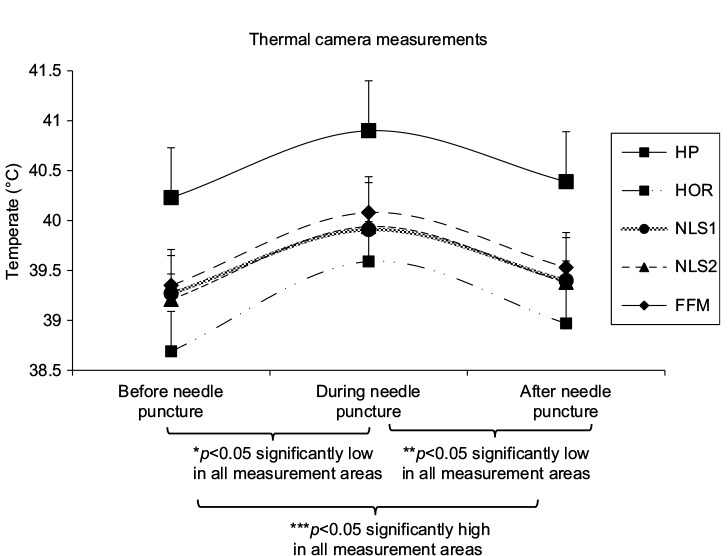 | Figure 2 Thermal camera temperature changes. Notes: *Statistically significantly higher (p<0.05); **statistically significantly lower (p<0.05); ***statistically significantly higher (p<0.05). Abbreviations: FFM, full face mean; HOR, horizontal; HP, high point; NLS-1 and NLS-2, nasolabial sulcus 1 and 2. |
In addition, changes in color tones of the images taken with the thermal camera were also observed in the thermal photos (Figures 3 and 4).
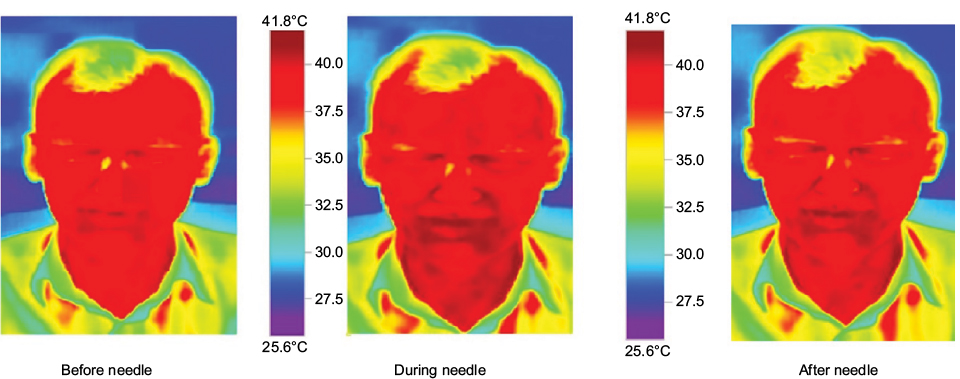 | Figure 3 Thermal camera images. Notes: The color scale shows color tone change from blue to red between 26.5°C and 41.5°C. An increase in darker red tones shows sudden increase in temperature in FFM area during needle puncture. After needle puncture, measurements show a decrease in the temperature of the effected areas. However, there is still a significant temperature increase compared to before needle puncture measurements. Abbreviation: FFM, full face mean. |
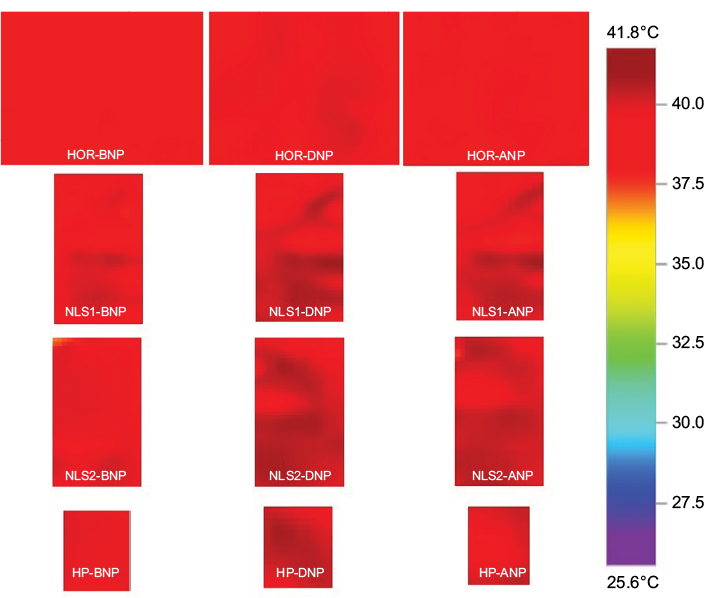 | Figure 4 Thermal camera images. Notes: The color scale shows color tone change from blue to red between 26.5°C and 41.5°C. During needle puncture (DNP) , the increase in dark red tones indicate sudden rise in temperature of HP, NLS-1, NLS-2, HOR areas. After needle puncture (ANP), measurements show a decrease in the temperature of the effected areas. However, there is still a significant temperature increase compared to before needle puncture (BNP) measurements. Abbreviations: HP, high point; HOR, horizontal; NLS-1 and NLS-2, nasolabial sulcus 1 and 2. |
Discussion
The results of this study suggest that a thermal camera may be used to objectively monitor pain, because the changes in temperature were significantly different with highest reliability, as determined by acute pain in all regions. When we try to explain the temperature changes during acute pain, we see that many pain mechanisms participate to event. Pain is one of the most mysterious subjective symptoms. Many theories on the mechanism and pathophysiology of pain have been proposed and many are still under research.20–23 The gate control and selectivity theories are among the best known theories. In addition to these theories, it has been shown that many neurotransmitters such as glutamate, neuropeptide, nitric oxide, noradrenaline, bradykinin, histamine, substance P, serotonin, prostaglandins, leukotriene, and tumor necrosis factor-α play important roles in the pathophysiology of pain.24–30 Many new neurotransmitters play a role in pain response by stimulating the afferent and efferent pathways in neural system.30 Vasodilatation and plasma extravasation occur by the action of tachykinins which are released after stimulation of peripheral nerve endings in pain generation. Following vasodilatation, the nociceptors histamine and bradykinin released from blood cells are sensitized and they prepare the tissues for hyperalgesia.
As a result of direct tissue trauma, serotonin and bradykinin also stimulate the release of prostaglandin and leukotriene through phospholipids present in the cell membrane and increase the susceptibility of nociception that leads to the release of substance P, neurokinine, and calcitonin-gene related protein (CGRP) from the neuropeptides causing inflammation and edema in the affected region.28,29 However, independent of pain production, substance P, neurokinin, and CGRP have also been shown to play a role in the formation of thermal edema and in the systemic inflammatory response process.31 Based on the results of our study, we presumed that same mediators play role in both pain and systemic inflammatory responses (eg, neurokinin, substance P, and CGRP) and synchronously play role in pain stimulus generation and local thermal changes.28,29,31 This demonstrates that an organism responds to a harmful stimulus (eg, pain, inflammation, and tissue damage) through many different pathways, often with the release of the same mediators, even in different tissues.
The supraspinal–spinal reflex response is thought to play a major role in increasing facial temperature after pain signals reach the hypothalamus, central sympathetic nucleus, hippocampus, and limbic system. It is also not surprising that many systems play a role in producing a subjective symptom. The rapid speed at which the body responds to pain is surprising. It is also astounding that response to a pain stimulus occurs within milliseconds in every system. Our face and mimics are under the influence of both emotional and physical states. Although the painful stimulus observed in this study was given from another part of the body, it caused an increase in temperature in an entirely different part. This finding shows that, the central reticulum formation regulating our emotional responses, the hypothalamus, the central sympathetic nucleus and the more central efferent reflexes play a role together.
Mozanski et al18 have successfully used a thermal camera to detect analgesia in a case of paravertebral block. Comparing the results of our study with that of Moisanki et al, we concluded that a thermal camera can be used both in detecting the area of analgesia and in determining the severity of pain, via afferent pathways that allow the body to perceive the severity of a painful stimulus and via efferent pathways that reduce pain intensity. Even this proves to us that pain has a unique reflex arc.
It can be questioned as to why a high temperature was recorded by the thermal camera at the beginning of the study. The thermal imager works with a 99.99999% sensitivity. For this reason, it can be proposed that the measurements obtained are true core temperatures.
One of the limitations of this study is that it was carried out in voluntary adults with normal fever and no systemic disease. Further studies are needed to determine the outcome on such patients. Another limitation is the uncertainty of the modality after the use of analgesic antipyretic medication. Another limitation is our study did not include older patients. We believe that these limitations can be detected with further studies.
We believe that our study is valuable in that it is an objective proof of Wong-Baker’s and Hicks’s facial scale. A temperature increase in the face after a painful stimulus indicates that the response is far beyond the emotional experience of a sensation. The technology has to become more user-friendly and applicable in various other practical scenarios, and this is a good start in that perspective. Thermal camera may be used for not only assessing baseline pain but also determining the response to treatment.
Conclusion
This study shows us that a thermal camera can be used as an objectively valuable monitor for measuring the severity of pain, but future studies should focus on certain limitations of this study.
Acknowledgment
We thank Sylvia M Bozdogan for editing the manuscript.
Disclosure
The authors report no conflicts of interest in this work.
References
Meissner W, Huygen F, Neugebauer EAM, et al. Management of acute pain in the postoperative setting: the importance of quality indicators. Curr Med Res Opin. Epub 2017 Nov 15. | ||
Ambuel B, Hamlett KW, Marx CM, Blumer JL. Assessing distress in pediatric intensive care environments: the COMFORT scale. J Pediatr Psychol. 1992;17:95–109. | ||
Malviya S, Voepel-Lewis T, Burke C, et al. The revised FLACC observational pain tool: improved reliability and validity for pain assessment in children with cognitive impairment. Paediatr Anaesth. 2006;16:258–265. | ||
McGrath PJ, Johnson G, Goodman JT, et al. CHEOPS: a behavioral scale for rating postoperative pain in children. In: Fields HL, Dubner R, Cervero F, editors. Advances in Pain Research and Therapy. New York: Raven Press; 1985:395–402. | ||
Merkel SI, Voepel-Lewis T, Shayevitz JR, Malviya S. The FLACC: a behavioral scale for scoring postoperative pain in young children. Pediatr Nurs. 1997;23:293–297. | ||
Payen JF, Bru O, Bosson JL, et al. Assessing pain in critically ill sedated patients by using a behavioral pain scale. Crit Care Med. 2001;29:2258–2263. | ||
Young J, Siffleet J, Nikoletti S, Shaw T. Use of a behavioural pain scale to assess pain in ventilated, unconscious and/or sedated patients. Intensive Crit Care Nurs. 2006;22:32–39. | ||
Kolosovas-Machuca ES, Martínez-Jiménez MA, Ramírez-García Luna JL, et al. Pain measurement through temperature changes in children undergoing dental extractions. Pain Res Manag. 2016;2016:4372617. | ||
Sabourdin N, Arnaout M, Louvet N, Guye M-L, Piana F, Constant I. Pain monitoring in anesthetized children: first assessment of skin conductance and analgesia-nociception index at different infusion rates of remifentanil. Paediatr Anaesth. 2013;23(2):149–155. | ||
Czaplik M, Hubner C, Kony M, et al. Acute pain therapy in postanesthesia care unit directed by skin conductance: a randomized controlled trial. PLoS One. 2012;7(7):e41758. | ||
Chudecka M, Lubkowska A, Leznicka K, Krupecki K. The use of thermal imaging in the evaluation of the symmetry of muscle activity in various types of exercises (symmetrical and asymmetrical). J Hum Kinet. 2015;49:141–147. | ||
Falk V, Walther T, Philippi A, et al. Thermal coronary angiography for intraoperative patency control of arterial and saphenous vein coronary artery bypass grafts: results in 370 patients. J Card Surg. 1995;10:147–60. | ||
Krawczyk B, Schaefer G, Wozniak M. A hybrid cost-sensitive ensemble for imbalanced breast thermogram classification. Artif Intell Med. 2015;65:219–227. | ||
Miyamoto T, Miyaji K, Ohara K, Tashiro T. Thermal coronary angiography in pediatric coronary artery bypass grafting. Interact Cardiovasc Thorac Surg. 2008;7:161–162. | ||
Mohr FW, Falk V, Krieger H, et al. IMA-graft patency control by thermal coronary angiography during coronary bypass surgery. Eur J Cardiothorac Surg. 1991;5:534–541. | ||
Shabbo FP, Rees GM. Thermography in assessing coronary artery saphenous graft patency and blood flow. Cardiovasc Res. 1982;16:158–162. | ||
Sonmez B, Arbatli H, Tansal S, et al. Real-time patency control with thermal coronary angiography in 1401 coronary artery bypass grafting patients. Eur J Cardiothorac Surg. 2003;24:961–966. | ||
Mozanski M, Rustecki B, Kalicki B, Jung A. Thermal imaging evaluation of paravertebral block for mastectomy in high risk patient: case report. J Clin Monit Comput. 2015;29:297–299. | ||
Erdfelder E, Faul F, Buchner A. GPOWER: a general power analysis program. Behav Res Methods Instrum Comput. 1996;28:1–11. | ||
Loeser JD, Melzack R. Pain: an overview. Lancet. 1999;353:1607–1609. | ||
Melzack R, Wall PD. Pain mechanisms: a new theory. Science. 1965;150:971–979. | ||
Melzack R. Pain – an overview. Acta Anaesthesiol Scand. 1999;43:880–884. | ||
Sun S, Xu Q, Guo C, Guan Y, Dong X. Leaky gate model: intensity-dependent coding of pain and itch in the spinal cord. Neuron. 2017;93(4):840–853.e5. | ||
Cervero F. Sensory innervation of the viscera: peripheral basis of visceral pain. Physiol Rev. 1994;74:95–138. | ||
Dray A, Perkins M. Bradykinin and inflammatory pain. Trends Neurosci. 1993;16:99–104. | ||
Dray A. Kinins and their receptors in hyperalgesia. Can J Physiol Pharmacol. 1997;75:704–712. | ||
Raigorodsky G, Urca G. Intrathecal N-methyl-D-aspartate (NMDA) activates both nociceptive and antinociceptive systems. Brain Res. 1987;422:158–162. | ||
Schouenborg J, Sjolund BH. First-order nociceptive synapses in rat dorsal horn are blocked by an amino acid antagonist. Brain Res. 1986;379:394–398. | ||
Sorkin LS, McAdoo DJ. Amino acids and serotonin are released into the lumbar spinal cord of the anesthetized cat following intradermal capsaicin injections. Brain Res. 1993;607:89–98. | ||
Tedesco LS, Fuseler J, Grisham M, et al. Therapeutic administration of nitric oxide synthase inhibitors reverses hyperalgesia but not inflammation in a rat model of polyarthritis. Pain. 2002;95:215–223. | ||
Imai Y. [A pharmacological study of the participation of the peripheralendings of primary afferent neurons in the inflammatory response evoked by heat and mechanical noxious stimulation]. Osaka Daigaku Shigaku Zasshi. 1990;35:307–320. Japanese. |
 © 2017 The Author(s). This work is published and licensed by Dove Medical Press Limited. The full terms of this license are available at https://www.dovepress.com/terms.php and incorporate the Creative Commons Attribution - Non Commercial (unported, v3.0) License.
By accessing the work you hereby accept the Terms. Non-commercial uses of the work are permitted without any further permission from Dove Medical Press Limited, provided the work is properly attributed. For permission for commercial use of this work, please see paragraphs 4.2 and 5 of our Terms.
© 2017 The Author(s). This work is published and licensed by Dove Medical Press Limited. The full terms of this license are available at https://www.dovepress.com/terms.php and incorporate the Creative Commons Attribution - Non Commercial (unported, v3.0) License.
By accessing the work you hereby accept the Terms. Non-commercial uses of the work are permitted without any further permission from Dove Medical Press Limited, provided the work is properly attributed. For permission for commercial use of this work, please see paragraphs 4.2 and 5 of our Terms.