")
Back to Journals » OncoTargets and Therapy » Volume 7
Therapeutic targeting of Neu1 sialidase with oseltamivir phosphate (Tamiflu®) disables cancer cell survival in human pancreatic cancer with acquired chemoresistance
Authors O'Shea L, Abdulkhalek S, Allison S, Neufeld RJ, Szewczuk M
Received 3 October 2013
Accepted for publication 20 November 2013
Published 16 January 2014 Volume 2014:7 Pages 117—134
DOI https://doi.org/10.2147/OTT.S55344
Checked for plagiarism Yes
Review by Single anonymous peer review
Peer reviewer comments 4
Leah K O'Shea,1 Samar Abdulkhalek,1 Stephanie Allison,2 Ronald J Neufeld,2 Myron R Szewczuk1
1Department of Biomedical and Molecular Sciences, 2Department of Chemical Engineering, Queen's University, Kingston, ON, Canada
Background: Resistance to drug therapy, along with high rates of metastasis, contributes to the low survival rate in patients diagnosed with pancreatic cancer. An alternate treatment for human pancreatic cancer involving targeting of Neu1 sialidase with oseltamivir phosphate (Tamiflu®) was investigated in human pancreatic cancer (PANC1) cells with acquired resistance to cisplatin and gemcitabine. Its efficacy in overcoming the intrinsic resistance of the cell to chemotherapeutics and metastasis was evaluated.
Methods: Microscopic imaging, immunocytochemistry, immunohistochemistry, and WST-1 cell viability assays were used to evaluate cell survival, morphologic changes, and expression levels of E-cadherin, N-cadherin, and VE-cadherin before and after treatment with oseltamivir phosphate in PANC1 cells with established resistance to cisplatin, gemcitabine, or a combination of the two agents, and in archived paraffin-embedded PANC1 tumors grown in RAGxCγ double mutant mice.
Results: Oseltamivir phosphate overcame the chemoresistance of PANC1 to cisplatin and gemcitabine alone or in combination in a dose-dependent manner, and disabled the cancer cell survival mechanism(s). Oseltamivir phosphate also reversed the epithelial-mesenchymal transition characteristic of the phenotypic E-cadherin to N-cadherin changes associated with resistance to drug therapy. Low-dose oseltamivir phosphate alone or in combination with gemcitabine in heterotopic xenografts of PANC1 tumors growing in RAGxCγ double mutant mice did not prevent metastatic spread to the liver and lung.
Conclusion: Therapeutic targeting of Neu1 sialidase with oseltamivir phosphate at the growth factor receptor level disables the intrinsic signaling platform for cancer cell survival in human pancreatic cancer with acquired chemoresistance. These findings provide evidence for oseltamivir phosphate (Tamiflu) as a potential therapeutic agent for pancreatic cancer resistant to drug therapy.
Keywords: human pancreatic cancer, cancer cell survival, chemoresistance, PANC1 cell lines
Introduction
Pancreatic cancer, the fourth leading cause of cancer-related death worldwide, is highly aggressive and associated with a poor prognosis. Resistance to drug therapy, along with high rates of metastasis, contributes to the low survival rates in patients diagnosed with pancreatic cancer.1 Gemcitabine, a chemotherapeutic agent, is the current standard of care for patients with the disease. Although gemcitabine has higher success rates than any other chemotherapeutic agent in use, such as 5-fluorouracil or cisplatin, patients receiving gemcitabine still only have progression-free survival in the range of 0.9–4.2 months.2 Given the poor response rate to gemcitabine, it has been suggested that pancreatic cancer cells develop rapid resistance to this drug.2,3
The mechanism(s) by which cancer cells acquire resistance to chemotherapy is not well understood. Within the last decade, reports have suggested that there is a unique connection between drug resistance and epithelial-mesenchymal transition (EMT).2,4 It is clear that EMT in cancer cells with a loss of E-cadherin and cell-to-cell adhesion promotes metastasis and disease progression. Creighton et al have eloquently reviewed the role of EMT programming in cancer cell invasion and metastasis.5 Their report describes cells undergoing EMT that typically show an increased abundance of vimentin, N-cadherin, fibronectin, integrin αvβ6, and a decrease in E-cadherin, desmoplakin, cytokeratins, and occludin. In addition, several transcriptional suppressor families that regulate EMT are described, including the zinc-finger proteins Snail1 and Snail2, the two-handed zinc-finger δEF1 family factors (δEF1/Zeb1 and SIP1/Zeb2), and the basic helix-loop-helix factors, Twist and E12/E47. There is also evidence to suggest that signals derived from the cellular microenvironment can regulate EMT, such as cell-cell contacts mediated by families of transmembrane receptors and ligands expressed on adjacent cells. What is less clear is the relationship between EMT and chemoresistance in cancer. One report showed that silencing of the two-handed zinc-finger δEF1 family factor, Zeb1, a transcriptional repressor of E-cadherin, restored chemotherapeutic drug sensitivity in pancreatic cancer cells.6 Other reports have indicated phenotypic changes consistent with EMT in breast, ovarian, and lung cancer cells that become resistant to drug therapy.2,4,7,8 Collectively, these results suggest a link between EMT and acquisition of drug resistance, but the mechanism(s) behind this link is becoming more complicated. Indeed, there are reports that strongly implicate a link between transforming growth factor-β (TGF-β) and EMT.9–13 TGF-β is a multifunctional cytokine that is closely involved in regulating numerous physiologic processes, but also functions as a powerful tumor suppressor in mammary epithelial cells, neoplastic development of which ultimately converts TGF-β into an oncogenic cytokine in aggressive late-stage mammary tumors.5 Recent findings have implicated the process of EMT in mediating the functional conversion of TGF-β during progression of breast cancer, suggesting that the chemotherapeutic targeting of EMT induced by TGF-β may offer new approaches to amelioration of metastatic disease.5,14 Katoh et al have reported that activation of Hedgehog signaling leads indirectly to EMT through Notch, TGF-β signaling cascades, and regulatory networks of a small non-coding RNA molecule, ie, microRNA.15 For an example, Hedgehog signaling induces Notch ligand Jag2 upregulation for Notch-CSL-mediated SNAI1 upregulation, as well as TGF-β1 secretion for Zeb1 and Zeb2 upregulation via the TGF-β receptor and nuclear factor-κB.15 TGF-β-mediated downregulation of miR-141, miR-200a, miR-200b, miR-200c, miR-205, and miR-429 results in upregulation of the Zeb1 and Zeb2 proteins. Hedgehog signaling activation may indirectly lead to EMT through Notch, TGF-β signaling cascades, and microRNA regulatory networks.15 Olive et al reported that inhibition of Hedgehog signaling enhanced the delivery of gemcitabine chemotherapy in a KPC rodent model of pancreatic ductal adenocarcinoma.16 Collectively, it is proposed that if a drug could halt the process of EMT, it might also overcome chemoresistance and reduce metastasis, thereby improving the prognosis for patients diagnosed with pancreatic cancer.
Growth factor receptors, such as the epidermal growth factor receptor (EGFR), are upregulated and overexpressed in cancer cells.17 Cancer cells utilize signaling initiated by EGFR to establish an antiapoptotic state within the cell as well as to upregulate mitogenic, angiogenic, and proinvasive cellular mechanisms.17 EGFR signaling has also been linked to EMT.18 For example, therapeutic strategies targeting the EGFR and its inhibition caused a reversal of EMT in human pancreatic cancer.18 Other studies have suggested the potential role of EGFR signaling in establishing chemoresistance.19–22 Given that EGFR signaling appears to be involved in both the acquisition of chemoresistance and induction of EMT, it represents a prime therapeutic target.
An insight into the mechanism of EGF-induced receptor activation came from our recent report on Neu1 sialidase and matrix metalloproteinase (MMP)-9 crosstalk in regulating the EGFR.23 That report highlights a receptor signaling paradigm involving an EGFR-induced G protein coupled receptor signaling process and MMP-9 activation to induce Neu1. This tripartite complex of neuromedin B G protein coupled receptor, MMP-9, and Neu1 forms an alliance with EGFR tethered at the ectodomain of the receptor on the cell surface. Active Neu1 in complex with EGFR hydrolyzes α-2,3-sialyl residues on the receptors, enabling removal of steric hindrance of receptor association and allowing subsequent dimerization, activation, and cellular signaling. Our group has previously reported the striking similarity between this novel receptor signaling platform for nerve growth factor (NGF) TrkA receptors,24 insulin (Alghamdi et al, unpublished data, 2013), and cell surface Toll-like receptor (TLR)-4,25–29 and intracellular TLR-7 and TLR-9 receptors;30 these receptors are known to play a major role in cancer. Oseltamivir phosphate (Tamiflu®) was found to specifically target and inhibit the Neu1 activity associated with activation of these receptors by their ligands.24,29,31 The findings in the report on EGF receptors also propose an alternative therapeutic approach using oseltamivir phosphate as an exciting new anticancer agent targeting Neu1 sialidase as the key central enzyme within this novel EGFR signaling platform. Preclinical molecular targeting studies provide the proof-of-mechanism for Tamiflu as an effective treatment to inhibit growth and metastatic spread of human pancreatic cancer in heterotopic tumor xenografts growing in RAG2xCγ double mutant mice.23
To elucidate the inhibitory ability of Tamiflu further, the 50% inhibitory concentration (IC50) of the compound was determined by plotting the decrease in sialidase activity against the log of the concentration of the agent. Tamiflu had an IC50 of 4.86 μM for EGF-induced sialidase activity in 3T3-EGFR cells,23 which is comparable with the reported IC50 of 3.8 μM for NGF-TrkA24 and 1.175 μM for lipopolysaccharide-TLR-429 ligand-induced sialidase activity in TrkA-PC12 and BMC-2 macrophage cells. With regard to NGF-induced sialidase activity in TrkA-expressing cells, we also reported that other purified neuraminidase inhibitors such as zanamivir (4-guanidino-Neu5Ac2en) and oseltamivir carboxylate achieved limited inhibition of NGF-induced sialidase activity in live TrkA-PC12 cells at 1–2 mM compared with an NGF-positive control group.24 Other studies using recombinant soluble human sialidases have shown that oseltamivir carboxylate, the active metabolite of Tamiflu, scarcely inhibited the activity of the four human sialidases even at 1 mM,32 while zanamivir significantly inhibited the human Neu2 and Neu3 sialidases in the micromolar range. Other studies have found that zanamivir and 2-deoxy-2,3-didehydro-N-acetylneuraminic acid inhibited the endogenous sialidase activity of activated lymphocytes grown in culture, as evidenced by an altered sialylation pattern of cell surface proteins, and that this inhibition of sialidase activity resulted in reduced production of interferon-γ messenger RNA and protein levels in the 1–2 mM range.33
This report describes the efficacy of oseltamivir phosphate in the treatment of pancreatic cancer cells and its ability to disable the potential cancer cell survival mechanism at the receptor signaling platform in pancreatic cancer with acquired chemoresistance. Our findings indicate a reversal of EMT following treatment with oseltamivir phosphate, as demonstrated by expression of N-cadherin, VE-cadherin, and E-cadherin as characteristic markers of EMT, and an increase in the sensitivity of chemoresistant pancreatic cancer cells to drug therapy. Oseltamivir phosphate may offer a promising therapeutic benefit in chemoresistant pancreatic cancers by interfering with growth factor receptor-induced survival signals and by disabling cancer cell survival mechanism(s).
Materials and methods
Cell lines
PANC1 (human pancreatic carcinoma, epithelial-like, ATCC® CRL-1469™), MiaPaCa-2 (human pancreas carcinoma, epithelial cell, ATCC CRL-1420™), BPC-3 (pancreas adenocarcinoma, epithelial, ATCC CRL-1687™), and Capan-1 (pancreas adenocarcinoma derived from liver metastatic site, ATCC HTB-79™) cell lines were obtained from the American Type Culture Collection (Manassas, VA, USA). The cells were grown in a 5% CO2 incubator at 37°C in culture containing Dulbecco’s Modified Eagle’s Medium (Gibco, Rockville, MD, USA) supplemented with 10% fetal calf serum (HyClone, Logan, UT, USA) and 5 μg/mL Plasmocin™ (InvivoGen, San Diego, CA, USA). When the cells reached ~80% confluence, they were passaged at least five times for use in the experiments.
Established PANC1 cell lines resistant to gemcitabine, cisplatin, or a combination of gemcitabine plus cisplatin were generated by exposing PANC1 cells to increasing concentrations of the indicated drugs in 1 × Dulbecco’s Modified Eagle’s Medium (10% fetal calf serum and 5 μg/mL Plasmocin). Dead cells were removed and the viable cells were maintained in culture at the highest indicated drug concentration. Once the surviving cells reached 80% confluence, they were passaged in the same concentration of the chemotherapeutic agent. Stable PANC1 cell lines resistant to 0.01 μM gemcitabine (PANC1-GemR), 80 μM cisplatin (PANC1-CisR), and 0.01 μM gemcitabine plus 80 μM cisplatin (PANC1-GemR/CisR) were used for in vitro experiments.
Isolation of peripheral blood mononuclear cells
About 20 mL of venous blood was collected from a healthy subject by venipuncture into heparinized tubes and processed immediately. The blood was diluted 1:1 in saline solution and layered over Ficoll-Hypaque solution (Sigma-Aldrich Canada Ltd, Oakville, ON, Canada) for separation of mononuclear cells. The recovered peripheral blood mononuclear cells were washed three times with sterile 1 × phosphate-buffered saline and resuspended in Roswell Park Memorial Institute 1640 medium (Gibco, Grand Island, NY, USA) containing heat-inactivated 10% fetal bovine serum, L-glutamine 2 mM, penicillin 100 U/mL, and streptomycin 1%, and adjusted to a concentration of 1 × 10⁶ cells/mL using a hemocytometer. Cell viability was ≥95% using Trypan blue staining under the microscope.
Reagents
Gemcitabine hydrochloride (Sigma-Aldrich Canada Ltd) was dissolved in phosphate-buffered saline to create a 133.5 mM gemcitabine stock. This stock was serially diluted to produce 0.01 μM gemcitabine in 1 × Dulbecco’s Modified Eagle’s Medium containing 10% fetal calf serum and 5 μg/mL Plasmocin solution that was added to tissue culture flasks upon each change of medium.
Cisplatin (II) (Sigma-Aldrich Canada Ltd) was dissolved in dimethyl sulfoxide to create a 27.7 mmol cisplatin stock. This stock was serially diluted to produce 80 μM cisplatin in 1 × Dulbecco’s Modified Eagle’s Medium (10% fetal calf serum and 5 μg/mL Plasmocin) that was added to tissue culture flasks upon each change of medium. The stock solutions were also used to create various dosages of the chemotherapeutic agents to be used in the in vitro experiments.
Inhibitors
Tamiflu® (oseltamivir phosphate free base, Hoffmann-La Roche Ltd, Mississauga, ON, Canada) was used at the concentrations indicated. Tamiflu 75 mg capsules were dissolved in sterile phosphate-buffered saline and centrifuged at 1,000 rpm for 10 minutes to remove the filler. The stock-extracted oseltamivir phosphate solution had a concentration of 15 mg/mL. Pure (98%) oseltamivir phosphate was obtained from Hangzhou DayangChem Co, Ltd (Hangzhou City, People’s Republic of China). High-performance liquid chromatography (HPLC) analyses of the compounds showed a single histogram peak. Cell culture medium containing 1 × Dulbecco’s Modified Eagle’s Medium, 10% fetal calf serum, and 5 μg/mL Plasmocin with different concentrations of oseltamivir phosphate (200–800 μg/mL) were used for the in vitro and in vivo experiments.
HPLC analysis
A 1260 Infinity HPLC and a Poroshell 120 SB-C18 threaded column (Agilent Technologies, Santa Barbara, CA, USA) 4.6 mm × 50 mm (2.7 μm) were used. The extracted oseltamivir phosphate solution in sterile phosphate-buffered saline at 15 mg/mL was further diluted in HPLC grade methanol. Pure oseltamivir phosphate was dissolved in HPLC grade methanol only. The mobile phase was 60% HPLC grade methanol and 40% 0.04 M ammonium acetate buffer (pH 5.2) at a flow rate of 1 mL per minute. Oseltamivir phosphate was detected at 230 nm. The column temperature was 25°C, the injection volume was 20 μL, and each sample was analyzed for 10 minutes.
Antibodies
Rabbit monoclonal E-cadherin antibody serum (Cell Signaling Technology, Inc, Danvers, MA, USA), which recognizes the human E-cadherin epitope, was used for immunocytochemistry at a 1:200 dilution and for immunohistochemistry using a 1:400 dilution according to the manufacturer’s instructions. Purified rabbit monoclonal N-cadherin (Cell Signaling Technology, Inc) and VE-cadherin (Cell Signaling Technology, Inc) antibody serum, which recognizes the human N-cadherin and VE-cadherin epitopes, respectively, were used in immunocytochemistry at a 1:200 dilution according to the manufacturer’s instructions.
DyLight™ 488 donkey anti-rabbit IgG secondary antibody (Santa Cruz Biotechnology, Inc, Santa Cruz, CA, USA) was used for immunocytochemistry to detect E-cadherin and VE-cadherin primary antibodies. A final concentration of 40 μg/mL was used. Alexa Fluor® 594 goat anti-rabbit secondary antibody (Santa Cruz Biotechnology, Inc) was used for immunocytochemistry to detect N-cadherin primary antibodies at a final concentration of 1 μg/mL. For immunohistochemistry, polyclonal goat anti-rabbit biotinylated immunoglobulin (Dako Canada, Inc, Burlington, ON, Canada) was used as a secondary antibody at a final concentration of 1.9 μg/mL.
Morphologic analysis
The morphology of the PANC1 cells was analyzed after chronic exposure to chemotherapy. Cells were grown to 70%–80% confluence in the appropriate drug-free medium for the parental PANC1 cell line, and in medium with the indicated concentrations of chemotherapeutic drugs for the PANC1-GemR, PANC1-CisR, and PANC1-GemR/CisR cell lines. The flasks were visualized using light microscopy and pictures were taken using a camera mounted on the microscope (Fisher Scientific Company, Ottawa, ON, Canada) at 200× magnification. Additional PANC1-GemR cells were visualized using the mounted camera and pictures were taken at 70% confluence and 200× magnification (indicated time 0 hours). Oseltamivir phosphate (500 μg/mL) was added to the PANC1-GemR cells for 48 hours. Changes in cell shape and amount of cellular projections were monitored after addition of oseltamivir phosphate. Pictures were taken after 48 hours at 200× magnification.
Immunocytochemistry
Immunocytochemistry was used to determine the presence of the characteristic epithelial marker E-cadherin, and the characteristic mesenchymal markers, N-cadherin and VE-cadherin, on the surface of parental PANC1 and chemoresistant PANC1 (ie, PANC1-GemR, PANC1-CisR, and PANC1-GemR/CisR) cells before and after addition of oseltamivir phosphate. The cells were plated in 24-well multiwell plates with glass coverslips and cultured overnight in a 37°C CO2 incubator. The PANC1 cell line and chemoresistant cell lines (ie, PANC1-GemR, PANC1-CisR, and PANC1-GemR/CisR) were then pretreated with oseltamivir phosphate 600 μg/mL in Dulbecco’s Modified Eagle’s Medium for 24 hours. Next, the cells were fixed using 4% paraformaldehyde for 15 minutes, washed three times with cold Tris-buffered saline, and then blocked for 2 hours using 4% bovine serum albumin in Tris-buffered saline and Tween 20. After removal of the blocking buffer, primary antibodies for E-cadherin, N-cadherin, and VE-cadherin were added and kept at room temperature for one hour. After washing with Tris-buffered saline, secondary antibodies were added and incubated for one hour at 37°C. Chemoresistant and parental PANC1 cells were also analyzed, following the same method outlined above. The background control had no primary antibody added during the procedure described above. Stained cells were visualized 24 hours after completion of the assay using a Zeiss M2 fluorescence microscope (Carl Zeiss AG, Oberkochen, Germany) at 400× magnification.
Heterotopic xenograft mouse model of human pancreatic cancer
An immunodeficient mouse with a double mutation combining recombinase activating gene-2 (RAG2) and common cytokine receptor γ chain (Cγ) was used as the xenograft model, as reported previously by our group.23 RAG2xCγ double mutant mice on a BALB/c genetic background are completely alymphoid (deficient in T-cells, B-cells, and natural killer cells), show no spontaneous tumor formation, and exhibit normal hematopoietic parameters. These mice were generated by intercrossing and were maintained in specific pathogen-free isolators in the animal care facility at Queen’s University, Kingston, ON, Canada. A colony was established in the animal facility. All mice were kept under sterile conditions in micro-isolators or air-filtered cages, and were provided with autoclaved food and water. All mice used in the studies were approved by the animal care committee at Queen’s University. They were used when aged 6–8 weeks.
Immunohistochemistry
Immunohistochemistry was used to determine the presence of the characteristic epithelial marker, E-cadherin, in human pancreatic tumors removed at necropsy from tumor-bearing RAG2xCγ double mutant mice which had received various treatments (gemcitabine 30 mg/kg, oseltamivir phosphate 2 mg/kg, gemcitabine 30 mg/kg + oseltamivir phosphate 5 mg/kg, or untreated). Archived processed tumors embedded in paraffin blocks were obtained from a previous experiment. An immunodeficient mouse model with a double mutation in RAG2 and Cγ was used as a xenograft mouse model of human pancreatic cancer as previously reported by our group.23
The RAG2xCγ double mutant mice were implanted cutaneously with 1 × 10⁶ PANC1 cells and treatment was started 22–23 days post-implantation. Treatment was continued until the mice either died or were euthanized at the end of the experiment. Tumor sections (5 μm) were deparaffinized, heated for 8 minutes in citrate buffer for antigen retrieval, placed in 0.03% H2O2 for 30 minutes to block endogenous peroxidases, rinsed three times in phosphate-buffered saline, and blocked in 1% bovine serum albumin (Fisher Scientific Company) overnight at 4°C. Sections were then incubated with primary E-cadherin antibody for one hour, followed by incubation with polyclonal goat anti-rabbit biotinylated secondary antibody for one hour and then incubation with Extra-Avidin® peroxidase (Sigma-Aldrich Canada Ltd) at a concentration of 0.25 μg/mL for 30 minutes. A DAB+ substrate chromogen system (Dako Canada, Inc) was added to the sections for 2 minutes according to the manufacturer’s instructions. Sections were then counterstained using hematoxylin for 30 minutes and dehydrated. Coverslips were added using Permount mounting medium (Electron Microscopy Sciences, Hatfield, PA, USA). Background control sections were also prepared in the same way as above, with the exception of addition of the E-cadherin primary antibody. Tissue sections were visualized and photographed using a Zeiss Image M2 microscope at 400× magnification.
Deparaffinized and processed tumor sections (5 μm) were also treated with 4% bovine serum albumin in Tween-Tris buffered saline and immunostained with primary and secondary antibody over one-hour periods. The primary antibody contained 2 μg/mL rabbit anti-N-cadherin or anti-VE-cadherin followed with secondary donkey anti-rabbit IgG Alexa Fluor 488. The stained cells were observed using a Zeiss M2 fluorescence microscope at 200× magnification.
Alexa Fluor 488 phalloidin staining for F-actin
Cells (~5 × 10³ per glass slide) were grown in 24-well tissue culture plates on 12 mm circular glass slides for 24 hours. The cells were fixed in 4% paraformaldehyde for 30 minutes on ice, and permeabilized with 0.2% Triton X-100 in phosphate-buffered saline for 5 minutes. The cells were then stained with Alexa Fluor 488 conjugated phalloidin (1:40 dilution of 300 U, Life Technologies Inc, Burlington, ON, Canada) in a blocking solution of 1% bovine serum albumin in phosphate-buffered saline for 7 minutes at room temperature. Cell staining was analyzed using a Zeiss M2 fluorescence microscope (40× objective).
WST-1 assay
The WST-1 assay, a measure of cell viability based on the reduction of a tetrazolium compound to a soluble derivative,34 was used. The absorbance recorded at 420 nm is directly proportional to the number of living cells in culture. At 80%–90% confluence, each cell line (ie, PANC1, PANC1 GemR, PANC1 CisR, and PANC1 GemR/CisR) was added to 96-well microwell plates at a density of 5,000 cells/well and incubated overnight. The cells were then exposed to increasing concentrations of Tamiflu (200–800 μg/mL) or left untreated as controls for 24, 48, and 72 hours. Absorbance readings were taken at 0, 24, 48, and 72 hours by adding WST-1 (Roche Diagnostics Division de Hoffman La Roche Limitée, Laval-des-Rapides, QC, Canada) as a cell proliferation reagent to each well (10% WST-1 in Dulbecco’s Modified Eagle’s Medium) followed by incubation at 37°C for 2 hours before reading at the indicated time points. Cell viability was presented as a percentage of control, and illustrated as a bar graph using GraphPad Prism software (GraphPad Software, La Jolla, CA, USA). The following formula was used to determine cell viability as a percent of control for each time point and Tamiflu/chemotherapeutic drug concentration:

Statistical analysis
Comparisons between two groups were made by one-way analysis of variance at 95% confidence using the unpaired t-test and Bonferroni’s multiple comparison test or uncorrected Fisher’s least significant difference for comparisons between more than two groups.
Results
Viability of PANC1 and PANC1 cells with chemoresistance to 0.01 μM gemcitabine when treated with pure and extracted oseltamivir phosphate at different doses using the WST-1 assay
Using the 1260 Infinity HPLC system and Poroshell 120 SB-C18 threaded column, pure and extracted oseltamivir phosphate free base from 75 mg Tamiflu capsules at 500 μg/mL were tested for purity of the compounds. The data shown in Figure 1A and B clearly indicate a single chromatograph peak with no visible residue contaminants in the compounds. To test the in vitro effects of oseltamivir phosphate on cell viability using PANC1 cells and PANC1 cells with chemoresistance to 0.01 μM gemcitabine (PANC1-GemR), the cells was incubated in 96-well plates (5,000 cells/well) and allowed to adhere for 24 hours in 1 × Dulbecco’s Modified Eagle’s Medium containing 10% fetal calf serum. The medium was replaced with fresh Dulbecco’s Modified Eagle’s Medium containing 5% fetal calf serum without and with various concentrations of pure and extracted oseltamivir phosphate for 24, 48, and 72 hours as optimally predetermined. Cell viability as a percentage of control ± standard error of the mean of triplicate values was determined using the WST-1 cell proliferation assay, which is a measure of cell viability based on the reduction of a tetrazolium compound to the soluble derivative.34 The data shown in Figure 1C–F indicate that treatment of these pancreatic cancer cell lines with both pure and extracted Tamiflu reproducibly and dose-dependently decreased the cell viability (percentage of untreated control) after 24, 48, and 72 hours of incubation. It is noteworthy that the extracted Tamiflu had a better dose-dependent effect than the pure fraction on cell viability. These data are consistent with the results of our previous report indicating that treatment of PANC1 and MiaPaCa-2 pancreatic cancer cell lines with pure Tamiflu reproducibly and dose-dependently abated cell viability (percentage of untreated control) as determined by the tetrazolium dye 3-(4,5-dimethylthiazol-2-yl)-2,5-diphenyltetrazolium bromide (MTT) cell proliferation assay after 72 hours of incubation.23
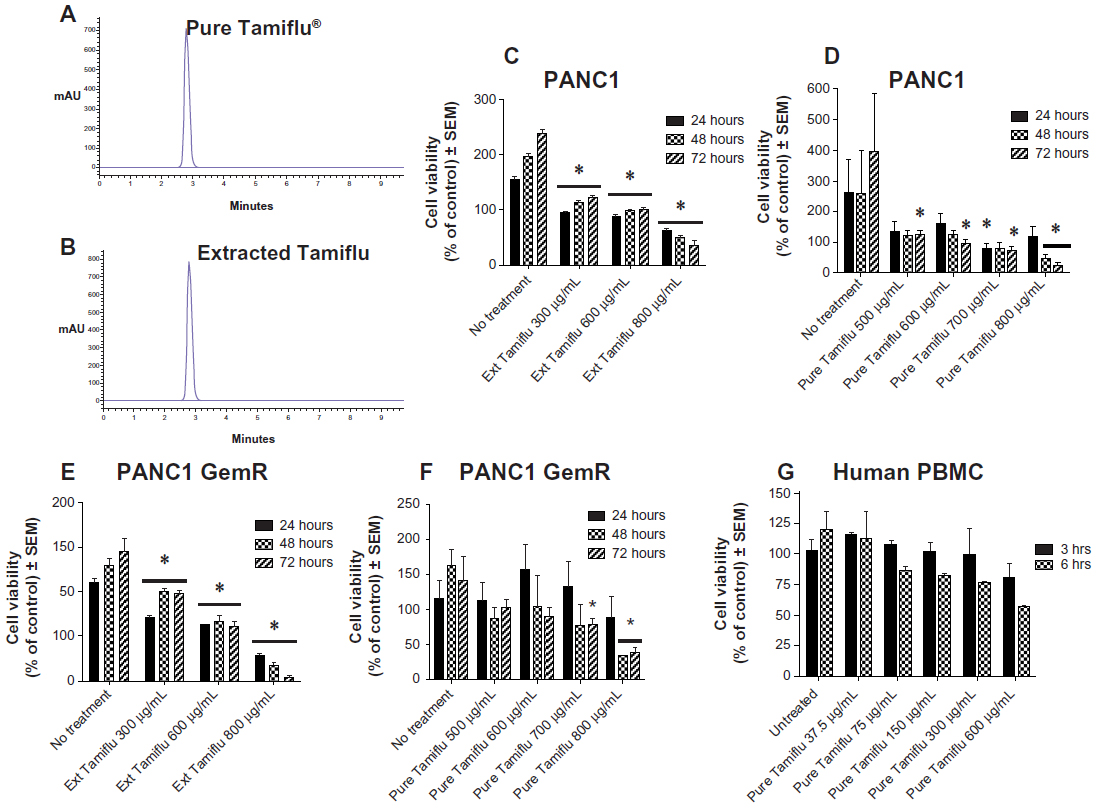 | Figure 1 Viability of PANC1 cells and PANC1-GemR cells treated with pure and extracted (75 mg Tamiflu® capsules) oseltamivir phosphate at different doses using the WST-1 assay. HPLC chromatogram of (A) extracted oseltamivir phosphate (75 mg Tamiflu capsules) and (B) pure oseltamivir phosphate (98% purity). (C and D) Viability of PANC1 cells treated with extracted and pure oseltamivir phosphate at different dosages. (E and F) Viability of PANC1-GemR cells treated with extracted and pure oseltamivir phosphate. (G) Viability of normal human PBMCs treated with pure oseltamivir phosphate at different dosages. *P<0.01 versus untreated controls (n=3). |
Using the MTT or WST-1 cell viability assays, the concentration of oseltamivir phosphate required to kill 50% of viable cells (LD50) in the different human pancreatic cancer cell lines is shown in Table 1. The oseltamivir phosphate LD50 value of 2 μM for chemosensitive Capan-1 cells was ~700-fold lower than that for the other chemoresistant cell lines. The dose range used for oseltamivir phosphate had no significant effects on the viability of normal human mononuclear peripheral blood cells (Figure 1G). In addition, we have reported that heterotopic xenografts of MiaPaCa-2 tumors grown in RAGxCγ double mutant mice showed no side effects of Tamiflu 100 mg/kg given intraperitoneally daily for 7 days.23
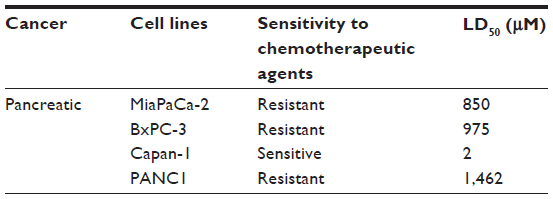 | Table 1 LD50 values for effects of oseltamivir phosphate on viability of cancer cells in culture |
Response of long-term cultures of PANC1 cells with chemoresistance to 0.01 μM gemcitabine, 80 μM cisplatin, and a combination of both agents
Phenotypic changes consistent with EMT, including increased spindle-shaped morphology and increased cellular projections (pseudopodia), have been reported in breast, ovarian, and lung cancer cells that become resistant to drug therapy.2,3,35 Given the morphologic changes seen in other types of chemoresistant cancer, we hypothesized that PANC1 cells surviving chemotherapeutic treatment in culture would show increased spindle-shaped morphology and cellular projections. The data depicted in Figures 2–4 are consistent with this hypothesis. PANC1 cells resistant to 80 μM cisplatin (Figure 2B), 0.01 μM gemcitabine (Figure 3B), and a combination of these drugs (Figure 4B) show increased cellular projections and more spindle-shaped cells compared with untreated control PANC1 cells (Figures 2A–4A, respectively). These morphologic observations were confirmed using Alexa Fluor 488 conjugated phalloidin staining of fixed and permeabilized representative cells (inserts), which is a high-affinity probe for filamentous F-actin. These results suggest that chronic exposure of PANC1 cells to gemcitabine, cisplatin, or a combination of both drugs establishes chemoresistance and is accompanied by EMT.
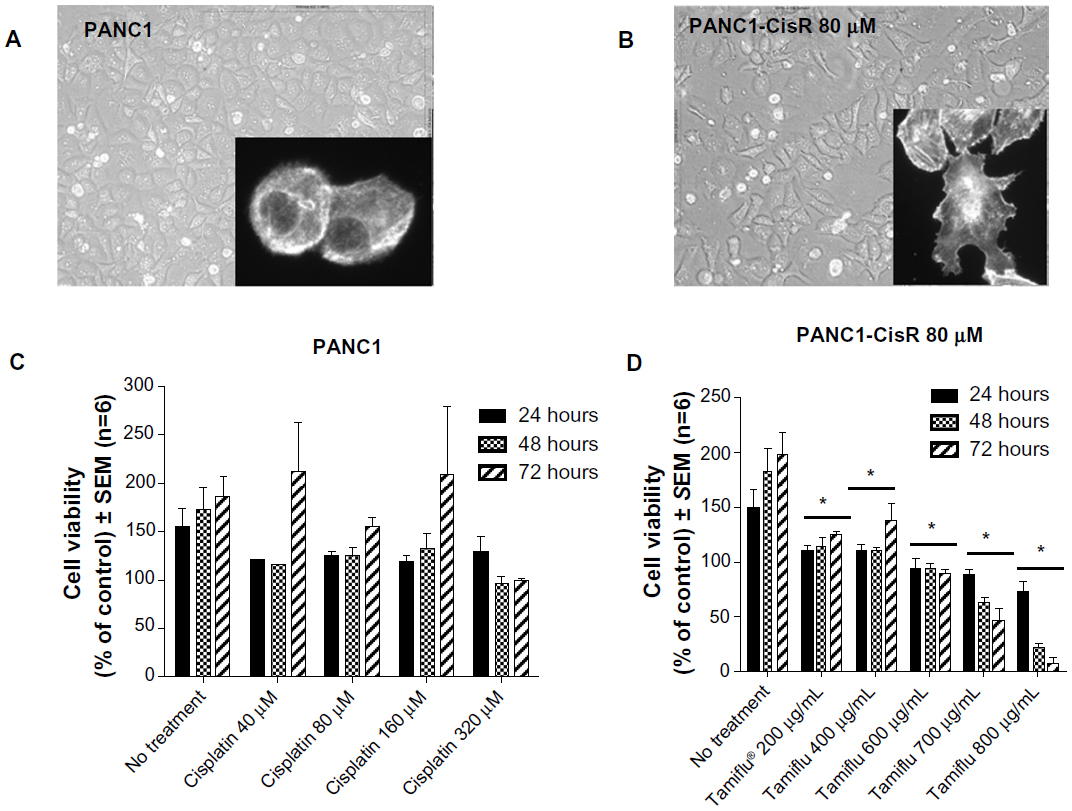 | Figure 2 Morphology and viability of PANC1 cells and PANC1-CisR cells. Morphology of live (A) PANC1 and (B) PANC1-CisR cells was visualized using inverted light microscopy and imaged with a digital camera mounted on the microscope at 200× magnification. Images shown are representative of at least two fields of view on five different days (capturing the morphologic changes through five cell passages). Inserts: representative Alexa Fluor 488® (Life Technologies Inc, Burlington, ON, Canada) phalloidin cell staining for F-actin. (C) Viability of PANC1 cells treated with cisplatin at different dosages. Error bar represents the SEM for six independent trials. (D) Viability of PANC1-CisR cells treated with oseltamivir phosphate. Error bar represents the SEM for six independent trials. *P<0.01 versus untreated controls (n=6). |
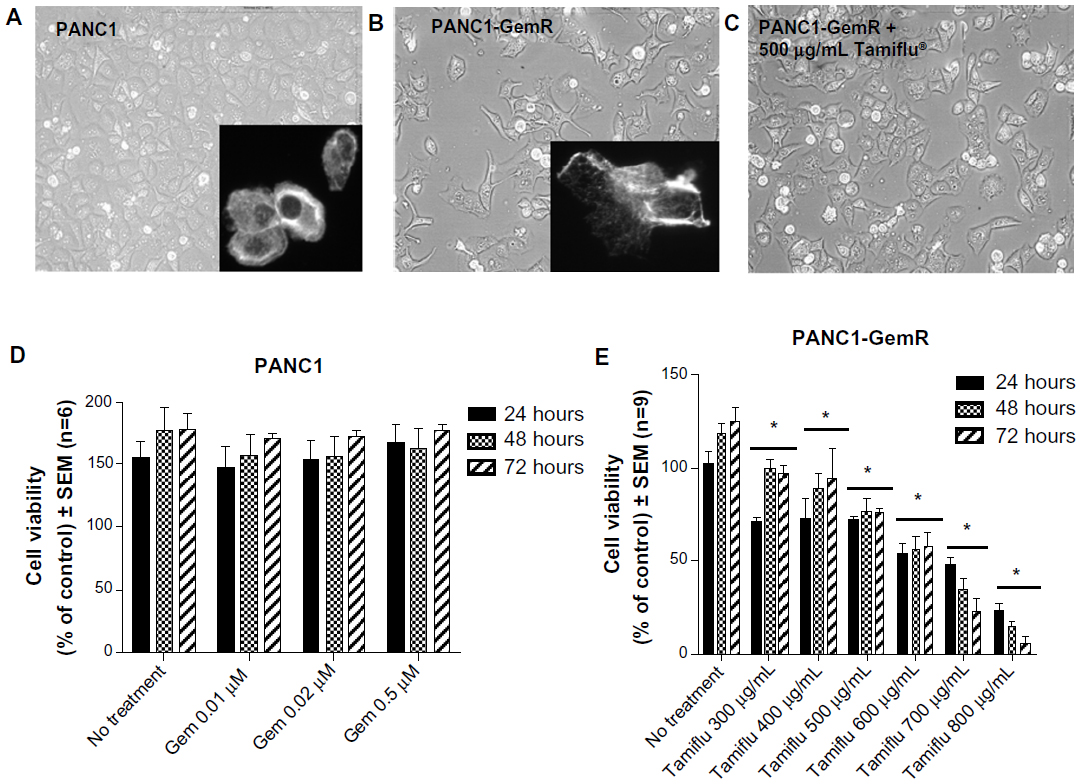 | Figure 3 Morphology and cell viability of PANC1 and PANC1-GemR cells. Morphology of live (A) PANC1 cells, (B) PANC1-GemR cells, and (C) PANC1-GemR cells treated with oseltamivir phosphate 500 μg/mL for 24 hours was visualized using an inverted light microscopy at 200× magnification. Images shown are representative of at least two fields of view on five different days (capturing the morphologic changes through five cell passages). Inserts: representative Alexa Fluor 488® (Life Technologies Inc, Burlington, ON, Canada) phalloidin cell staining for F-actin. (D) Viability of PANC1 cells treated with gemcitabine at the indicated dosage was performed using the WST-1 assay. (E) Viability of PANC1-GemR cells treated with oseltamivir phosphate. Error bar represents the SEM for six independent trials. *P<0.01 versus untreated controls (n=6). |
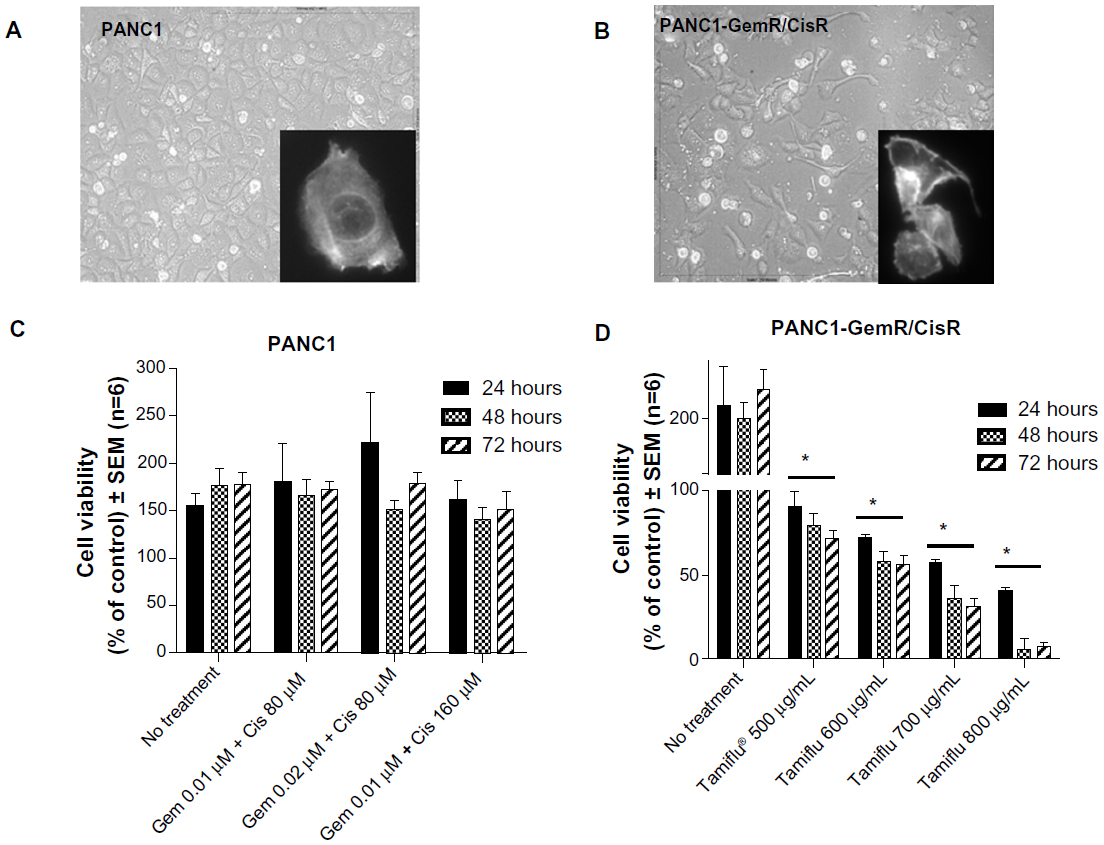 | Figure 4 Morphology and viability of PANC1 cells and PANC1-GemR/CisR cells. The morphology of live (A) PANC1 cells and (B) PANC1-GemR/CisR cells was visualized using an inverted light microscopy at 200× magnification. The images shown are representative of at least two fields of view on five different days (capturing the morphologic changes through five cell passages). Inserts: representative Alexa Fluor 488® (Life Technologies Inc, Burlington, ON, Canada) phalloidin cell staining for F-actin. (C) Viability of PANC1 cells treated with a combination of gemcitabine and cisplatin at the indicated dosages. (D) Viability of PANC1 GemR/CisR cells treated with oseltamivir phosphate at the indicated dosages. Error bars represent the SEM for six independent trials. *P<0.01 versus no treatment control groups (n=6). |
Oseltamivir phosphate induces mesenchymal to epithelial transition morphology in PANC1 cells with resistance to gemcitabine
If promising targets for new pancreatic cancer therapeutics are enzymes in the survival mechanisms against chemotherapeutics, we hypothesized whether Neu1 sialidase acting at the growth factor receptor level is a druggable target using oseltamivir phosphate involved in our newly discovered signaling platform.31 To test this, chemoresistant PANC1 cells were treated with oseltamivir phosphate 500 μg/mL for 48 hours. The data in Figure 3C show a morphologic change in PANC1-GemR cells treated with oseltamivir phosphate compared with untreated PANC1-GemR control cells (Figure 3B). PANC1-GemR cells appeared more organized and columnar in shape following treatment with oseltamivir phosphate, and similar to PANC1 cells (Figure 3A), which are more characteristic of epithelial cells.2 However, some of the PANC1-GemR cells showed a spindle-shaped morphology following treatment with oseltamivir phosphate.
Treatment of chemoresistant PANC1 cells with oseltamivir phosphate disables cancer cell survival
Other reports have linked EMT with the acquisition of drug resistance.2,3,35 The results reported in this study indicate the ability of oseltamivir phosphate to partially induce mesenchymal to epithelial transition (MET) in chemoresistant PANC1 cells. It was therefore hypothesized that chemoresistant PANC1 cells in the presence of oseltamivir phosphate might become more sensitive to the chemotherapeutic agent, resulting in decreased viability of chemoresistant PANC1 cells. Using the WST-1 assay, the viability of cells treated with different combinations of oseltamivir phosphate and/or the chemotherapeutic agent was compared with that of the untreated control cells.
The data shown in Figures 2–4 indicate an inability of the chemotherapeutic drugs to decrease the viability of PANC1 cells compared with untreated control cells. PANC1 cells treated with cisplatin doses up to 320 μM (Figure 2B), gemcitabine up to 0.5 μM (Figure 3D), and various combinations of gemcitabine/cisplatin dosages (Figure 4C) show limited effects on cell viability compared with the untreated control group. These results confirm the strong ability of PANC1 cells to become chemoresistant. Treatment of long-term chemoresistant PANC1 cells with oseltamivir phosphate caused a significant dose-dependent reduction of cell viability (~95% reduction up to 72 hours as a percentage of untreated control PANC1 cells; 96% reduction for PANC1-CisR [Figure 2D]; 95% reduction for PANC1-GemR [Figure 3E], and 96% reduction for PANC1-GemR/CisR [Figure 4D]).
Cadherin expression on surface of chemoresistant PANC1 cells following treatment with oseltamivir phosphate
Given that treatment with oseltamivir phosphate results in morphologic changes characteristic of MET, we wondered whether this treatment would also result in decreased expression of the cell surface mesenchymal marker, N-cadherin, and increased expression of the cell surface epithelial marker, E-cadherin. Expression of VE-cadherin was also investigated, given the role that this cadherin plays in tumor angiogenesis and progression of cancer.36 Expression of both cadherins was investigated in PANC1 cells and chemoresistant PANC1-GemR, PANC1-CisR, and PANC1-GemR/CisR cells using immunocytochemistry. The data shown in Figure 5 indicate that treatment with oseltamivir phosphate 600 μg/mL (1.46 mM) for 24 hours resulted in significantly increased expression of E-cadherin by PANC1-GemR cells, but no significant differences for PANC1-CisR and PANC1-GemR/CisR cells. There was a significant decrease in expression of N-cadherin and VE-cadherin in PANC1, PANC1-CisR, and PANC1-GemR/CisR cells, with the exception of VE-cadherin in PANC1-GemR/CisR cells following treatment with oseltamivir phosphate at 600 μg/mL for 24 hours. Background antibody binding was confirmed for each cell line (ie, PANC1, PANC1-GemR, PANC1-CisR, and PANC1-GemR/CisR) where cells were incubated only with secondary antibodies. The results suggest that chemoresistant PANC1 cells express higher amounts of N-cadherin compared with PANC1 cells, but this expression was significantly reduced with a concomitant increase in E-cadherin following treatment with oseltamivir phosphate for 24 hours.
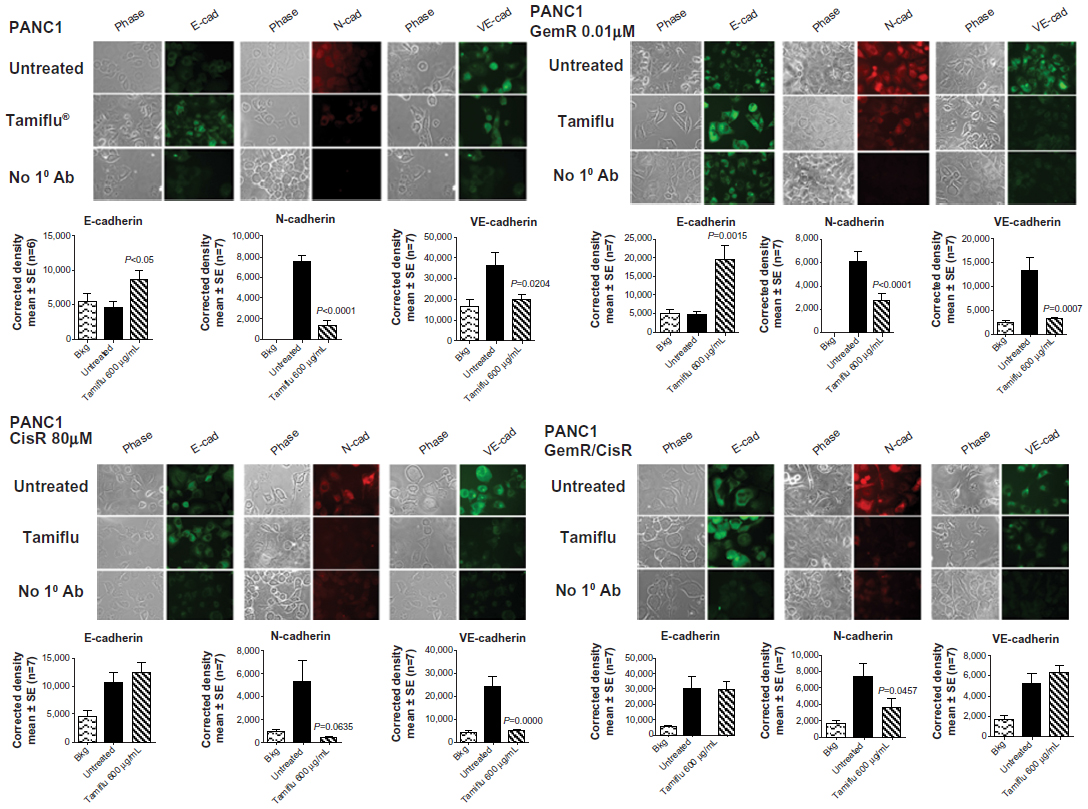 | Figure 5 Expression of E-cadherin, N-cadherin, and VE-cadherin on the surface of PANC1, PANC1-GemR, PANC1-CisR, and PANC1-GemR/CisR cells following treatment with Tamiflu® 600 μg/mL for 24 hours. Immunocytochemistry was performed on fixed, nonpermeabilized cells. The indicated primary antibodies for E-cadherin, N-cadherin, and VE-cadherin were used, followed by Alexa Fluor® 594 (Life Technologies Inc, Burlington, ON, Canada) secondary antibody for the primary antibody against N-cadherin and DyLight™ 488 (Santa Cruz Biotechnology, Inc, Santa Cruz, CA, USA) secondary antibody for primary antibodies against E-cadherin and VE-cadherin. The background controls had no primary antibody during the staining procedure. The stained cells were visualized after 24 hours using a Zeiss M2 Imager fluorescence microscope (Carl Zeiss AG, Oberkochen, Germany) at 400× magnification. Images are representative of at least four fields of view in three separate trials. Quantitative analysis was done by assessing the density of cell staining corrected for background in each panel using Corel Photo Paint 8.0 software (Corel Corporation, Ottawa, ON, Canada). Each bar in the figures represents the mean (± standard error of the mean) corrected density of culture cell staining for equal cell density (5 × 10⁵ cells) within the respective images. P-values represent significant differences at 95% confidence using Dunnett’s multiple comparison test compared with untreated control group. |
Cadherins in necropsy paraffin- embedded tumor sections from PANC1 tumor-bearing xenografts in RAGxCγ double mutant mice
E-cadherin, N-cadherin, and VE-cadherin expression was analyzed in archived paraffin-embedded necropsy tumor sections from PANC1 tumor-bearing xenografts in RAGxCγ double mutant mice treated with either gemcitabine 30 mg/kg, oseltamivir phosphate 2 mg/kg, or oseltamivir phosphate 5 mg/kg plus gemcitabine 30 mg/kg, and in the untreated cohort. Since oseltamivir phosphate has an effect on E-cadherin expression in chemoresistant PANC1 cells, we investigated whether paraffin-embedded necropsy tumor sections would show differences in E-cadherin expression. Using avidin/biotin peroxidase immunohistochemical analysis, it was found that necropsy tumor sections from mice treated with oseltamivir phosphate alone or in combination with gemcitabine showed strong staining for E-cadherin (Figure 6) compared with the tumor sections from untreated and gemcitabine-treated cohorts. Background control sections that received no primary antibody were used to show minimal nonspecific staining.
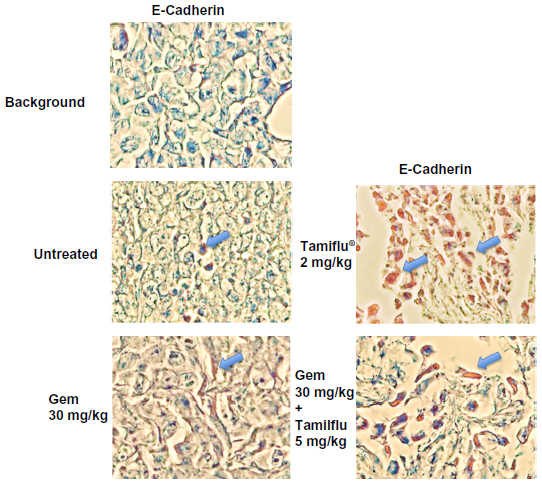 | Figure 6 Avidin/biotin peroxidase immunohistochemical detection of E-cadherin in paraffin-embedded tumor tissues archived from xenograft tumors of PANC1 cells growing in RAGxCγ double mutant mice. Mice were implanted with 1 × 10⁶ PANC1 cells cutaneously on the rear flank and treatment was started at 22–23 days post implantation when tumors reached 100–200 mm3. Gemcitabine 30 mg/kg was injected intraperitoneally twice weekly in a D4 mouse and a tumor necropsy specimen was taken at day 112. Oseltamivir phosphate 2 mg/kg was injected intraperitoneally daily in a B4 mouse and a tumor necropsy specimen was taken at day 94. Gemcitabine 30 mg/kg (twice weekly) followed with oseltamivir phosphate at 5 mg/kg daily were injected intraperitoneally in an I1 mouse and a tumor necropsy specimen was taken at day 108. An untreated control A2 mouse received no treatment and a tumor necropsy specimen was taken at day 77. Paraffin-embedded tumor sections (5 μm) on glass slides were processed for immunohistochemistry using primary anti-E-cadherin antibody followed with goat anti-rabbit biotinylated secondary antibody and Extra-Avidin® (Sigma-Aldrich Canada Ltd, Oakville, ON, Canada) peroxidase. A DAB+ substrate chromogen system was added followed with hematoxylin counterstain and Permount mounting media. Background control sections were prepared without the anti-E-cadherin primary antibody. Tissue sections were visualized and photographed using a Zeiss Imager M2 microscope (Carl Zeiss AG, Oberkochen, Germany) at 400× magnification. Cells with dark brown staining indicate positive E-cadherin expression. Images are representative of at least two fields of view from two tumor sections. |
In addition, we used fluorescence immunohistochemistry on the same paraffin-embedded necropsy tumor sections. The data shown in Figure 7C confirm the results using avidin/biotin peroxidase analysis. They indicate that PANC1 tumor cells from an untreated tumor-bearing mouse showed more N-cadherin and VE-cadherin staining than E-cadherin staining compared with the background control. The fluorescent images showed consistency over five or more different locations of the tumor section. Unexpectedly, tumor tissue from the mouse treated with gemcitabine showed N-cadherin and VE-cadherin staining similar to that of tumor tissue from an untreated mouse. In contrast, tumor tissue obtained from the mouse treated with oseltamivir phosphate at 5 mg/kg in combination with gemcitabine 30 mg/kg had more E-cadherin staining than N-cadherin and VE-cadherin staining. This low dose of oseltamivir phosphate in the tumor-bearing mouse either alone or in combination with gemcitabine did not prevent metastatic spread to the liver (Figure 7D) or lung (Figure 7E). These latter results suggest that the oseltamivir phosphate regimen requires an optimal dosage for metastatic cancer treatment.
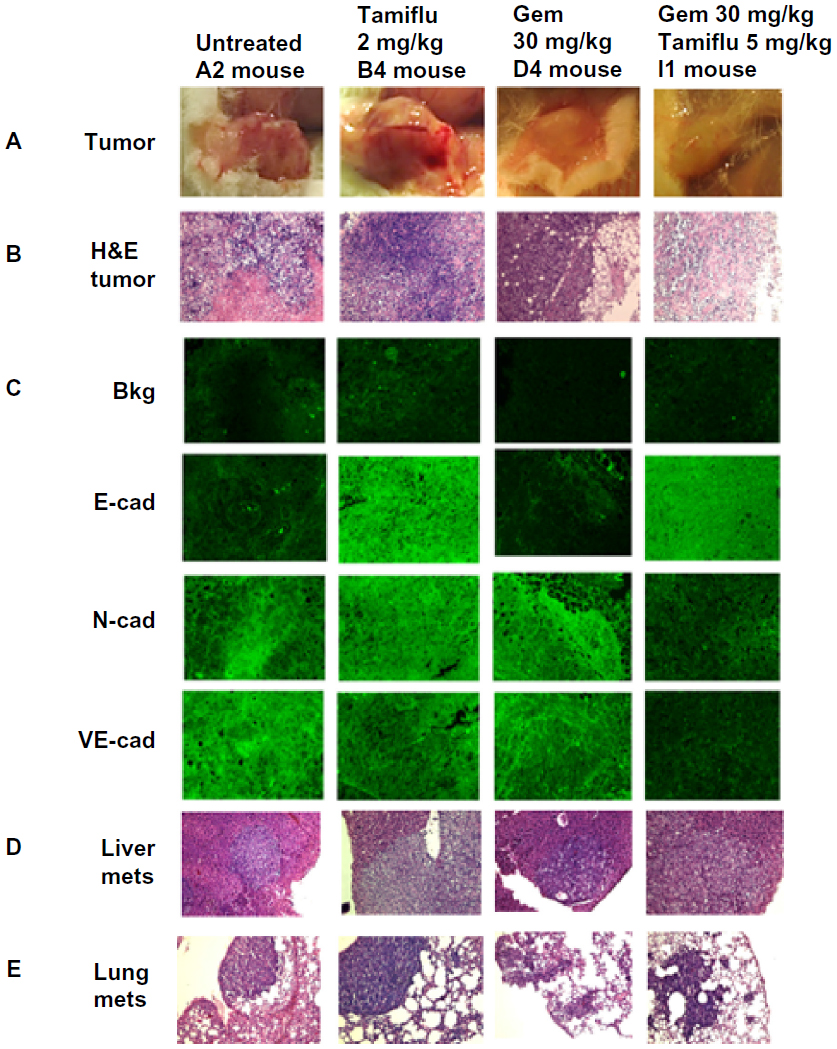 | Figure 7 Fluorescence immunohistochemical detection of E-cadherin, N-cadherin, and VE-cadherin expression in paraffin-embedded tumor tissues archived from xenograft tumors of PANC1 cells growing in RAGxCγ double mutant mice. Mice were implanted with 1 × 10⁶ PANC1 cells cutaneously on the rear flank and treatment began at 22–23 days post implantation when tumors reached 100–200 mm3 as described in Figure 6. (A) Live necropsy tumors. (B) H&E staining of tumor necropsy specimens. (C) Paraffin-embedded tumor sections (5 μm) on glass slides were processed for immunohistochemistry using primary anti-E-cadherin, N-cadherin, and VE-cadherin antibodies followed with polyclonal goat anti-rabbit Alexa Fluor® 488 (Life Technologies Inc, Burlington, ON, Canada) secondary antibody and Permount mounting media. Background control sections were prepared without the primary antibodies. Tissue sections were visualized and photographed using a Zeiss Imager M2 fluorescence microscope (Carl Zeiss AG, Oberkochen, Germany) at 400× magnification. Images are representative of at least five fields of view from two tumor sections. H&E staining of necropsy (D) liver and (E) lung for metastasis. |
Discussion
In this report, chronic treatment of PANC1 cells with 0.01 μM gemcitabine, 80 μM cisplatin, or a combination of these two agents resulted in characteristic morphologic changes, with increased spindle-shaped morphology and more cellular projections. In addition, there were clear molecular changes involving increased expression of N-cadherin and VE-cadherin and decreased expression of E-cadherin. These observations with the cadherin markers are consistent with other reports describing their role in EMT.37–39 We also identified that oseltamivir phosphate, a neuraminidase-1 inhibitor, has the ability to induce MET both in vitro and in vivo. Chemoresistant PANC1 cell lines (PANC1-GemR, PANC1-CisR, and PANC1-GemR/CisR) treated with oseltamivir phosphate showed the largest reduction in cell viability compared with PANC1 cells treated with chemotherapy alone. These results highlight the synergistic impact of oseltamivir phosphate and chemotherapeutic agents on the viability of chemoresistant PANC1 cells. They also suggest the potential for oseltamivir phosphate to increase the sensitivity of chemoresistant cancer cells to chemotherapeutic drugs that were originally ineffective.
The findings of this study also identify an alternative therapeutic approach using oseltamivir phosphate as an exciting new anticancer agent. We have recently reported that Neu1 sialidase acts via a receptor level signaling pathway on the cell surface to modulate a number of glycosylated receptors,31 such as EGFR,23 NGF TrkA,24 and TLRs,25–29 and these receptors are known to play a major role in cancer. Oseltamivir phosphate has been shown to specifically target and inhibit Neu1 activity associated with ligand-induced receptor activation.29 Central to this process is a Neu1-MMP-9 complex that is tethered to EGFR,23 TrkA,24 and TLR-425 on the cell surface and TLR-7 and TLR-931 in the endosomal compartments of naive cells. Indeed, other reports have provided supporting evidence for a role of Neu1 in the receptor glycosylation modification model in respiratory airway epithelium.40 Neu1 was found to associate with EGFR and cell surface-associated mucin-1 (MUC1) in epithelial cells in the respiratory airway, and this association was found to be regulated by stimulation of EGF.40 It was proposed that EGF receptors are substrates for Neu1 in vivo, and Neu1 expression is involved in repair of epithelium in the airways and wound healing, tumorigenesis, and metastatic potential. MUC1 (CD227) is a membrane-associated mucin glycoprotein, and is overexpressed in human pancreatic cancers. It is also associated with a poor prognosis, enhanced metastasis, and chemoresistance. Another report found that MUC1 induces drug resistance in human (BxPC3 and Capan-1) and mouse (KCKO, KCM) pancreatic cancer cells.41 These pancreatic cancer cells expressed high levels of MUC1 and showed increased resistance to chemotherapeutic drugs such as gemcitabine and etoposide in comparison with cells expressing low levels of MUC1. This chemoresistance was attributed to enhanced expression of multidrug resistance genes including ABCC1, ABCC3, ABCC5, and ABCB1.41 Of particular interest, levels of multidrug resistance-associated protein-1 (MRP1) encoded by the ABCC1 gene were significantly higher in MUC1-expressing cancer cells. MUC1 upregulated MRP1 in BxPC3 and Capan-1 cells via an Akt-dependent signaling pathway, whereas in KCM cells, MUC1-mediated MRP1 upregulation was mediated by an Akt-independent mechanism(s). The reason(s) for this disparity in these cancer cells is unclear, but in KCM, BxPC3, and Capan-1 cells, the cytoplasmic tail motif of MUC1 associated directly with the promoter region of the Abcc1/ABCC1 gene. This latter report provides evidence for a critical role of MUC1 in directly regulating the expression of multidrug resistant genes in pancreatic cancer cells, and thus conferring drug resistance.41 Neu1 sialidase activity has been shown to regulate MUC1,40 suggesting that multidrug resistance might be one of the mechanisms via which PANC1-GemR, PANC1-CisR, and PANC1-GemR/CisR cells become resistant. It is exciting to propose here that oseltamivir phosphate targeting Neu1 may also impact on this MUC1-mediated MRP1 upregulated pathway in addition to its impact on EGFR23 and other growth factor receptors.
When colon cancer HT29 cells overexpressing Neu1 were injected trans-splenically into mice, liver metastasis was significantly reduced.42 To explain these results, overexpression of Neu1 was proposed to desialylate the terminally sialylated N-linked oligosaccharides to which ganglioside GM3 binds at the ectodomain of EGFR, thereby promoting the GM3-EGFR interaction and attenuation of EGFR activation.40 The inhibitory modulation of EGF receptor activity by changes in the GM3 content in epidermoid cell lines has been well documented.43–49 Overexpression of Neu1 in colon cancer HT29 cells was proposed to desialylate the integrin β4 protein, which abrogated its role in metastasis.42 Others have shown that stable transfection of a gene encoding a soluble Mr 42,000 sialidase into a human epidermoid carcinoma cell line did not modify the binding of EGF to its receptor, but enhanced EGFR tyrosine autophosphorylation and diminished the level of ganglioside GM3.50
In this report, the data indicate that chemoresistance may induce EMT in pancreatic cancer cells. Signs of EMT such as increased spindle-shaped morphology were noted in cells that survived chronic exposure to chemotherapy. These results are consistent with the findings of other reported studies.2,6,35,51 For instance, Kajiyama et al reported chemoresistance to paclitaxel in epithelial ovarian carcinoma cells with pronounced EMT, as illustrated by spindle-shaped morphology and enhanced formation of pseudopodia.51 In the present study, treatment of PANC1-GemR cells with oseltamivir phosphate caused a partial reversal of EMT towards the MET morphology. Other studies have similarly noted a change from a mesenchymal-like to an epithelial-like phenotype in cancer cells that have been induced to reverse EMT.52 Although only a minimal change in cell morphology was observed in PANC1-GemR cells, longer incubation periods (ie, longer than 48 hours) may lead to more pronounced morphologic changes.
Treatment with oseltamivir phosphate also had an effect on expression levels of E-cadherin, N-cadherin, and VE-cadherin in the original PANC1 cells in vitro. PANC1 cells treated with oseltamivir phosphate at 600 μg/mL showed a small decrease in expression of N-cadherin and VE-cadherin, and an increase in E-cadherin expression. These findings suggest that oseltamivir phosphate is able to impact cancer cells that are not exposed to chronic levels of chemotherapy, causing these cells to become more epithelial-like and perhaps restricting tumor growth to a localized area. In addition, treatment with oseltamivir phosphate had an effect on E-cadherin, N-cadherin, and VE-cadherin expression in chemoresistant PANC1 cells. In particular, expression of N-cadherin and VE-cadherin decreased consistently and significantly across all chemoresistant cell lines after exposure to oseltamivir phosphate. Although epithelial cells do not typically express N-cadherin and VE-cadherin, cancer cells have been reported to show aberrant expression of these cell surface markers, especially cells that have undergone EMT.53 Labelle et al suggested that EMT leads to increased VE-cadherin expression in invasive human breast carcinoma, and that this increased VE-cadherin expression enhances the capacity of tumor cells to proliferate and form cord-like invasive structures.54 The results of the present study are not only consistent with these findings, but also extend, for the first time, the relevance of VE-cadherin expression in cancer progression to include pancreatic cancer. Other investigators have noted an interplay between N-cadherin and VE-cadherin expression,36 suggesting that downregulation of N-cadherin may induce subsequent downregulation of VE-cadherin from the cell surface. Consistent with this coexpression relationship between N-cadherin and VE-cadherin, the results of our study show that treatment with oseltamivir phosphate caused downregulation of both N-cadherin and VE-cadherin after 24 hours. This suggests that expression of N-cadherin and VE-cadherin is regulated by a common pathway, thereby providing confirmation additional to that of previous reports.53,54 Given that N-cadherin expression promotes motility and VE-cadherin results in tumor angiogenesis, downregulation of these cell markers by oseltamivir phosphate may lead to a less invasive cancer cell phenotype.
One unexpected result of our study was the relatively indistinguishable difference in E-cadherin expression in PANC1 chemoresistant lines after treatment with oseltamivir phosphate. It was expected that chemoresistant PANC1 cells would show a larger increase in expression of E-cadherin after treatment with oseltamivir phosphate, given the more noticeable impact of oseltamivir phosphate on N-cadherin and VE-cadherin expression in these cell lines. Others have noted situations where the “cadherin switching” associated with EMT does not significantly impact levels of E-cadherin expression, in contrast with the large changes observed in N-cadherin expression.55 Based on these observations, it is possible that the reversal of EMT towards a MET phenotype induced by oseltamivir phosphate does not have a large impact on E-cadherin levels. However, since only one dose of oseltamivir phosphate and one incubation period were used, further studies using higher doses of oseltamivir phosphate and longer incubation times might reveal differences in E-cadherin expression in PANC1 chemoresistant cells.
A recent report has indicated that EMT in cancer cells may be non-chemoresistant.18 However, the characteristic EMT changes were not observed in the original PANC1 cells in our study until these cells had been passaged multiple (7–10) times. In contrast, PANC1 cells chronically exposed to gemcitabine and cisplatin showed characteristic signs of EMT after 3–5 passages. These observations suggest that PANC1 cells surviving chemotherapy are induced to undergo EMT perhaps more quickly than PANC1 cells not in the presence of drug. This paradoxical finding that cancer chemotherapy may actually promote more efficient development of an invasive phenotype is particularly concerning, given the already poor prognosis of pancreatic cancer.18
Immunohistochemical analyses of tumors obtained from tumor-bearing mice support the results obtained by immunocytochemical analysis of the cancer cells in culture. Consistent with the increase in E-cadherin expression seen in the original PANC1 cells in vitro, mice receiving treatment with oseltamivir phosphate showed increased expression of E-cadherin in necropsy tumors. This finding is consistent with the ability of oseltamivir phosphate to cause a reversal of EMT towards a MET phenotype in PANC1 cells in culture, but this did not prevent metastatic spread to the liver or lung in tumor-bearing mice (Figure 7D and E). Tumors obtained from mice treated with gemcitabine showed little staining for E-cadherin. One explanation for this may be that these tumor cells had acquired resistance to gemcitabine and had undergone EMT. Therefore, it would be expected that expression of E-cadherin in these tumors would be minimal. Indeed, tumor-bearing mice receiving gemcitabine only showed a high rate of liver and lung metastasis, suggesting chemoresistance and EMT behavior in these cancer cells.
The results of the present study also show the ability of oseltamivir phosphate to increase the sensitivity of chemoresistant PANC1 cells to chemotherapy. It is likely that the presence of oseltamivir phosphate in the medium caused chemoresistant PANC1 cells to become more susceptible to chemotherapy. This would explain the larger reduction in cell viability observed in chemoresistant PANC1 cells treated with oseltamivir phosphate compared with PANC1 cells treated with chemotherapy alone. Given that oseltamivir phosphate is able to reverse EMT, it is possible that epithelial cell types are more sensitive to chemotherapy treatment. This concept is consistent with another report6 noting an increase in drug sensitivity in pancreatic cancer cells when epithelial markers such as E-cadherin are induced to be expressed in higher amounts.
The precise mechanism(s) involved in EMT, acquisition of chemoresistance, and the direction of the causation relationship between these two cancer processes has not been fully elucidated.56 EMT development may be the result of drug resistance in the cancer cell.57 Transcription factors such as Zeb1, Snail, Slug, and Twist, which are known to be upregulated when EMT is induced, may be the molecular players involved in the chemoresistance process.6,57 On the other hand, the results reported in this study, as well as findings reported by others,51 highlight the possibility that development of chemoresistance might also involve induction of EMT. Further studies should be directed towards elucidating the mechanistic link between EMT and chemoresistance.
While the results of this study cannot directly determine if chemoresistance causes EMT, or if EMT leads to chemoresistance, they do point to the potential involvement of growth factor receptor signaling in both of these processes. Treatment with oseltamivir phosphate resulted in reversal of the cadherin changes associated with EMT. In addition, it also caused increased sensitivity to gemcitabine and cisplatin in PANC1 cell lines with stable resistance to these drugs. Our findings suggest that oseltamivir phosphate targets a common pathway shared by EMT and chemoresistance in pancreatic cancer. Since oseltamivir phosphate is an inhibitor of Neu1, this common pathway likely involves a molecular signaling platform of Neu1-MMP9 crosstalk in regulating growth factor receptors,31 such as EGFR, Trk,24 insulin and TLRs.25,26,30 Given that other reports have noted the role of specific transcription factors, such as Snail and Slug, in inducing EMT, it is likely that growth factor receptor signaling leads to increased expression of these molecules.18 Indeed, a possible mechanism for EMT has been suggested to involve TGF-β1 in inducing the Snail transcription factor in epithelial cell lines,58 and the transcription factor Slug in repressing E-cadherin expression and inducing EMT.59 Medici et al have reported that both Snail and Slug can promote EMT through β-catenin-T-cell factor-4-dependent expression of TGF-β3.60 The cooperation or direct activation of proteolytic enzymes, such as MMP-2 and MMP-9 (gelatinase A and B, respectively), has been shown to be induced by the TGF-β and fibroblast growth factor 2 signaling cascades.61,62 Increased synthesis and activation of MMP-2 and MMP-9 in response to TGF-β leads to degradation of the collagen type IV component of the basement membrane. Inhibition of collagen type IV assembly is sufficient to induce EMT in murine renal epithelial cells in vitro.63 Expression of Snail and MMP-9 might be closely connected in invasive tumors, since they have both been implicated in similar invasive processes.64 Moreover, it has been shown that Snail induces MMP-9 secretion via multiple signaling pathways, and that Snail leads to transcriptional upregulation of MMP-9 in cooperation with oncogenic H-Ras (RasV12).65 Taken together, these different signaling paradigms involved with EMT in cancer suggest that modification of growth factor receptor glycosylation involving the receptor-signaling platform of Neu1-MMP-9 crosstalk23,31 may in fact be the invisible link connecting TGF-β signaling cascades, Hedgehog signaling activation through Notch, and the microRNA regulatory networks.15 It is noteworthy that when individual tumors were taken from oseltamivir phosphate-treated cohorts, they showed a significant decrease in phosphorylation of EGFR-Tyr1173, Stat1-Tyr701, and NFκBp65-Ser311 compared with the untreated cohort as determined by Western blot analysis.23 Bio-Plex® multiplex phosphoprotein analyses of the tumor lysates also showed a reduction in phosphorylation of Akt-Thr308, PDGFRα-Tyr754, and STAT1-Tyr701, but unexpectedly, an increase in phospho-Smad2-Ser465/467 and phospho-VEGFR2-Tyr1175 in the oseltamivir phosphate-treated cohort compared with the untreated cohort. Indeed, the Smad2 protein that is recruited to TGF-β receptors through its interaction with the SMAD anchor for receptor activation protein to mediate the TGF-β signal has been reported to function as a suppressor of prostate66 and breast67 epithelial cancer cells as well as a suppressor of EMT during formation and progression of skin cancer.68,69 The integration of Smad signaling into epithelial cell plasticity is eloquently reviewed by Sundqvist et al70 and Miyazono et al.71 Indeed, there is an intimate connection between Smad proteins and AP-1 components that determines TGF-β-induced invasion of breast cancer cells, and may involve Smad2/3-Fra1 complexes in the activation of the Smad/AP-1-dependent TGF-β-induced invasion program.72 We propose here that treatment with oseltamivir phosphate strategies take the form of a horizontal approach, in which several important cancer growth factor receptor signaling platforms, oncogenic pathways, and macrophage-mediated tumor progression mechanisms are targeted with promising therapeutic intent.
The results of this study are the first to show the ability of oseltamivir phosphate to reverse EMT and decrease the viability of chemoresistant PANC1 cells in vitro. Overall, given the ability of oseltamivir phosphate to increase E-cadherin expression and decrease N-cadherin and VE-cadherin expression, pancreatic cancer cells treated with this compound may become more adherent to the surrounding tissue and not metastasize. Further, the ability of oseltamivir phosphate to increase the sensitivity of chemoresistant cancer cells to drug therapy might allow for control of tumor size in patients. Oseltamivir phosphate represents a potentially promising alternative treatment for pancreatic cancer.
Acknowledgments
This work was supported in part by grants to Myron R Szewczuk and Ronald Neufeld from the Natural Sciences and Engineering Research Council of Canada and private sector cancer funding from the Josefowitz Family to Myron R Szewczuk. Samar Abdulkhalek is a recipient of the RS McLaughlin scholarship, the Ontario Graduate scholarship, and the Canadian Institutes of Health Research Doctoral award (Frederick Banting and Charles Best Canada Graduate scholarship). The cancer contents of this report are covered by a PCT international patent application number, PCT/CA2011/050690 (filing November 04, 2011).
Disclosure
The authors report no conflicts of interest in this work.
References
Maehara S, Tanaka S, Shimada M, et al. Selenoprotein P, as a predictor for evaluating gemcitabine resistance in human pancreatic cancer cells. Int J Cancer. 2004;112(2):184–189. | |
Shah AN, Summy JM, Zhang J, Park SI, Parikh NU, Gallick GE. Development and characterization of gemcitabine-resistant pancreatic tumor cells. Ann Surg Oncol. 2007;14(12):3629–3637. | |
Kabashima A, Higuchi H, Takaishi H, et al. Side population of pancreatic cancer cells predominates in TGF-beta-mediated epithelial to mesenchymal transition and invasion. Int J Cancer. 2009;124(12):2771–2779. | |
Konecny GE, Venkatesan N, Yang G, et al. Activity of lapatinib a novel HER2 and EGFR dual kinase inhibitor in human endometrial cancer cells. Br J Cancer. 2008;98(6):1076–1084. | |
Creighton CJ, Gibbons DL, Kurie JM. The role of epithelial-mesenchymal transition programming in invasion and metastasis: a clinical perspective. Cancer Manag Res. 2013;5:187–195. | |
Arumugam T, Ramachandran V, Fournier KF, et al. Epithelial to mesenchymal transition contributes to drug resistance in pancreatic cancer. Cancer Res. 2009;69(14):5820–5828. | |
Yang AD, Fan F, Camp ER, et al. Chronic oxaliplatin resistance induces epithelial-to-mesenchymal transition in colorectal cancer cell lines. Clin Cancer Res. 2006;12(14 Pt 1):4147–4153. | |
Rho JK, Choi YJ, Lee JK, et al. Epithelial to mesenchymal transition derived from repeated exposure to gefitinib determines the sensitivity to EGFR inhibitors in A549, a non-small cell lung cancer cell line. Lung Cancer. 2009;63(2):219–226. | |
Zavadil J, Bottinger EP. TGF-beta and epithelial-to-mesenchymal transitions. Oncogene. 2005;24(37):5764–5774. | |
Allington TM, Schiemann WP. The Cain and Abl of epithelial-mesenchymal transition and transforming growth factor-beta in mammary epithelial cells. Cells Tissues Organs. 2011;193(1–2):98–113. | |
Tian M, Neil JR, Schiemann WP. Transforming growth factor-beta and the hallmarks of cancer. Cell Signal. 2011;23(6):951–962. | |
Wendt MK, Smith JA, Schiemann WP. Transforming growth factor-beta-induced epithelial-mesenchymal transition facilitates epidermal growth factor-dependent breast cancer progression. Oncogene. 2010;29(49):6485–6498. | |
Taylor MA, Parvani JG, Schiemann WP. The pathophysiology of epithelial-mesenchymal transition induced by transforming growth factor-beta in normal and malignant mammary epithelial cells. J Mammary Gland Biol Neoplasia. 2010;15(2):169–190. | |
Nagaraj NS, Datta PK. Targeting the transforming growth factor-beta signaling pathway in human cancer. Expert Opin Investig Drugs. 2010;19(1):77–91. | |
Katoh Y, Katoh M. Hedgehog signaling, epithelial-to-mesenchymal transition and miRNA. Int J Mol Med. 2008;22(3):271–275. | |
Olive KP, Jacobetz MA, Davidson CJ, et al. Inhibition of Hedgehog signaling enhances delivery of chemotherapy in a mouse model of pancreatic cancer. Science. 2009;324(5933):1457–1461. | |
Oliveira-Cunha M, Newman WG, Siriwardena AK. Epidermal growth factor receptor in pancreatic cancer. Cancers. 2011;3(2):1513–1526. | |
Chang ZG, Wei JM, Qin CF, et al. Suppression of the epidermal growth factor receptor inhibits epithelial-mesenchymal transition in human pancreatic cancer PANC1 cells. Dig Dis Sci. 2012;57(5):1181–1189. | |
Danilov AV, Neupane D, Nagaraja AS, et al. DeltaNp63alpha-mediated induction of epidermal growth factor receptor promotes pancreatic cancer cell growth and chemoresistance. PLoS One. 2011;6(10):e26815. | |
Sette G, Salvati V, Memeo L, et al. EGFR inhibition abrogates leiomyosarcoma cell chemoresistance through inactivation of survival pathways and impairment of CSC potential. PLoS One. 2012;7(10):e46891. | |
Holz C, Niehr F, Boyko M, et al. Epithelial-mesenchymal-transition induced by EGFR activation interferes with cell migration and response to irradiation and cetuximab in head and neck cancer cells. Radiother Oncol. 2011;101(1):158–164. | |
Faller BA, Burtness B. Treatment of pancreatic cancer with epidermal growth factor receptor-targeted therapy. Biologics. 2009;3:419–428. | |
Gilmour AM, Abdulkhalek S, Cheng TSW, et al. A novel epidermal growth factor receptor-signaling platform and its targeted translation in pancreatic cancer. Cell Signal. 2013;25(12):2587–2603. | |
Jayanth P, Amith SR, Gee K, Szewczuk MR. Neu1 sialidase and matrix metalloproteinase-9 cross-talk is essential for neurotrophin activation of Trk receptors and cellular signaling. Cell Signal. 2010;22(8):1193–1205. | |
Abdulkhalek S, Amith SR, Franchuk SL, et al. Neu1 sialidase and matrix metalloproteinase-9 cross-talk is essential for Toll-like receptor activation and cellular signaling. J Biol Chem. 2011;286(42):36532–36549. | |
Abdulkhalek S, Guo M, Amith SR, Jayanth P, Szewczuk MR. G-protein coupled receptor agonists mediate Neu1 sialidase and matrix metalloproteinase-9 cross-talk to induce transactivation of TOLL-like receptors and cellular signaling. Cell Signal. 2012;24(11):2035–2042. | |
Amith SR, Jayanth P, Finlay T, et al. Detection of Neu1 sialidase activity in regulating Toll-like receptor activation. J Vis Exp. 2010(43). | |
Amith SR, Jayanth P, Franchuk S, et al. Neu1 desialylation of sialyl alpha-2,3-linked beta-galactosyl residues of Toll-like receptor 4 is essential for receptor activation and cellular signaling. Cell Signal. 2010;22(2):314–324. | |
Amith SR, Jayanth P, Franchuk S, et al. Dependence of pathogen molecule-induced toll-like receptor activation and cell function on Neu1 sialidase. Glycoconjug J. 2009;26(9):1197–1212. | |
Abdulkhalek S, Szewczuk MR. Neu1 sialidase and matrix metalloproteinase-9 cross-talk regulates nucleic acid-induced endosomal TOLL-like receptor-7 and -9 activation, cellular signaling and pro-inflammatory responses. Cell Signal. 2013;25(11):2093–2105. | |
Abdulkhalek S, Hrynyk M, Szewczuk MR. A novel G-protein-coupled receptor-signaling platform and its targeted translation in human disease. Research and Reports in Biochemistry. 2013;3:17–30. | |
Hata K, Koseki K, Yamaguchi K, et al. Limited inhibitory effects of oseltamivir and zanamivir on human sialidases. Antimicrob Agents Chemother. 2008;52(10):3484–3491. | |
Nan X, Carubelli I, Stamatos NM. Sialidase expression in activated human T lymphocytes influences production of IFN-gamma. J Leukoc Biol. 2007;81(1):284–296. | |
Tan AS, Berridge MV. Superoxide produced by activated neutrophils efficiently reduces the tetrazolium salt, WST-1 to produce a soluble formazan: a simple colorimetric assay for measuring respiratory burst activation and for screening anti-inflammatory agents. J Immunol Methods. 2000;238(1–2):59–68. | |
Du Z, Qin R, Wei C, et al. Pancreatic cancer cells resistant to chemoradiotherapy rich in “stem-cell-like” tumor cells. Dig Dis Sci. 2011;56(3):741–750. | |
Vestweber D. VE-cadherin: the major endothelial adhesion molecule controlling cellular junctions and blood vessel formation. Arterioscler Thromb Vasc Biol. 2008;28(2):223–232. | |
Voulgari A, Pintzas A. Epithelial-mesenchymal transition in cancer metastasis: mechanisms, markers and strategies to overcome drug resistance in the clinic. Biochim Biophys Acta. 2009;1796(2):75–90. | |
Thiery JP, Acloque H, Huang RY, Nieto MA. Epithelial-mesenchymal transitions in development and disease. Cell. 2009;139(5):871–890. | |
Hendrix MJ, Seftor EA, Meltzer PS, et al. Expression and functional significance of VE-cadherin in aggressive human melanoma cells: role in vasculogenic mimicry. Proc Natl Acad Sci U S A. 2001;98(14):8018–8023. | |
Lillehoj EP, Hyun SW, Feng C, et al. Neu1 sialidase expressed in human airway epithelia regulates epidermal growth factor receptor (EGFR) and MUC1 protein signaling. J Biol Chem. 2012;287(11):8214–8231. | |
Nath S, Daneshvar K, Roy LD, et al. MUC1 induces drug resistance in pancreatic cancer cells via upregulation of multidrug resistance genes. Oncogenesis. 2013;2:e51. | |
Uemura T, Shiozaki K, Yamaguchi K, et al. Contribution of sialidase NEU1 to suppression of metastasis of human colon cancer cells through desialylation of integrin beta4. Oncogene. 2009;28(9):1218–1229. | |
Meuillet EJ, Mania-Farnell B, George D, Inokuchi JI, Bremer EG. Modulation of EGF receptor activity by changes in the GM3 content in a human epidermoid carcinoma cell line, A431. Exp Cell Res. 2000;256(1):74–82. | |
Zurita AR, Maccioni HJ, Daniotti JL. Modulation of epidermal growth factor receptor phosphorylation by endogenously expressed gangliosides. Biochem J. 2001;355(Pt 2):465–472. | |
Miljan EA, Meuillet EJ, Mania-Farnell B, et al. Interaction of the extracellular domain of the epidermal growth factor receptor with gangliosides. J Biol Chem. 2002;277(12):10108–10113. | |
Mirkin BL, Clark SH, Zhang C. Inhibition of human neuroblastoma cell proliferation and EGF receptor phosphorylation by gangliosides GM1, GM3, GD1A and GT1B. Cell Prolif. 2002;35(2):105–115. | |
Wang XQ, Sun P, Paller AS. Ganglioside GM3 blocks the activation of epidermal growth factor receptor induced by integrin at specific tyrosine sites. J Biol Chem. 2003;278(49):48770–48778. | |
Guan F, Handa K, Hakomori SI. Regulation of epidermal growth factor receptor through interaction of ganglioside GM3 with GlcNAc of N-linked glycan of the receptor: demonstration in ldlD cells. Neurochem Res. 2011;36(9):1645–1653. | |
Huang X, Li Y, Zhang J, Xu Y, Tian Y, Ma K. Ganglioside GM3 inhibits murine ascites hepatoma cell motility and migration in vitro through inhibition of phosphorylation of EGFR at specific tyrosine sites and PI3K/AKT signaling pathway. J Cell Biochem. 2013;114(7):1616–1624. | |
Meuillet EJ, Kroes R, Yamamoto H, et al. Sialidase gene transfection enhances epidermal growth factor receptor activity in an epidermoid carcinoma cell line, A431. Cancer Res. 1999;59(1):234–240. | |
Kajiyama H, Shibata K, Terauchi M, et al. Chemoresistance to paclitaxel induces epithelial-mesenchymal transition and enhances metastatic potential for epithelial ovarian carcinoma cells. Int J Oncol. 2007;31(2):277–283. | |
Jo M, Lester RD, Montel V, Eastman B, Takimoto S, Gonias SL. Reversibility of epithelial-mesenchymal transition (EMT) induced in breast cancer cells by activation of urokinase receptor-dependent cell signaling. J Biol Chem. 2009;284(34):22825–22833. | |
Rezaei M, Friedrich K, Wielockx B, et al. Interplay between neural-cadherin and vascular endothelial-cadherin in breast cancer progression. Breast Cancer Res. 2012;14(6):R154. | |
Labelle M, Schnittler HJ, Aust DE, et al. Vascular endothelial cadherin promotes breast cancer progression via transforming growth factor beta signaling. Cancer Res. 2008;68(5):1388–1397. | |
Yamauchi M, Yoshino I, Yamaguchi R, et al. N-cadherin expression is a potential survival mechanism of gefitinib-resistant lung cancer cells. Am J Cancer Res. 2011;1(7):823–833. | |
Chang TH, Tsai MF, Su KY, et al. Slug confers resistance to the epidermal growth factor receptor tyrosine kinase inhibitor. Am J Respir Crit Care Med. 2011;183(8):1071–1079. | |
Sanchez-Tillo E, Liu Y, de Barrios O, et al. EMT-activating transcription factors in cancer: beyond EMT and tumor invasiveness. Cell Mol Life Sci. 2012;69(20):3429–3456. | |
Peinado H, Quintanilla M, Cano A. Transforming growth factor beta-1 induces snail transcription factor in epithelial cell lines: mechanisms for epithelial mesenchymal transitions. J Biol Chem. 2003;278(23):21113–21123. | |
Bolos V, Peinado H, Perez-Moreno MA, Fraga MF, Esteller M, Cano A. The transcription factor Slug represses E-cadherin expression and induces epithelial to mesenchymal transitions: a comparison with Snail and E47 repressors. J Cell Sci. 2003;116(Pt 3):499–511. | |
Medici D, Hay ED, Olsen BR. Snail and Slug promote epithelial-mesenchymal transition through beta-catenin-T-cell factor-4-dependent expression of transforming growth factor-beta3. Mol Biol Cell. 2008;19(11):4875–4887. | |
Strutz F, Zeisberg M, Ziyadeh FN, et al. Role of basic fibroblast growth factor-2 in epithelial-mesenchymal transformation. Kidney Int. 2002;61(5):1714–1728. | |
Li JH, Huang XR, Zhu HJ, Johnson R, Lan HY. Role of TGF-beta signaling in extracellular matrix production under high glucose conditions. Kidney Int. 2003;63(6):2010–2019. | |
Zeisberg M, Bonner G, Maeshima Y, et al. Renal fibrosis: collagen composition and assembly regulates epithelial-mesenchymal transdifferentiation. Am J Pathol. 2001;159(4):1313–1321. | |
Blanco MJ, Moreno-Bueno G, Sarrio D, et al. Correlation of Snail expression with histological grade and lymph node status in breast carcinomas. Oncogene. 2002;21(20):3241–3246. | |
Jorda M, Olmeda D, Vinyals A, et al. Upregulation of MMP-9 in MDCK epithelial cell line in response to expression of the Snail transcription factor. J Cell Sci. 2005;118(Pt 15):3371–3385. | |
Yang J, Wahdan-Alaswad R, Danielpour D. Critical role of Smad2 in tumor suppression and transforming growth factor-beta-induced apoptosis of prostate epithelial cells. Cancer Res. 2009;69(6):2185–2190. | |
Tian F, DaCosta Byfield S, Parks WT, et al. Reduction in Smad2/3 signaling enhances tumorigenesis but suppresses metastasis of breast cancer cell lines. Cancer Res. 2003;63(23):8284–8292. | |
Hoot KE, Lighthall J, Han G, et al. Keratinocyte-specific Smad2 ablation results in increased epithelial-mesenchymal transition during skin cancer formation and progression. J Clin Invest. 2008;118(8):2722–2732. | |
Hoot KE, Oka M, Han G, Bottinger E, Zhang Q, Wang XJ. HGF upregulation contributes to angiogenesis in mice with keratinocyte-specific Smad2 deletion. J Clin Invest. 2010;120(10):3606–3616. | |
Sundqvist A, Ten Dijke P, van Dam H. Key signaling nodes in mammary gland development and cancer: Smad signal integration in epithelial cell plasticity. Breast Cancer Res. 2012;14(1):204. | |
Miyazono K, Suzuki H, Imamura T. Regulation of TGF-beta signaling and its roles in progression of tumors. Cancer Sci. 2003;94(3):230–234. | |
Sundqvist A, Zieba A, Vasilaki E, et al. Specific interactions between Smad proteins and AP-1 components determine TGFbeta-induced breast cancer cell invasion. Oncogene. 2013;32(31):3606–3615. |
 © 2014 The Author(s). This work is published and licensed by Dove Medical Press Limited. The full terms of this license are available at https://www.dovepress.com/terms.php and incorporate the Creative Commons Attribution - Non Commercial (unported, v3.0) License.
By accessing the work you hereby accept the Terms. Non-commercial uses of the work are permitted without any further permission from Dove Medical Press Limited, provided the work is properly attributed. For permission for commercial use of this work, please see paragraphs 4.2 and 5 of our Terms.
© 2014 The Author(s). This work is published and licensed by Dove Medical Press Limited. The full terms of this license are available at https://www.dovepress.com/terms.php and incorporate the Creative Commons Attribution - Non Commercial (unported, v3.0) License.
By accessing the work you hereby accept the Terms. Non-commercial uses of the work are permitted without any further permission from Dove Medical Press Limited, provided the work is properly attributed. For permission for commercial use of this work, please see paragraphs 4.2 and 5 of our Terms.