")
Back to Journals » Neuropsychiatric Disease and Treatment » Volume 13
The Walsh Family Resilience Questionnaire: the Italian version
Authors Rocchi S, Ghidelli C, Burro R , Vitacca M , Scalvini S, Della Vedova AM , Roselli G , Ramponi JP, Bertolotti G
Received 26 July 2017
Accepted for publication 24 September 2017
Published 14 December 2017 Volume 2017:13 Pages 2987—2999
DOI https://doi.org/10.2147/NDT.S147315
Checked for plagiarism Yes
Review by Single anonymous peer review
Peer reviewer comments 2
Editor who approved publication: Dr Roger Pinder
Silvana Rocchi,1 Claudio Ghidelli,2 Roberto Burro,3 Michele Vitacca,4 Simonetta Scalvini,5 Anna Maria Della Vedova,6 Gianmarco Roselli,7 Jean-Pierre Ramponi,8 Giorgio Bertolotti9
1Psychology Service, ICS Maugeri Spa SB, Institute of Lumezzane, 2Psychological Counselling Service, Università Cattolica del Sacro Cuore, Brescia, 3Department of Human Sciences, University of Verona, Verona, 4Respiratory Rehabilitation Division, 5Cardiac Rehabilitation Division, ICS Maugeri Spa SB, Institute of Lumezzane, 6Department of Clinical and Experimental Sciences, University of Brescia, 7Department of Mental Health, Spedali Civili, 8ICS Maugeri Spa SB, Institute of Lumezzane, Brescia, 9Psychology Unit, ICS Maugeri Spa SB, Institute of Tradate, Varese, Italy
Background: Resilience focuses on strength under stress, in the context of adversity. Walsh’s theoretical model identifies relational processes that allow families to tackle and overcome critical situations, dividing them into three domains of family function. The aim of this study was to assess resilience in families of patients with a chronic disease by adapting and validating the Italian version of the Walsh Family Resilience Questionnaire (Walsh-IT).
Patients and methods: An Italian adult sample of 421 participants (patients and relatives) was collected with the aim to assess the reliability and validity of the Walsh-IT. Concurrent validity was carried out by comparing this instrument with the Family Adaptability and Cohesion Evaluation Scale III (FACES III) administered at the same time as the Walsh-IT.
Results: Reliability showed high correlation between repeated measurements. The alpha coefficient was 0.946. Both parallel analysis and minimum average partial criteria suggested that the best number of domains is equal to 3, explaining 50.4% of the total variance. Based on the results obtained from the Rasch analysis, items 10, 11, 16, 22, and 23 have been removed resulting in a short-form questionnaire (Walsh-IT-R) of 26 items with three domains: shared beliefs and support (SBS, α=0.928); family organization and interaction (FOI, α=0.863); and utilization of social resources (USR, α=0.567). The total score of the Walsh-IT-R was strongly correlated with the total score of FACES III Real Family Scale (r=0.68; p<0.0001).
Conclusion: Results support that the Walsh-IT-R is a valid instrument for the assessment of family resilience in Italy when contending with the challenges of chronic disease. It could be used in pre- and post-assessment in practice effectiveness research, offering a profile of family resilience processes at the start and end of interventions and follow-up.
Keywords: family resilience, chronic illness, assessment, Rasch model, family functioning
Introduction
Family resilience is the ability of families to weather and rebound from crisis and persistent life challenges as strengthened and more resourceful, summoning the complete mental health field to relocate resilience from an individual concept to a family and community one.1,2 Resilience is the fundamental concept to understand why some families are devastated by traumatic events, such as illnesses, disability, or loss, while others adapt or even grow stronger. This approach affirms the evolutionary and self-healing potential of families to overcome crisis and difficulties in their lives.
The theoretical–clinical model of family resilience by Walsh1,3 is characterized by a focus shift, from dysfunction and limitations of families and individuals to their resourceful capacities, from pathology to functionality, and from a problematic situation to possibility.
Family resilience involves the complex interaction of several processes over the course of time; from the way, a family – as a functional unity – reacts to a critical situation to its capacity to deal with transient conditions of disorganization to newly developed strategies when difficult times emerge, in the short and long term.
From a systemic perspective, the fundamental presupposition is that even though the disease affects a single subject it is a critical family event that raises profound reactions of the whole nucleus and in turn affects the course of events, over time. Consequently the role of relatives, with their systems of beliefs, values, and behaviors, are essential to favor, or on the contrary, to make more difficult, a patient’s compliance to the program of cure, the achievement of rehabilitation outcomes, social and occupational reintegration.
The concept of family resilience is an integrative part of the family systems – illness model by Rolland4,5 – which provides a reference framework for resilience-oriented assessment and intervention with families dealing with chronic diseases and disability. In the chronic phase, recurrent or persistent stressors pose different psychosocial challenges over time.
Some situations require a long-term adaptation to a “new normal,” others require families to repeatedly shift onto a “roller-coaster” course, while still others require adaptation to a progressive decline, as in the varied trajectories of chronic illness. Each period has certain basic tasks, independent of the type of illness. Moreover, each type of illness has specific supplementary tasks.
The improvement in medical treatments and increase in life expectancy have led to a higher incidence of chronic illnesses and to a greater number of families dealing their whole life with a member having this kind of medically compromised condition. Consequently, the evaluation of the illness experience in systemic–relational terms is highly relevant today.
The Walsh Family Resilience Framework identified nine key processes involved in resilience and organized in three domains, or dimensions, of family functioning: family belief system, family organization, and communication/problem-solving processes. These fundamental processes express themselves with different modalities and measures among families, with varied values, resources, and adverse challenges.
Although there exists a huge amount of study on family resilience, very few are quantitative studies of this theory. The analysis on Family Resilience Assessment Scale (FRAS)6 did not confirm the Walsh theoretical model comprising nine key processes and three domains, highlighting a six-factor conceptualization to be more appropriate. The adapted and validated FRAS led to different results, with a construction of a new factor and development of a shorter version.7,8
The corresponding questionnaire, the Walsh Family Resilience Questionnaire,1–4 can be used in pre- and post-assessment in practice effectiveness study, for rating within families changed over time, in the course of dealing with an adverse situation, such as adaptation processes after a crisis event or shift when encountering emerging challenges or chronic multi-stress conditions. Currently, there are no studies on psychometric properties of the instrument. The questionnaire will be of great utility for clinicians since it can guide therapeutic interventions focusing on resources. It shows also – in a simple and fast way – how family needs can be addressed to target treatment by monitoring the patterns and evaluating the outcomes.
The aim of this study was to assess resilience in families of patients with a chronic disease by adapting and validating – starting from the Walsh Family Resilience Questionnaire1 based on the Walsh Family Resilience Framework – the Italian version of the Walsh Family Resilience Questionnaire (Walsh-IT).
Patients and methods
The Walsh framework2 constituted the basis for adaptation in the Italian language, through construction and validation, of the Walsh-IT. A total of 31 items were defined by a 5-point Likert scale (1 very little; 5 very much) followed by an open question. The latter asks the patients and relatives to specify any other aspects that helped them to overcome a crisis.
The nine key processes of family resilience are grouped into three dimensions of family functioning: family belief systems, family organization, and communication/problem-solving processes. The first dimension – family belief systems – involves 1) shared meaning-making efforts, 2) positive outlook, and 3) transcendence and spirituality, which facilitate shared efforts to understand adverse situations, their impact, and efforts to overcome challenges. Family resilience is promoted by shared beliefs that increase general functioning, collaborative strategies, and movement toward effective recovery and growth. The second dimension – family organization – involves transactional processes that strengthen 4) flexibility, 5) connectedness/cohesion, and 6) economic and social resources. All contribute to reorganization necessary for adaptive responses to meet stressful challenges. The third dimension – communication/problem-solving processes– involves 7) clarity, 8) emotional expression, and 9) collaborative problem solving. These processes facilitate resilience by clarifying information about adverse conditions, by sharing both painful and positive feelings and by facilitating problem solving and proactive planning.
Italian adaptation
This process followed the guidelines for the process of cross-cultural adaptation of self-report measures9 and involved the following steps:
- Phase I: two translations were carried out independently by two expert clinical psychologists.
- Phase II: two translations were then compared to each other, and a final combined version was made.
- Phase III: back translation. The combined Italian version, which was given to a mother-tongue English translator, without reference to the original text, was translated back into English.
- Phase IV: a group of psychologists looked at the work, with particular attention paid to semantic equivalence, comprehension of terms of meaning, concepts, and psychological meaning in the questionnaire.
- Phase V: four focus groups were organized, each composed of 21 patients with chronic disease and 31 relatives who answered the questionnaire item by item, with the instruction to indicate items which were not clear or the reading of which could lead to possible misunderstandings. Then, some minor changes were made which allowed the expression of some other concepts with more commonly used terminology (eg, item 9, initially translated as “large” was then translated as “important”). After the changes were made, a new back translation was prepared, following the suggestions of the patients and family members from each focus group.
- Phase VI: the final version, ie, the Italian translation. The English back translation and any comments from the focus groups were sent to the author (Froma Walsh), for her approval (received).
Sample
The validation study was proposed to patients with chronic illnesses and their relatives, attending various health care institutions in the area of Brescia, a medium size city in northern Italy. Inclusion criteria for patients were as follows: age ≥18 years, diagnosed with chronic disease, confirmed at least 6 months ago, and knows Italian language. Our inclusion criteria for family members were as follows: age ≥18 years and knows Italian language.
The sample was composed of 421 participants: 129 consecutive patients and 292 relatives. All patients had chronic illnesses: multiple sclerosis (n=32, plus 58 relatives), chronic obstructive pulmonary disease (n=28, plus 76 relatives), chronic heart failure (n=26, plus 69 relatives), psychotic disease (n=18, plus 32 relatives), mood disorders (n=13, plus 22 relatives), stroke exitus (n=8 patients, plus 25 relatives), and Parkinson’s disease (n=4, plus 10 relatives); 59% were hospitalized and 41% were outpatients. Sociodemographic data of patients and relatives are summarized in Table 1.
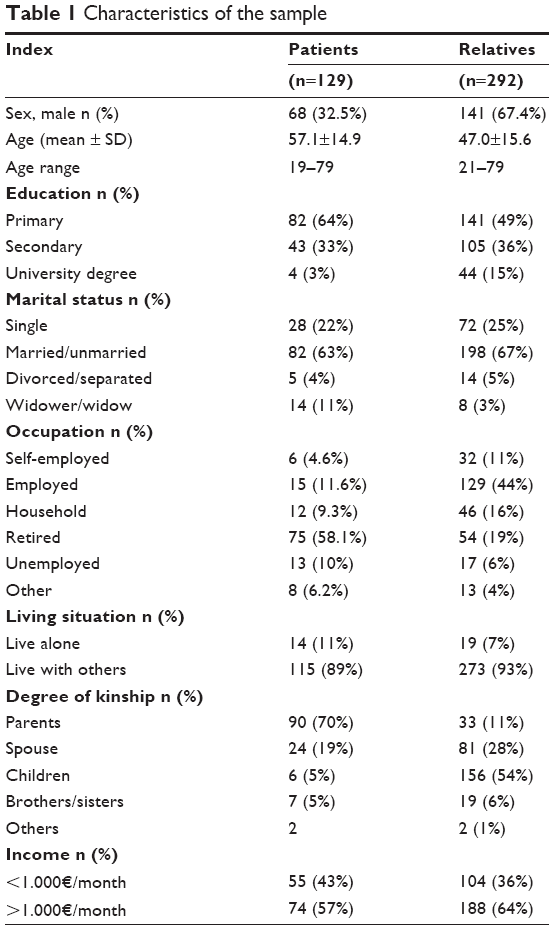 | Table 1 Characteristics of the sample |
Procedures and measures
The validation study was approved by the central ethics committee of Salvatore Maugeri Foundation (872CEC). Both patients and relatives were informed about the aim of the validation study by a psychologist and invited to participate. After signing the informed consent, each family (patient and family members) received an appointment for the administration of the questionnaire (Walsh-IT) within 30 days. Questionnaires were completed in one appointment for patients and relatives in almost all cases, and always in the presence of a psychologist. To evaluate the test/retest reliability of the instrument, a subset of 40 willing subjects (40 patients and 135 relatives) filled in the Walsh-IT for a second time, after 1–2 weeks.
Each participant (either patient or relative) responded individually to the following questionnaires: the Walsh-IT; the Family Adaptability and Cohesion Evaluation Scale III (FACES III).10,11 The FACES III gives a measure of the “real family” and “ideal family” cohesion and adaptability, as they are sensed by the subject. On two 5-point Likert scales, the first 20 items assess the “real family” perception and the last 20 assess the “ideal family” perception. The FACES III was utilized for the concurrent validity.
Statistical analysis
The psychometric properties of the Walsh-IT were investigated by the evaluation of construct validity, internal consistency, and reliability. An external validation was carried out by confronting this instrument with the FACES III administered at the same time as the Walsh-IT.
Second, a confirmatory factor analysis (CFA; which is a procedure commonly used to investigate a previous exploratory analysis),12,13 was applied to evaluate the fit of the formerly defined domains. This procedure was created based on the idea that the initial 31 items represented latent variables, and the quantity of variation in participant achievement due to the domains was obtained from the principal component analysis (PCA).
The factor structure was studied by means of structural equation modeling (SEM) to verify the hypothesized causal relationships. SEM is a statistical technique, which can quantify a domain of study using a measurement instrument. In this study, we have measured any variables (Y) with just one latent variable (ξ), namely a variable, which is not quantified in a direct way, but it is extracted internally from the model starting from measured variables. To that end, for every domain, only the measurement model described in the following paragraphs was considered, where it is a matrix of the coefficients of the quantified variables (Y) and is the error matrix.
This method14 gives the possibility of reduced complexity and the identification of interrelationships between variables to understand them. As different measures of fit, a choice of various fit indexes was reported. Chi-square is a relevant statistic used to calculate many fit measures; indeed (considering the sample size), chi-square is the expression of the difference between the hypothesized covariance matrix and the real covariance matrix. These residuals are imagined to have a chi-square distribution, so it is possible to verify whether the differences are due to an ordinary stochastic variability or inappropriate model.
In any case, it must be considered that when the size of the sample grows the degrees of freedom (df) remain stable; consequently, the chi-square statistic will be increased; in many cases, this situation gives rise to a rejection model, which might be acceptable, instead.
Schermelleh-Engel et al15 suggested to confer less importance to the chi-square index. For this reason, chi-square should be used just like a descriptive quantification of the goodness of fit. Jöreskog and Sörbom16 compared this quantification to df, and the results are excellent if they are in the range of 0–2 df; are admissible results when the range is 2–3 df. Having said this, the best way is using absolute fit indexes that are only related to how well the supposed model fits the sample data (eg, root mean square error of approximation and standardized root mean residual) or incremental fit statistics that compare a reference model to evaluate the quantity of model fit improvement (eg, non-normed fit index, comparative fit index, and adjusted goodness-of-fit index). The value of standardized root mean residual is excellent when below 0.05 and is admissible for values below 0.10; root mean square error of approximation is excellent for values below 0.05 and is admissible when below 0.08. Non-normed fit index, comparative fit index, and adjusted goodness-of-fit index can range from 0 to 1: excellent values are greater than 0.97 and admissible values are greater than 0.95.17 Table 2 summarizes all fit indexes considered in this study.
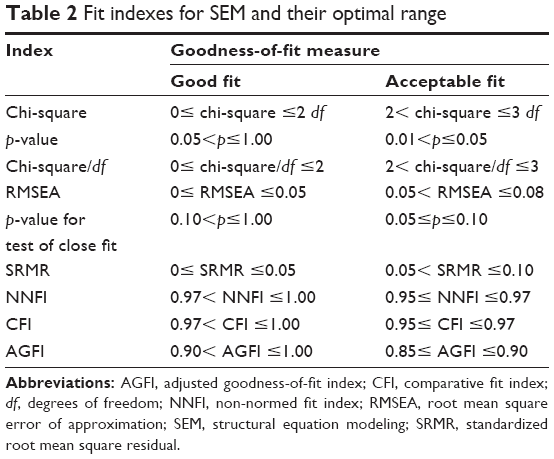 | Table 2 Fit indexes for SEM and their optimal range |
Third, on the items of each of the obtained domains, a polytomous Rasch analysis was conducted using partial credit model.18 Rasch analysis gives the chance to verify how the real data fit the hypothesized data of a model that meets the rules of fundamental measurement properties.19,20 Precisely, the fit of each item with its domain was examined by computing the item fit statistics (for each domain). Items that do not fit chi-square criteria (p-value of chi-square statistic <0.05) and items that are located outside of the Infit-mean-square (MSQ) statistic range between 0.75 and 1.3321 show erratic performance, and the domain/questionnaire will perform better if such items are removed.22,23 Infit-MSQ values of about 1 are ideal by Rasch analysis and indicate local independence.
We used a series of the three data analysis techniques to accumulate, step-by-step, the benefits of each of them. We started from a PCA because it is a way of identifying patterns in data and expressing the data in such a way as to highlight their similarities and differences.
One of the main advantages of PCA is that we can find these patterns in the data without much loss of information. So, PCA is a dimensionality reduction approach. Any dimensionality reduction approach, as the name suggests, is used to reduce the dimensionality of the data. We wanted to reduce the dimensionality, because of two primary reasons: original dimensionality could be too large and many of the dimensions could be highly correlated, hence redundant. However, in PCA, the set of data is simply explored and provides information about the numbers of factors required to represent the data. In PCA, all measured variables are related to every latent variable. For these reasons, in a second phase, we applied CFA using SEM, because in CFA it is possible to specify the number of domains required in the data and which measured variable is related to a precise latent variable. CFA using SEM is a way to confirm or reject the measurement theory.
It is well known that for high-quality measurements, it is necessary to comply with the “fundamental measurement rules:” neither PCA nor CFA does this.24
For this reason, in a third phase, Rash analysis was conducted taking into account the categorical/ordinal nature of the data.
Finally, the internal consistency was evaluated by the estimation of Cronbach’s alpha coefficient. The reliability of the instrument was estimated by the measure of its stability to the test/retest. To this aim, intra-class correlation coefficients (ICCs) of singular items to scores of factors that emerged from the factorial analysis were calculated. Such evaluation was carried out on the subgroup of participants who were administered the questionnaire a second time, after 1 or 2 weeks.
External validation was carried out by calculating the coefficient of Pearson’s correlation among scores of the Walsh-IT and the FACES III and relating factors. All statistical analyses were carried out using the R-software25 (psych package for PCA;26 lavaan package for CFA;27 eRm package for Rasch analysis28).
Results
PCA
The Walsh-IT was tested for evidence of reliability using the Cronbach’s alpha coefficient of internal consistency. The alpha coefficient was 0.946. Bartlett’s test indicated that the data are probably factorable (chi-square =6,589.572; df =465; p<0.0001). Kaiser Meyer Olkin Test measure of sampling adequacy was 0.95, which is considered an excellent value to analyze factorability. To test the component structure of the Walsh-IT, a PCA was carried out with varimax rotation. Both parallel analysis29 and minimum average partial criteria30 suggested that the best number of domains is equal to 3 (Figure 1), explaining 50.4% of the total variance.
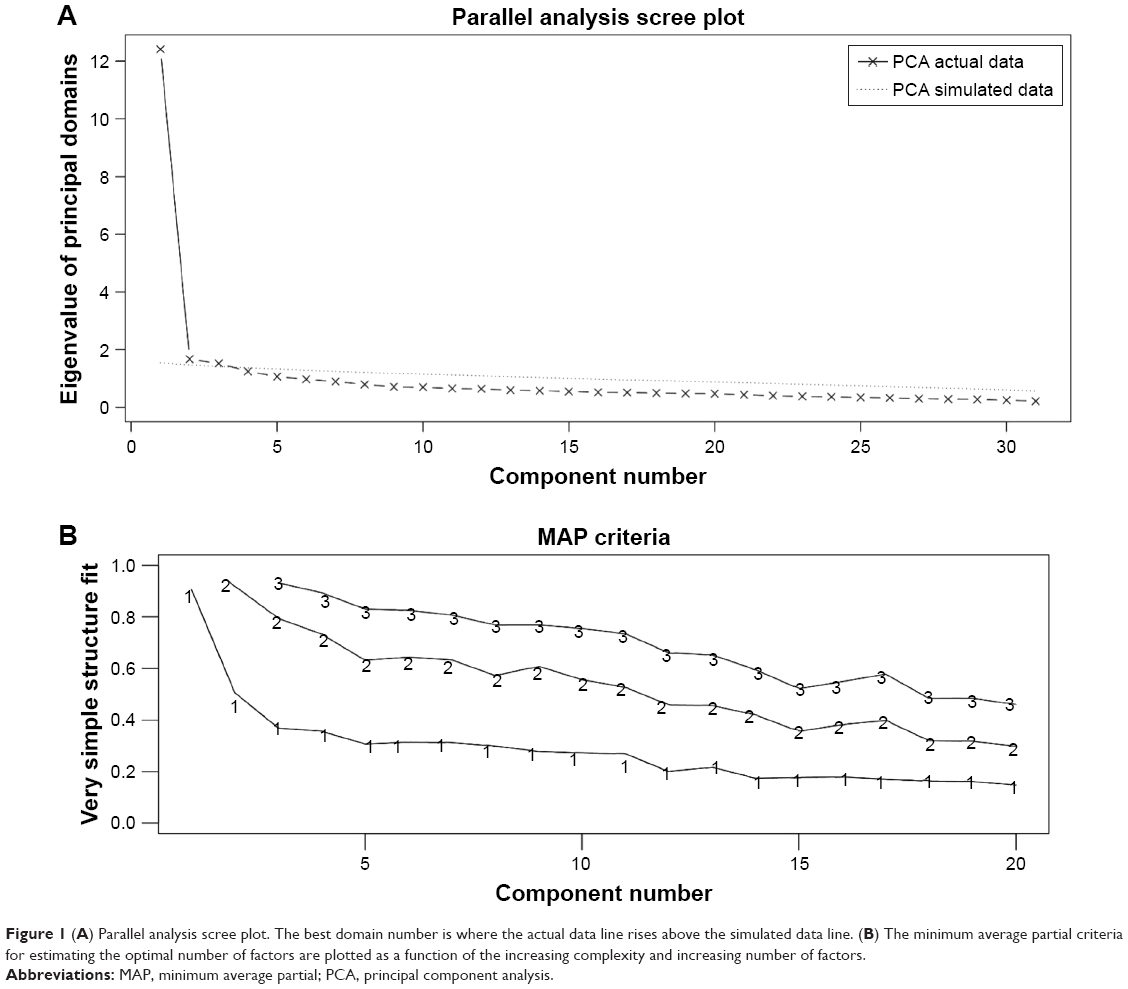 | Figure 1 (A) Parallel analysis scree plot. The best domain number is where the actual data line rises above the simulated data line. (B) The minimum average partial criteria for estimating the optimal number of factors are plotted as a function of the increasing complexity and increasing number of factors. |
PCA suggested a solution in which 16 items loaded strongly on the first domain, which accounted for 25.2% of the variance; 10 items loaded on the second domain, which accounted for 15.6% of the variance; and five items loaded on the third domain, which accounted for 9.6% of the variance. The results of the PCA of Walsh-IT are summarized in Table 3.
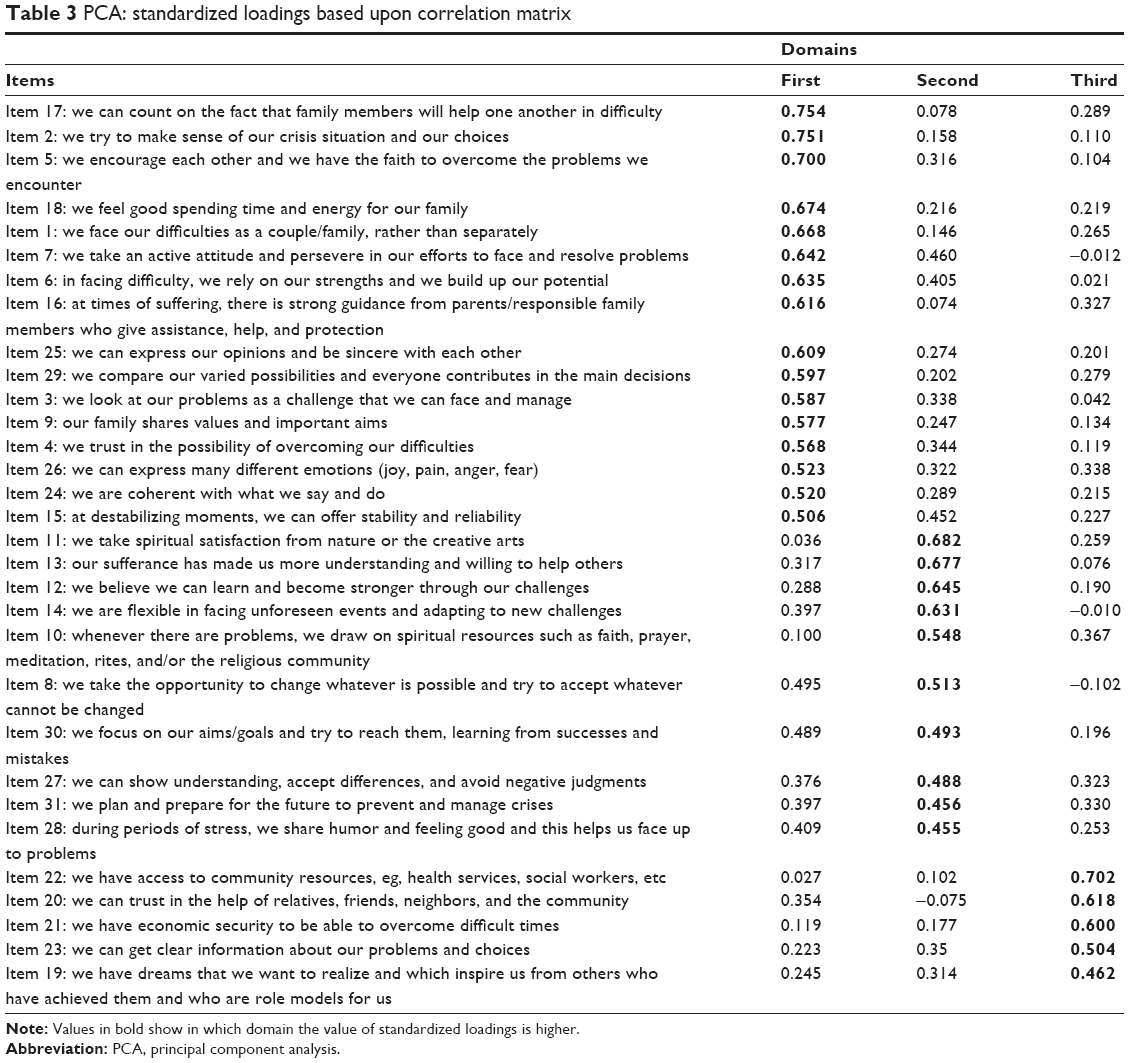 | Table 3 PCA: standardized loadings based upon correlation matrix |
CFA using SEM
In agreement with Schermelleh-Engel et al,15 Table 4 summarizes the principal indexes of the goodness of fit used in our CFA. Generally, the variables are highly associated with the domain. Figure 2 shows the standardized structural coefficients of the 31 items. The analysis shows that there are no significant correlations between item errors. The item values of the standardized structural coefficients are in the range of 0.52–0.76, and the model results are acceptable.
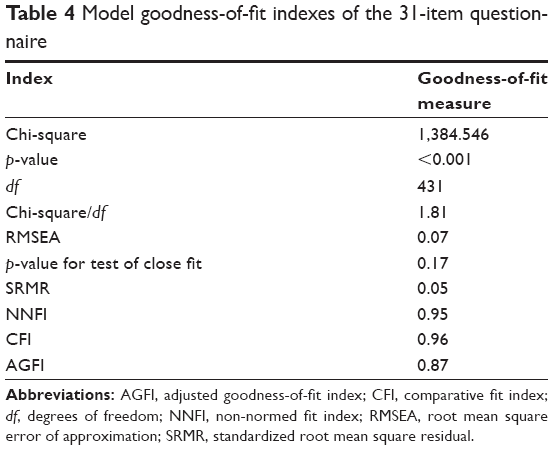 | Table 4 Model goodness-of-fit indexes of the 31-item questionnaire |
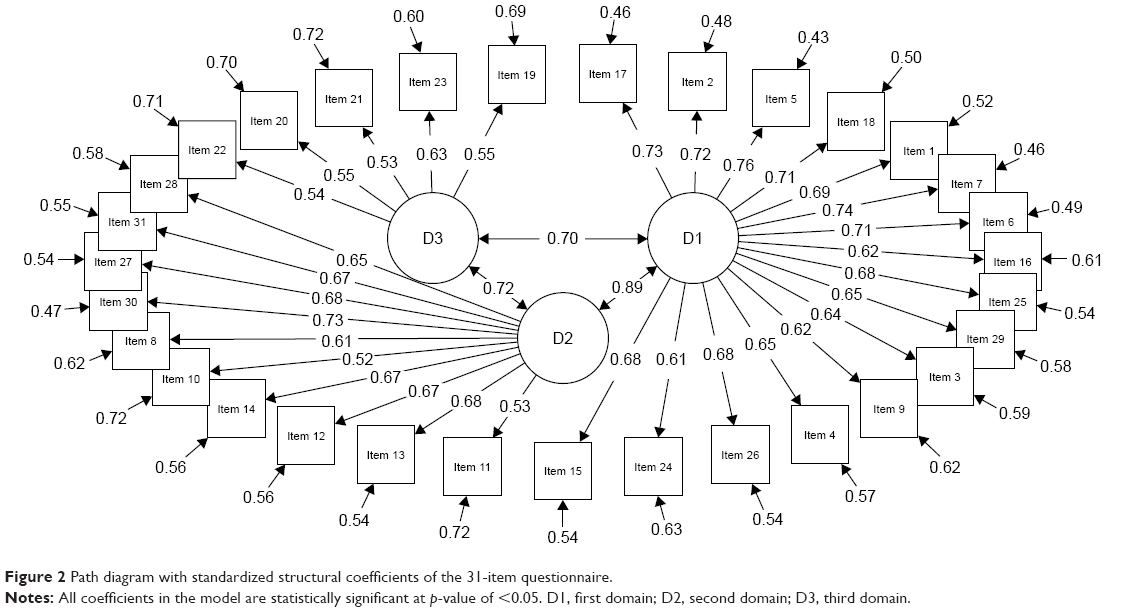 | Figure 2 Path diagram with standardized structural coefficients of the 31-item questionnaire. |
Rasch analysis on the three domains
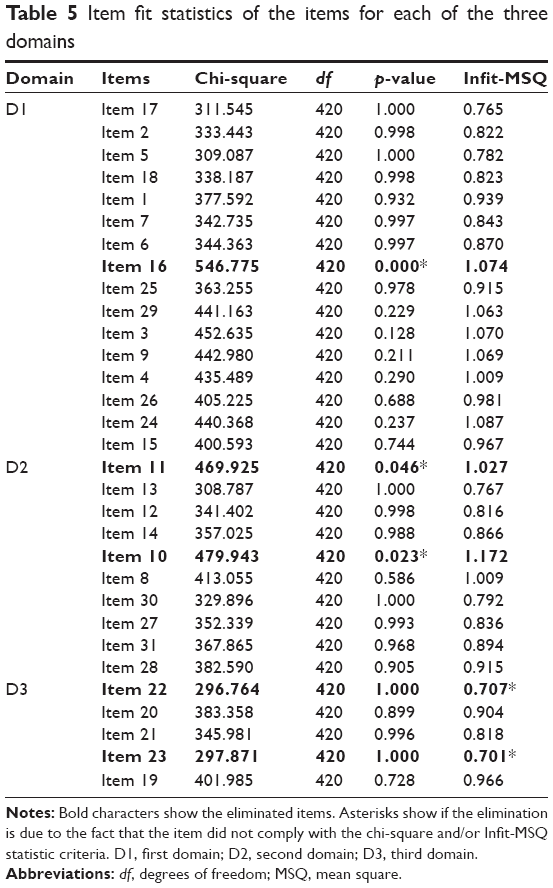
Item fit statistics of three partial credit models18 on the items for each of the three domains are summarized in Table 5. For item reduction, we adopted the abovementioned chi-square criteria (p-value <0.05) and the Infit-MSQ statistic value outside the range of 0.75–1.33.
 | Table 5 Item fit statistics of the items for each of the three domains |
Based on the results obtained from the Rasch analysis, items 10, 11, 16, 22, and 23 have been removed resulting in a short-form questionnaire (Walsh-IT-R) of 26 items.
The first domain D1, composed of 15 items, was re-labeled as “shared beliefs and support” (SBS). SBS comprises values, beliefs, attitudes, and hypotheses that form a group of basic suppositions, activate emotional responses, form decisions, and orientate action (item: eg, belonging to this domain is: we can count on the fact that members of the family are engaged to sustain each other through difficulties). In Walsh’s framework, the SBS of the family and their culture influence the experience “disease” and every dynamic phase of it.
The second domain D2, composed of eight items, was relabeled as “family organization and interaction” (FOI). FOI refers to the family capacity to adapt after a crisis, by identifying collaborative solutions to overcome adversities, avoiding conflicts (item: eg, we believe we can learn and become stronger through life challenges). The third domain, composed of three items, was relabeled as “utilization of social resources” (USR). USR refers to the capacity to gain support from social and institutional organizations and rely on economic resources (item: eg, we can find support from relatives, friends, neighbors, or community). The construction/extension of large family and social connections represent the “natural cushions” in periods of crisis.
The final questionnaire item, an open question, asked respondents to note, in addition, what had been especially helpful in dealing with their challenges. A total of 35 respondents (12 patients and 23 relatives) have suggested that pets, music, physical leisure activities, and reading were helpful to them.
Analysis of problematic items
If an item is a “problematic item,” Rasch misfit indicates that the item is assessing anything in addition to, or other than, the property or domain of interest.
When misfit is due to chi-square it means that the invariance property of the Rasch model is compromised, ie, the comparison between stimuli is not independent of the characteristics of the subjects responding to the questionnaire. Therefore, if the chi-square is significant it means that the hierarchical ordering of the items varies across the domain when this item is included.
When misfit is due to Infit-MSQ, it signifies that a violation of the local independence property exists, ie, there is a significant relationship between test items. The items used in a Rasch analysis are required to be independent of each other.19,23
Problematic items for the first domain “SBS”: the only problematic item in this domain is item 16 (at times of suffering, there is strong guidance from parents/responsible family members who give assistance, help, and protection). For this item, we note a significant value of chi-square. This indicates a violation of the invariance property.
By referring to the text, it is possible to note that item 16 is the only item that does not refer to terms such as “we” and “our.” Probably without “we” and “our,” it is hard to talk about SBS.
Problematic items for the second domain “FOI”: there are two problematic items in this domain, item 10 (whenever there are problems, we draw on spiritual resources such as faith, prayer, meditation, rites, and/or the religious community) and item 11 (we take spiritual satisfaction from nature or the creative arts). For both items, it is possible to observe a significant value of chi-square, ie, two violations of the invariance property. These items are the only ones to refer to “spiritual contents.” Evidently, “spiritual contents” are not part of the FOI.
Problematic items for the third domain “USR”: even in this domain there are two problematic items, item 22 (we have access to community resources, eg, health services, social workers, etc) and item 23 (we can get clear information about our problems and choices). For both items, the misfit is due to the Infit-MSQ value. Therefore, we registered two violations of the local independence property. Looking at the texts of the items, it can be concluded that “to have access to community resources” and “to get clear information about problems/choices” do not mean “to gain support from social/institutional organizations and economic resources” (USR).
Analysis of the relationship between subject characteristics and item responses
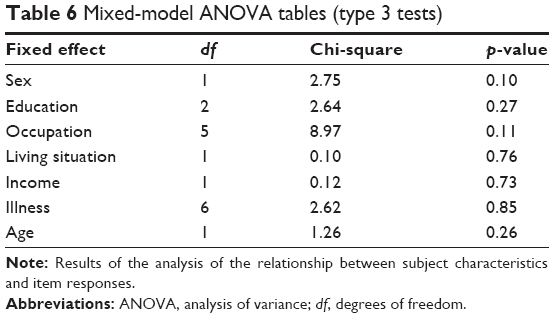
To test whether there were differences between subject characteristics and item responses, we used linear mixed models (LMMs). The analysis was performed after having checked for the normality of distribution of the data (using Shapiro test and Levene test in R’s stats package).25 LMM expands the set of linear models so that the dependent variable is linearly related to the factors and covariates through a specified link function. LMM allows for the dependent variable to have a non-normal distribution and for random effects to be taken into account (effects related to individual experimental units randomly selected from a population that allow the consideration of variations between groups that might change the dependent variable) simultaneously with fixed factors (the usual linear predictors). This gives the opportunity to analyze clustered data, repeated and longitudinal measurements, multivariate observations, etc, with accommodation of covariates. For the aforesaid reasons, we used the Imer functions in the Ime4 package of the R software environment for statistical computing and graphics.31 We performed mixed-model analysis of variance (ANOVA) tables (type 3 test) via likelihood ratio tests implemented in the afex package of the R software.32 Sex, age, illness, education, marital status, occupation, living situation, and income were considered as fixed effects, and the patient’s ID as random effect. In LMMs, random effects are used when: if one of the variable levels is replaced by another level the study would be essentially unchanged; if the levels do no exhaust the possibilities of the variable; when we want to generalize beyond the levels that we currently have; and when individual experimental units are randomly extracted from the population. Walsh-IT-R item responses were the dependent variable. There were no significant differences in the subjects’ responses (Table 6).
 | Table 6 Mixed-model ANOVA tables (type 3 tests) |
Furthermore, in the Rasch model, the item calibration is sample free. This means that when the data fit the Rasch model the items are independent of the differences between the people. So, the fixed effects (Table 6) will not significantly affect the properties of the items.16,23
Internal consistency and reliability
The Cronbach’s alpha coefficients of the three factors of the Walsh-IT-R were α=0.928 for SBS, α=0.863 for FOI, and α=0.565 for USR. With regard to the FACES III questionnaire, the Cronbach’s alpha coefficients of the Real Family Scale (RFS), Adaptability (RFS-AD) and Cohesion (RFS-COH) factors were α=0.849, α=0.873, and α=0.653, respectively, while the Cronbach’s alpha coefficients of the Ideal Family Scale (IFS), Adaptability (IFS-AD) and Cohesion (IFS-COH) factors were: α=0.881, α=0.881, and α=0.753, respectively.
Test/retest reliability
A total of 175 subjects (40 patients and 135 relatives), 41% of the sample, repeated the Walsh-IT-R after 1–2 weeks. Across all the items and the three Walsh-IT-R factors, a high agreement between repeated measurements – with an ICC of 0.98–0.99 for the items 1–31, and an ICC of 0.99 for SBS, 0.98 for FOI, 0.98 for USR, and 0.99 for the Walsh-IT-R total sum – was found.
Concurrent validation
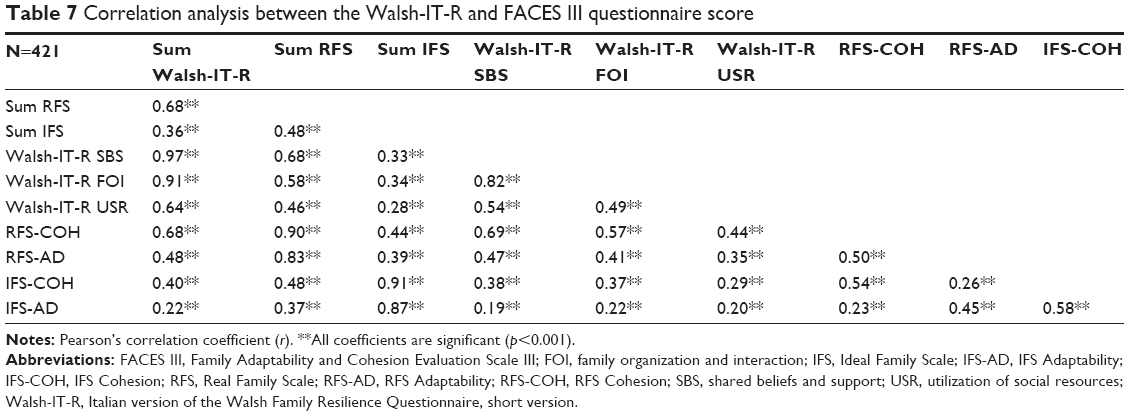
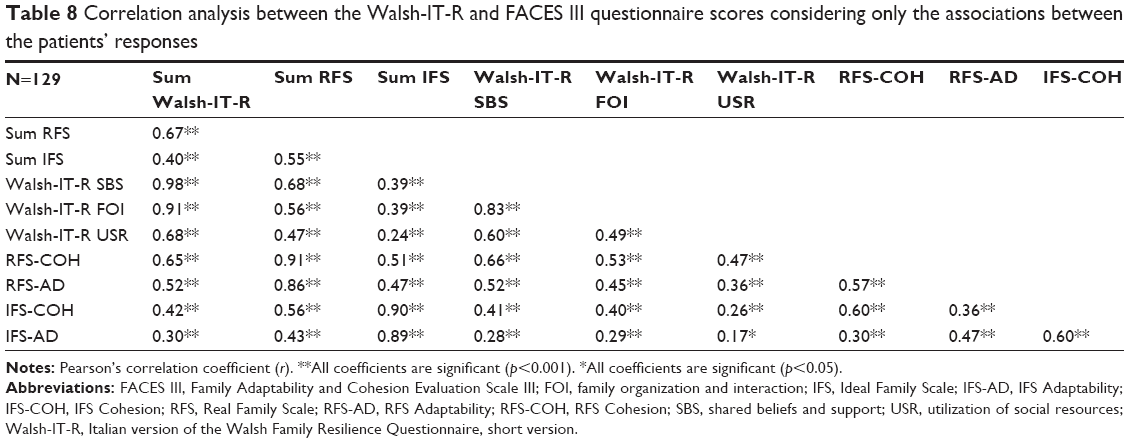
A correlation analysis was performed to test the external validity of the Walsh-IT-R reconstruction. The results of the Pearson’s correlation analysis between the Walsh-IT-R and FACES III factors are summarized in Table 7, and Table 8 summarizes only the associations between the patients’ report on Walsh-IT-R and FACES III.
 | Table 7 Correlation analysis between the Walsh-IT-R and FACES III questionnaire score |
 | Table 8 Correlation analysis between the Walsh-IT-R and FACES III questionnaire scores considering only the associations between the patients’ responses |
There was significant correlation between the domain scores of Walsh-IT-R and the domains scores of FACES III. The total score of the Walsh-IT-R (sum Walsh-IT-R) was strongly correlated with the total score of FACES III RFS (sum RFS; r=0.68; p<0.0001). It is also interesting to note the parallel between the Walsh-IT-R total sum and the RFS-COH (r=0.68; p<0.0001), that measures family cohesion.
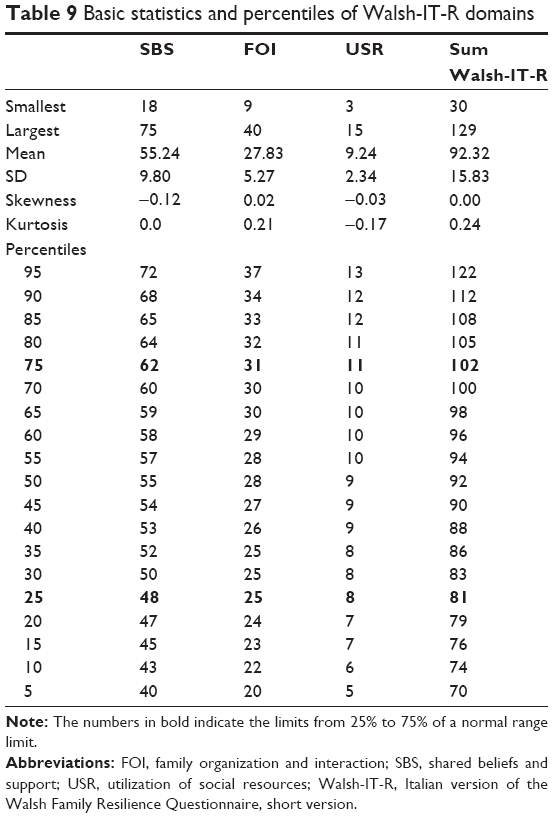
Furthermore, the correlation of the total score of the Walsh-IT-R with the FACES III IFS (sum IFS) and its subscales (IFS-COH, IFS-AD) was low to moderate (r=0.36, r=0.40, and r=0.22, respectively; p<0.0001) – which was reasonable because the Walsh-IT-R was supposed to measure the characteristics of the real family. The same results were found with regard to the three factors of the Walsh-IT-R resulting from the statistical analysis. The factors SBS and FOI showed a strong positive correlation with the total score of the RFS (sum RFS; r=0.68 and r=0.58, respectively; p<0.0001), and a lower index for USR (r=0.46; p<0.0001). Basic statistics and percentiles of the Walsh-IT-R factors are summarized in Table 9.
 | Table 9 Basic statistics and percentiles of Walsh-IT-R domains |
Discussion
The aim of this study was to assess resilience in families who have a member suffering from a chronic disease by adapting and validating the Walsh-IT-R.
The results obtained have highlighted that the Walsh-IT-R showed good psychometric properties: internal consistency is high (α=0.946) and its three factors explain 50.4% of the total variance.
To prove that items are not interpreted differently by the subjects, as agreement index, we also report “Rasch reliability person separation index.”21,23 High reliability of persons means that there is a high probability that persons estimated with high measures of resilience actually do have higher measures than persons estimated with low measures. The value of this index is very high: 0.944. This implies that the questionnaire is sensitive enough to distinguish between high and low performers.
The factor structure found in the current study clustered the items slightly differently than in the original domains in which the core processes were located. In particular, some items expected to load in the original dimension “family beliefs system,” in this study relabeled as SBS, appear to load more in the second domain, in this study relabeled as FOI, and conversely. Furthermore, the third original dimension “communication processes and problem solving” seems to be transversal to the two first domains because most of its items load better in SBS or in FOI. Finally, the third dimension found in the current study, relabeled as USR, is somewhat original because it clusters a small number of items related to the capacity to gain support from social and institutional organizations.
The difference in the three domains that emerged in this study may be attributed to several variables in the study of resilience4 including: 1) the construct resilience complexity – it should be noted that meta-analysis of studies using individual resilience instruments has found instability in factor analysis;33 2) the overlapping and recursive nature of transactional processes, eg, respondents might access spiritual resources (faith), family rituals, and practices (organizational/relational; and externally by faith congregations/clergy support); 3) cultural differences, Italians are known as more emotional than American people; 4) wording differences, adaptation in Italian language may slightly change the meaning of the sentence.
Therefore, this location (factor) difference of specific items is not important in the utility of the scale for research and clinical practice, since it successfully taps the questionnaire items that measure the core processes in the Walsh framework. Moreover, the concurrent validity of the Walsh-IT-R was confirmed by the medium-to-high correlations with the FACES III scales, and the test/retest reliability was supported by good ICC values.
The reliability of the test/retest of the Walsh-IT-R showed a high and significant correlation (ICC =0.98–0.99) between the results from the first and the second assessment, indicating a good temporal stability of the constructs investigated.
A limitation of the study is the low number of patients with a diagnosis of a particular illness. This did not permit us to differentiate the results of the Walsh-IT-R for families contending with a specific illness. This aspect may be addressed in future studies considering the role of a specific complication in challenging family resilience skills. However, despite this limitation, the questionnaire was shown to be adequate for the assessment of the main processes of family resilience with serious and chronic health and mental health challenges.
When living with a severe chronic disease (ie, chronic cardiac failure), a disability (multiple sclerosis) or a mental illness (mood disorders), patients and their families must pace themselves to avoid burnout, rebalance relationships and caregiving cues,34 and reorganize their needs and resources to survive crisis and symptoms that accompany chronic illnesses in the long term.35
Recent studies have indicated that families possess their own capacity and resources to confront adversities, and by potentiating internal relationship processes the negative effects of crisis can be reduced,36–38 or lead to an improvement in the quality of life of each member of the family.39
In clinical practice, it is useful to have an instrument to guide initial evaluation of family resilience, identification of specific strengths and resources, targeting of transactional processes to strengthen through interventions, and follow-up of changes over time.
Since family resilience involves dynamic processes, not stereotyped traits, the questionnaire offers a profile of principal processes of family resilience. The questionnaire ratings for various items and the total score can be used to track the changes that the family makes, and the strengths that are more or less helpful in its passage over time when confronting stressful challenges with a chronic disease.3
Conclusion
The questionnaire rating for various items and total score is valid to observe how families do change and find more or less helpful resources as time goes by dealing with the continuous challenges of a chronic disease.
As a methodological note, we want to highlight two key future goals: to improve the use of multigroups for studies conducted by structural equation, with special attention to the goodness of the experimental data; to prove the Walsh-IT-R admissibility using different subjects from those used in this study.
From a methodological point of view, we intend to highlight two principal questions of the current study: the first one will be to improve the use of multigroups inside studies achieved through the structural equation, paying greater attention to the goodness-of-fit of the collected data; the second aim will be to test the Walsh-IT-R acceptability in different participants from those used to achieve the reported validation/reduction.
Studies by Erhart et al40 and Prieto et al41 have compared item reduction analysis based on classical test theory with analysis based on the Rasch partial credit model item fit. The results support the usability of the Rasch method, especially to obtain a better metric quality. For these reasons, in the current study, we have added together the benefits of factor analysis to the benefits of the Rasch model.
Acknowledgments
We would like to thank all patients and their families who allowed us to finalize this work with their precious contribution. Moreover, we are grateful to Professor Froma Walsh, Chicago University, for her continuous help, support, and suggestions throughout all the steps of the Italian adaptation and validation. The authors thank Sarah Pennings for her English review.
Disclosure
The authors report no conflicts of interest in this work.
References
Walsh F. Strengthening Family Resilience. New York: Guilford Press; 1998. | ||
Walsh F. Family resilience: a framework for clinical practice. Fam Process. 2003;42(1):1–18. | ||
Walsh F. Strengthening Family Resilience. 3rd ed. New York: Guilford Press; 2016. | ||
Rolland JS. Families, Illness and Disability: An Integrative Treatment Model. New York: Basic Books; 1994. | ||
Rolland JS. Mastering family challenges in serious illness and disability. In: Walsh F, editor. Normal Family Processes. 4th ed. New York: The Guilford Press; 2012:452–482. | ||
Sixbey MG. Development of the Family Resilience Assessment Scale to Identify Family Resilience Constructs [a dissertation presented to the graduate school of the University of Florida in partial fulfilment of the requirements for the degree of doctor of Philosophy University of Florida]; 2005. | ||
Isaacs SA, Roman NV, Savahl S, Sui HC. Adapting and validating the Family Resilience Assessment Scale in an Afrikaans rural community in South Africa. Community Mental Health J. Epub 2017 Feb 1. | ||
Yuli Li Y, Zhao Y, Zhang J, Cao F. Psychometric properties of the shortened Chinese version of the Family Resilience Assessment Scale. J Child Fam Stud. 2016;25:2710–2717. | ||
Beaton DE, Bombardier C, Guillemin F, Ferraz MB. Guidelines for the process of cross-cultural adaptation of self-report measures. Spine. 2000;25(24):3186–3191. | ||
Olson DH, Portner J, Lavee Y. FACES III. Family Social Science. St. Paul: University of Minnesota; 1985. | ||
Galimberti C, Farina M. FACES III. Uno strumento per la ricerca e l’osservazione clinica della famiglia. Milano: Vita e Pensiero; 1990. | ||
Watkins D. The role of confirmatory factor analysis in cross-cultural research. Int J Psychol. 1989;24:685–701. | ||
Raimondo M. The measurement of trust in marketing studies: a review of models and methodologies. In: Proceedings of the XVI IMP Conference; 2000; Bath, UK; University of Bath. | ||
Joreskog KG. A general method for estimating a linear structural equation system. In: Goldberger A, Duncan O, editors. Structural Equation Models in the Social Sciences. New York: Seminar Press; 1973:85–112. | ||
Schermelleh-Engel K, Moosbrugger H, Müller H. Evaluating the fit of structural equation models: tests of significance and descriptive goodness of-fit measures. Methods Psychol Res Online. 2003;8:23–74. | ||
Jöreskog KG, Sörbom D. Structural Equation Modeling with the SIMPLIS Command Language. Chicago: Scientific Software International; 1993:17. | ||
Hu L, Bentler PM. Cut off criteria for fit indexes in covariance structure analysis: conventional criteria versus new alternatives. Struct Equ Modeling. 1999;6:1–55. | ||
Masters GN. A Rasch model for partial credit scoring. Psychometrika. 1982;47:149–174. | ||
Burro R. To be objective in experimental phenomenology: a psychophysics application. Springerplus. 2016;5(1):1720. | ||
Burro R, Sartori R, Vidotto G. The method of constant stimuli with three rating categories and the use of Rasch models. Qual Quant. 2011;45:43–58. | ||
Bond TG, Fox CM. Applying the Rasch Model: Fundamental Measurement in the Human Sciences. Mahwah, NJ, USA: Erlbaum; 2001. | ||
Smith EV Jr. Introduction to Rasch Measurement. Maple Grove, MN, USA: JAM Press; 2004. | ||
Wright B, Masters GN. Rating Scale Analysis. Chicago: Chicago University Press; 1982. | ||
Campbell NR. Physics: The Elements. Cambridge: Cambridge University Press; 2013. | ||
Team R. CORE. R: A Language and Environment for Statistical Computing. Vienna, Austria: R Foundation for Statistical Computing; 2011. | ||
Revelle W. Psych: Procedures for Personality and Psychological Research. Evanston, Illinois, USA: Northwestern University; 2016. | ||
Rosseel Y. lavaan: an R package for structural equation modeling. J Stat Softw. 2012;48:1–36. | ||
Mair P, Hatzinger R, Maier MJ. eRm: Extended Rasch Modeling; 2016. Available from: http://r-forge.r-project.org/projects/erm/. Accessed November 2, 2017. | ||
Horn J. A rationale and test for the number of factors in factor analysis. Psychometrika. 1965;30:179–185. | ||
Velicer W. Determining the number of components from the matrix of partial correlations. Psychometrika. 1976;4:321–327. | ||
Bates D, Maechler M, Bolker B, Walker S. Fitting linear mixed-effects models using lme4. J Stat. 2015;67(1):1–48. | ||
Singmann H, Bolker B, Westfall J, Aust F [webpage on the Internet]. afex: Analysis of Factorial Experiments R package version 0.17-8; 2017. Available from: https://CRAN.R-project.org/package=afex. Accessed November 2, 2017. | ||
Windl G, Bennett KM, Noyes J. A methodological review of resilience measurement scales. Health Qual Life Outcomes. 2011;9:1–18. | ||
Lavarone A, Ziello AR, Pastore F, Fasanaro AM, Poderico C. Caregiver burden and coping strategies in caregivers of patients with Alzheimer’s disease. Neuropsychiatr Dis Treat. 2014;10:1407–1413. | ||
Rossi Ferrario S, Giorgi I, Baiardi P, et al. Illness denial questionnaire for patients and caregivers. Neuropsychiatr Dis Treat. 2017;13:909–916. | ||
Edward K, Welch A, Chater K. The phenomenon of resilience as described by adults who have experienced mental illness. J Adv Nurs. 2008;65(3):587–595. | ||
Kralik D, van Loon A, Visentin K. Resilience in the chronic illness experience. Educ Action Res. 2006;14:187–201. | ||
Preece J, Sandberg J. Family resilience and the management of fibromyalgia: implications for family therapists. Contemp Fam Ther. 2005;27:559–576. | ||
Weihs KL, Fisher L, Baird M. Families, health and behavior. Fam Syst Health. 2001;20:7–47. | ||
Erhart M, Hagquist C, Auquier P, et al. A comparison of Rasch item-fit and Cronbach’s alpha item reduction analysis for the development of a Quality of Life scale for children and adolescents. Child Care Health Dev. 2010;36(4):473–484. | ||
Prieto L, Alonso J, Lamarca R. Classical test theory versus Rasch analysis for quality of life questionnaire reduction. Health Qual Life Outcomes. 2003;1:1–27. |
 © 2017 The Author(s). This work is published and licensed by Dove Medical Press Limited. The full terms of this license are available at https://www.dovepress.com/terms.php and incorporate the Creative Commons Attribution - Non Commercial (unported, v3.0) License.
By accessing the work you hereby accept the Terms. Non-commercial uses of the work are permitted without any further permission from Dove Medical Press Limited, provided the work is properly attributed. For permission for commercial use of this work, please see paragraphs 4.2 and 5 of our Terms.
© 2017 The Author(s). This work is published and licensed by Dove Medical Press Limited. The full terms of this license are available at https://www.dovepress.com/terms.php and incorporate the Creative Commons Attribution - Non Commercial (unported, v3.0) License.
By accessing the work you hereby accept the Terms. Non-commercial uses of the work are permitted without any further permission from Dove Medical Press Limited, provided the work is properly attributed. For permission for commercial use of this work, please see paragraphs 4.2 and 5 of our Terms.