")
Back to Journals » Drug, Healthcare and Patient Safety » Volume 8
The virgin land of quality management: a first measure of patient safety climate at the National Hospital of the Faroe Islands
Authors Kristensen S, Tugvustein N, Zachariassen H, Sabroe S, Bartels P, Mainz J
Received 15 November 2015
Accepted for publication 11 February 2016
Published 26 April 2016 Volume 2016:8 Pages 49—57
DOI https://doi.org/10.2147/DHPS.S100575
Checked for plagiarism Yes
Review by Single anonymous peer review
Peer reviewer comments 2
Editor who approved publication: Professor Chul Ahn
Solvejg Kristensen,1,2 Naina Túgvustein,3 Hjørdis Zachariassen,3 Svend Sabroe,4 Paul Bartels,1,5 Jan Mainz5,6
1The Danish Clinical Registries, Aarhus, 2Department of Health Science and Technology, Aalborg University, Denmark; 3National Hospital of the Faroe Islands, Torshavn, Faroe Islands; 4Department of Public Health, Aarhus University, Aarhus, 5Department of Clinical Medicine, Aalborg University, Aalborg, 6Aalborg University Hospital, Psychiatry, Aalborg, Denmark
Purpose: The Faroe Islands are formally part of the Kingdom of Denmark, but the islands enjoy extensive autonomy as home ruled. In Denmark, extensive quality management initiatives have been implemented throughout hospitals, this was not the case in the Faroese Islands in 2013. The purpose of this study is to investigate the patient safety culture in the National Hospital of the Faroe Islands prior to implementation of quality management initiatives.
Methods: The Danish version of the Safety Attitudes Questionnaire (SAQ-DK) was distributed electronically to 557 staff members from five medical centers of the hospital, and one administrative unit. SAQ-DK has six cultural dimensions. The proportion of respondents with positive attitudes and mean scale scores were described, and comparison between medical specialties, and between clinical leaders and frontline staff was made using analysis of variance and chi-square test, respectively.
Results: The response rate was 65.8% (N=367). Job satisfaction was rated most favorable, and the perceived culture of the top management least favorable. Safety climate was the dimension with the greatest variability across the 28 units. The diagnostic center had the most favorable culture of all centers. More leaders than frontline staff had positive attitudes toward teamwork and safety climate, and working conditions, respectively. Also, the leaders perceived these dimensions more positive than the frontline staff, P<0.05. Among three management levels, the unit management was perceived most favorable and the top management least favorable.
Conclusion: The management group is recommended to raise awareness of their role in supporting a safe and caring environment for patients and staff, moreover the leaders should ensure that every day work achieves its objectives; keeping the patients safe. Furthermore, following the development in patient safety culture over time is recommended.
Keywords: safety attitudes questionnaire, medical specialties, frontline staff, clinical leaders, patient safety culture
Introduction
The quality of hospital care varies extensively across specialties, hospitals, and countries,1–3 at its worst, the consequences are adverse patient outcomes and amplified costs.4 Increasing awareness of such variations has emphasized the use of systematic quality management (QM) in health care. QM ensures that an organization, product, or service is consistent, accountable, and meeting the quality standards agreed upon.
Patient safety culture (PSC) has been proposed to be an underlying organizational context factor inducing safe, effective, and timely patient care.5,6 Thus, many health care organizations are measuring and improving safety culture as an integrated part of their QM activities. Even at national level, countries like Sweden, Norway, and Belgium7–9 have introduced PSC measures as part of government supported national level QM.
A culture of safety can be defined as “An integrated pattern of individual and organisational behaviour, based upon shared beliefs and values that continuously seeks to minimise patient harm, which may result from the processes of care delivery.”10 Safety culture is a multidimensional and multilevel construct.6 Surveys can be used to capture a snapshot of the staff’s perceptions of the different dimensions of the culture (eg, teamwork climate, safety climate, job satisfaction, stress recognition, perceptions of management, and working conditions).11,12
Perceptions of the different dimensions of the culture vary according to organizational role (eg, more leaders than frontline clinicians are positive), and there is variation by management level (eg, the higher in line management of the hospital the more positive attitudes).13,14 Variation in the perceptions of the PSC is evident across units.11,13,15 Also variation across medical specialties has been observed (eg, poorer culture has been found in emergency department and operating theater than in pediatric, psychiatry, and rehabilitation departments).15–19 It has also been documented that staff in nonclinical areas have a more favorable view of the culture than staff closest to the patients.18
Although formally part of the Kingdom of Denmark, the Faroe Islands enjoy extensive autonomy as home ruled. The Faroese Ministry of Health Affairs is in charge of the administrative functions in relation to the organization and financing of the health care system, psychiatry and health insurance as well as the pharmacy sector. QM within hospital care of the Faroese Islands was at the very beginning in last quarter of 2013, meaning that QM initiatives such as national level clinical databases, clinical guidelines and standards, pathways, patient satisfaction surveys, accreditation, reporting of adverse events, and large-scale improvement programs20,21 were not yet implemented in the Faroese Islands.
The objectives of this study are to investigate the PSC in the National Hospital of the Faroe Islands (NHFI) prior to implementation of any QM activity. More specifically, the study embarked on the following four research questions:
- How do the staff of the NHFI perceive the PSC?
- Are there differences in staff’s perceptions of the PSC according to medical speciality?
- Are there differences in perceptions of the PSC between the frontline staff and the management?
- Are there differences in the staff’s perceptions of how the different management types support patient safety?
Setting and context
The study took place in the NHFI, which is situated in the capital of the Faroe Islands, Torshavn. NHFI is an acute care somatic and psychiatric teaching hospital with ~160 hospital beds, 711 full- or part-time employees, 8,000 admissions, and 60,000 outpatients served per year. The hospital budget for 2013 was Euro 55 million, where 35% of the budget went to overseas treatment, mainly in Denmark and Iceland. The population of the 18 Faroe Islands amounts to ~48,100 (2013) citizens, where 40% live in Torshavn. The language spoken is Faroese, Danish is the first foreign language taught in the schools from the third grade upwards.
NHFI is organized in the six centers as follows: 1) medical center, 2) surgical center, 3) psychiatric center, 4) acute care center, 5) diagnostic center, and 6) service center. Further, an administration unit, an international patient service unit, a hygiene unit, and a human resource unit serve directly under the top management (collectively named administration unit hereafter). At the time of the survey, the NHFI had 28 clinical in- and outpatient units and one administrative unit, led by a total of 57 clinical leaders. The hospital has three layers of line management; top, center, and unit management.
The first official hospital wide QM initiative of the NHFI was to establish a QM board in the summer of 2013. In September 2013, the quality improvement program “Trygd and Dygd” (Patient Safety and Quality of Care) was launched with the kick off of the PSC survey. The “Trygd and Dygd” program entails initiatives such as reporting of adverse events, implementation of clinical indicator monitoring, executive leadership walk around, and implementation of the safe surgery checklist. The hospital enrolled in the Danish Patient Safety Program for Mental Health launched by the Danish Society for Patient Safety in the beginning of 2014.22 In the summer of 2014, the Ministry of Health Affairs entered into a cooperation agreement with The Danish Healthcare Quality Programme; and preparation for accreditation of the NHFI began. The aforementioned initiatives are undergoing implementation.
Material
Full- and part-time staff of the NHFI qualified for inclusion in the PSC survey. Staff from the service center were excluded. Based on human resource data, the included number of participants was identified as 557. The following professions were included: doctors, nurses, nursing assistants, midwifes, medical laboratory technicians, dieticians, psychologists, speech or music therapists, physiotherapists, occupational therapists, administrative staff and secretaries, service assistants, and porters.
Methods
A cross-sectional study design was applied; the Danish version of the Safety Attitudes Questionnaire (SAQ-DK) was used to capture staff perceptions of the PSC.11
Questionnaire used
SAQ-DK is an explorative questionnaire suitable for assessment of perceptions of PSC in hospitals. SAQ-DK has 31 items comprising six PSC composites and additional items on demography. The composites are: teamwork climate (six items), safety climate (seven items), job satisfaction (five items), stress recognition (four items), working conditions (four items), and perceptions of management (five items). The later composite was applied at the three management levels of NHFI. SAQ-DK has been found psychometrically sound, it can be used to assess safety attitudes across specialties in hospitals.11
Respondents answer the SAQ-DK on a five-point Likert scale as: 1, disagree strongly; 2, disagree slightly; 3, neutral; 4, agree slightly; and 5, agree strongly. Further, it is possible to rate the SAQ-DK items “not applicable”. Items are assumed to have interval properties. Items 2 and 11 are negatively worded.18
Information on sex, age group, profession, organizational role, work experience, and organizational affiliation was collected electronically together with answers on SAQ-DK items.
All SAQ-DK items as well demography questions were mandatory, meaning that the electronic questionnaire would only allow participants to go to the next question once having answered the present.
Data collection
Data were collected between September 21 and October 23, 2013.
The questionnaire was administered electronically via an individual link in a personal email. Weekly reminders were mailed to all staff who had not answered. That is, a responder could receive a maximum of four reminders.
A hospital-based administrator collaborated with the research team in the data collection. She gave information about the survey to the leaders and in unit-based meetings, answered questions from leaders and staff per email, telephone and in person, gave information about the survey on the intranet, and posted information material throughout the hospital.
The management group of the hospital NHFI assessed SAQ-DK for its purpose and approved the study. The survey invitees were informed that participation was voluntary and anonymously, that all answers would be treated with confidentiality, and no individual answers would be available to the management.
Analysis
The sample data was described by frequencies according to demographic groups.
The reliability of SAQ-DK was described by measures of internal consistency. Items in a composite were regarded closely related if Cronbach’s alpha (α) >0.70.23 Construct validity was reported by the degree of linear association between pairs of two dimensions; Pearson’s correlation coefficients were described.
SAQ-DK data were presented reporting two measures: 1) the percent of respondents with a positive attitude (%-positive, defined by an individual mean scale score ≥75), and 2) scale mean scores and standard deviation (SD); reflecting how positive the respondents perceived the culture.24
All composites were regarded continuous variables for the purpose of analysis.24
Individual SAQ-DK item scores were converted to a 0–100-point scale, where 1=0, 2=25, 3=50, 4=75, and 5=100. Item 2 and 11 were reverse scored so that their valence matched the positively worded items.
Individual scale mean scores were calculated by the average score of the scaled and scored items, and the %-positive calculated (range 0–100). SAQ-DK mean scale scores (range 0–100) were calculated for each dimension by the average score of the scaled and scored items.25 Results of %-positive were compared across subgroups using chi-square test, and mean scale scores were compared using independent t-test. Analysis of variance was applied for each cultural dimension to test for variability in means across centers.
All statistical analyses were performed using IBM-SPSS version 21.0 (SPSS, IBM Corporation, Armonk, NY, USA).
Results
Participation
In total, 357 of 557 questionnaires were returned (65.8%); 76 questionnaires originated from the surgical center, 93 from the psychiatric center, 34 from the diagnostic center, 110 from the medical center, 40 from the acute care center, and 14 from the administrative units directly under the top management.
The number of participants varied from four in the smallest outpatient setting to 31 in largest bed unit, six of the 28 units had five respondents. Respondent characteristics are shown in Table 1 for sex, age group, profession and organizational role, showing the number of participants in column 2, and the percentages in column 3. It is noticable that more than half of the participants are aged 46 years or older. This is evident from the figures in rows 8 and 9. Further as shown in row 11, the nurses amounts to approximately half of the sample. Last, the clinical leaders are well represented with 50 participants of 57 invitees, please see second row from the bottom of Table 1.
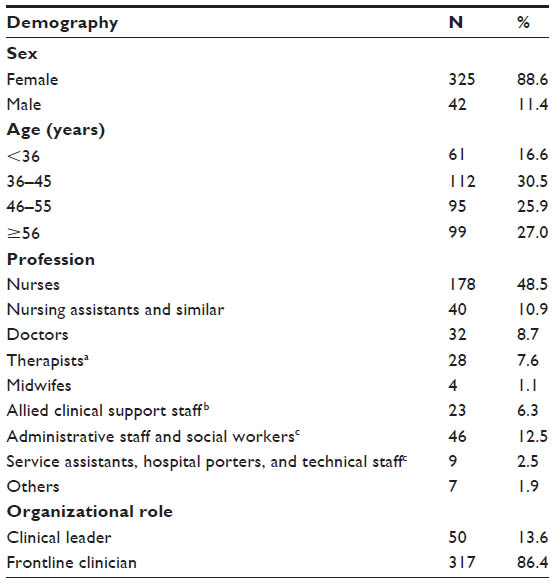 | Table 1 SAQ-DK respondent characteristics according to demography among health care staff of the National Hospitals of the Faroe Islands (N=367) |
Scale reliability and scale to scale correlations
Cronbach’s alpha ranged from 0.59 for teamwork climate to 0.86 for job satisfaction. The set cut point of 0.70 indicating good scale reliability was not exceeded for teamwork climate (0.59) and safety climate (0.67).
Scale to scale correlations were studied by the degree of linear association between pairs of two scales. All scales correlated negatively with the stress recognition scale revealing Pearson’s r between −0.15 and −0.06, P<0.05. Pearson’s correlations indicated significant strong positive relationships for all other scales; correlation coefficients ranged from 0.43 to 0.67, P<0.01.
Perception of the PSC among the Faroese staff
The average rate of not applicable answers at the item level was 6.4%. A full range of scores between 1 and 5 was observed for all items.
Dimensional results for SAQ-DK for the Faroese health care staff (N=367) are shown in Table 2, reporting %-positive and mean scale statistics in columns 3 and 6, respectively. Further, variation in %-positive and means are displayed in Table 2.
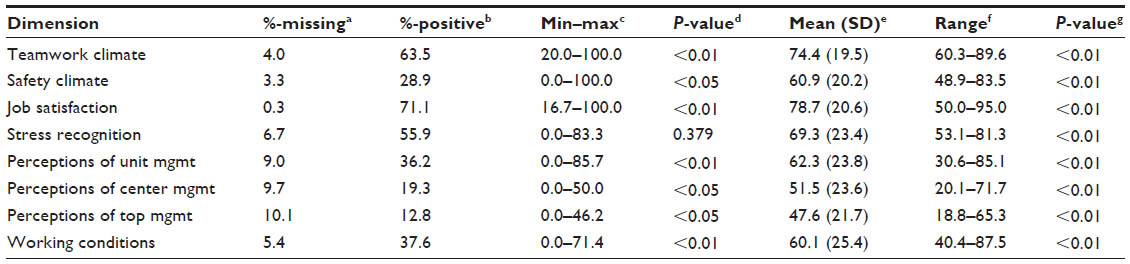 | Table 2 Dimensional patient safety culture results showing proportions of missing answers, proportions of staff with positive attitudes, mean scale statistics (N=367 responders), and variability across units in SAQ-DK dimensional scores (N=28 units) |
Across the entire sample, the proportion of staff with positive attitudes ranged from 12.8% for perception of top management to 71.1% for job satisfaction. In parallel, the top management was perceived least positive (mean scale score [SD]; 47.6 [21.7]), and job satisfaction most positive (mean scale score [SD]; 78.7 [20.6]).
Variations in %-positive across all units (administrative, and clinical in- and outpatient units, N=28) are shown as minimum–maximum in Table 2 column 4, likewise the range of the means of the units are displayed in column 7. The %-positive differed across units (N=28) for all dimensions, P<0.05, except stress recognition, P>0.05. Noticeable, the variation in %-positive across units ranged from 0.0 to 100.0 for safety climate, P<0.01. The degree to which the staff perceived the culture positive (mean scale score) varied significantly across the 28 units for all scales, P<0.01.
No differences in means were found between staff under 36 years and staff aged 36 years or older, P<0.05. Differences in means between nonclinical staff (secretaries and social workers) and clinical staff was found for job satisfaction, working conditions, perception of center management and perception of top management, P<0.05.
PSC results according to medical specialty
Dimensional PSC results for the five specialized centers were described, compared, and illustrated in Table 3. The diagnostic center shown in column 4 had the highest %-positive and the highest mean scale scores of all centers for all dimensions. The diagnostic center represents the laboratory (N=24) and the X-ray unit (N=10). No such patterns were found for %-positive and the means identifying the lowest scoring center across all dimensions.
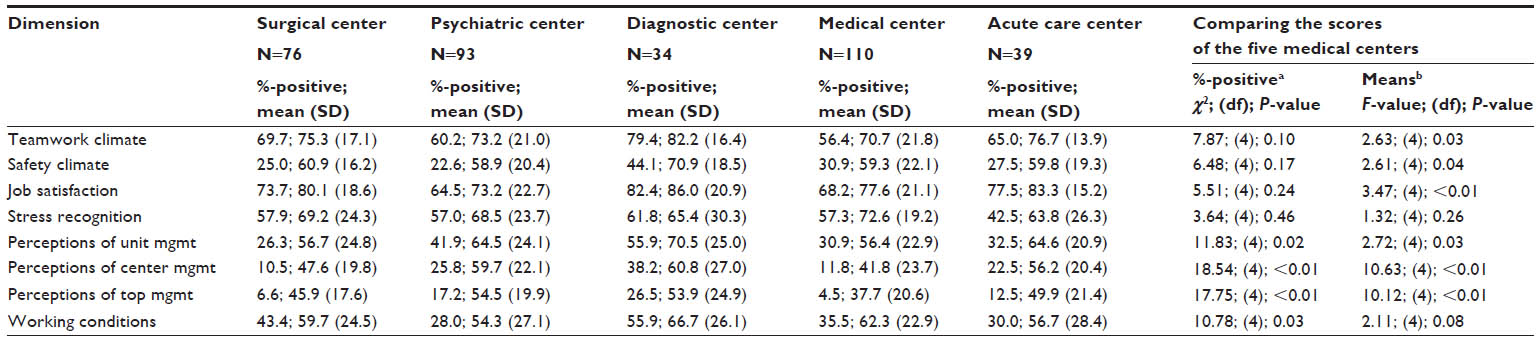 | Table 3 Dimensional SAQ-DK result showing the proportions of staff with positive attitudes (%-positive) and means for each of the five specialized centers; and comparison of the scores across the centers for all eight dimensions |
Differences in %-positive across the medial centers were identified for working conditions and all three management dimensions, P<0.05. The scale means differed statistically significant across centers for all scales, P<0.05; except for stress recognition and working conditions, P>0.05.
Clinical leaders’ and frontline staffs’ perceptions of the PSC
The NHFI is operated by three levels of line management; top, center, and unit management. According to Table 2, column 2, it is evident that the frequency of not applicable answers is highest for the three management dimensions, ranging from 9.0% for perception of unit management to 10.1% for perception of top management. If the leaders are excluded when calculating the frequency of not applicable answers for the three management dimensions, the percentage of not applicable answers amounted to 5.6% for perception of unit management, 9.7% for perception of center management, and 11.1% for perception of top management.
The three management dimensions were not included in the following analyses comparing perceptions of the frontline staff with those of the leaders.
Figure 1 shows %-positive for clinical leaders and frontline staff separately for teamwork and safety climate, job satisfaction, stress recognition, and working conditions. In parallel, Figure 2 shows the degree to which the leaders and frontline staff perceive the PSC positive. Across all dimensions, job satisfaction was the dimension where, both, most leaders (78.0%) and most frontline staff (70.0%) perceived the PSC positively, this is seen in the two middle bars of Figure 1. Among all five dimensions, job satisfaction was also perceived most positive by both clinical leaders (mean (SD); 83.5 [14.7]) and by frontline staff (mean [SD]; 78.0 [21.3]), this can be seen in Figure 2. Across dimensions, safety climate was the dimension, where least clinical leaders (40.0%), respectively, frontline staff (27.1%) perceived the culture positive, please see the two bars left of the middle in Figure 1. Safety climate was also perceived least positive by clinical leaders (mean [SD]; 67.8 [17.4]), but frontline staff perceived working conditions least positive (mean [SD]; 58.2 [25.6]), this is illustrated in Figure 2.
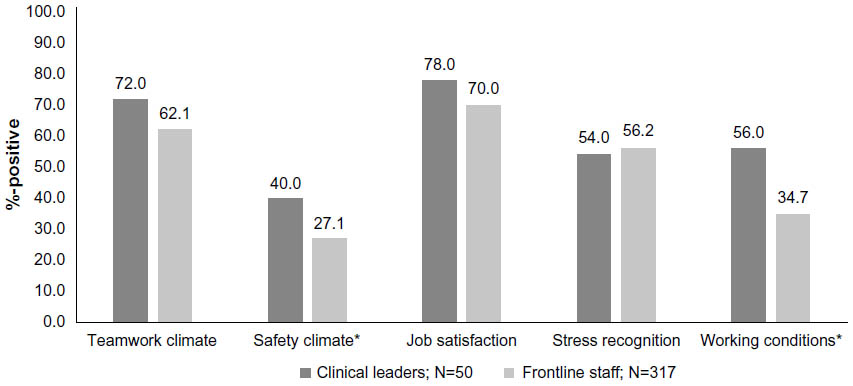 | Figure 1 Distribution of proportions of clinical leaders and frontline staff with positive attitudes toward dimensional patient safety culture. |
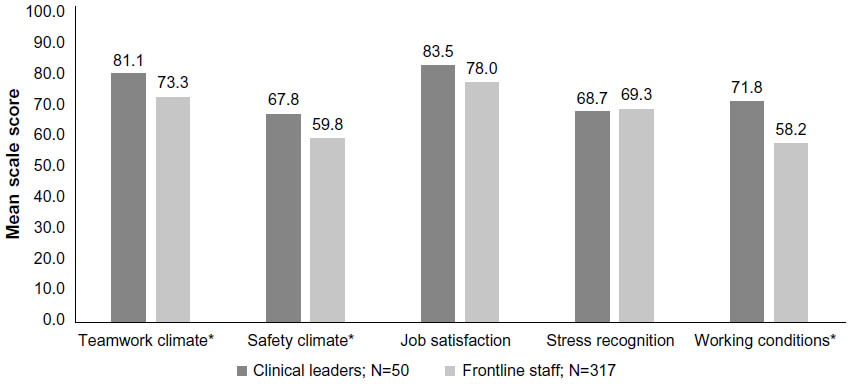 | Figure 2 The degree to which (mean scale score) the clinical leaders and the frontline staff perceived dimensional patient safety culture positive. |
Figure 1 illustrates that more leaders than frontline staff had positive attitudes towards the safety climate and working conditions, P<0.05. Figure 2 illustrates, that the leaders perceived teamwork and safety climate, and working conditions more positively than the frontline staff, P<0.05.
When observing the three management dimensions displayed in Table 2 row 6-8; the least amount of staff had positive attitudes towards the top management, and most of the staff had positive attitudes towards unit management, P<0.01. Likewise, the mean scale score for perception of the top management was lowest and the perceptions of the unit management highest, P<0.01.
Discussion
This study presents the first evidence-based information on PSC in the Faroe Islands. Based on data from 367 health care staff, job satisfaction was rated most favorable and perception of top management least. Unit level variation in the proportion of staff with positive attitudes toward the PSC was found for all dimensions, except stress recognitions. Moreover, unit level variability in how positive the dimensional PSC was perceived was found for all dimensions. Of the five medical specialties, the staff of the diagnostic center representing the laboratory and the X-ray unit perceived the culture most favorable for all cultural dimensions. The leaders perceived the culture more positive than the frontline staff for teamwork and safety climate, and working conditions. Across the three management layers, the unit management was perceived most positive and the top management least by the frontline staff. This also applied across medical specialties.
Methodological considerations
A good compliance representing all professions and a response rate above 65% was deemed highly acceptable given the challenges with this survey being the first staff survey in the NHFI, and the kick off of working with QM. Further, the average rate of not applicable answers at the item level compared well to international findings, not giving rise to any concern.11,12,26,27 Additionally, the study was heavily supported by the top management of the NHFI, during planning, implementation, results feedback and interpretation. In conclusion, the study was strengthened by the very good support and acceptability of the SAQ-DK among Faroese hospital staff.
The study has a number of weaknesses. First, Cronbach’s alpha was below the acceptable cut point for teamwork and safety climate, indicating that the items in those two scales are not related as closely as desired, and not as well, as found in other studies.12,13,28 Second, the survey was carried out using SAQ-DK, which is in Danish. Although Danish is the second language in the Faroe Islands, this might have influenced participation and created biased answers due to misunderstandings. Moreover, selection bias cannot be ruled out as staff of the service center was not invited, such staff from nonclinical areas would be expected to have a more favorable perception of the culture than staff from clinical areas, thus the results for %-positive and the means might be underestimated. Finally, the results presented in this study are based upon self-reported PSC, which might have created information, recall and social desirability bias. Also, we did not check the accuracy of the findings against other assessments of PSC (eg, observations or interview). This might have consequences for the dimensional %-positive and the mean scale scores, but not for the comparative results as the same conditions apply across groups.
Relating the results to findings in the literature
We found that job satisfaction was rated most favorable in the Faroe Islands, and better than in Denmark, Australia, and the US,11,29,30 but not as good as in Taiwan.31 The quality of the top management was perceived least favorable, which is in line with some international findings,11,29,30 but not with others.31 Findings regarding the quality of the top management compared well to Danish and Australian findings.11,30
Previous studies have suggested a minimum threshold scale score of 60% for good PSC, and a goal zone of 80%–100%;6,29,32,33 the 60% threshold was only exceeded for teamwork climate and job satisfaction in the NHFI, but the goal zone was not reached. This indicates that awareness of the concept of patient safety as defined by the dimensions of the SAQ is still in early days in the Faroe Islands, and improvement initiatives recommended. Executive walk-arounds have proven effective in improving the safety culture,32 and they are planned for implementation in the Trygd and Dygd program.
We found variability in the degree to which the staff perceived the culture positive (mean scale score) across units for all dimensions. This has also been found in other Nordic studies,11,16 and emphasizes that PSC is a local phenomenon, which should be measured and acted upon locally.34
For safety climate, we found a large-scale variation in the proportions of staff with positive attitudes across the units of the NHFI, such great variation from 0 to 100 has, to our knowledge, not been identified in other studies. The safety climate of the NHFI was significantly poorer than in Denmark, where 45.4% perceived the safety climate positive.11 We attribute the difference between the Faroese and the Danish safety climate to the fact that items in the safety climate dimension reflect: how adverse events are handled, openness about errors, concern about patient safety, and learning. In Denmark, reporting and analysis of adverse events has been mandatory by law since 2004 in hospitals, and it is a leadership task to facilitate patient safety initiatives.35 With the PSC survey in the NHFI, the Trygd and Dygd initiative was launched. The initiative aims to address patient safety actively by creating awareness of risk, harm, and ways to prevent adverse events and improve the safety for the patients. Working systematically with patient safety was put on the agenda of the clinical leaders of the NHFI for the first time after the PSC survey in 2013. Seen in this light, the quality of the safety climate is acceptable, and the variation in the quality of the safety climate across units might be attributable to different levels of awareness, knowledge, and skills among the clinical leaders and frontline staff at the unit level, also external influence through specific individual staff members from Denmark, Norway, and Iceland cannot be ruled out. Results from two cross-national studies of PSC data showed equivalent differences between countries with regard to the aspects covered by safety climate, emphasizing that this is a dimension sensitive to the local context factors.36,37
Working conditions was also rated significantly poorer in the NHFI than in Denmark, where 62% of the staff perceived working conditions in relation to patient safety.11 The %-positive from the NHFI does not meet the suggested 60% threshold for good working conditions in relation to patient safety. Thus, adequacy of staff training, supervision, and access to information should be investigated further in the NHFI.
We found differences in the quality of the culture across the five medical centers. The diagnostic center had the highest %-positive and the highest mean scale scores of all centers for the three management dimensions. The management dimension reflects the clinical leader’s support, communication, and actions in regard to the safety of the patients. The diagnostic center represents the X-ray unit and the laboratory, where certain work procedures are controlled by external bodies to ensure the quality of delivered services. Both units have strong leadership engagement in QM, and staff has worked systematically with quality and safety for more than 20 years. This might explain the findings. Our findings are supported by previous findings from the US indicating that nonclinical areas have a better safety culture than clinical areas with more intrinsically hazardous environment.18
In line with previous studies, the clinical leaders perceived the quality of the culture more positive than the frontline staff,38 this was most evident for teamwork and safety climate, and working conditions. Across the three management levels we found the quality of the top management poorest and the quality of the unit level management most favorable. This pattern is in accordance with previous findings and deemed satisfactory.11,29
Conclusion
The survey results give a snapshot of PSC in a modern western hospital prior to implementation of any QM initiatives. Quality of the management climate was identified as the weakest area of the PSC, and safety climate was the dimension with the greatest variability across units. This gives an anchor point and a direction for improvement; the hospital leaders are recommended to raise awareness of their role in supporting a safe and caring environment for patients and staff, moreover the leaders should ensure that as much as possible goes right, in the sense that everyday work achieves its objectives: keeping the patients safe, and that effective QM methods for improving the safety culture are implemented.
Assessment of the PSC after the implementation of the Trygd and Dygd program and the accreditation process of the NHFI is planned and improvements anticipated, especially with regard to the safety climate.
Acknowledgments
The authors would like to acknowledge the staff at the National Hospital at the Faroe Island for their effort, participation, and support. TrygFonden is acknowledged for substantial financial support.
Disclosure
The authors report no conflicts of interest in this work.
References
Steel N, Bachmann M, Maisey S, et al. Self reported receipt of care consistent with 32 quality indicators: national population survey of adults aged 50 or more in England. BMJ. 2008;337:a957. | |
Hines S, Joshi MS. Variation in quality of care within health systems. Jt Comm J Qual Patient Saf. 2008;34:326–332. | |
OECD. Health at a Glance: Europe 2014. Paris, OECD Publishing; 2014: 7–143. Available from: http://dx.doi.org/10.1787/health_glance_eur-2014-en. Accessed March 8, 2016. | |
Van Den Bos J, Rustagi K, Gray T, Halford M, Ziemkiewicz E, Shreve J. The $17.1 billion problem: the annual cost of measurable medical errors. Health Aff (Millwood). 2011;30:596–603. | |
Ostroff C, Kinicki AJ, Muhammad RS. Organizational culture and climate. In: Weiner I, editor. Handbook of Psychology. 2nd ed. New York: John Wiley and Sons; 2013;643–676. | |
Pronovost P, Sexton B. Assessing safety culture: guidelines and recommendations. Qual Saf Health Care. 2005;14:231–233. | |
Nationellt ramverk för patientsäkerhet för patientsäkerhet. 2011. Stockholm, Ministry of Health and Social Affairs, Sveriges Kommuner och Landsting. Available from: http://webbutik.skl.se/bilder/artiklar/pdf/5382.pdf. Accessed October 15, 2015. | |
Pasientsikkerhetsprogrammet, I trygge hender 24–7, Strategi 2014–2018; 2015. Available from: http://www.pasientsikkerhetsprogrammet.no/no/I+trygge+hender/L%C3%A6r+om+programmet/_attachment/2990?_ts=148d5149950. Accessed September 4, 2015. | |
Vlayen A, Helling J, Barrado LG, et al. Evolution of patient safety culture in Belgian acute, psychiatric and long-term care hospitals. Safety Health. 2015;1(2). | |
Kristensen S, Mainz J, Bartels P. Patient Safety. A Vocabulary for European Application. Aarhus: Sun-Tryk Aarhus University; 2007:1–15. Available from: http://www.hope.be/03activities/docsactivities/SIMPATIE_Patient_safety_vocabulary_Professionals.pdf. Accessed March 8, 2016. | |
Kristensen S, Sabroe S, Bartels P, Mainz J, Christensen KB. Adaption and validation of the Safety Attitude Questionnaire for the Danish hospital setting. Clin Epidemiol. 2015;7:149–160. | |
Sexton JB, Helmreich RL, Neilands TB, et al. The Safety Attitudes Questionnaire: psychometric properties, benchmarking data, and emerging research. BMC Health Serv Res. 2006;6:44. | |
Deilkas E. Patient safety culture – opportunities for health care management. The Safety Attitudes Questionnaire – short form 2006, Norwegian version – 1) Psychometric properties, 2) variation by organisational level and 3) by position. Health Services Research Unit, Akerhus University Hospital, Norway; 2010. | |
Singer SJ, Falwell A, Gaba DM, Baker LC. Patient safety climate in US hospitals: variation by management level. Med Care. 2008;46: 1149–1156. | |
Kristensen S, Badsberg JH, Rischel V, Anhoej J, Mainz J, Bartels P. The patient safety climate in Danish hospital units. Dan Med J. 2015;62:A5153. | |
Deilkas E, Hofoss D. Patient safety culture lives in departments and wards: multilevel partitioning of variance in patient safety culture. BMC Health Serv Res. 2010;10:85. | |
Gallego B, Westbrook MT, Dunn AG, Braithwaite J. Investigating patient safety culture across a health system: multilevel modelling of differences associated with service types and staff demographics. Int J Qual Health Care. 2012;24:311–320. | |
Singer SJ, Gaba DM, Falwell A, Lin S, Hayes J, Baker L. Patient safety climate in 92 US hospitals: differences by work area and discipline. Med Care. 2009;47:23–31. | |
Vlayen A, Schrooten W, Wami W, et al. Variability of patient safety culture in Belgian acute hospitals. J Patient Saf. 2013;11(2):110–121. | |
Organisation for Economic Cooperation and Development, OECD. OECD Reviews of Health Care Quality: Denmark 2013. Raising Standards. S.l. France: OECD; 2013. | |
Mainz J, Kristensen S, Bartels P. Quality improvement and accountability in the Danish health care system. Int J Qual Health Care. 2015;27(6):522–526. | |
Danish Society for Patient Safety. The Danish Patient Safety Program for Mental Health; 2015. Available from: http://www.sikkerpsykiatri.dk/english/. Accessed August 20, 2015. | |
Pett M, Lackey N, Sullivan J. Making Sense of Factor Analysis: The Use of Factor Analysis for Instrument Development in Health Care Research. Thousand Oaks: Sage Publications, Inc; 2003. | |
Scale Computation Instructions. [Homepage on the Internet.] The University of Texas at Houston – Memorial Hermann Center for Healthcare Quality and Safety; 2015. Available from: https://med.uth.edu/chqs/files/2012/05/SAQ-Short-Form-Scale-Items_000.pdf. Accessed October 15, 2015. | |
Sexton JB, Thomas EJ, Helmreich RL. [Serial online.] Scale Computation Instructions. University of Texas, Health Science Center at Huston; 2013. Available from: https://med uth edu/chqs/files/2012/05/Scale-Computation-Instructions.pdf. Accessed March 8, 2016. | |
Burstrm L, Letterstal A, Engstrom ML, Berglund A, Enlund M. The patient safety culture as perceived by staff at two different emergency departments before and after introducing a flow-oriented working model with team triage and lean principles: a repeated cross-sectional study. BMC Health Serv Res. 2014;14:296. | |
Devriendt E, Van den Heede K, Coussement J, et al. Content validity and internal consistency of the Dutch translation of the Safety Attitudes Questionnaire: an observational study. Int J Nurs Stud. 2012;49:327–337. | |
Kaya S, Barsbay S, Karabulut E. The Turkish version of the safety attitudes questionnaire: psychometric properties and baseline data. Qual Saf Health Care. 2010;19:572–577. | |
Paine LA, Rosenstein BJ, Sexton JB, Kent P, Holzmueller CG, Pronovost PJ. Republished paper: assessing and improving safety culture throughout an academic medical centre: a prospective cohort study. Postgrad Med J. 2011;87:428–435. | |
Chaboyer W, Chamberlain D, Hewson-Conroy K, et al. CNE article: safety culture in Australian intensive care units: Establishing a baseline for quality improvement. Am J Crit Care. 2013;22:93–102. | |
Lee WC, Wung HY, Liao HH, et al. Hospital safety culture in Taiwan: a nationwide survey using Chinese version Safety Attitude Questionnaire. BMC Health Serv Res. 2010;10:234. | |
Frankel A, Grillo SP, Pittman M, et al. Revealing and resolving patient safety defects: the impact of leadership WalkRounds on frontline caregiver assessments of patient safety. Health Serv Res. 2008;43:2050–2066. | |
Hudson D, Sexton JB, Thomas EJ, Berenholtz S. A safety culture primer for the critical care clinician – the role of culture in patient safety and quality improvement. Contemp Crit Care. 2009;7:1–13. | |
Campbell EG, Singer S, Kitch BT, Iezzoni LI, Meyer GS. Patient safety climate in hospitals: act locally on variation across units. Jt Comm J Qual Patient Saf. 2010;36:319–326. | |
Act on Patient Safety in the Danish Health Care System. 2011. [English translation web document]. Available from: http://arkiv.patientsikkerhed.dk/media/566771/act_on_patient_safety.pdf. Accessed March 8, 2016. | |
Wagner C, Smits M, Sorra J, Huang CC. Assessing patient safety culture in hospitals across countries. Int J Qual Health Care. 2013;25:213–221. | |
Fujita S, Seto K, Ito S, Wu Y, Huang CC, Hasegawa T. The characteristics of patient safety culture in Japan, Taiwan and the United States. BMC Health Serv Res. 2013;13:20. | |
Kristensen S, Hammer A, Bartels P, et al. Quality management and perceptions of teamwork and safety climate in European hospitals. Int J Qual Health Care. 2015;27:498–505. |
 © 2016 The Author(s). This work is published and licensed by Dove Medical Press Limited. The full terms of this license are available at https://www.dovepress.com/terms.php and incorporate the Creative Commons Attribution - Non Commercial (unported, v3.0) License.
By accessing the work you hereby accept the Terms. Non-commercial uses of the work are permitted without any further permission from Dove Medical Press Limited, provided the work is properly attributed. For permission for commercial use of this work, please see paragraphs 4.2 and 5 of our Terms.
© 2016 The Author(s). This work is published and licensed by Dove Medical Press Limited. The full terms of this license are available at https://www.dovepress.com/terms.php and incorporate the Creative Commons Attribution - Non Commercial (unported, v3.0) License.
By accessing the work you hereby accept the Terms. Non-commercial uses of the work are permitted without any further permission from Dove Medical Press Limited, provided the work is properly attributed. For permission for commercial use of this work, please see paragraphs 4.2 and 5 of our Terms.