")
Back to Journals » Neuropsychiatric Disease and Treatment » Volume 17
The Value of Susceptibility-Weighted Imaging (SWI) in Evaluating the Ischemic Penumbra of Patients with Acute Cerebral Ischemic Stroke
Authors Wang YR, Li ZS, Huang W, Yang HQ, Gao B, Chen YT
Received 24 February 2021
Accepted for publication 6 May 2021
Published 3 June 2021 Volume 2021:17 Pages 1745—1750
DOI https://doi.org/10.2147/NDT.S301870
Checked for plagiarism Yes
Review by Single anonymous peer review
Peer reviewer comments 2
Editor who approved publication: Dr Yuping Ning
Yong-Ren Wang, Zhao-Sheng Li, Wei Huang, Hui-Qiang Yang, Bo Gao, Yu-Ting Chen
Department of Radiology, Chinese Medical Hospital of Yiwu, Yiwu, 322000, People’s Republic of China
Correspondence: Yong-Ren Wang
Department of Radiology, Chinese Medical Hospital of Yiwu, No. 266 Xuefeng West Road, Yiwu, 322000, People’s Republic of China
Tel +86 579 85439171
Fax +86 579 85527330
Email [email protected]
Background: The aim of this study was to discuss the value of susceptibility-weighted imaging (SWI) in evaluating the ischemic penumbra of patients with acute cerebral ischemic stroke.
Methods: Data were collected from 52 patients with acute cerebral ischemic stroke upon clinical diagnosis and routine examinations of magnetic resonance imaging (MRI), including SWI, diffusion-weighted imaging (DWI), and perfusion-weighted imaging (PWI) within 72 hours after onset in this retrospective study. The methods also included fusing the DWI and SWI images and calculating the volume of anomaly extension of DWI and PWI-MTT (mean transit time) using semi-automatic analysis software. The SWI-DWI and PWI-DWI mismatches were interpreted, and the statistical analysis was completed.
Results: The two physicians found that the ischemic penumbra consistency is high throughout the SWI-DWI and PWI-DWI mismatches, without a significant difference (P > 0.05).
Conclusion: SWI-DWI mismatch can prevent the injection of contrast agents and make an accurate diagnosis of acute stroke ischemic penumbra, which helps guide the selection of the clinical therapeutic plan.
Keywords: ischemic penumbra, diffusion-weighted imaging, susceptibility-weighted imaging, perfusion-weighted imaging
Background
At present, the main target in treating acute cerebral ischemic stroke is the ischemic penumbra, which diminishes cerebral blood flow. However, this reduction is not enough to cause irreversible damage to the brain cells in the affected region.1,2 The existence of penumbra means that proper early treatment can save the damaged brain cells, thus improving the prognosis of patients with cerebral ischemic stroke.3,4 However, after cerebral ischemic stroke, the range of the core infarction area will gradually increase with time, and the range of the penumbra will decrease. Therefore, early identification and salvage of the penumbra are critical steps in the clinical treatment of patients with cerebral ischemic stroke.
Among patients with acute cerebral ischemic stroke, the significant reduction in cerebral perfusion pressure is due to the increased proportion5,6 of deoxyhemoglobin and oxyhemoglobin caused by the increased oxygen extraction fraction. The susceptibility-weighted imaging (SWI) is a high-resolution T2*MRI technology with a three-dimensional gradient-echo and increases the paramagnetic material sensitivity. The metabolic changes7–9 in hypoperfusion brain tissue can be studied with the action upon paramagnetic material sensitivity without radionuclides and contrast medium. Therefore, we discuss the value of SWI in forecasting the ischemic penumbra of patients with acute cerebral ischemic stroke with perfusion-weighted imaging (PWI) as the “gold standard.”
Methods
General Data
Fifty-two patients who received treatment at the stroke department of our hospital from January 2015 to December 2017 and were diagnosed with cerebral infarction were enrolled in this retrospective study; all suffered from a lesion in the blood supply region of the middle cerebral artery. There were 23 males and 19 females. Their ages ranged from 35 to 86, with a median age of 66 and an average age of 64.2. All patients suffered from different degrees of inadequate limb movement, and some experienced a speech disorder.
Inclusion Criteria
1) The cerebral ischemic stroke occurred within three days, the new infarction (not lacunar infarction) was found through DWI, and the focus was distributed in the blood supply region of the middle cerebral artery. 2) No history of stroke and no baseline neurologic deficits. 3) Every patient had all the MRI examinations, including routine MRI plain scans, DWI, SWI, and PWI. 4) The patient did not have thrombolysis, anticoagulant, or thrombectomy treatment before the MRI examination.
Exclusion Criteria
1) Patients with cerebral hemorrhage, cancer, or trauma diagnosed by craniocerebral computerized tomography (CT). 2) Patients with severe cardiovascular and hepatorenal insufficiency or hemorrhagic lesions. 3) Patients with allergies, pregnant women, or psychological and/or neurological diseases, such as infantile autism.
Examination Method
The MRI examination uses the German Siemens 1.5T MRI for scanning, with a 6-channel magnetic resonance imaging coil. The scanning sequence includes the routine T1WI (TR/TE: 450/10), T2WI (TR/TE: 4150/96), FLAIR (TR/TE: 8000/84), DWI (3200/91), SWI (TR/TE: 49/40), and PWI (1500/30). The PWI scanning uses the contrast agent gadolinium acid amine (Gd-GTPA). It uses a high-pressure injector for bolus, with an injected dose of 0.2 mmol/Kg and an injection rate of 5 mL/s. The MRI image post-processing is carried out at the Syngo MR Workplace workstation.
Image Post-Processing
Brain Magnetic Resonance Perfusion-Weighted Imaging
The original images (1000 images) of the perfusion scanning are imported into perfusion software in the Syngo MR Workplace workstation, the perfusion curve is acquired with the contralateral middle cerebral artery as the reference artery, and the PWI functional diagram is calculated, including time to peak (TTP), mean transit time (MTT), relative cerebral blood flow (rCBF), and relative cerebral blood volume (rCBV).
Image Fusion
Because the thickness of the SWI image is very thin, to obtain the complete shape of the venous vessels, only minimum intensity projection (MIP)–SWI images were used. Therefore, DWI and MIP-SWI images of the patients were imported into the fusion software of the Syngo MR workplace workstation to obtain fusion images.
Image Analysis
1) Perfusion-diffusion mismatch (PDM) judgment method: in the post-processing workstation, the semi-automatic software is used to calculate the area of the anomaly of DWI and PWI (MTT) of each layer, and then the volume of the anomaly is calculated according to the layer thickness and interlayer spacing. If the ratio of the volume of the ischemia region in PWI (MTT) with the ischemia volume in DWI is more than 120%, it is defined as the existence of PDM; if the ratio is less than 120%, it is defined as the inexistence of PDM.10 In the post-processing workstation, the diffusion-limited areas of DWI and perfusion abnormal areas of MTT were manually drawn. The abnormal areas of DWI and PWI (MTT) in each layer were calculated using semi-automatic software. According to the formula [Infarct volume = sum of diffusion-limited areas of DWI on all layers × (layer thickness + layer spacing)], the volume of core infarct area was calculated,11 and the volume of abnormal perfusion area on MTT was also obtained. Susceptibility-diffusion mismatch (SDM) judgment method: the two physicians (performing imaging diagnoses for more than 10 years) observed the fusion image. When the medullary vein or cortical vein around the diffusion-limited area in the fusion image is larger and thickened compared with the contralateral, it is defined as the existence of SDM.
Statistical Analysis
SPSS 19.0 statistical software was used for analysis. With PDM as the control group, a chi-square test is carried out to compare whether the SDM found by the two physicians was consistent with the ischemic penumbra compared with the PDM evaluation. P < 0.05 was considered statistically significant.
Results
Among the 52 patients, 33 patients had PDM (63.46%). Physician A believed that 32 patients had SDM, accounting for 61.54%, while physician B believed that 30 patients had SDM, accounting for 57.69%. The evaluation results of the two physicians have no significant difference and were more consistent (χ2 = 0.160, P = 0.689). The two physicians concluded that the consistency of SDM and PDM in evaluating the ischemic penumbra is better and has no significant difference (χ2 = 0.033, P = 0.855) (Figures 1–3).
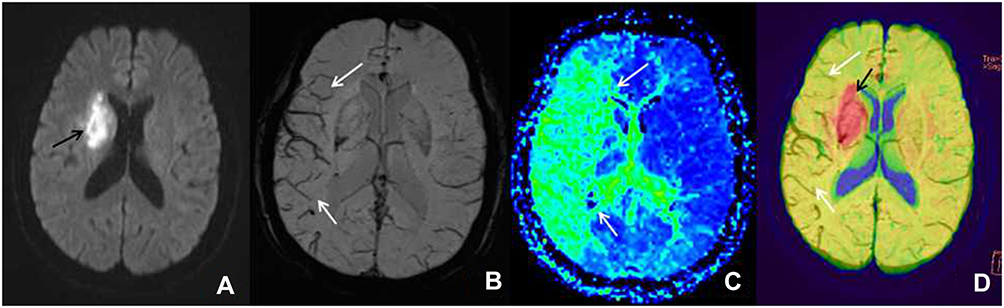 |
Figure 1 Male patient, 72 years old, left limb dyskinesia for seven hours, getting a magnetic resonance imaging examination. (A) The diffusion-weighted imaging shows the diffusion-limited focus (black arrow) in the left blood supply region of the middle cerebral artery. (B) The minimum intensity projection-susceptibility-weighted imaging (layer thickness: 16 mm, layer spacing: 20 mm, DFOV: 20.13×23.00 mm) shows that the cortical vein of the right blood supply region of the middle cerebral artery is larger and thickened (white arrow) compared with the contralateral. (C) The perfusion-weighted imaging examination shows a large perfusion anomaly area in the right blood supply region of the middle cerebral artery, which is demonstrated as mean transit time extension (white arrow). (D) In the diffusion-weighted imaging–susceptibility-weighted imaging fusion image, the red area (black arrow) is the core infarction area, and there are many thickened and increased veins (white arrow), which indicates the existence of ischemic penumbra; it is consistent with the area of penumbra displayed by the perfusion-weighted imaging (mean transit time). |
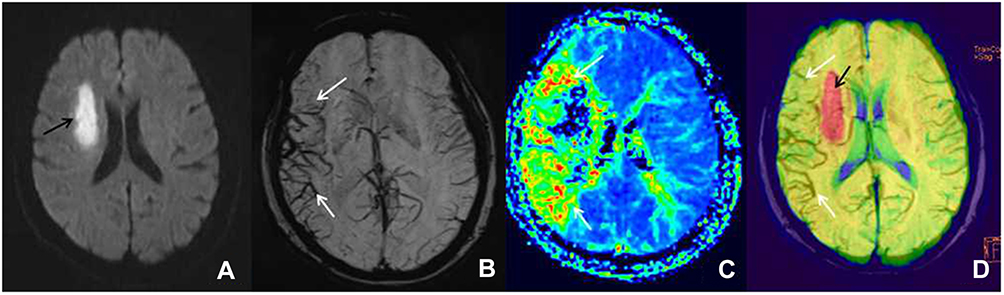 |
Figure 2 Female patient, 66 years old, left limb dyskinesia for one day, getting a magnetic resonance imaging examination. (A) The diffusion-weighted imaging shows the diffusion-limited focus (black arrow) in the left blood supply region of the middle cerebral artery. (B) The minimum intensity projection-susceptibility-weighted imaging (layer thickness: 16 mm, layer spacing: 20 mm, DFOV: 20.13×23.00 mm) displays that the cortical vein and medullary vein of the right blood supply region of the middle cerebral artery is larger and thickened (white arrow) compared with the contralateral. (C) The perfusion-weighted imaging examination shows a large perfusion anomaly area in the right blood supply region of the middle cerebral artery, which is expressed as mean transit time extension (white arrow). Furthermore, its core infarction area is demonstrated as the disappearance of mean transit time. (D) In the diffusion-weighted imaging–susceptibility-weighted imaging fusion image, the red area (black arrow) is the core infarction area, and there are many thickened and increased veins (white arrow), which indicates the existence of ischemic penumbra; it is consistent with the area of penumbra displayed by the perfusion-weighted imaging (mean transit time). |
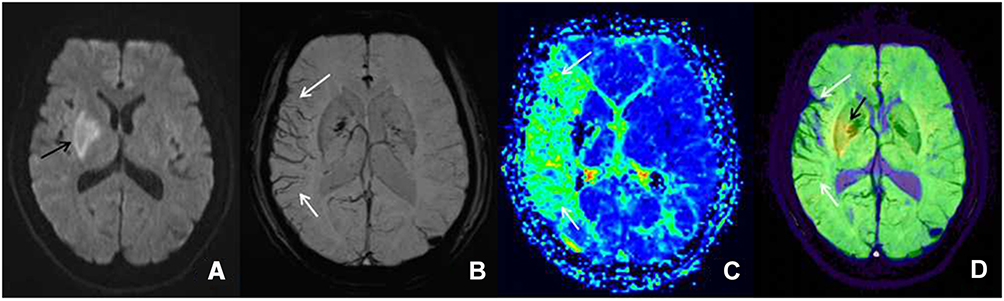 |
Figure 3 Female patient, 61 years old, left limb dyskinesia for two days, getting a magnetic resonance imaging examination. (A) The diffusion-weighted imaging shows the diffusion-limited focus (black arrow) in the left blood supply region of the middle cerebral artery. (B) The minimum intensity projection-susceptibility-weighted imaging (layer thickness: 16 mm, layer spacing: 20 mm, DFOV: 20.13×23.00 mm) shows that the cortical vein and medullary vein of the right blood supply region of the middle cerebral artery is large and thickened (white arrow) compared with the contralateral. (C) The perfusion-weighted imaging examination displays a large perfusion anomaly area in the right blood supply region of the middle cerebral artery, which is expressed as mean transit time extension (white arrow). Furthermore, its core infarction area is demonstrated as the disappearance of mean transit time. (D) In the diffusion-weighted imaging–susceptibility-weighted imaging fusion image, the yellow area (black arrow) is the core infarction area, and there are many thickened and increased veins (white arrow), which indicates the existence of ischemic penumbra; it is consistent with the area of penumbra displayed by the perfusion-weighted imaging (mean transit time). |
Discussion
In the previous research, the high sensitivity of early detection by DWI for acute cerebral ischemic stroke has been proven and can be completed earlier than the abnormal focus display of the T1WI and T2WI methods. The DWI-PWI mismatch can identify the ischemic region with infarction risk, namely, ischemic penumbra. The DWI diffusion-limited area is considered as the irreversible core infarction area, while the DWI-PWI mismatch area is regarded as the ischemic penumbra.11 However, since PWI examination requires contrast medium and long-time post-processing, it is restricted, to a certain extent, in its clinical application. Therefore, a non-invasive, fast, simple, practical, and reliable imaging technique without a contrast medium is necessary.
The SWI is a high-resolution MRI imaging technique with a three-dimensional gradient-echo sequence, and it is extremely sensitive to the magnetic susceptibility difference. The SWI carries out the imaging through the magnetic susceptibility difference caused by the inhomogeneous local magnetic fields due to the magnetic susceptibility difference of various tissues. It can remove the inhomogeneous ambient fields generated by air-tissue planes and the main field effectively through the imaging phase information and special high pass filter, thus, obtaining practical information about the magnetic susceptibility difference of various tissues and forming a unique contrast. The SWI is considered to be a non-invasive MR blood oxygenation level-dependent sequence imaging. It can be used to evaluate the penumbra of patients with acute cerebral stroke. The magnetic susceptibility differences between deoxyhemoglobin and oxyhemoglobin provide a powerful endogenous MR contrast, and such contrasts depend on the blood oxygenation level.12 In the venae cerebri, the magnetic susceptibility difference between deoxyhemoglobin and oxyhemoglobin will cause a phase difference in deoxygenated blood and surrounding tissue, thus reducing the signal strength of the venous system in the SWI. The offending artery becomes narrowed or blocked among patients with ischemic cerebral stroke, and many collateral circulations are formed. During an acute ischemic cerebral stroke, the ischemic brain tissue with infarction risk around the core infarction area is under the lower perfusion state, the blood flow velocity is low, and the tissue oxygen extraction fraction (OEF) will increase, thus, causing an increased proportion of deoxyhemoglobin with oxyhemoglobin in the blood. It is displayed in the MTT extension in PWI and increased and thickened venous distention is found in an SWI examination. The increase in the proportion of deoxyhemoglobin with oxyhemoglobin in the blood will cause the magnetic susceptibility difference among tissues. Such differences can be detected very sensitively through an SWI examination. The SWI provides similarly important metabolic information to MTT and OEF, so the penumbra can be demarcated without using a contrast medium and reducing the risk of using contrast medium for people with kidney damage and gadolinium allergies.7,13–16 In addition, SWI is superior to MRA and CT in detecting thrombus in acute posterior cerebral artery infarction.17 Studies have shown that SWI also plays an important role in predicting the outcome and prognosis in patients with acute stroke.18,19
Our research evaluated the DWI, SWI, and PWI of 52 patients with cerebral ischemic stroke. We found that 32 patients have DWI-SWI mismatches. The difference is between the small range of DWI cytotoxicity levels and the large range of SWI low signal veins. By contrasting the DWI-SWI mismatch with the DWI-PWI mismatch in evaluating the ischemic penumbra, we found that a DWI-SWI mismatch has a similar ability as a DWI-PWI to detect the ischemic penumbra, which indicates that SWI can be used to forecast the ischemic penumbra of patients with acute ischemic cerebral stroke. It is consistent with the research of Kao et al20 and Luo et al.21,22 The SWI presents evidence that the patient with acute ischemic cerebral stroke has larger and thickened veins, reflecting the increased proportion of deoxyhemoglobin and oxyhemoglobin caused by an increase in OEF and hypoperfusion. Our research found increased and thickened venous shadows in the SWI sequence of the hypoperfusion area compared with the contralateral. It is reported that a vein with the SWI protrusion is related to the cerebral ischemia area with PWI-MTT extension. The MTT is very sensitive to measuring the ischemia state of brain tissue, and it has been used to define the ischemia scope. Several research types have also proven that the increase in OEF is related to the extension of MTT.23–25 Since the SWI is sensitive to the change of OEF of deoxyhemoglobin, SWI can provide a similar metabolic capability to MTT. This can also explain our research. Furthermore, an SWI-DWI mismatch and a DWI-PWI (MTT) mismatch have similar abilities.
There were some limitations in our study. First, we did not research the value of SWI in showing the acute thrombosis in the offending artery of patients with acute ischemic cerebral stroke, and our study also replicated previous studies. Second, we did not research the value of SWI in evaluating the thrombolytic therapy of patients with acute ischemic cerebral stroke. Third, the conclusions of this study were limited due to being a retrospective study, having a small sample size, single-center, non-automated SWI measurements, and missing Tmax data. Therefore, we need to carry out further research that is progressive, contains a large sample, and is multi-centered when evaluating the value of SWI sequence in an acute cerebral ischemic stroke.
Conclusion
In conclusion, SWI is a non-invasive, fast, simple, practical, and reliable imaging technique without a contrast medium. SWI may be used to evaluate the existence of penumbra in patients if PWI is not possible due to a similar ability to PWI.
Abbreviations
PWI, perfusion-weighted imaging; PDM, perfusion-diffusion mismatch; DWI, diffusion-weighted imaging; SWI, susceptibility-weighted imaging; MTT, mean transit time; Gd-GTPA, gadolinium acid amine.
Ethics Approval and Consent to Participate
This study was conducted in accordance with the declaration of Helsinki. This study was conducted with approval from the Ethics Committee of Chinese Medical Hospital of Yiwu. Written informed consent was obtained from the participants.
Consent to Publish
Obtained from the participants.
Disclosure
All authors declare that they have no competing interests.
References
1. Astrup J, Siesjö BK, Symon L. Thresholds in cerebral ischemia the ischemic penumbra. Stroke. 1981;12(6):723–725. doi:10.1161/01.STR.12.6.723
2. Donnan GA, Baron JC, Davis SM, Sharp FR. The ischemic penumbra: overview,definition, and criteria. In: Donnan GA, Davis SM, Sharp FR, editors. The Ischaemic Penumbra: Pathophysiology,Imaging and Therapy. New York: Informa Healthcare; 2007:149–164.
3. Guadagno JV, Calautti C, Baron JC. Progress in imaging stroke: emerging clinical applications. Br Med Bull. 2003;65(1):145–157. doi:10.1093/bmb/65.1.145
4. Murphy BD, Fox AJ, Lee DH, et al. Identification of penumbra and infarct in acute ischemic stroke using computed tomography perfusion-derived blood flow and blood volumemeasurements. Stroke. 2006;37(7):1771–1777. doi:10.1161/01.STR.0000227243.96808.53
5. Derdeyn CP, Yundt KD, Videen TO, Carpenter DA, Grubb RL
6. Grubb RL
7. Haacke EM, Mittal S, Wu Z, Neelavalli J, Cheng YC. Susceptibility-weighted imaging: technical aspects and clinical applications, part 1. AJNR Am J Neuroradiol. 2009;30(1):19–30. doi:10.3174/ajnr.A1400
8. Cho ZH, Ro YM, Lim TH. NMR venography using the susceptibility effect produced by deoxyhemoglobin. Magn Reson Med. 1992;28(1):25–38. doi:10.1002/mrm.1910280104
9. Tsui YK, Tsai FY, Hasso AN, Greensite F, Nguyen BV. Susceptibility-weighted imaging for differential diagnosis of cerebral vascular pathology: a pictorial review. J Neurol Sci. 2009;287(1–2):7–16. doi:10.1016/j.jns.2009.08.064
10. Albers GW, Thijs VN, Wechsler L, et al.; DEFUSE Investigators. Magnetic resonance imaging profiles predict clinical response to early reperfusion: the Diffusion and Perfusion Imaging Evaluation for Understanding Stroke Evolution (DEFUSE) Study. Ann Neurol. 2006;60(5):508–517. doi:10.1002/ana.20976
11. Huisman TA. Diffusion-weighted imaging: basic concepts and application in cerebral stroke and head trauma. Eur Radiol. 2003;13(10):2283–2297. doi:10.1007/s00330-003-1843-6
12. An H, Ford AL, Vo KD, et al. Imaging oxygen metabolism in acute stroke using MRI. Curr Radiol Rep. 2014;2(3):39. doi:10.1007/s40134-013-0039-3
13. Dejobert M, Cazals X, Annan M, Debiais S, Lauvin MA, Cottier JP. Susceptibility–diffusion mismatch in hyperacute stroke: correlation with perfusion–diffusion mismatch and clinical outcome. J Stroke Cerebrovasc Dis. 2016;25(7):1760–1766. doi:10.1016/j.jstrokecerebrovasdis.2016.02.025
14. Lou M, Chen Z, Wan J, et al. Susceptibility-diffusion mismatch predicts thrombolytic outcomes: a Retrospective Cohort Study. AJNR Am J Neuroradiol. 2014;35(11):2061–2067. doi:10.3174/ajnr.A4017
15. Tong KA, Ashwal S, Obenaus A, Nickerson JP, Kido D, Haacke EM. Susceptibility-weighted MR imaging: a review of clinical applications in children. AJNR Am J Neuroradiol. 2008;29(1):9–17. doi:10.3174/ajnr.A0786
16. Horie N, Morikawa M, Nozaki A, Hayashi K, Suyama K, Nagata I. “Brush sign” on susceptibility-weighted MR imaging indicates the severity of moyamoya disease. AJNR Am J Neuroradiol. 2011;32(9):1697–1702. doi:10.3174/ajnr.A2568
17. Park MG, Yoon CH, Baik SK, Park KP. Susceptibility vessel sign for intra-arterial thrombus in acute posterior cerebral artery infarction. J Stroke Cerebrovasc Dis. 2015;24(6):1229–1234. doi:10.1016/j.jstrokecerebrovasdis.2015.01.021
18. Chen CY, Chen CI, Tsai FY, Tsai PH, Chan WP. Prominent vessel sign on susceptibility-weighted imaging in acute stroke: prediction of infarct growth and clinical outcome. PLoS One. 2015;10(6):e0131118. doi:10.1371/journal.pone.0131118
19. Mundiyanapurath S, Mohlenbruch M, Ringleb PA, et al. Posterior circulation acute stroke prognosis early computed tomography score using hypointense vessels on susceptibility weighted imaging independently predicts outcome in patients with basilar artery occlusion. PLoS One. 2015;10(7):e0132587. doi:10.1371/journal.pone.0132587
20. Kao HW, Tsai FY, Hasso AN. Predicting stroke evolution: comparison of susceptibility-weighted MR imaging with MR perfusion. Eur Radiol. 2012;22(7):1397–1403. doi:10.1007/s00330-012-2387-4
21. Luo S, Yang L, Wang L. Comparison of susceptibility-weighted and perfusion-weighted magnetic resonance imaging in the detection of penumbra in acute ischemic stroke. J Neuroradiol. 2015;42(5):255–260. doi:10.1016/j.neurad.2014.07.002
22. Luo S, Yang L, Luo Y, Luo Y. Susceptibility-weighted imaging predicts infarct size and early-stage clinical prognosis in acute ischemic stroke. Neurol Sci. 2018;39(6):1049–1055. doi:10.1007/s10072-018-3324-3
23. Ueda T, Yuh WT, Maley JE, Quets JP, Hahn PY, Magnotta VA. Outcome of acute ischemic lesions evaluated by diffusion and perfusion MR imaging. AJNR Am J Neuroradiol. 1999;20(6):983–989.
24. Yata K, Suzuki A, Hatazawa J, et al. Relationship between cerebral circulatory reserve and oxygen extraction fraction in patients with major cerebral artery occlusive disease: a Positron Emission Tomography Study. Stroke. 2006;37(2):534–536. doi:10.1161/01.STR.0000199085.40000.cf
25. Kamath A, Smith WS, Powers WJ, et al. Perfusion CT compared to H2 15O/O15O PET in patients with chronic cervical carotid artery occlusion. Neuroradiology. 2008;50(9):745–751. doi:10.1007/s00234-008-0403-9
 © 2021 The Author(s). This work is published and licensed by Dove Medical Press Limited. The full terms of this license are available at https://www.dovepress.com/terms.php and incorporate the Creative Commons Attribution - Non Commercial (unported, v3.0) License.
By accessing the work you hereby accept the Terms. Non-commercial uses of the work are permitted without any further permission from Dove Medical Press Limited, provided the work is properly attributed. For permission for commercial use of this work, please see paragraphs 4.2 and 5 of our Terms.
© 2021 The Author(s). This work is published and licensed by Dove Medical Press Limited. The full terms of this license are available at https://www.dovepress.com/terms.php and incorporate the Creative Commons Attribution - Non Commercial (unported, v3.0) License.
By accessing the work you hereby accept the Terms. Non-commercial uses of the work are permitted without any further permission from Dove Medical Press Limited, provided the work is properly attributed. For permission for commercial use of this work, please see paragraphs 4.2 and 5 of our Terms.