")
Back to Journals » International Journal of General Medicine » Volume 15
The Value of RANSON Score Combined with BMI in Predicting the Mortality in Severe Acute Pancreatitis: A Retrospective Study
Authors Yin X, Zhong Z, Li J, Le M, Shan S, Zhu C
Received 18 January 2022
Accepted for publication 19 April 2022
Published 17 May 2022 Volume 2022:15 Pages 5015—5025
DOI https://doi.org/10.2147/IJGM.S356626
Checked for plagiarism Yes
Review by Single anonymous peer review
Peer reviewer comments 4
Editor who approved publication: Dr Scott Fraser
Xu Yin,1 Xiang Zhong,2 Jun Li,1 Ma Le,1 Shiting Shan,1 Chunfu Zhu1
1Department of Hepatobiliary and Pancreatic Surgery, Changzhou No.2 People’s Hospital Affiliated with Nanjing Medical University, Changzhou, Jiangsu, 213000, People’s Republic of China; 2Department of Hepatobiliary and Pancreatic Surgery, Affiliated Hospital of Nantong University, Nantong, Jiangsu, 226000, People’s Republic of China
Correspondence: Chunfu Zhu, Email [email protected]
Objective: To explore the value of modified RANSON score in predicting mortality from severe acute pancreatitis (SAP).
Methods: In this retrospective study, 461 SAP patients hospitalized from January 2016 to January 2020 were enrolled. AP (acute pancreatitis) patients from our hospital were employed as the training set. In addition, AP patients from the affiliated hospital of Nantong University were set as the validation set. The clinical characteristics of patients were compared between the two sets. The independent risk factors for SAP were determined through logistic regression. Moreover, the risk factors were derived for various prediction models by logistic regression. Multiple methods were adopted to assess the predictive ability of various models.
Results: A total of 338 patients were assigned into the training set, while 123 patients were assigned into the validation set. The patients in the training and validation sets showed the consistent distribution trends (P> 0.05). In the training set, significant differences between patients in the non-survival and survival groups were BMI, PCT, platelets (PLT), direct bilirubin (DBil) and RANSON scores (P< 0.05). In further multivariate analysis, BMI, PCT and RANSON score were found as the independent risk factors for the mortality of SAP (OR=1.12, 1.25, 1.28, 95% CI:1.06– 1.19, 1.08– 1.44, 1.12– 1.47, P< 0.05). In the training set and validation set, ROC curve analysis showed that AUC of BMI+RANSON score was 0.778 and 0.789, respectively. In the calibration curve, the fitting degree of RANSON score+BMI and ideal assessment model was 0.975 and 0.854, respectively. The decision curve suggested that the net benefit per patient increased with the lengthening of the RANSON score+ BMI model curve. As revealed by the results of NRI and IDI indicators, RANSON score+BMI was optimized based on RANSON score (P< 0.05).
Conclusion: BMI+RANSON was confirmed as a modified model effective in predicting the mortality from SAP.
Keywords: SAP, BMI, RANSON score, mortality, model
Introduction
AP is characterized by acute onset and rapid changes. AP patients account for 80%, with the mortality being 1–2%.1 Twenty percent of AP patients can develop into SAP patients, while 10–20% of SAP patients die from septic shock arising from persistent organ failure and systemic inflammatory response syndrome (SIRS).2,3 The 2012 Atlanta Conference consensus suggests that the high mortality from SAP can fall into two phases, including the first week and the first month, in which the causes of death consist of SIRS and persistent organ failure. Accordingly, an early evaluation of AP can improve patient prognosis and reduce the mortality.4
Common stratification and prognostic models for AP include the Acute Physiology and Chronic Health Evaluation-II score (APACHE-II), the Computed Tomography Severity Index (CTSI) score, RANSON score and BISAP score, Glasgow scoring system (GCS). Single indicators include PCT, C-reactive protein (CRP), IL-1, IL-6, BMI, etc. Numerous single-center studies have found that the prediction probability of single indicators is equal to that of classical scores, whereas it is difficult to reach a unified prediction value. Moreover, there have been rare good solutions to the shortcomings of index measurement time point and index instability, and the predictive power of indicators continues to be controversial.5,6 Obesity is not a global problem when RANSON was first proposed, and RANSON was not included in BMI. Over the past few years, some studies have incorporated BMI into APACHE-II, thus increasing the predictive power of APACHE-II. For this reason, classical scores are not perfect, and there is still room for improvement. Since obesity-related diseases have become a global problem, incorporating BMI into RANSON may increase the predictive power of RANSON.7–9 In this study, the ability of single-indicator, multi-indicator, and modified models were explored to predict the mortality in SAP patients. Furthermore, the possibility of incorporating single indicators into classical scores was studied.
Materials and Methods
Data Source
In this retrospective study, the training set data were from Changzhou No. 2 People’s Hospital Affiliated with Nanjing Medical University. In total, 338 patients were enrolled, which consisted of 199 males and 139 females. To be specific, there were 285 survivors and 53 non-survivors, and they were aged 52-year on average (quartile value was 38–66.75 years), ranging from 18 to 93 years. The group of the validation set was from the affiliated Hospital of Nantong University, consisting of 123 patients (61 males and 62 females). Besides, there were 103 survivors and 20 non-survivors, with an average of 52-year-old age (quartile value 38–65.5 years), ranging from 22 to 91 years. The primary outcome variable was set as 28-day mortality. This study was conducted in accordance with the declaration of Helsinki. All patients or family members enrolled in this study had signed the informed consent.
Inclusion Criteria and Exclusion Criteria
Inclusion criteria were as follows: Meeting the diagnostic criteria for SAP (defined and criteria from the 2012 Atlanta Conference), including 1) typical abdominal pain features, 2) serum amylase ≥3 times the upper limit of normal, and 3) characteristics of AP presented on CT scan of the abdomen. The diagnosis of the severe acute pancreas was based on AP with a duration of organ failure of over 48 h.10 Exclusion criteria were as follows: 1) age <18; 2) discharge without treatment; 3) chronic pancreatitis and pancreatic tumors; 4) history of severe cardiopulmonary disease, liver disease, renal disease, or severe immune system disorders.
Evaluation Criteria
ISH International Guidelines for Hypertension (2020 edition)11 were referenced for the diagnostic criteria for hypertension, international Guidelines for diabetes Treatment (2020 edition)12 were followed as the diagnostic criteria for diabetes, and the improved Marshall scoring system was used as the diagnostic criteria for organ failure.13 Drinking history was defined as 100 grams of alcohol per day for over one year.14 The smoking history was defined as smoking one cigarette a day and smoking for 1 year.11 For RANSON score, five items collected at admission were involved. age >55 years, white blood cell count >16×109/L, serum LDH >350 U/L, serum AST >250 U/L, blood glucose >11.1 mmol/L and reduction in hematocrit >10%, increase in BUN > 5 mg/dl, serum calcium <8 mg/dl, arterial PO2 <60 mm Hg, base deficit >4 mmol/L, estimated fluid sequestration >6 L at 48 h after admission.15
Statistical Methods
The statistical description and hypothesis tests were performed using the statistical software SPSS25.0 (SPSS, Chicago, Illinois, USA), MedCalc 20.0 and R3.2.5. The data distribution was determined through the Shapiro–Wilk test, and the result suggested that they were all non-normal. Continuous and categorical variables are expressed as the median (interquartile range, IQR) and the frequency (percentage), respectively. The qualitative data were selected as rates or composition ratios (%) through the chi-square test. Moreover, the factors with single-factor screening P < 0.1 were included in the multivariate logistic regression model, and the risk factors were covered in the Binary logistic regression analysis to calculate the model probability. Model 1 (BMI+RANSON), Model 2 (PCT+RANSON), Model 3 (BMI+PCT), and model 4 (PCT+BMI+RANSON). The receiver operating characteristic (ROC) curve was generated to analyze and compare single indicators, sensitivity, specificity and area under the curve (AUC) of the optimized model. Decision analysis curve (DCA) is a method to assess the utility of a model by calculating net income at different thresholds. We used DCA to assess the clinical utility of the line graph prediction model. Calibration curves were drawn to assess the consistency between the optimized model and the ideal model. Net classification index and comprehensive discriminant improvement index were generated to assess the improvement degree of the optimized model on the original model. A bilateral P value lower than 0.05 achieved statistical significance.
Results
Comparison of Clinical Data Between the Training Set and the Validation Set
No significant difference was found in the admission characteristics of patients in the training set and validation set (P>0.05) except blood urea nitrogen (P<0.001), combined diabetes (P=0.046) and albumin (P<0.001). As revealed by the training and validation sets, the trends in the distribution of clinical characteristics were consistent (Table 1).
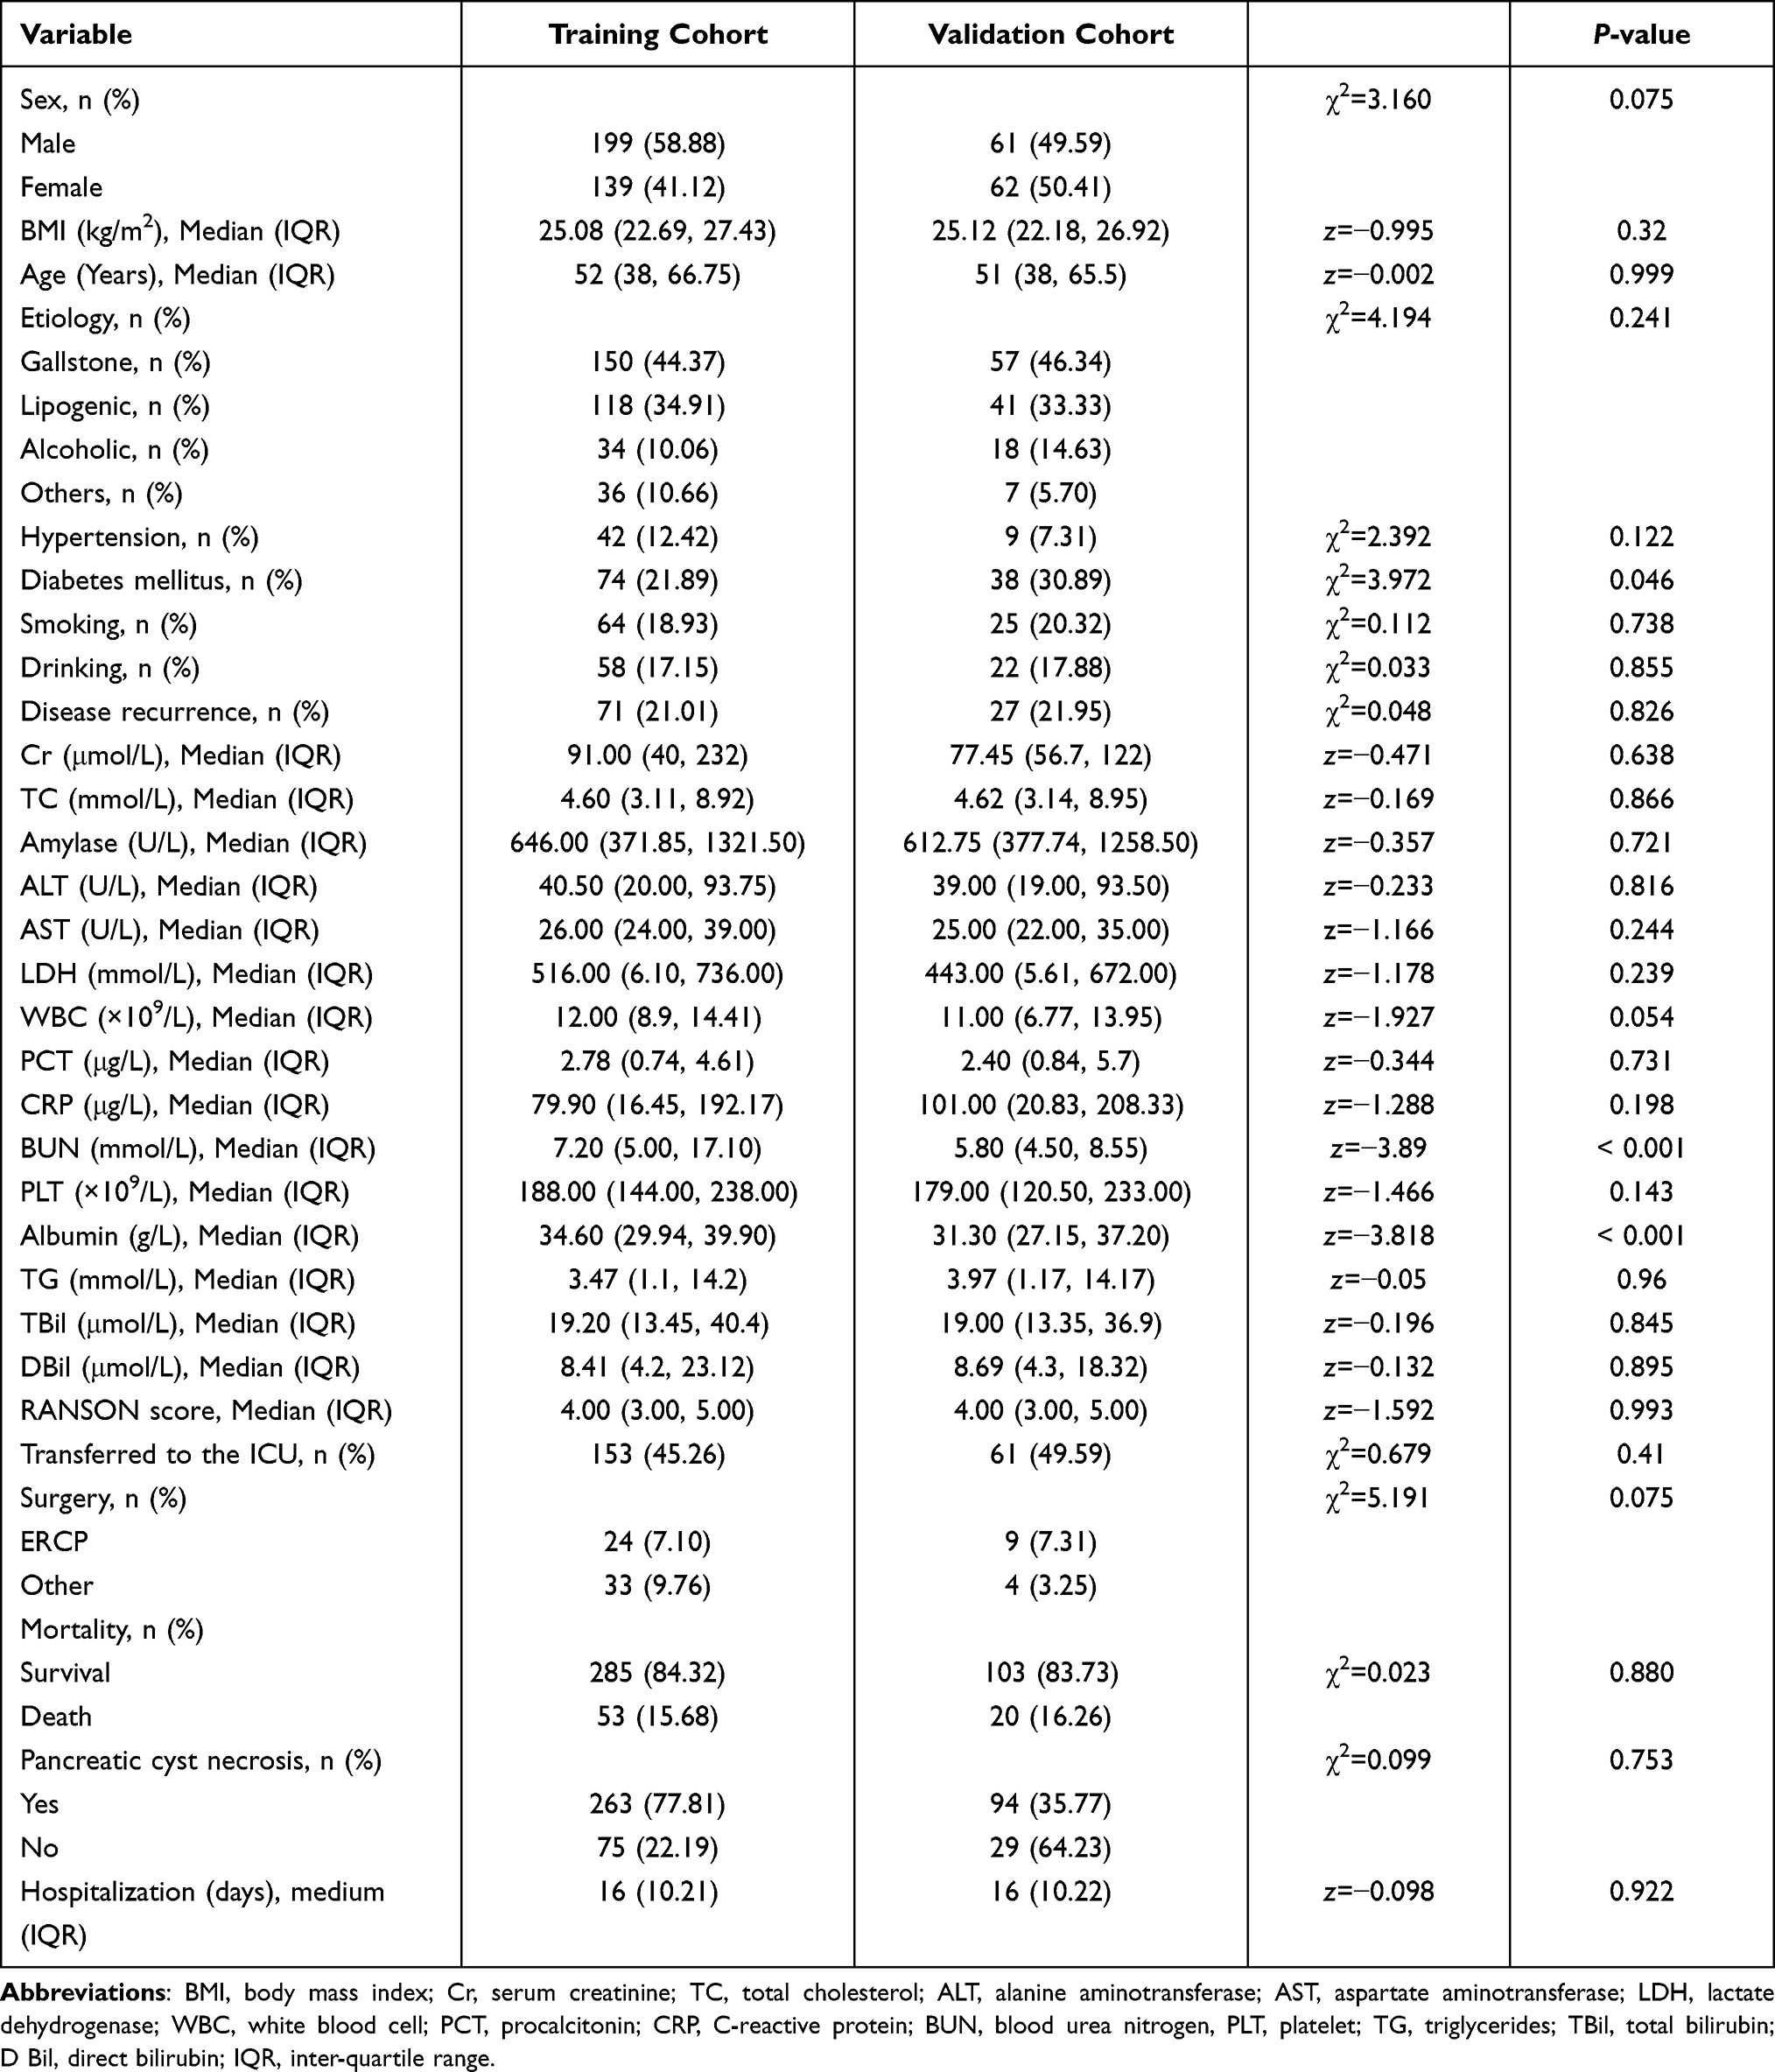 |
Table 1 Clinical Characteristics of Patients in Training Set and Validation Set |
Comparison of Clinical Data in the Training Group
As indicated by the univariate analysis, BMI, PCT, platelets, direct bilirubin, hemoglobin and RANSON were the factors of poor prognosis in SAP (Z=−5.293, −4.743, −2.214, −4.089, −2.323, −3.321, P < 0.05). The clinical factors with P<0.1 were further involved in the multivariate analysis. The results suggested that BMI (OR=1.12, 95% CI: 1.06–1.19, P=0.01), PCT (OR=1.25, 95% CI: 1.08–1.44, P=0.04) and RANSON (OR=1.28, 95% CI: 1.12–1.47, P=0.02) were found as the independent risk factors for poor prognosis of SAP (P<0.05) (Table 2).
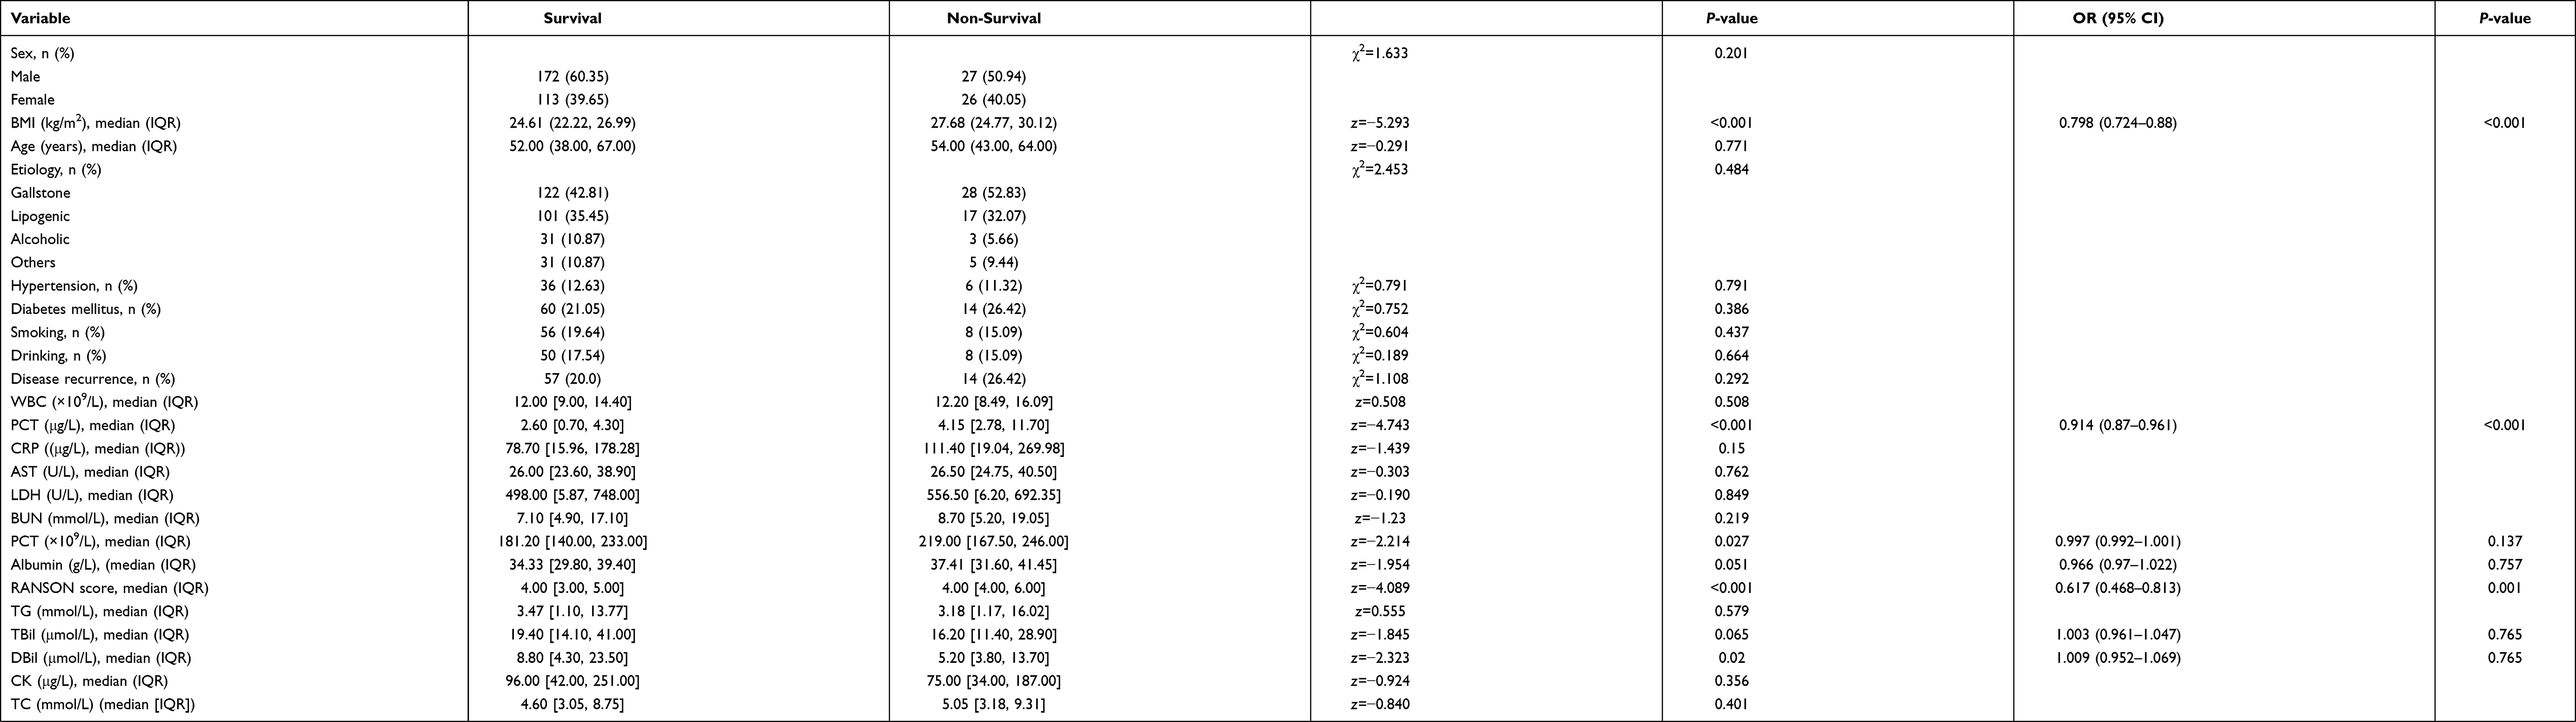 |
Table 2 Univariate and Multivariate Analyses of Risk of Death from Severe Acute Pancreatitis |
Establishment of Training Concentration Model
BMI, PCT and RANSON were included in the Binary logistic regression analysis to build the regression models. BMI+RANSON (χ2=50.691, P<0.001), PCT+RANSON (χ2=29.289, P<0.001), and BMI+PCT (χ2=44.695, P<0.001), BMI+PCT+RANSON (χ2=60.863, P<0.001) achieved statistical significance in all four models. BMI+RANSON: In (P/1-P)= 0.239×BMI+0.546×RANSON −10.278, PCT+RANSON: In (P/1 - P)=0.082× PCT +0.46×RANSON-4.08, BMI+PCT: In (P/1-P)= 0.223 ×BMI+0.083× PCT −8.047, BMI+PCT+RANSON: In (P/1 - P)= 0.243×BMI+0.083× PCT+0.53×RANSON −10.803.
Receiver Operating Characteristic Curve of Training Set
The AUC value of the BMI+PCT+RANSON in SAP (AUC: 0.809, 95% CI: 0.747–0.871, P<0.001, sensitivity: 0.68, specificity: 0.77) and was higher than BMI+PCT (AUC: 0.777, 95% CI: 0.710–0.843, P<0.001, sensitivity: 0.74, specificity: 0.75) and PCT+RANSON (AUC: 0.748, 95% CI: 0.684–0.813, P<0.001, Sensitivity: 0.73, specificity: 0.52) (P<0.05). No statistically significant difference was found between BMI+RANSON (AUC: 0.778, 95% CI: 0.710–0.847, P<0.001, sensitivity: 0.70, specificity: 0.75) and BMI; PCT+RANSON score (P>0.05). In comparison with a single indicator, the predictive power of the BMI+PCT+RANSON and BMI+RANSON increased obviously. (p<0.05) (Figure 1, Supplementary Table 1).
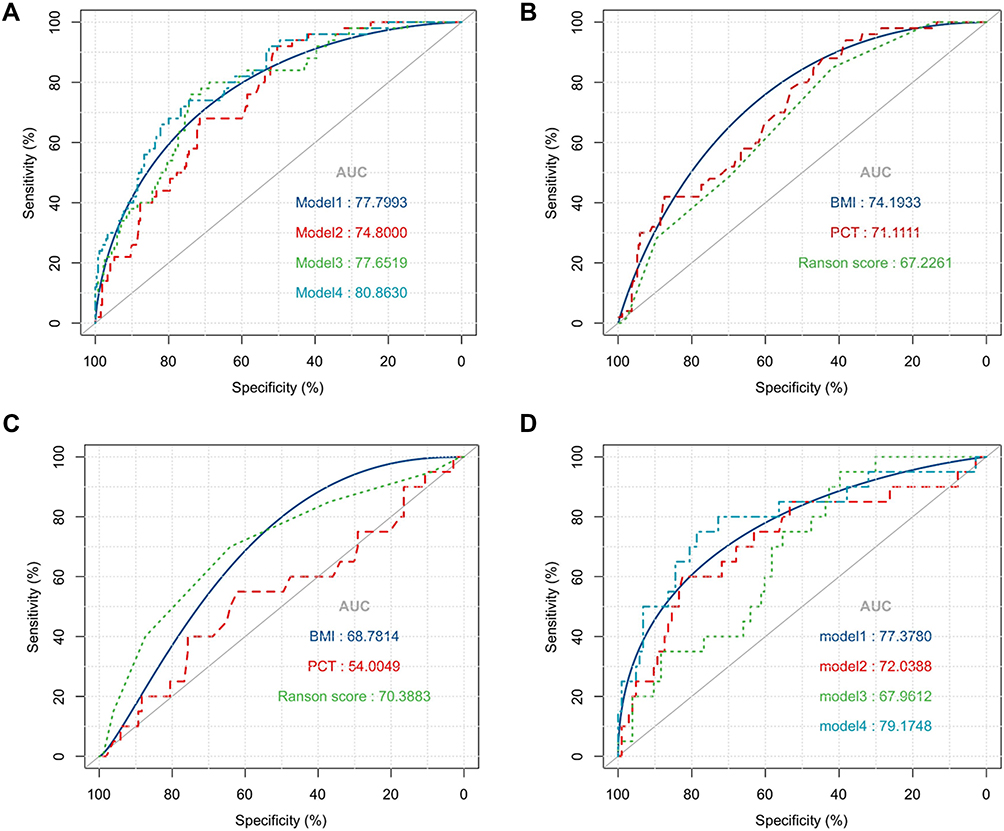 |
Figure 1 Receiver operating characteristic curve of the model (A and B) training cohort and (C and D) validation cohort. Model 1: BMI+RANSON; Model 2: PCT+ RANSON; Model 3: BMI+PCT; Model 4: PCT+BMI+RANSON. |
The Receiver Operating Characteristic Curves of Patients in the Validation Set
For the validation set, the AUC of the BMI+RANSON (AUC: 0.788, 95% CI: 0.671–0.905, P<0.001, sensitivity: 0.80, specificity: 0.75) was significantly higher than BMI (AUC: 0.68, 95% CI: 0.570–0.789:, P=0.011), PCT (AUC: 0.54, 95% CI: 0.396–0.684, P=0.572) and RANSON (AUC: 0.704, 95% CI: 0.573–0.834, P=0.004). According to the modified model, no significant difference was found in the prediction ability between BMI+RANSON and BMI and PCT+RANSON (p<0.05). In comparison with the training set, the difference in AUC was that the predictive power of PCT+RANSON and BMI+PCT was not stable (Figure 1, Supplementary Table 1).
NRI Index and IDI Index of Training Set and Validation Set Models
NRI and IDI indices showed that, compared with PCT+RANSON score and BMI+PCT, the capability of BMI+RANSON and BMI and PCT+RANSON had been significantly improved in predicting the death risk of SAP [NRI index difference (18.50%, 7.49%, 11.06%, 7.84%, P<0.05), IDI index difference (12.89%, 7.01%, 5.88%, 6.81%, P < 0.05)]. No statistically significant differences were found in NRI and IDI indices of BMI+RANSON compared with BMI and PCT+RANSON (P>0.05). The result of the verification set was consistent with that of the training set, BMI and PCT+RANSON and BMI+RANSON improved predictive ability compared to the reference model (p < 0.05) (Table 3).
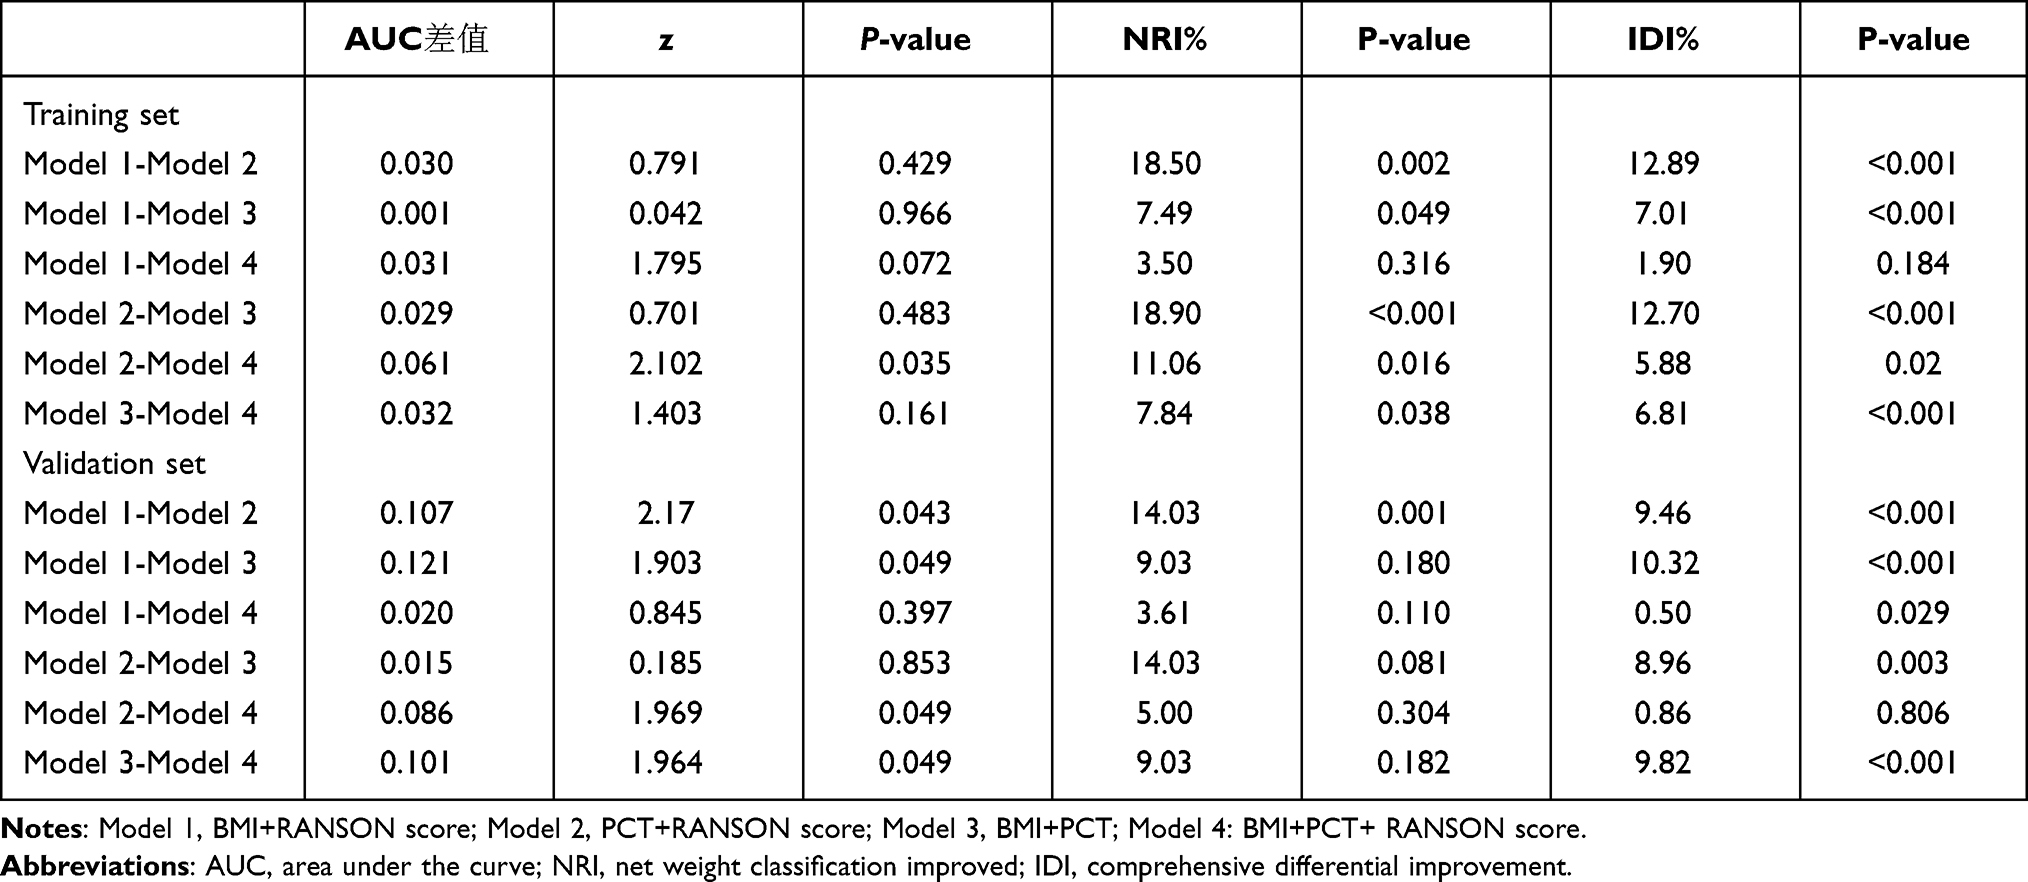 |
Table 3 Comparison of Prediction Ability Between Models in Training Set and Validation Set |
Calibration Curve and Decision Curve
In the training set and validation set, decision curve analysis suggested that BMI+RANSON had a significant positive net benefit within the range of death risk, thus revealing that the model had good clinical value in predicting 28-day mortality. Moreover, the model calibration and prediction curves for patients’ 28-day survival showed a perfect correlation in the training group. In the validation set, the results revealed that the model had the same reliability (Figures 2 and 3).
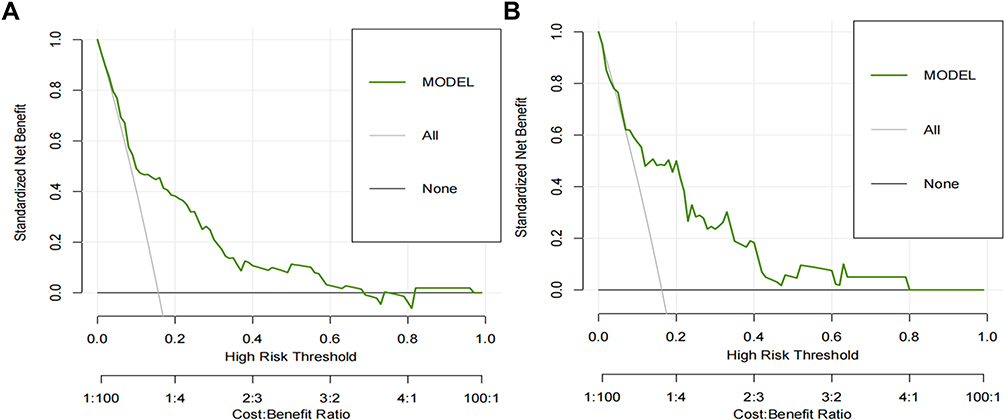 |
Figure 2 Decision curve analysis (DCA) of BMI+RANSON score. (A) In the training set, the diagnostic threshold of BMI+RANSON score was 0.72. (B) In the validation set, the diagnostic threshold of BMI+RANSON score was 0.80. The X-axis and Y-axis represent threshold probability and net return, respectively. For clinical use of BMI combined with the RANSON score as a model for the risk of death from SAP, a net gain curve was shown in DCA. When the threshold value of diagnostic model is between 0.50 and 0.99, patients will get corresponding net benefit as long as they take treatment measures. Abbreviation: DCA, decision curve analysis. |
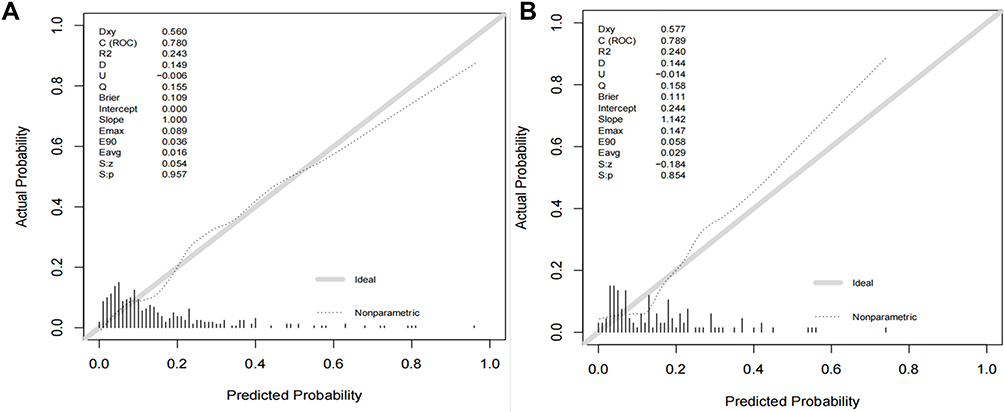 |
Figure 3 Calibration plots for predicting 28-day mortality of acute severe pancreatitis (A) training cohort and (B) validation cohort. This figure shows the relationship between the bias correction curve and the ideal curve. The gray dotted line on the diagonal is the ideal model (prediction probability = actual probability), and the solid line represents the calibration curve of the prediction model. The solid line is close to the dotted line in the figure, indicating that the model has good performance. The calibration curve shows that the actual probability is closely related to the predicted results of the model. |
Discussion
This study suggested that RANSON score+BMI was not only superior to RANSON score but also superior to single indicators such as BMI and PCT. RANSON score+BMI was better at predicting the mortality from SAP than RANSON score+PCT or BMI + PCT. Therefore, RANSON score+BMI can be used as improved RANSON score in clinical promotion and application.
RANSON scores consist of inflammation indicators, body fluid loss, liver and kidney function indicators, etc. Shelat et al proposed that fluid loss indicators of RANSON scores can be adopted to guide fluid therapy, as compared with other scores. Moreover, the 48-h time-point assessment is a cumulative assessment to predict severity and mortality to guide subsequent management of patients. Shelat et al considered the 48-h RANSON score a potential advantage, instead of an inherent disadvantage. Ong et al considered the RANSON score as the oldest scoring system, which has maintained its clinical effectiveness for years and has been confirmed to exhibit consistent and high prognostic accuracy.10 BMI is capable of indicating patients’ nutritional status, and RANSON score+BMI can be employed to guide patients’ nutritional support at later stages. Miko et al reported that the ability of RANSON score to predict the mortality was the same as that of APACHE II score (AUC: 0.87 vs 0.91), thus outperforming BISAP score and CTSI score.16 In contrast to APACHE II and BISAP score, RANSON score achieves the highest AUC value (0.92) and the highest sensitivity (0.93) and DOR (23.44) in predicting death risk.17 Consistent with previous research conclusions, RANSON score in this study was found with high prediction efficiency in the validation set and training set; on that basis, the prediction ability of improved RANSON score was also improved.
High BMI in patients refers to a well-known risk factor for AP, and patients with high BMI achieve higher morbidity and mortality. Ragesh Babu Thandassery et al found BMI ≥23 kg/m2 as an important predictor of severe course of disease and fatal outcome in AP patients.18 In accordance with the study of Pancreatic Disease Association of Japan, high BMI has been confirmed as an independent risk factor for the death risk of SAP, and THE cut-off value of BMI in predicting the death risk of SAP is 26.15 kg/m2.19 In another meta-analysis of eight studies recruiting 939 patients, Wang et al20 found an increased incidence of SAP, local complications, and mortality in overweight (BMI 25–30 kg/m2) AP patients. In this study, BMI in the SAP death group was significantly higher than that in the survival group, and the optimal cut-off value of BMI in predicting the mortality from SAP was 27.12 kg/m2. However, BMI or abdominal circumference generally employed for clinical prediction of AP stratification and mortality has not reached a unified cutoff value, thus resulting in their low clinical use value.
Existing studies have reported that PCT produced by the liver is capable of predicting the severity of the disease.20,21 The optimal cut-off value of PCT in predicting pancreatic tissue necrosis and organ failure secondary to systemic inflammatory infection is 1.8 mg/L, which is still controversial in predicting the risk of death and stratification of acute severe pancreatitis. First, PCT peaks at 24–72 h, so its measurement time is also controversial,5,22–24 and its clinical value in the early stage of acute pancreatitis is limited. In this study, PCT and RANSON score were combined into a novel score, and even BMI and PCT were included in RANSON score. Interestingly, the prediction ability of RANSON score with the two variables included was not better than that of RANSON score with the single variable included. This is probably because each prediction model exhibits the maximum prediction ability, and the prediction ability of the respective single indicator will also affect the overall prediction ability. The same type of indicators may show collinearity, so different directions should be selected during the exploration of the scoring of multi-indicator construction.
In this study, BMI+RANSON score was considered with promising applications. We consider that the improved score has the following advantages: 1) BMI is relatively stable compared with inflammation indicators, and RANSON score consists of liver and kidney function, inflammation indicators, etc. Compared with inflammation indicators (eg, PCT), BMI can serve as a supplement to RANSON score in different aspects. 2) Existing studies have classified BMI into normal overweight and obesity and have assigned one point to each of the three intervals, whereas the differences in patients within the intervals were not revealed. In this study, BMI values were incorporated into RANSON score by the regression equation, thus decreasing the number of patients assigned by BMI. Differences in patients of the same interval could not be significantly identified, and the method was found to be more scientific. 3) Mass fluid therapy is the treatment of AP, and the accuracy of fluid loss in RANSON score is reduced. BMI is stable during a hospital stay, thus enhancing the stability of RANSON score. 4) The patient data of the training set and validation set were from different medical centers, which could be more reliable than the data of a single center.
Furthermore, this study still had a large number of limitations. We only studied the optimized model to predict the mortality from SAP and did not explore the stratification of AP pancreatitis severity in depth. In further research, the ability of the optimized model to predict stratification in AP will be further explored. At the same time, in this study, the main outcome variable was acute severe pancreatitis as the main cause of death, and patients with major cardiovascular diseases (myocardial infarction and acute coronary syndrome) and immune diseases were further excluded. To avoid the effect arising from data selection deviation on the study, confounding factors were excluded through multiple logistic regression and other methods in this study to make the risk factors of acute severe pancreatitis more credible. For this study, it is still necessary to expand the sample size, select more single indicators, compare the prediction ability of the classical model with that of the optimized model, and conduct a multi-center study to verify its prediction value.
Conclusions
BMI, PCT and RANSON score were found as the independent risk factors for death in patients with SAP. RANSON score+BMI was found to be better than RANSON score in predicting death risk in patients with SAP. RANSON score+PCT, BMI+PCT, and PCT+RANSON score for BMI.
Ethical Approval
This work was performed in accordance with the declaration of Helsinki. All patients or family members involved in the study had signed informed consent. This work gained approval from the Human Research Ethics Committee of Changzhou Second People’s Hospital Affiliated with Nanjing Medical University and Nantong University Affiliated Hospital.
Acknowledgments
The authors would like to express their gratitude to the study participants for their contribution to the research, as well as current and past investigators and staff.
Funding
The Project is funded by the Jiangsu Commission of Health (H2017004) and the Changzhou medical innovation team (CCX201807).
Disclosure
The authors declared no conflicts of interest in this work.
References
1. Gardner TJ. Acute pancreatitis. Ann Intern Med. 2021;174(2):ITC17–ITC32. doi:10.7326/AITC202102160
2. Boxhoorn L, Voermans R, Bouwense S, et al. Acute pancreatitis. Lancet. 2020;396(10252):726–734. doi:10.1016/S0140-6736(20)31310-6
3. Beyer G, Habtezion A, Werner J, Lerch M, Mayerle JJL. Chronic pancreatitis. Lancet. 2020;396(10249):499–512. doi:10.1016/S0140-6736(20)31318-0
4. Singh V, Yadav D, Garg PJJ. Diagnosis and management of chronic pancreatitis: a review. JAMA. 2019;322(24):2422–2434. doi:10.1001/jama.2019.19411
5. Choudhuri AH, Duggal S, Biswas PS, Uppal R. A comparison of acute physiology and chronic health evaluation II score and serum procalcitonin change for predicting mortality in acute pancreatitis. Indian J Crit Care Med. 2020;24(3):190–194.
6. Tian F, Li H, Wang L, et al. The diagnostic value of serum C-reactive protein, procalcitonin, interleukin-6 and lactate dehydrogenase in patients with severe acute pancreatitis. Clin Chim Acta. 2020;510:665–670. doi:10.1016/j.cca.2020.08.029
7. Pulipati VP, Amblee A, Yap SET, Shaka H, Tahsin B, Fogelfeld L. Hypertriglyceridemia-associated acute pancreatitis: response to continuous insulin infusion. PLoS One. 2021;16(11):e0260495. doi:10.1371/journal.pone.0260495
8. Zhu GL, Chen SH, Fan XD, et al. [A prospective cohort study on BMI levels and risk of acute pancreatitis]. Zhonghua Liu Xing Bing Xue Za Zhi. 2021;42(12):2131–2137. Chinese. doi:10.3760/cma.j.cn112338-20201027-01286
9. Ince AT, Seven G, Koçhan K, Kiremitçi S, Yıldız K, Şentürk H. The course of acute pancreatitis in patients with different BMI groups. Pancreatology. 2022;22:348–355. doi:10.1016/j.pan.2022.03.009
10. Ong Y, Shelat V. Ranson score to stratify severity in acute pancreatitis remains valid - Old is gold. Expert Rev Gastroenterol. 2021;15:1–13.
11. Alcohol policies in national health and development planning. Including a summary of the technical discussions held during the thirty-fifth World Health Assembly, 1982. J WHO Offset Publ. 1985;89:1–102.
12. Davidson K, Barry M, Mangione C, et al. Screening for prediabetes and typPe 2 diabetes: US preventive services task force recommendation statement. JAMA. 2021;326(8):736–743. doi:10.1001/jama.2021.12531
13. Banks P, Bollen T, Dervenis C, et al. Classification of acute Pancreatitis–2012: revision of the Atlanta classification and definitions by international consensus. GUT. 2013;62(1):102–111. doi:10.1136/gutjnl-2012-302779
14. Masironi R. Health: smoking control strategies in developing countries: report of a WHO Expert Committee. World Smoking Health. 1984;9(1):4–6.
15. Kiat T, Gunasekaran S, Junnarkar S, Low J, Woon W. Are traditional scoring systems for severity stratification of acute pancreatitis sufficient?. Ann Hepato Pancreat Surg. 2018;22(2):105–115. doi:10.14701/ahbps.2018.22.2.105
16. Barreto S, Habtezion A, Gukovskaya A, et al. Critical thresholds: key to unlocking the door to the prevention and specific treatments for acute pancreatitis. Gut. 2021;70(1):194–203. doi:10.1136/gutjnl-2020-322163
17. KaPadia N, Siddiqui E. Bedside index (BISAP) v/s Ranson scores in predicting mortality and severity in patients with acute pancreatitis. J Pak Med Assoc. 2021;71(8):1988–1991. doi:10.47391/JPMA.03-417
18. Thandassery RB, Appasani S, Yadav TD, et al. Implementation of the Asia-Pacific guidelines of obesity classification on the APACHE-O scoring system and its role in the prediction of outcomes of acute pancreatitis: a study from India. Dig Dis Sci. 2014;59(6):1316–1321. doi:10.1007/s10620-013-3000-7
19. Pérez Campos A, Bravo Paredes E, Prochazka Zarate R, Bussalleu A, Pinto Valdivia J, Valenzuela Granados V. [BISAP-O y APACHE-O: utility in predicting severity in acute pancreatitis in modified Atlanta classification].[J]. Rev Gastroenterol Peru. 2015;35(1):15–24. Spanish.
20. Abu Hilal M, Armstrong T. The impact of obesity on the course and outcome of acute pancreatitis. Obes Surg. 2008;18(3):326–328. doi:10.1007/s11695-007-9298-5
21. O’Brian D, Prunty M, Hill A, Shoag J. The role of C-reactive protein in kidney, bladder, and prostate cancers. Front Immunol. 2021;12:721989. doi:10.3389/fimmu.2021.721989
22. Potempa L, Rajab I, Olson M, Hart PC. C-Reactive protein and cancer: interpreting the differential bioactivities of its pentameric and monomeric, modified isoforms. Front Immunol. 2021;12:744129. doi:10.3389/fimmu.2021.744129
23. Fujiwara J, Matsumoto S, Sekine M, Mashima H. hepatology: C-reactive protein predicts the development of walled-off necrosis in patients with SAP. JHP OPen. 2021;5(8):907–914.
24. Rau B, Steinbach G, Baumgart K, Gansauge F, Grünert A, Beger HG. The clinical value of PCT in the prediction of infected necrosis in acute pancreatitis. Intensive Care Med. 2000;26:S159–S164. doi:10.1007/s001340051136
 © 2022 The Author(s). This work is published and licensed by Dove Medical Press Limited. The full terms of this license are available at https://www.dovepress.com/terms.php and incorporate the Creative Commons Attribution - Non Commercial (unported, v3.0) License.
By accessing the work you hereby accept the Terms. Non-commercial uses of the work are permitted without any further permission from Dove Medical Press Limited, provided the work is properly attributed. For permission for commercial use of this work, please see paragraphs 4.2 and 5 of our Terms.
© 2022 The Author(s). This work is published and licensed by Dove Medical Press Limited. The full terms of this license are available at https://www.dovepress.com/terms.php and incorporate the Creative Commons Attribution - Non Commercial (unported, v3.0) License.
By accessing the work you hereby accept the Terms. Non-commercial uses of the work are permitted without any further permission from Dove Medical Press Limited, provided the work is properly attributed. For permission for commercial use of this work, please see paragraphs 4.2 and 5 of our Terms.