")
Back to Journals » OncoTargets and Therapy » Volume 9
The value of intravoxel incoherent motion model-based diffusion-weighted imaging for outcome prediction in resin-based radioembolization of breast cancer liver metastases
Authors Pieper C, Meyer C, Sprinkart AM, Block W, Ahmadzadehfar H, Schild HH, Mürtz P, Kukuk GM
Received 21 January 2016
Accepted for publication 24 April 2016
Published 5 July 2016 Volume 2016:9 Pages 4089—4098
DOI https://doi.org/10.2147/OTT.S104770
Checked for plagiarism Yes
Review by Single anonymous peer review
Peer reviewer comments 2
Editor who approved publication: Dr William C. Cho
Claus Christian Pieper,1 Carsten Meyer,1 Alois Martin Sprinkart,1 Wolfgang Block,1 Hojjat Ahmadzadehfar,2 Hans Heinz Schild,1 Petra Mürtz,1 Guido Matthias Kukuk1
1Department of Radiology, 2Department of Nuclear Medicine, University of Bonn, Bonn, Germany
Purpose: To evaluate prognostic values of clinical and diffusion-weighted magnetic resonance imaging-derived intravoxel incoherent motion (IVIM) parameters in patients undergoing primary radioembolization for metastatic breast cancer liver metastases.
Subjects and methods: A total of 21 females (mean age 54 years, range 43–72 years) with liver-dominant metastatic breast cancer underwent standard liver magnetic resonance imaging (1.5 T, diffusion-weighted imaging with b-values of 0, 50, and 800 s/mm2) before and 4–6 weeks after radioembolization. The IVIM model-derived estimated diffusion coefficient D’ and the perfusion fraction f’ were evaluated by averaging the values of the two largest treated metastases in each patient. Kaplan–Meier and Cox regression analyses for overall survival (OS) were performed. Investigated parameters were changes in f’- and D’-values after therapy, age, sex, Eastern Cooperative Oncology Group (ECOG) status, grading of primary tumor, hepatic tumor burden, presence of extrahepatic disease, baseline bilirubin, previous bevacizumab therapy, early stasis during radioembolization, chemotherapy after radioembolization, repeated radioembolization and Response Evaluation Criteria in Solid Tumors (RECIST) response at 6-week follow-up.
Results: Median OS after radioembolization was 6 (range 1.5–54.9) months. In patients with therapy-induced decreasing or stable f’-values, median OS was significantly longer than in those with increased f’-values (7.6 [range 2.6–54.9] vs 2.6 [range 1.5–17.4] months, P<0.0001). Longer median OS was also seen in patients with increased D’-values (6 [range 1.6–54.9] vs 2.8 [range 1.5–17.4] months, P=0.008). Patients with remission or stable disease (responders) according to RECIST survived longer than nonresponders (7.2 [range 2.6–54.9] vs 2.6 [range 1.5–17.4] months, P<0.0001). An ECOG status ≤1 resulted in longer median OS than >1 (7.6 [range 2.6–54.9] vs 1.7 [range 1.5–4.5] months, P<0.0001). Pretreatment IVIM parameters and the other clinical characteristics were not associated with OS. Classification by f’-value changes and ECOG status remained as independent predictors of OS on multivariate analysis, while RECIST response and D’-value changes did not predict survival.
Conclusion: Following radioembolization of breast cancer liver metastases, early changes in the IVIM model-derived perfusion fraction f’ and baseline ECOG score were predictive of patient outcome, and may thus help to guide treatment strategy.
Keywords: MRI, DWI, IVIM, breast cancer, selective internal radiation therapy, radioembolization
Introduction
Breast cancer is the most common malignant tumor in women.1 Overall, 15% of patients with metastatic breast cancer (mBRC) develop liver metastases, which are associated with a particularly poor prognosis (median survival 1–20 months).2
Radioembolization using yttrium-90 (90Y)-loaded microspheres has been evaluated for palliative treatment of mBRC with promising results.3 However, in previous studies, both objective response according to the Response Evaluation Criteria for Solid Tumors (RECIST) and survival rates after radioembolization of mBRC showed large variation, ranging from 26% to 75% and from 2 to 14 months, respectively.4–6 Several parameters, such as tumor grading and hormone-receptor status, Eastern Cooperative Oncology Group (ECOG) performance status, 3-month RECIST assessment and changes of the maximum standardized uptake value on 18F-fluorodeoxyglucose positron-emission tomography/computed tomography (CT) have been suggested as prognostic factors after systemic therapy or radioembolization.7–10
Diffusion-weighted imaging (DWI) provides information on tissue architecture, and has been proposed for both functional response assessment11–16 and survival prognosis.16,17 With DWI, the apparent diffusion coefficient (ADC) is usually calculated with b-values between 0 and 500–1,000 s/mm2 assuming monoexponential behavior of signal decay.11,13 An ADC increase can reflect therapy-induced necrosis.11–14 However, the DWI signal is not only influenced by molecular diffusion but also by pseudorandom motion in the capillary network.14,17 The intravoxel incoherent motion (IVIM) model is a refined analysis technique to separate perfusion- and diffusion-related effects by assuming biexponential behavior of signal decay.18 At low b-values (ie, <100 s/mm2), information on the amount of microvasculature (perfusion fraction f) and blood-flow velocity, as well as vessel architecture (pseudodiffusion coefficient D*) can be obtained. At high b-values (ie, >100 s/mm2), analysis yields information on molecular diffusion (true diffusion coefficient D).19,20 Recent work has suggested that IVIM model-derived perfusion parameters may be useful for early tumor-response assessment.21 However, in malignant lesions, nonlinear least squares fitting procedures, which have been advocated for an accurate determination of D* in normal liver tissue,22–27 are often hampered, due to weak biexponential behavior of the signal-decay curves.22,28–30 In order to provide a numerically stable approach for IVIM analysis in combination with clinically acceptable acquisition times, estimation of D and f (termed D’ and f’) using a simplified IVIM approach has been suggested for tumor-response assessment.31,32 Although such estimates probably deviate from true D- and f-values, they may serve as empirical response parameters reflecting diffusion and perfusion changes.
Therefore, the aim of our study was to evaluate pre- and early posttreatment D’ and f’ in comparison to clinical parameters for prediction of hepatic progression-free survival (hPFS) and overall survival (OS) in patients undergoing primary radioembolization of mBRC.
Subjects and methods
Patients
All patients who underwent radioembolization of liver-dominant mBRC after failure of systemic chemotherapy between June 2006 and February 2015 were retrospectively identified. Indications for all radioembolization procedures were discussed in interdisciplinary consensus conferences based on published inclusion criteria for radioembolization.33,34 The study was approved by the local institutional review board of the University Hospital Bonn which also waived the need for informed patient consent.
The inclusion criteria of the study were histologically confirmed BRC, first resin-based radioembolization, DWI obtained using the same study protocol before and after treatment without motion artifacts, and accessible procedural and clinical data. Patients were not excluded on the basis of stable extrahepatic disease at the time of evaluation or further treatments performed after radioembolization.
Treatment
Pretreatment workup and radioembolization were performed as described in the literature.34,35 Possible intra-abdominal, extrahepatic, or excessive pulmonary sphere deposition were excluded by planning angiography with injection of technetium-99m (99mTc)-macroaggregated albumin into the target arteries with subsequent single-photon-emission CT/CT. Coil embolization of nontarget vessels was performed if necessary. In compliance with international consensus guidelines, the body-surface-area method was used to calculate the prescribed activity for radioembolization.34 Treatment was performed in either a single session (simultaneous bilobar or unilobar) or sequentially (sequential bilobar treatment) using resin microspheres (SIR-Spheres®; Sirtex Medical Limited, Sydney, Australia). A microcatheter (Renegade; Boston Scientific, Marlborough, MA, USA) was positioned in the target artery, with injection of a suspension of resin microspheres in sterile water and repetitive contrast injections under intermittent fluoroscopy. Application was terminated if imminent stasis was observed. Peri-interventional medication included dexamethasone, ondansetron, and pantoprazole. Patients were admitted to a special ward for 2 days after radioembolization, in accordance with local regulations.
Clinical data
Clinical and procedural data included the following parameters: sex, patient age, ECOG status, grading of primary tumor, estimated hepatic tumor burden, presence of extrahepatic metastases, baseline bilirubin levels, previous application of bevacizumab, embolization site, early stasis during radioembolization (any blood-flow alteration preventing full administration of prescribed activity), prescribed/administered 90Y activity, chemotherapy after radioembolization, and repeated radioembolization.
Imaging protocol and follow-up
Patients underwent standard magnetic resonance imaging (MRI) of the liver before, 4–6 weeks after (first follow-up), and 3 months after (second follow-up) radioembolization. Further follow-up was performed at 3-month intervals. MR examinations were performed on a clinical 1.5 T MR scanner (Gyroscan Intera and Ingenia; gradient-system maximum amplitude 30 mT/m and 45 mT/m, respectively, maximum slew rate 150 T/m/s and 200 T/m/s, respectively; Philips Healthcare, Best, the Netherlands). A commercially available phased-array surface coil was used for signal reception with patients in supine position. Each patient was examined on the same MR scanner before and after therapy. The standardized imaging protocol included a respiratory-triggered single-shot spin-echo echo-planar DWI sequence acquired before contrast-agent application (Table 1) with three b-values (b0 =0, b1 =50, b2 =800 s/mm2) and motion-probing gradients in three orthogonal directions. Isotropic DW images were reconstructed on the MRI system. Furthermore, a T2-weighted sequence with and without fat suppression, a T1-weighted sequence, and a T1-weighted dynamic contrast-enhanced sequence were acquired.
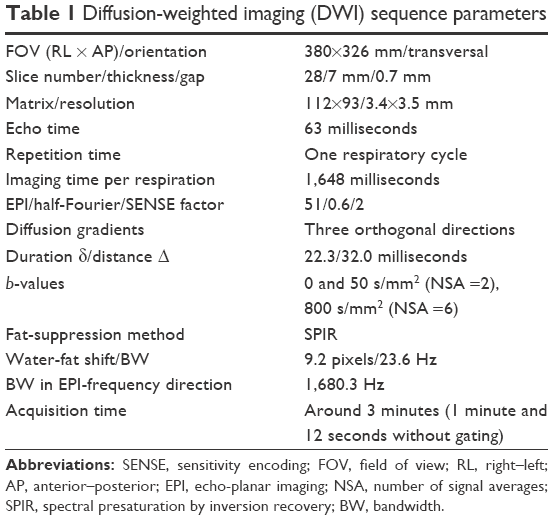 | Table 1 Diffusion-weighted imaging (DWI) sequence parameters |
Image analysis
Using the approach originally introduced by Le Bihan et al18 and described for b-values of 0, 50 and 800 s/mm2 in recent work,36,37 the IVIM model-derived D and f were estimated as D’ and f’ by:
D’ = ADC50/800 | (1) |
|
|
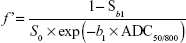
Furthermore, ADC0/800 was determined. ADC values were calculated according to the formula:
|
|
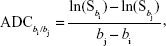
where Sbi and Sbj denote signal intensities at bi and bj, respectively and ln denotes natural logarithm. Voxel-wise calculation of all parameter values was performed using MatLab (MathWorks, Natick, MA, USA).
Analyses were conducted by one radiologist with more than 4 years of imaging and interventional experience and one physicist with more than 16 years of experience in DWI. Both were blinded to the history of the patient and follow-up results. The two largest metastases (diameter ≥1 cm) within the treated part of the liver were selected (if present). A hand-drawn region of interest (ROI) was placed within a central slice of the metastases, avoiding blood vessels, noticeable motion artifacts, pixel misalignments, or susceptibility artifacts. ROIs were drawn as large as possible (on DW images with b=800 s/mm2 of baseline and first follow-up MRI), excluding areas close to the rim of the lesion to avoid partial volume effects. The position of the ROIs was cross-checked among all images. ROIs were then copied into the IVIM-parameter maps. The mean ROI values of the two analyzed metastases were averaged with weights according to the ROI area size.
Definitions
Response to treatment was assessed on the basis of RECIST 1.1 criteria.38 Patients were categorized according to RECIST response on first follow-up into:
- responder: complete response/partial response (PR) or stable disease (SD)
- nonresponder: progressive disease (PD).
For IVIM-analysis patients were stratified according to changes in D’ and f’ (stable or decreasing vs increasing values), with a cutoff value of 0, as recently described for ADC-based response assessment in hepatocellular carcinoma.39
OS was defined as the time from first radioembolization to the date of death of any cause. hPFS was defined as the time between first radioembolization to disease progression within the treated part of the liver, in accordance with RECIST.
Statistical analysis
Survival analysis was performed for the described clinical/procedural and imaging parameters with dichotomization of patients as given in Table 2. Univariate analysis of OS and hPFS was performed using the Kaplan–Meier method with a log-rank test for statistical significance (categorical parameters) or a Cox regression model (continuous variables). Parameters showing a significant association with survival in univariate analysis without colinearity (eg, categorical values of f’-value changes and corresponding continuous variable) were entered into a multivariate Cox regression model to identify independent predictors of OS and hPFS, as well as to calculate hazard ratio (HR) estimates. Analyses were performed using commercially available statistical software (SPSS version 22.0; IBM, Armonk, NY, USA).
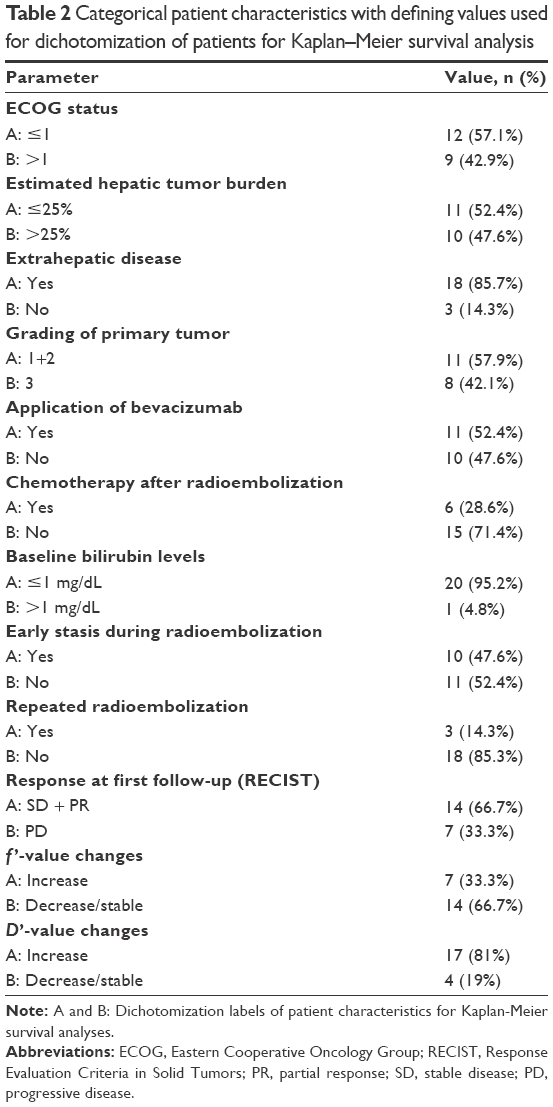 | Table 2 Categorical patient characteristics with defining values used for dichotomization of patients for Kaplan–Meier survival analysis |
Results
A total of 44 patients underwent radioembolization of liver-dominant mBRC, with 21 patients fulfilling the criteria for study eligibility (mean age 54 years, range 43–72 years) (Figure 1). Patient characteristics are summarized in Table 2. All patients suffered from bilobar metastatic disease. Liver metastases were progressive in all patients prior to radioembolization. A total of 15 patients received more than five different lines of chemotherapy prior to radioembolization, two received four lines, two received three lines, and two patients received two lines of chemotherapy. An invasive ductal carcinoma was the primary tumor in 17 patients; two patients suffered from an invasive lobular carcinoma. The histological type of the primary tumor was unknown in two patients. Ten patients showed positivity of at least one hormone receptor, four were hormone receptor-negative, and hormone-receptor status was unknown in seven patients. Three patients were HER2+, and eleven patients were HER2−. HER2 status was unknown in seven patients.
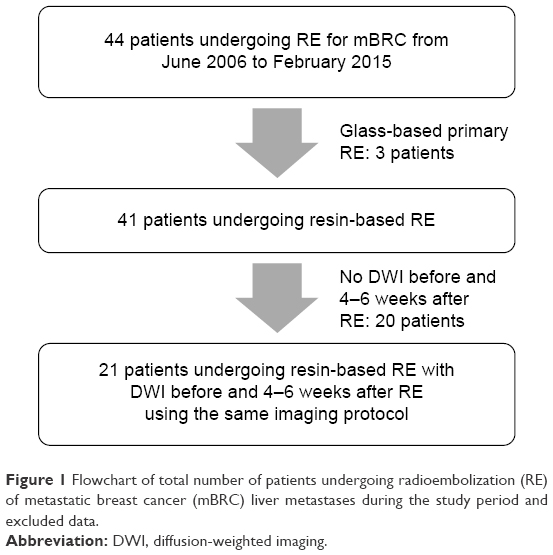 | Figure 1 Flowchart of total number of patients undergoing radioembolization (RE) of metastatic breast cancer (mBRC) liver metastases during the study period and excluded data. |
A total of 26 primary radioembolization procedures were performed, with five patients receiving sequential bilobar treatment (median time between procedures 2 [range 1–14] months). Three patients received repeated radioembolization of the treated portion of the liver at 147, 258, and 745 days after primary radioembolization. Mean treatment 90Y activity was 1.3±0.7 (range 0.33–2.9) GBq. No procedure-related complications (eg, cholecystitis or gastroduodenal ulceration) were recorded.
Data of three liver lobes were excluded from analysis, because of severe motion artifacts in DWI, so 37 metastases were analyzed, with a mean pretherapeutic lesion size of 40.7±21.2 (range 10–90) mm. Median time between pretherapeutic MRI and therapy was 17 (range 1–71) days, between therapy and first follow-up MRI 34 (range 28–42) days, and between therapy and second follow-up 97 (range 75–118) days. First follow-up MRI was available in all cases. In six of 21 patients, no second follow-up MRI was performed. Five of these patients showed disease progression on the first follow-up, and did not survive until the 3-month follow-up. One patient also showing initial disease progression was terminally ill at the time of the 3-month follow-up and died 5 months later.
During a median clinical and imaging follow-up time of 163 (range 46–1,638) days and 142 (range 29–1,253) days, respectively, 13 patients showed disease progression and 19 patients died. Two patients were alive at the date of analysis (147 and 227 days after radioembolization).
According to RECIST 1.1 criteria, two patients showed PR (9.5%), 13 SD (61.9%) and six PD (28.6%) on first follow-up (objective response rate 9.5%, disease-control rate 71.4%). After 3 months, seven patients showed PR (33.3%), five SD (23.8%), and nine PD (42.9%) (objective response rate 33.3%, disease-control rate 57.1%, including those patients showing PD on first follow-up who could not undergo second follow-up). Results of IVIM measurements are summarized in Table 3. Table 4 compares f’-value and D’-value changes after 6 weeks with RECIST response after 3 months.
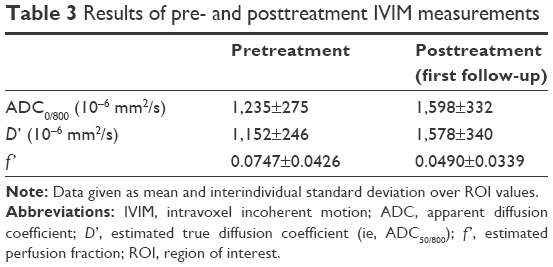 | Table 3 Results of pre- and posttreatment IVIM measurements |
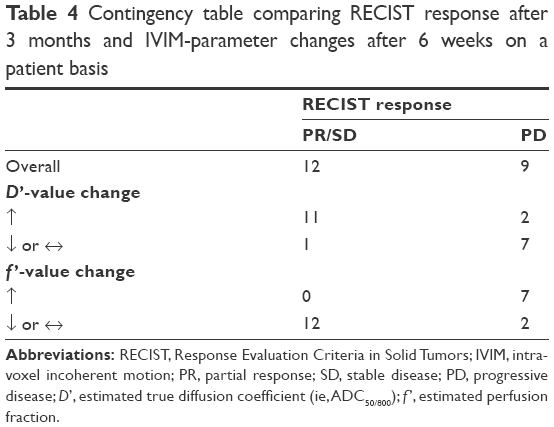 | Table 4 Contingency table comparing RECIST response after 3 months and IVIM-parameter changes after 6 weeks on a patient basis |
Survival analysis
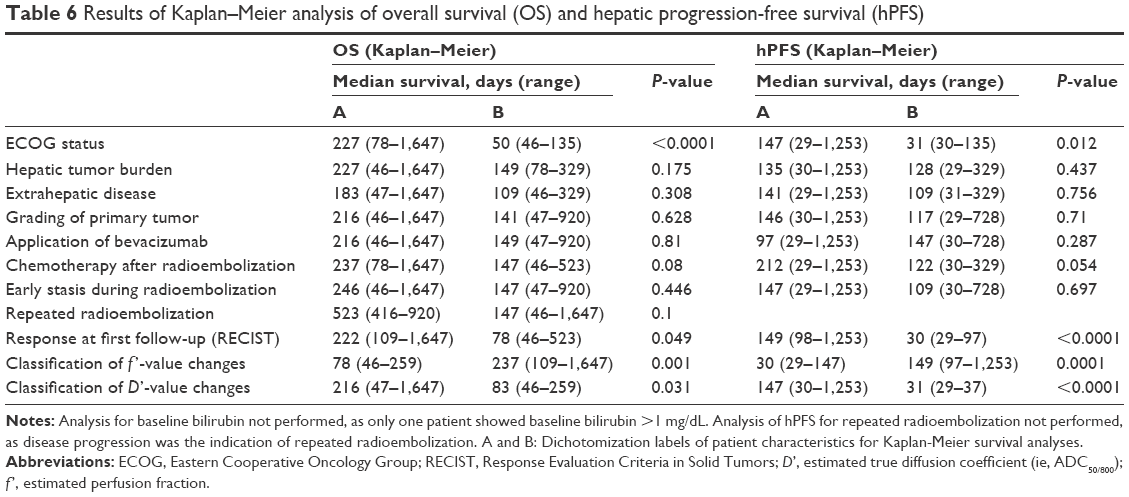
Median hPFS after the first radioembolization procedure was 135 (range 29–1,253) days. Univariate analysis showed significant interrelations between hPFS and postinterventional ADC0/800 and D’, as well as changes in ADC0/800, D’, and f’, while preinterventional IVIM parameters showed no significant association with hPFS. Patients with increasing D’-values had significantly longer median hPFS than those with decreasing D’-values (147 vs 31 days). Conversely, patients with decreasing f’-values survived significantly longer than patients with increasing f’-values (149 vs 30 days).
An ECOG-score ≤1 and PR/SD as evaluated by RECIST on first follow-up were associated with longer median hPFS (147 vs 31 days and 149 vs 30 days, respectively). On multivariate analysis, the ECOG score and classification according to f’-value changes remained the only independent predictors of hPFS, with an ECOG score >1 and an increase in f’-value being associated with shorter hPFS (HR 4.98, 95% confidence interval [CI] 1.32–18.52, P=0.018 and HR 8.29, 95% CI 2.55–26.96, P=0.0004, respectively).
Median OS after the first radioembolization procedure was 151 (range 46–1,647) days. Univariate analysis of OS showed significant interrelations with therapy-induced f’-value changes, while no other IVIM parameters were associated with OS (Table 5). When categorized according to changes in D’- and f’-values (stable or decreasing vs increasing values), patients with increasing D’- and decreasing f’-values had a significantly longer median OS (216 vs 83 days and 237 vs 78 days, respectively). Comparable to hPFS, an ECOG score ≤1 and PR/SD as evaluated by RECIST on first follow-up were associated with longer median OS (227 vs 50 days and 221 vs 78 days, respectively). Multivariate Cox regression showed that the ECOG score and categorization according to f’-value changes were the only independent predictors of OS. An ECOG score >1 and an increase in f’-value were associated with shorter OS (HR 13.33, 95% CI 2.60–71.43, P=0.002 and HR 6.73, 95% CI 1.98–22.89, P=0.002, respectively). Results of survival analyses are summarized in Tables 5–7 and Figure 2A–D. Group A and B in Table 6 are categorized according to values given in Table 2.
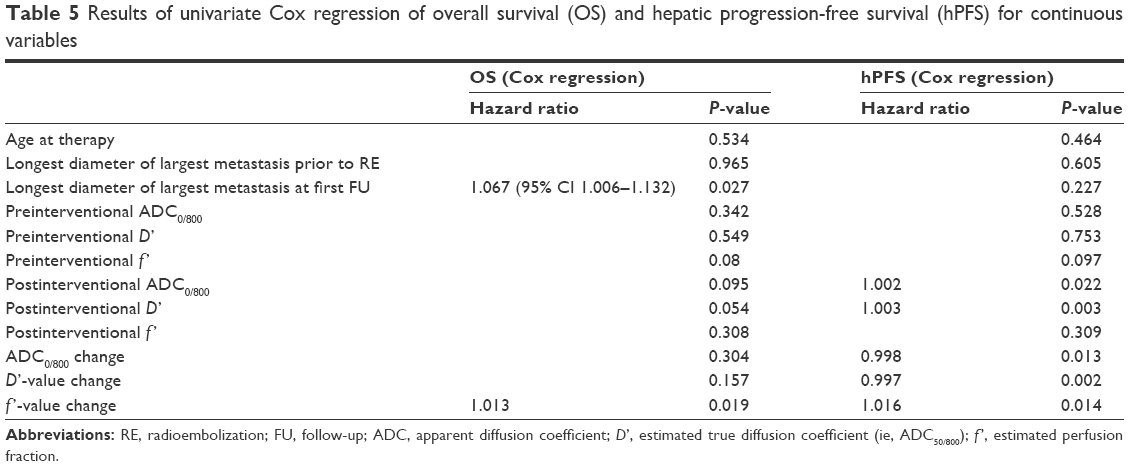 | Table 5 Results of univariate Cox regression of overall survival (OS) and hepatic progression-free survival (hPFS) for continuous variables |
 | Table 6 Results of Kaplan–Meier analysis of overall survival (OS) and hepatic progression-free survival (hPFS) |
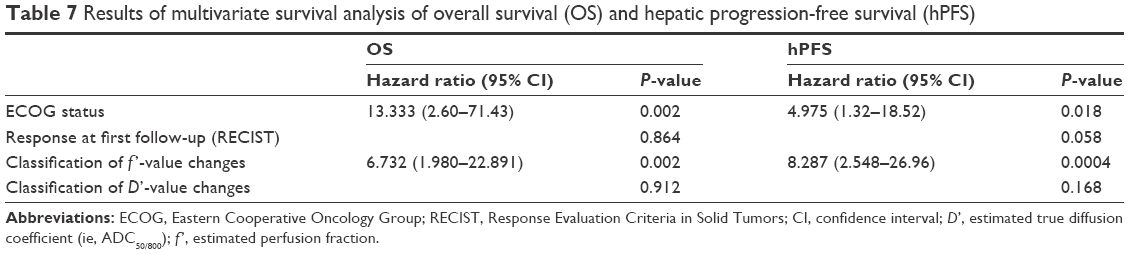 | Table 7 Results of multivariate survival analysis of overall survival (OS) and hepatic progression-free survival (hPFS) |
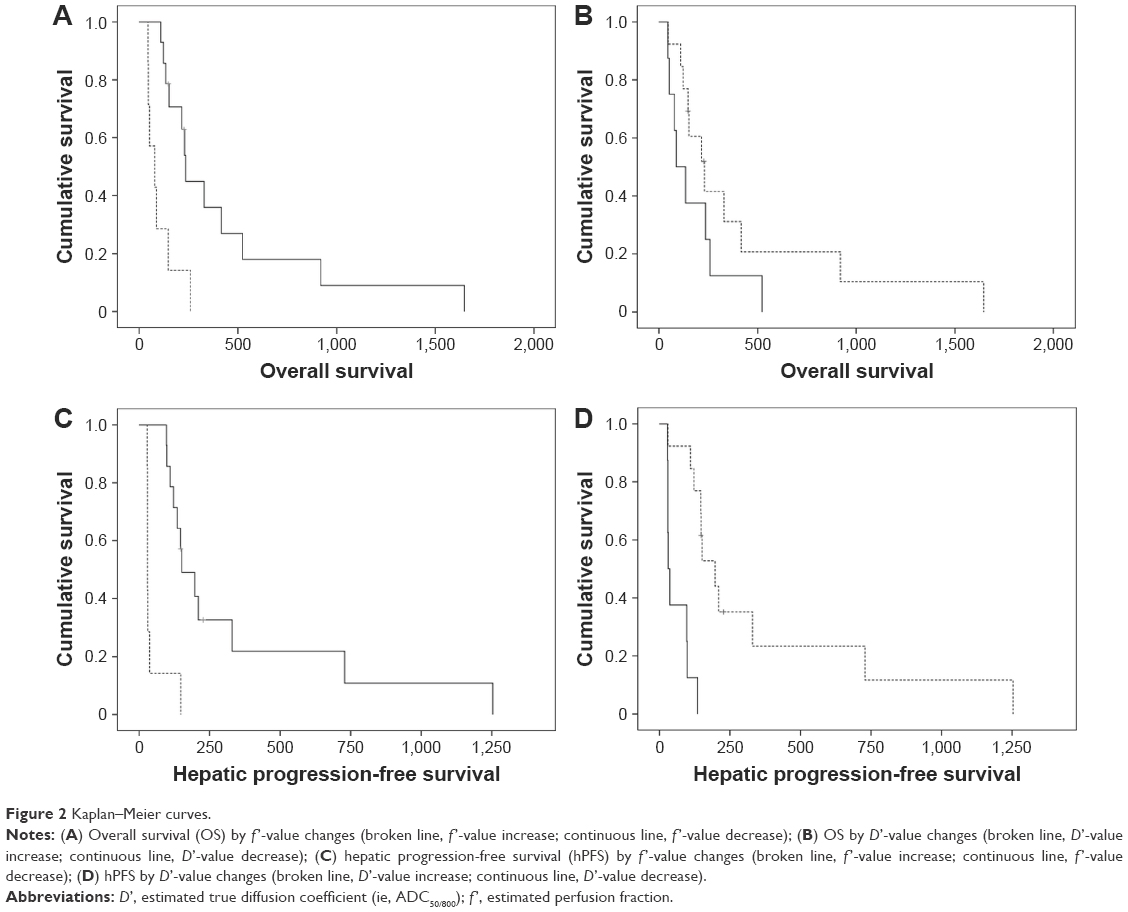 | Figure 2 Kaplan–Meier curves. |
Discussion
The results of our study provide the first evidence on the additional value of IVIM parameters for prediction not only of hPFS but also of OS 4–6 weeks after radioembolization of mBRC. Decreasing f’-values and a low baseline ECOG status were the only predictors of hPFS and OS. No other pretreatment clinical or IVIM parameters were associated with patients’ survival.
Several predominantly retrospective studies with small patient cohorts investigating survival from BRC after radioembolization have been published. Objective response rates (according to RECIST) between 26% and 75% and disease-control rates between 70% and 98.5% have been described, with median OS ranging from 2 to 14 months.4–6,9,10,40,41 We observed a rather low objective response rate of 33.3% and a disease-control rate of 57.1% at the 3-month follow-up. Median OS was also in the lower range of published values: about 5 (range 1.5–55) months after first radioembolization. However, it is important to note that high imaging-based disease-control rates do not necessarily translate into longer OS. A study on 75 patients reported an excellent disease-control rate of 98.5%, but a median OS of only 6.6 months.40 Conversely, another study observed a disease-control rate of 70% with median OS of 14 months.5 To a certain degree, such high variance may be attributable to known overall prognostic factors in BRC (eg, histologic tumor grading or hormone-receptor and HER2 status).7 Longer survival after radioembolization of mBRC has been described in patients showing morphological therapy response according to RECIST or World Health Organization criteria,5,9 an ECOG score <1, liver involvement <25%, low baseline bilirubin levels, liver-only disease, and chemotherapy after radioembolization.4,5,40,41 The results of our analysis concerning clinical parameters are in line with previously published studies showing significantly longer hPFS and OS in patients with an ECOG score ≤1 and response to therapy according to RECIST.
We generally performed radioembolization in a salvage situation after multiple lines of chemotherapy had failed. Therefore, about 43% of patients presented with an ECOG score >1, 48% had a hepatic tumor burden of >25%, and extrahepatic metastases were present in 86%. With regard to baseline patient characteristics and median OS, our data are comparable to a recently published cohort (5 months vs 6.6 months).40 In contrast, 82.5% of patients treated in another study had an ECOG score <1 with a better median OS of 14 months.5
Although morphological response has been shown to be a predictor of survival, reliable assessment can often only be obtained several months after treatment, as tumor-size changes may occur later after therapy.11,38,42–47 For earlier response assessment, several functional imaging parameters derived from DWI,16,48 positron-emission tomography/CT,10,49 or perfusion-CT50 have been assessed.
We employed a simplified IVIM approach, as introduced by Le Bihan et al,18 for DWI analysis. This approach has already yielded promising results for lesion characterization in the liver36 and pancreas,37 as well as for response assessment.31,32 When a numerically stable voxel-wise analysis method combined with short acquisition times (about 3 minutes) is used, it is suitable for a clinical setting.
In general, an increase in the ADC can reflect therapy-induced tumor necrosis.11,14,39 For malignant liver lesions, lower f- and D*-values compared to normal liver tissue have been described.28–30,36,51 Lower f-values in tumors have been shown to correlate with lower histological microvessel density.52 Low D*-values are associated with immature and leaky blood vessels, leading to high intralesional interstitial fluid pressure, resulting in stagnant blood flow.53,54 It is important to note that in the simplified IVIM analysis employed in this study, the estimated perfusion-fraction parameter f’ is influenced both by f and D*. Therefore, low f’-values can be related to low microvascular density, as well as to neoangiogenic vessels with impaired blood flow. Although comparison of DWI values between different studies is difficult, due to varying methodology,55,56 our measurement results are in the same order of magnitude as published values of other liver-adenocarcinoma metastases (eg, ADC, D, and f of 1,400×10−6 s/mm2, 1,100×10−6 s/mm2, and 0.136, respectively, for metastatic colorectal cancer).30
Analysis of IVIM parameters in our study cohort showed hPFS and OS to be significantly longer in patients with decreasing f’- and increasing D’-values after therapy, while ADC0/800 changes were not associated with survival. This was probably due to counteracting effects of decreasing f’- and increasing D’-values both being incorporated in the overall ADC. In our study cohort, increasing molecular diffusion, as reflected in increasing D’-values, indicates successful therapy, ie, probably therapy-induced necrosis. Decreasing f’-values may reflect adequate embolization leading to reduced blood flow and reduced microvasculature in necrotic areas. Conversely, patients with increasing f’- and decreasing D’-values, reflecting abundant vascularization and lack of necrosis, showed significantly shorter survival. An increase of the overall ADC in patients suffering from mBRC has recently been reported to be associated with response to chemotherapy 1 week after initiation of therapy.15 Although we did not observe a significant association with the ADC0/800, the results of this study also point to the benefit of developing necrosis, as reflected by an increase in D’-values in our study. For outcome prediction in radioembolization, however, perfusion changes seem to outweigh the development of necrosis. Apart from the ECOG score, f’-value changes were identified as the only imaging parameter independently predicting hPFS and OS.
Data on the value of pretherapeutic DWI parameters for response and outcome prediction remain poorly understood. Lower pretreatment ADC values have been associated with better 3-month response of other tumor entities like metastatic colorectal cancer and gastric cancer metastases to chemotherapy, but did not predict survival.48,57 This may be due to several other factors (eg, extrahepatic disease) influencing survival.
The value of perfusion-related IVIM parameters has already been demonstrated for other tumor entities. f-values differentiated responders from nonresponders by lower pretherapeutic values and increased values after therapy in hepatocellular carcinoma treated with sorafenib.31 In neuroendocrine metastases, responders to radioembolization also showed lower pretherapeutic perfusion-related ADC0/50 values with a posttherapeutic increase in vital tumor regions.32 In this respect, it is important to note which part of a tumor is analyzed. In a study on radioembolization of neuroendocrine liver metastases, only the viable part of the metastases was analyzed,32 while we analyzed the whole metastasis, so the increase in necrotic tissue considerably contributed to the results of our measurements.
Comparable to changes in perfusion parameters observed in our analysis, response to radioembolization and 1-year survival was associated with an early therapy-induced reduction of arterial perfusion of different liver metastases measured by perfusion CT.50,58,59 Moreover, response could be predicted by higher preinterventional perfusion values. Although these results seem to be in line with our findings, to date there has been no direct comparison of both methods. In contrast to DWI, perfusion CT has the disadvantages of necessitating the use of contrast agent and radiation exposure, with a dose of up to 18 mSv being reported.59
Although the data of our study are compelling, the results of our analysis are limited by the retrospective character of our study and the relatively small patient cohort. This was mainly due to the fact that radioembolization is used as a salvage-treatment option in patients suffering from mBRC in whom other therapies had failed. Furthermore, only patients examined both before and after radioembolization with the same imaging protocol could be included. Therefore, further prospective studies to assess reproducibility of our results would be of value.
Conclusion
In conclusion, we found changes in IVIM parameters on early follow-up DWI to be useful for outcome prediction after radioembolization of mBRC. Early decrease in the IVIM perfusion fraction after treatment and a low baseline ECOG score are predictive of longer hPFS and OS. By stratifying patients into responders and nonresponders based on f’-values, IVIM analysis may help guide further treatment-strategy.
Disclosure
CM is a consultant for Sirtex Medical, PharmaCept, and Gore Medical. GMK has received payment for lectures from Philips Healthcare. The other authors report no conflicts of interest in this work.
References
Edwards BK, Noone AM, Mariotto AB, et al. Annual report to the nation on the status of cancer, 1975–2010, featuring prevalence of comorbidity and impact on survival among persons with lung, colorectal, breast, or prostate cancer. Cancer. 2014;120(9):1290–1314. | ||
Eichbaum MH, Kaltwasser M, Bruckner T, de Rossi TM, Schneeweiss A, Sohn C. Prognostic factors for patients with liver metastases from breast cancer. Breast Cancer Res Treat. 2006;96(1):53–62. | ||
Smits ML, Prince JF, Rosenbaum CE, et al. Intra-arterial radioembolization of breast cancer liver metastases: a structured review. Eur J Pharmacol. 2013;709(1–3):37–42. | ||
Bangash AK, Atassi B, Kaklamani V, et al. 90Y radioembolization of metastatic breast cancer to the liver: toxicity, imaging response, survival. J Vasc Interv Radiol. 2007;18(5):621–628. | ||
Saxena A, Kapoor J, Meteling B, Morris DL, Bester L. Yttrium-90 radioembolization for unresectable, chemoresistant breast cancer liver metastases: a large single-center experience of 40 patients. Ann Surg Oncol. 2014;21(4):1296–1303. | ||
Coldwell DM, Kennedy AS, Nutting CW. Use of yttrium-90 microspheres in the treatment of unresectable hepatic metastases from breast cancer. Int J Radiat Oncol Biol Phys. 2007;69(3):800–804. | ||
Foulkes WD, Smith IE, Reis-Filho JS. Triple-negative breast cancer. N Engl J Med. 2010;363(20):1938–1948. | ||
Dunfee BL, Riaz A, Lewandowski RJ, et al. Yttrium-90 radioembolization for liver malignancies: prognostic factors associated with survival. J Vasc Interv Radiol. 2010;21(1):90–95. | ||
Jakobs TF, Hoffmann RT, Fischer T, et al. Radioembolization in patients with hepatic metastases from breast cancer. J Vasc Interv Radiol. 2008;19(5):683–690. | ||
Haug AR, Tiega Donfack BP, Trumm C, et al. 18F-FDG PET/CT predicts survival after radioembolization of hepatic metastases from breast cancer. J Nucl Med. 2012;53(3):371–377. | ||
Thoeny HC, Ross BD. Predicting and monitoring cancer treatment response with diffusion-weighted MRI. J Magn Reson Imaging. 2010;32(1):2–16. | ||
Chiaradia M, Baranes L, Van Nhieu JT, et al. Intravoxel incoherent motion (IVIM) MR imaging of colorectal liver metastases: are we only looking at tumor necrosis? J Magn Reson Imaging. 2014;39(2):317–325. | ||
Padhani AR, Koh DM. Diffusion MR imaging for monitoring of treatment response. Magn Reson Imaging Clin N Am. 2011;19(1):181–209. | ||
Koh DM, Collins DJ. Diffusion-weighted MRI in the body: applications and challenges in oncology. AJR Am J Roentgenol. 2007;188(6):1622–1635. | ||
Theilmann RJ, Borders R, Trouard TP, et al. Changes in water mobility measured by diffusion MRI predict response of metastatic breast cancer to chemotherapy. Neoplasia. 2004;6(6):831–837. | ||
Heijmen L, ter Voert EE, Oyen WJ, et al. Multimodality imaging to predict response to systemic treatment in patients with advanced colorectal cancer. PLoS One. 2015;10(4):e0120823. | ||
Padhani AR, Liu G, Koh DM, et al. Diffusion-weighted magnetic resonance imaging as a cancer biomarker: consensus and recommendations. Neoplasia. 2009;11(2):102–125. | ||
Le Bihan D, Breton E, Lallemand D, Aubin ML, Vignaud J, Laval-Jeantet M. Separation of diffusion and perfusion in intravoxel incoherent motion MR imaging. Radiology. 1988;168(2):497–505. | ||
Koh DM, Collins DJ, Orton MR. Intravoxel incoherent motion in body diffusion-weighted MRI: reality and challenges. AJR Am J Roentgenol. 2011;196(6):1351–1361. | ||
Koh DM. Science to practice: can intravoxel incoherent motion diffusion-weighted MR imaging be used to assess tumor response to antivascular drugs? Radiology. 2014;272(2):307–308. | ||
Joo I, Lee JM, Han JK, Choi BI. Intravoxel incoherent motion diffusion-weighted MR imaging for monitoring the therapeutic efficacy of the vascular disrupting agent CKD-516 in rabbit VX2 liver tumors. Radiology. 2014;272(2):417–426. | ||
Ter Voert EE, Delso G, Porto M, Huellner M, Veit-Haibach P. Intravoxel incoherent motion protocol evaluation and data quality in normal and malignant liver tissue and comparison to the literature. Invest Radiol. 2016;51(2):90–99. | ||
Cohen AD, Schieke MC, Hohenwalter MD, Schmainda KM. The effect of low b-values on the intravoxel incoherent motion derived pseudodiffusion parameter in liver. Magn Reson Med. 2015;73(1):306–311. | ||
Leporq B, Saint-Jalmes H, Rabrait C, Pilleul F, Guillaud O, Dumortier J, et al. Optimization of intra-voxel incoherent motion imaging at 3.0 Tesla for fast liver examination. J Magn Reson Imaging. 2015;41(5):1209–1217. | ||
Chung SR, Lee SS, Kim N, et al. Intravoxel incoherent motion MRI for liver fibrosis assessment: a pilot study. Acta Radiol. 2015;56(12):1428–1436. | ||
Guiu B, Petit JM, Capitan V, et al. Intravoxel incoherent motion diffusion-weighted imaging in nonalcoholic fatty liver disease: a 3.0-T MR study. Radiology. 2012;265(1):96–103. | ||
Luciani A, Vignaud A, Cavet M, et al. Liver cirrhosis: intravoxel incoherent motion MR imaging: pilot study. Radiology. 2008;249(3):891–899. | ||
Kakite S, Dyvorne H, Besa C, et al. Hepatocellular carcinoma: short-term reproducibility of apparent diffusion coefficient and intravoxel incoherent motion parameters at 3.0T. J Magn Reson Imaging. 2015;41(1):149–156. | ||
Woo S, Lee JM, Yoon JH, Joo I, Han JK, Choi BI. Intravoxel incoherent motion diffusion-weighted MR imaging of hepatocellular carcinoma: correlation with enhancement degree and histologic grade. Radiology. 2014;270(3):758–767. | ||
Andreou A, Koh DM, Collins DJ, et al. Measurement reproducibility of perfusion fraction and pseudodiffusion coefficient derived by intravoxel incoherent motion diffusion-weighted MR imaging in normal liver and metastases. Eur Radiol. 2013;23(2):428–434. | ||
Lewin M, Fartoux L, Vignaud A, Arrivé L, Menu Y, Rosmorduc O. The diffusion-weighted imaging perfusion fraction f is a potential marker of sorafenib treatment in advanced hepatocellular carcinoma: a pilot study. Eur Radiol. 2011;21(2):281–290. | ||
Kukuk GM, Mürtz P, Träber F, et al. Diffusion-weighted imaging with acquisition of three b-values for response evaluation of neuroendocrine liver metastases undergoing selective internal radiotherapy. Eur Radiol. 2014;24(2):267–276. | ||
Salem R, Thurston KG. Radioembolization with 90Yttrium microspheres: a state-of-the-art brachytherapy treatment for primary and secondary liver malignancies. Part 1: Technical and methodologic considerations. J Vasc Interv Radiol. 2006;17(8):1251–1278. | ||
Kennedy A, Nag S, Salem R, et al. Recommendations for radioembolization of hepatic malignancies using yttrium-90 microsphere brachytherapy: a consensus panel report from the radioembolization brachytherapy oncology consortium. Int J Radiat Oncol Biol Phys. 2007;68(1):13–23. | ||
Mahnken AH, Spreafico C, Maleux G, Helmberger T, Jakobs TF. Standards of practice in transarterial radioembolization. Cardiovasc Intervent Radiol. 2013;36(3):613–622. | ||
Penner AH, Sprinkart AM, Kukuk GM, et al. Intravoxel incoherent motion model-based liver lesion characterisation from three b-value diffusion-weighted MRI. Eur Radiol. 2013;23(10):2773–2783. | ||
Concia M, Sprinkart AM, Penner AH, et al. Diffusion-weighted magnetic resonance imaging of the pancreas: diagnostic benefit from an intravoxel incoherent motion model-based 3 b-value analysis. Invest Radiol. 2014;49(2):93–100. | ||
Eisenhauer EA, Therasse P, Bogaerts J, et al. New response evaluation criteria in solid tumours: revised RECIST guideline (version 1.1). Eur J Cancer. 2009;45(2):228–247. | ||
Vandecaveye V, Michielsen K, De Keyzer F, et al. Chemoembolization for hepatocellular carcinoma: 1-month response determined with apparent diffusion coefficient is an independent predictor of outcome. Radiology. 2014;270(3):747–757. | ||
Gordon AC, Gradishar WJ, Kaklamani VG, et al. Yttrium-90 radioembolization stops progression of targeted breast cancer liver metastases after failed chemotherapy. J Vasc Interv Radiol. 2014;25(10):1523–1532. | ||
Cianni R, Pelle G. Evidence-based integration of selective internal radiation therapy into the management of breast cancer liver metastases. Future Oncol. 2014;10(15 Suppl):93–95. | ||
Li SP, Padhani AR. Tumor response assessments with diffusion and perfusion MRI. J Magn Reson Imaging. 2012;35(4):745–763. | ||
Husband JE, Schwartz LH, Spencer J, et al. Evaluation of the response to treatment of solid tumours: a consensus statement of the International Cancer Imaging Society. Br J Cancer. 2004;90(12):2256–2260. | ||
Kennedy AS, Salem R. Radioembolization (yttrium-90 microspheres) for primary and metastatic hepatic malignancies. Cancer J. 2010;16(2):163–175. | ||
Bester L, Hobbins PG, Wang SC, Salem R. Imaging characteristics following 90-yttrium microsphere treatment for unresectable liver cancer. J Med Imaging Radiat Oncol. 2011;55(2):111–118. | ||
Bienert M, McCook B, Carr BI, et al. 90Y microsphere treatment of unresectable liver metastases: changes in 18F-FDG uptake and tumour size on PET/CT. Eur J Nucl Med Mol Imaging. 2005;32(7):778–787. | ||
Szyszko T, Al-Nahhas A, Canelo R, et al. Assessment of response to treatment of unresectable liver tumours with 90Y microspheres: value of FDG PET versus computed tomography. Nucl Med Commun. 2007;28(1):15–20. | ||
Tam HH, Collins DJ, Brown G, et al. The role of pre-treatment diffusion-weighted MRI in predicting long-term outcome of colorectal liver metastasis. Br J Radiol. 2013;86(1030):1–8. | ||
Sabet A, Meyer C, Aouf A, et al. Early post-treatment FDG PET predicts survival after 90Y microsphere radioembolization in liver-dominant metastatic colorectal cancer. Eur J Nucl Med Mol Imaging. 2015;42(3):370–376. | ||
Morsbach F, Pfammatter T, Reiner CS, et al. Computed tomographic perfusion imaging for the prediction of response and survival to transarterial radioembolization of liver metastases. Invest Radiol. 2013;48(11):787–794. | ||
Yamada I, Aung W, Himeno Y, Nakagawa T, Shibuya H. Diffusion coefficients in abdominal organs and hepatic lesions: evaluation with intravoxel incoherent motion echo-planar MR imaging. Radiology. 1999;210(3):617–623. | ||
Lee HJ, Rha SY, Chung YE, et al. Tumor perfusion-related parameter of diffusion-weighted magnetic resonance imaging: correlation with histological microvessel density. Magn Reson Med. 2014;71(4):1554–1558. | ||
Kim S, Decarlo L, Cho GY, et al. Interstitial fluid pressure correlates with intravoxel incoherent motion imaging metrics in a mouse mammary carcinoma model. NMR Biomed. 2012;25(5):787–794. | ||
Gade TP, Buchanan IM, Motley MW, Mazaheri Y, Spees WM, Koutcher JA. Imaging intratumoral convection: pressure-dependent enhancement in chemotherapeutic delivery to solid tumors. Clin Cancer Res. 2009;15(1):247–255. | ||
Lemke A, Laun FB, Simon D, Stieltjes B, Schad LR. An in vivo verification of the intravoxel incoherent motion effect in diffusion-weighted imaging of the abdomen. Magn Reson Med. 2010;64(6):1580–1585. | ||
Lee Y, Lee SS, Kim N, et al. Intravoxel incoherent motion diffusion-weighted MR imaging of the liver: effect of triggering methods on regional variability and measurement repeatability of quantitative parameters. Radiology. 2015;274(2):405–415. | ||
Cui Y, Zhang XP, Sun YS, Tang L, Shen L. Apparent diffusion coefficient: potential imaging biomarker for prediction and early detection of response to chemotherapy in hepatic metastases. Radiology. 2008;248(3):894–900. | ||
Morsbach F, Sah BR, Spring L, et al. Perfusion CT best predicts outcome after radioembolization of liver metastases: a comparison of radionuclide and CT imaging techniques. Eur Radiol. 2014;24(7):1455–1465. | ||
Reiner CS, Morsbach F, Sah BR, et al. Early treatment response evaluation after yttrium-90 radioembolization of liver malignancy with CT perfusion. J Vasc Interv Radiol. 2014;25(5):747–759. |
 © 2016 The Author(s). This work is published and licensed by Dove Medical Press Limited. The full terms of this license are available at https://www.dovepress.com/terms.php and incorporate the Creative Commons Attribution - Non Commercial (unported, v3.0) License.
By accessing the work you hereby accept the Terms. Non-commercial uses of the work are permitted without any further permission from Dove Medical Press Limited, provided the work is properly attributed. For permission for commercial use of this work, please see paragraphs 4.2 and 5 of our Terms.
© 2016 The Author(s). This work is published and licensed by Dove Medical Press Limited. The full terms of this license are available at https://www.dovepress.com/terms.php and incorporate the Creative Commons Attribution - Non Commercial (unported, v3.0) License.
By accessing the work you hereby accept the Terms. Non-commercial uses of the work are permitted without any further permission from Dove Medical Press Limited, provided the work is properly attributed. For permission for commercial use of this work, please see paragraphs 4.2 and 5 of our Terms.