")
Back to Journals » International Journal of Chronic Obstructive Pulmonary Disease » Volume 15
The Value of FENO Measurement for Predicting Treatment Response in Patients with Acute Exacerbation of Chronic Obstructive Pulmonary Disease
Authors Zhou A, Zhou Z, Deng D, Zhao Y, Duan J , Cheng W , Liu C, Chen P
Received 22 May 2020
Accepted for publication 31 August 2020
Published 24 September 2020 Volume 2020:15 Pages 2257—2266
DOI https://doi.org/10.2147/COPD.S263673
Checked for plagiarism Yes
Review by Single anonymous peer review
Peer reviewer comments 2
Editor who approved publication: Dr Richard Russell
Aiyuan Zhou,1,2 Zijing Zhou,1,2 Dingding Deng,3 Yiyang Zhao,1,2 Jiaxi Duan,1,2 Wei Cheng,1,2 Cong Liu,1,2 Ping Chen1,2
1Department of Respiratory Medicine, The Second Xiangya Hospital, Central South University, Changsha, Hunan 410011, People’s Republic of China; 2Research Unit of Respiratory Disease, Central South University, Changsha, Hunan 410011, People’s Republic of China; 3Department of Respiratory Medicine, The First Affiliated People’s Hospital, Shaoyang College, Shaoyang, Hunan 422000, People’s Republic of China
Correspondence: Ping Chen
Department of Respiratory Medicine, The Second Xiangya Hospital, Central South University, Changsha, Hunan 410011, People’s Republic of China
Email [email protected]
Background: Fractional exhaled nitric oxide (FENO) has been shown to be a marker of airway inflammation in various pulmonary diseases, including chronic obstructive pulmonary disease (COPD). In this study, we assessed the FENO level in patients with acute exacerbations of COPD (AECOPD) and analyzed the predictive value of the FENO level for treatment response.
Methods: Demographic data were collected at admission. FENO, lung function, blood gases, COPD Assessment Test (CAT), and modified Medical Research Council (mMRC) scores were measured at admission and on day 7. At the second visit, the patients were asked to report their health status; scores ranged from 1 to 5, representing “much better”, “slightly better”, “no change”, “slightly worse”, and “much worse”, respectively. The treatment response was evaluated based on the patient’s reported health status (responders were those who reported much better and slightly better) and lung function (responders were those who presented an increase in FEV1 over 200 mL).
Results: A total of 182 patients were recruited into the analysis. The FENO level positively correlated with an increase in FEV1 and FEV1% (r = 0.291, p < 0.001 and r = 0.205, p = 0.005, respectively), but negatively correlated with a decrease in the COPD Assessment Test (CAT) score (r = − 0.197, p = 0.008) and patient-reported health status (rho = − 0.408, p< 0.001). An inverse correlation was observed between FENO concentrations at admission and the length of hospital stay. The cut-off point for differentiating responders, identified by health status, was 18 ppb, with the sensitivity being 89.7% and specificity 88.9%.
Conclusion: FENO levels, determined at hospital admission, are potential to predict the overall treatment response in AECOPD patients, including remission in subjective patient-reported health statuses and, also, improvements in lung function.
Registry Number: ChiCTR-ROC-16,009,087 (http://www.chictr.org.cn/).
Keywords: COPD, exacerbation, FENO, lung function, treatment response
Background
Exacerbation is an important life-threatening event for patients with chronic obstructive pulmonary disease (COPD).1,2 It can accelerate deterioration of the disease,3,4 and lead to a heavy economic burden.5 It is reported that hospital expenditure accounts for roughly 45–50% of the total direct cost generated by COPD patients.6 Identifying biomarkers for predicting the prognosis of AECOPD patients is helpful for COPD management.
Fractional exhaled nitric oxide (FENO) measurement has been considered to be a surrogate for airway eosinophilic inflammation, which is widely used to predict the response to inhaled corticosteroids (ICS) in asthma.7–10 As we all know, AECOPD shows obvious heterogeneity in airway inflammation: some cases are neutrophil dominated, whereas others are eosinophil dominated, mixed granulocytic or paucigranulocytic.11 It has been shown that high eosinophil levels correlate with a better response to ICS in COPD.12 As an alternative to the eosinophil level, it has been demonstrated that FENO is a good measurement for discriminating eosinophilic COPD.13 Nevertheless, the usefulness of FENO measurements in AECOPD patients in clinical practice is still unclear.
There is no gold standard for defining responders in clinical practice. In some studies, changes in FEV1 are always monitored as the main outcome and used to assess the response to treatment in stable COPD.14,15 An increase in FEV1 over 200 mL is regarded as a significant improvement in health status, and these patients are usually defined as responders.16 Meanwhile, some studies use patient-reported health status to evaluate treatment response.17 The health status data are usually obtained after treatment, ranging from “much better” to “much worse”. The responders are considered to be those who report much better and slightly better. In this study, we use both methods to assess treatment response to determine the role of FENO measurement in predicting the overall therapeutic effect in patients with AECOPD.
Methods
This research was approved by the local Ethics Committee of the Second Xiangya Hospital of Central South University and First Affiliated People’s Hospital of Shaoyang College and was conducted in accordance with the Declaration of Helsinki and its amendments. All subjects gave written informed consent to participate in the study. The study was registered in the Chinese Clinical Trial Registry (ChiCTR-ROC-16,009,087; http://www.chictr.org.cn/).
Study Subjects
Patients with clinician-diagnosed AECOPD were recruited from the Second Xiangya Hospital of Central South University and First Affiliated People’s Hospital of Shaoyang College from September 2016 to December 2019. Patients with a primary diagnosis of AECOPD and aged over 40 years were recruited into the study. Those who had a history of asthma or other respiratory diseases (lung cancer, pulmonary thromboembolism, bronchiectasis, interstitial lung disease), severe heart failure (myocardial infarction, New York Heart Association stage IV) or malignant comorbidities were excluded from the study. The Global Initiative for Asthma (GINA) 2014 document was used to differentiate COPD from asthma and asthma-COPD overlap.18 In addition, patients with COPD exacerbation who had received systemic corticosteroids prior to hospitalization were also excluded. All diagnoses were established by the clinicians and independently verified by physicians specializing in respiratory medicine. The symptom scores at the second visit were used to classify patients into different groups (A, B, C, D) according to GOLD guideline.19 GOLD stages were established by the spirometry data obtained at the second visit. Exacerbation of COPD was defined as increased dyspnea, cough, or sputum (quality or quantity) that resulted in the subjects seeking medical care. Smokers were those who smoked tobacco every day and ex-smokers were those who stopped smoking at least 6 months prior to recruitment.
Study Design
Demographic data were collected at admission. FENO, lung function, blood gases, CAT, and mMRC were carried out at two time points: at hospital admission and on day 7, respectively. If the hospital stay was less than 7 days, the second round of measurements was performed at discharge. All measurements were obtained at the same period of the day. Treatment during hospitalization was determined by the clinicians based on the GOLD guidelines.19 In order to reduce the bias, almost all patients received similar treatment without violation of the GOLD document, all the patients received nebulized inhalation of ipratropium bromide and budesonide, but the type of antibiotic was determined by the clinicians. Treating clinicians were not directly involved in the study and were blinded to the results. Baseline measurements were performed before performing treatment for all patients. At the second visit, patient health status was divided into five groups based on a five-point Likert scale ranging from 1 to 5, representing “much better”, “slightly better”, “no change”, “slightly worse”, and “much worse”, respectively. Responders, based on patients-reported outcomes, were defined as those having a global rating of change in COPD since the last visit of “much better”, or “slightly better”; non-responders were defined as having a global rating of change in COPD since last visit of “no change,” “slightly worse” or “much worse”.20,21 Treatment response, assessed by lung function, defined responders as those who presented with an increase in FEV1 of more than 200 mL.16
Measurements
Measurement of FENO
In both hospitals, the FENO measurement was performed using a SUNVOU-CA2122 breath analyzer from SUNVOU company (Wuxi, China). SUNVOU-CA2122 has been widely used in China for several years. FENO levels measured by SUNVOU-CA2122 are closely related to that detected by NIOX VERO, which is used worldwide. To make sure the accuracy of FENO measurements and eliminate external interference, patients were asked to abstain from alcohol, coffee, chocolate, nitrate-rich foods (such as sausage, animal innards, lettuce, and spinach), strenuous exercise, tobacco and bronchodilators for 1 hour preceding the test. The testing process was conducted strictly in accordance with the guidelines recommended by the American Thoracic Society/European Respiratory Society and the manufacturer’s instructions. Briefly, the patients were asked to inhale deeply through the mouth to total lung capacity (TLC) and then to exhale through the mouthpiece guided by a visual animation at a constant flow rate of 50 mL/s. The required exhalation time was approximately 6 ∼ 10 s. The device displayed the results (in ppb) automatically once acceptable values were obtained.
Lung Function Tests
Lung function parameters were measured by a professional technician using an electronic spirometer (CHESTGRAPH HI-101), according to American Thoracic Society guidelines.
Measurement of Blood Gas Analysis
Blood gas parameters were determined using a blood gas analyzer (GEM Premier 3000), with 2 mL of arterial blood taken from the radial artery. Measurements were performed by a respiratory nurse on patients who had stopped inhalation of medical oxygen for 30 min.
Measurement of CAT and mMRC
These questionnaires were explained to the patients by clinicians and independently completed by the patients. The detailed protocol was discussed in our previously published paper.17
Statistical Analysis
Patient clinical characteristics were summarized descriptively. Continuous variables are presented as mean and standard deviation (if data were normally distributed) and median and interquartile range (IQR) values (if data were not normally distributed). Categorical variables were described as frequency rates and percentages. Means for continuous variables were compared by paired t-tests or ANOVA tests. Pearson, Spearman’s rank correlation coefficient and partial correlation method were used to analyze the relationship between different measurements. A receiver operating characteristic curve (ROC) was used to determine the cut-off point for predicting responders according to Youden index maximization principle. SPSS software version 25.0 and Medcalc were used for statistical analysis.
Results
Patient Demographic Characteristics
A flow chart of the study is shown in Figure 1. Initially, a total of 257 subjects with a primary diagnosis of AECOPD were screened in the study. Amongst these 257 subjects, 66 were excluded because of pneumonia (n = 28), lung cancer (n = 5), asthma (n = 15), interstitial lung disease (n = 2), bronchiectasis (n=4), severe heart failure (n = 7) or accepting systemic corticosteroids before admission (n = 5). During exacerbation, 9 patients failed to complete the second measurements of lung function. Among these 9 patients, 7 failed to complete the second lung function because of severe dyspnea and 2 dropped out due to unwillingness to perform the tests again. Thus, 182 patients were recruited to the final analysis. Demographic and clinical data are presented in Table 1. The mean age of the patients was 66.57 ± 12.09 years, with 92.90% males and 7.10% females. Among the included patients, 48 were current smokers and 134 were ex-smokers. Almost all patients received similar treatment (antibiotic + theophylline + nebulized inhalation of bronchodilators and corticosteroids) based on the Global Initiative of Chronic Obstructive Lung Disease (GOLD) document. Among 182 subjects, 13 were grouped into A and C, 169 were classified into B and D. Most of the patients were in the high symptoms group (CAT > 10, 97.26%; mMRC > 1, 97.80%) and were observed to be GOLD stage III or IV (58.79% and 29.12%, respectively). The mean hospital stay was 8.37 ± 2.66 days (Table 1).
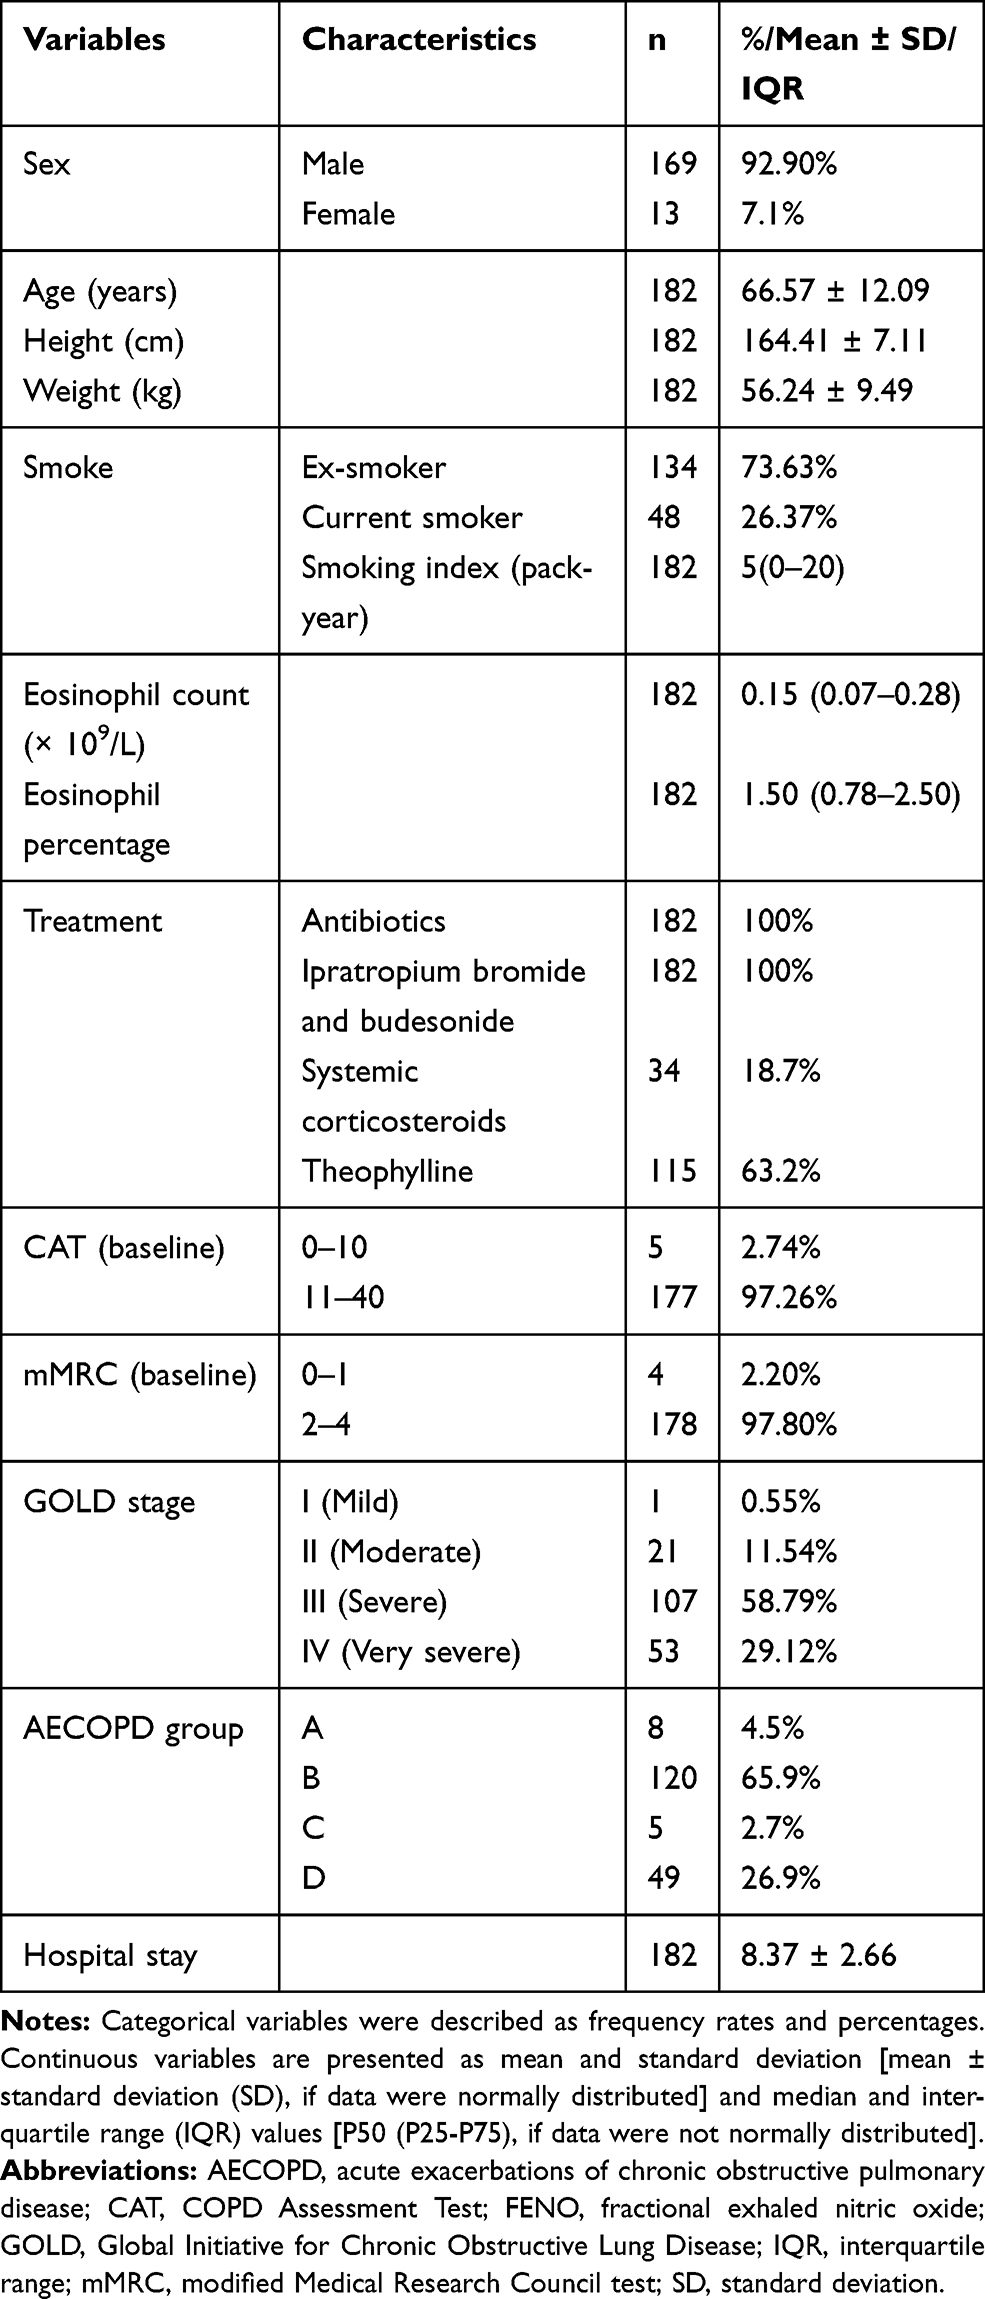 |
Table 1 Demographic and Clinical Characteristics of Patients |
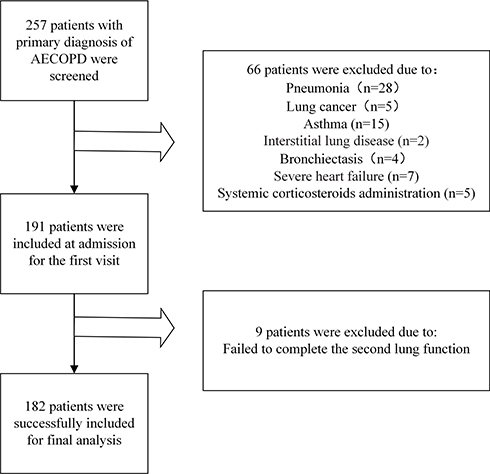 |
Figure 1 Study flow chart. A total of 257 subjects with a primary diagnosis of AECOPD were screened; 66 patients were excluded because of pneumonia (n = 28), lung cancer (n = 5), asthma (n =15), bronchiectasis (n =4), interstitial lung disease (n = 2), severe heart failure (n = 7) and accepting systemic corticosteroids before admission (n = 5). During exacerbation, 9 patients failed to complete the second measurements of lung function. 182 subjects were recruited to the final analysis. |
Changes in Main Parameters Between the Two Visits
All the main parameters improved significantly. The levels of FEV1, FEV1%, and PaO2 improved from 0.93 ± 0.35 L to 1.07 ± 0.41L; 37.51 ± 14.72% to 43.14 ± 17.17%; and 66.05 ± 11.87 mmHg to 75.73 ± 10.95 mmHg, respectively. The CAT, mMRC and PaCO2 scores at the second visit all decreased significantly when compared with the baseline at admission; Statistical differences were observed between the two visits for all the above parameters (Table 2).
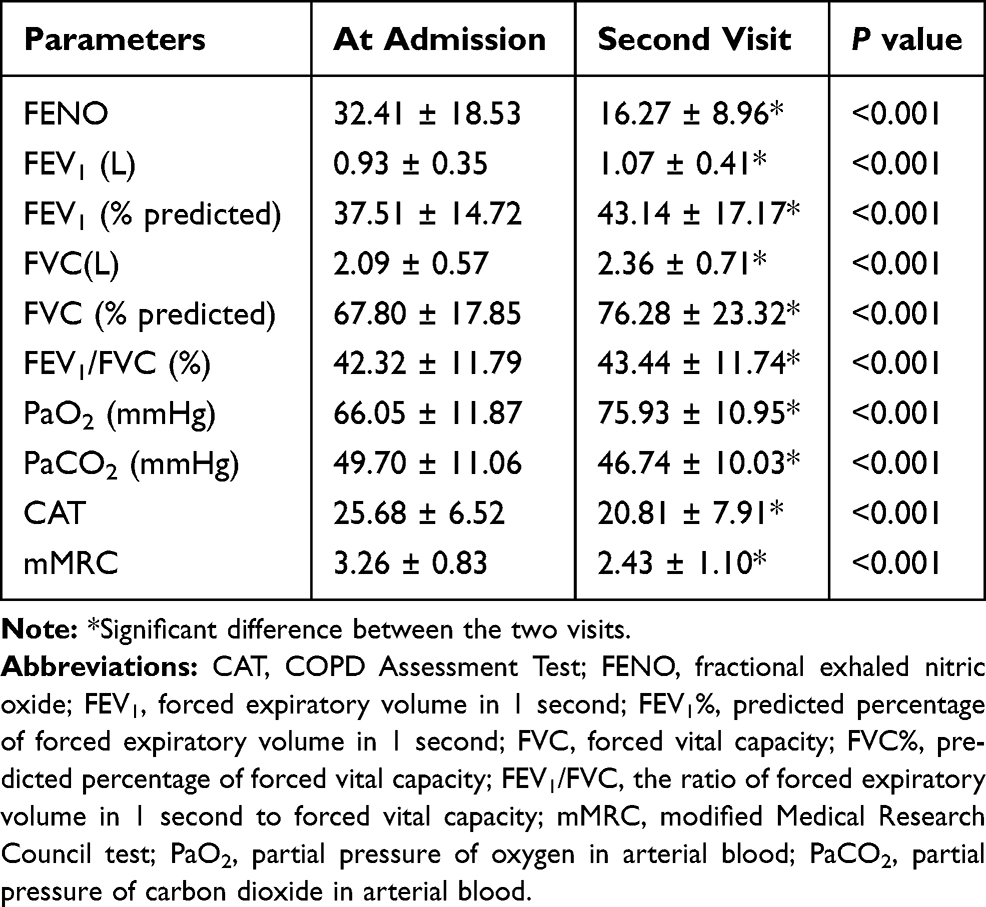 |
Table 2 Changes in Main Parameters Between the Two Visits |
The Correlation Between FENO Level and Health Status
The majority (80.22%, n = 146) of AECOPD patients reported an improved health status at the second visit. Of the 146 patients, 83 (45.60%) reported feeling much better and 63 (34.62%) reported feeling slightly better. Based on the definition of patient-reported non-responders, 36 patients were grouped into non-responders, with 16 patients reporting “no change”, 18 reporting feeling “slightly worse” and 2 reporting feeling “much worse”. Subjects who reported “much better” and “slightly better” presented with higher levels of FENO compared to those who reported “no change” and “slightly worse”; the FENO levels were 37.24 ± 16.25 ppb, 35.83 ± 20.39 ppb, 17.13 ± 8.54 ppb, and 13.61 ± 3.57 ppb, respectively (Figure 2A). A negative correlation was observed between FENO level at admission and health status (rho = −0.408, p < 0.001) (Figure 2B). The responders had a higher concentration of FENO than non-responders (36.63 ± 18.10 ppb vs 15.28 ± 6.55 ppb, p < 0.001) (Figure 2C). We did not observe significant correlation between FENO level obtained at admission and COPD severity classified by A, B, C, D groups. (rho = −0.04, p =0.60) (Figure 2D).
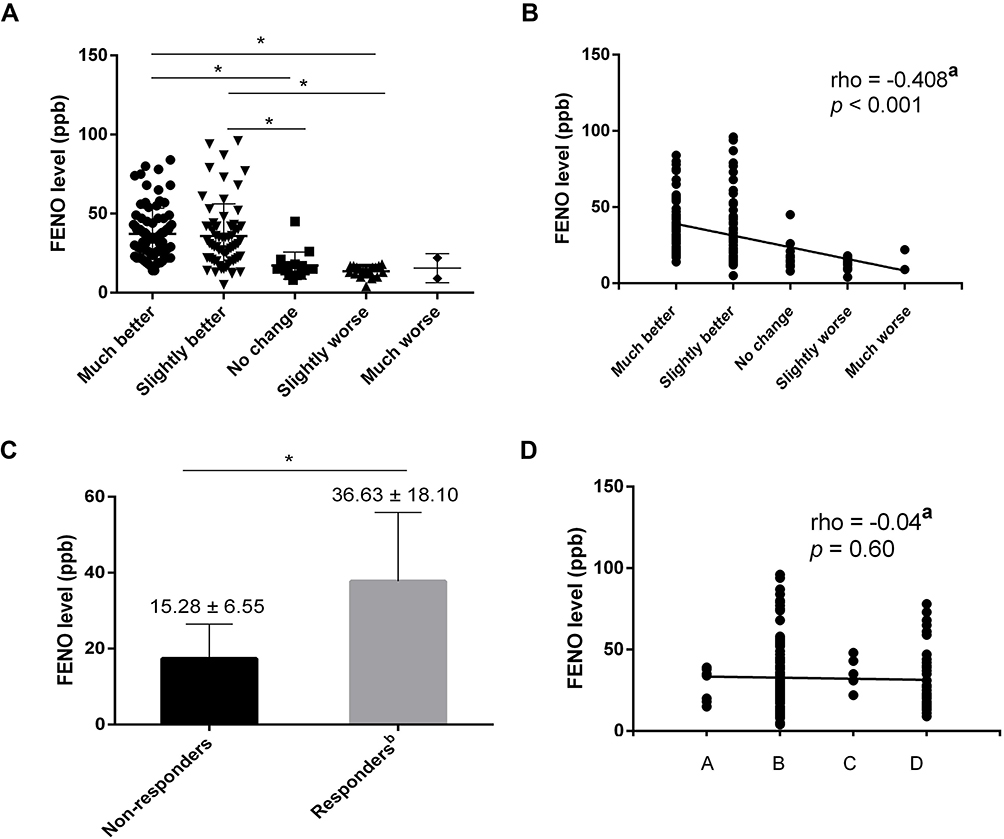 |
Figure 2 The correlation between FENO level determined at admission and health status. (A) Comparison of FENO level determined at admission among different patient-reported health statuses. (B) Correlation between FENO level obtained at admission and health status. (C) Comparison of FENO level between responders and non-responders. (D) Correlation between FENO level obtained at admission and disease severity classified by A, B, C, D groups. |
The Correlation Between FENO Level and Other Lab Findings
The FENO level was positively correlated with the increase in FEV1 and FEV1% (r = 0.291, p < 0.001 and r = 0.208, p = 0.005, respectively) (Figure 3A and B). There was no relationship between the FENO level determined at admission and changes in PaO2 or PaCO2 (r = 0.07, p = 0.38 and r = 0.05, p = 0.49, respectively) (Figure 3C and D). Taking FEV1 > 200mL as a criterion, only 57 responders were identified. The FENO concentration was higher in responders than in non-responders (41.86 ± 20.97 ppb vs 28.10 ± 15.59 ppb, p<0.001) (Figure 3E). We also analyzed the correlation between FENO values and blood eosinophil count determined at admission and found that they were positively correlated (r = 0.37, p < 0.001) (Figure 3F).
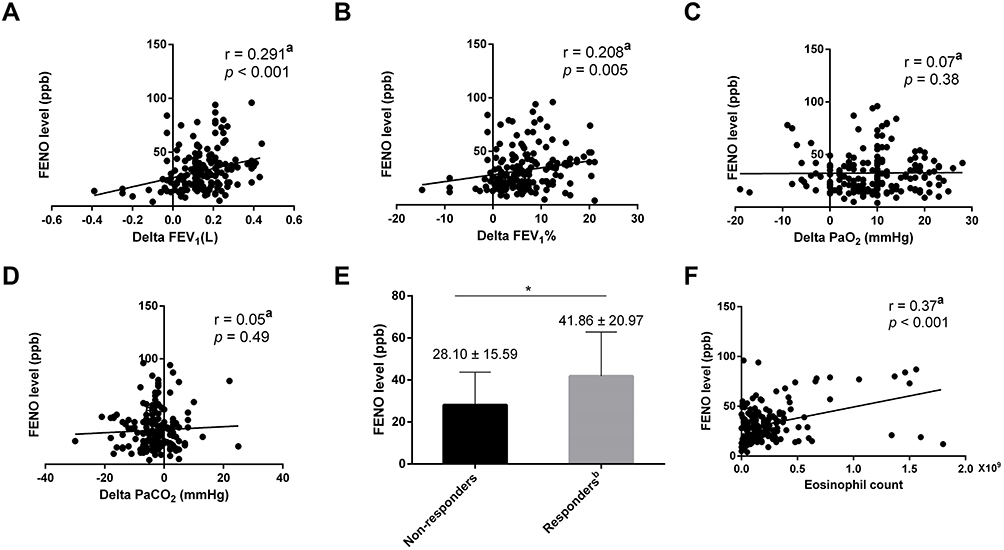 |
Figure 3 The correlation between FENO level and other lab findings. (A) Relationship between FENO level detected at admission and changes in FEV1. (B) Relationship between FENO level detected at admission and changes in FEV1%. (C) Correlation between FENO level measured at admission and changes in PaO2. (D) Correlation between FENO level measured at admission and changes in PaCO2. (E) Comparison of FENO level between responders and non-responders. (F) Association between FENO level measured at admission and blood eosinophil count. |
Correlation Between FENO Level and Questionnaire Scores and Hospital Stay
We found that FENO concentration was inversely correlated with changes in the CAT score (r = −0.197, p = 0.008) (Figure 4A). However, no significant correlation was observed between FENO level at admission and changes in the mMRC score (r = −0.02, p = 0.57) (Figure 4B). There was a negative correlation between the length of hospital stay and FENO level at admission (r = −0.18, p = 0.02) (Figure 4C).
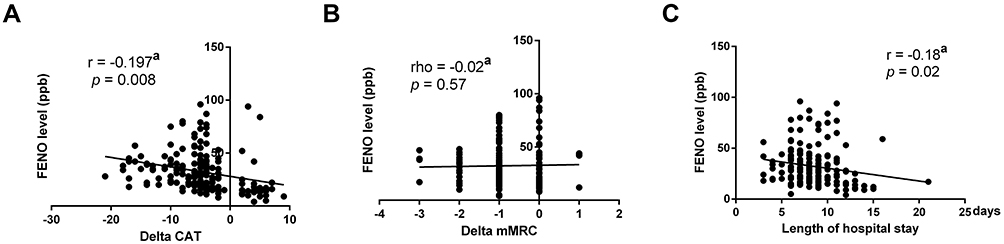 |
Figure 4 The correlation between FENO, questionnaire score and hospital stay. (A) Relationship between FENO level detected at admission and changes in CAT. (B) Relationship between FENO level detected at admission and changes in mMRC. (C) Association between FENO level measured at admission and length of hospital stay. |
Cut-off Point of FENO to Differentiate Responders
The responders were assessed by both patient self-reported health status and lab findings (FEV1). For patient-reported health status, the cut-off point of FENO to differentiate responders from non-responders was 18 ppb, with a sensitivity of 89.7% and a specificity of 88.9%, the area under the curve (AUC) was 0.922 (95% confidence interval was 0.873–0.956) (Figure 5A). Based on the criterion of an increase in FEV1 > 200 mL, the cut-off point for FENO level was 30 ppb; sensitivity was 73.68% and specificity was 67.2%, the AUC was 0.711 (95% confidence interval: 0.640–0.776) (Figure 5B).
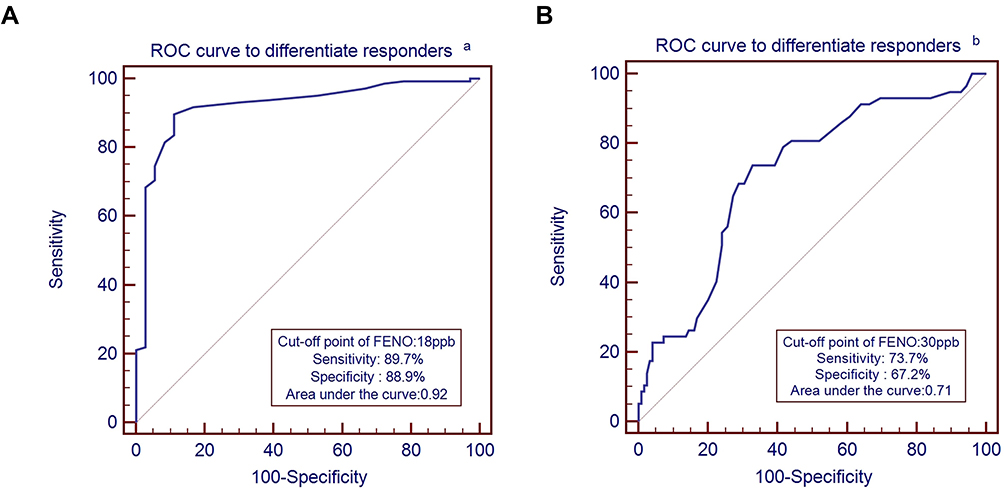 |
Figure 5 Cut-off point of FENO level measured at admission for predicting responders. (A) Cut-off point of FENO level at admission for predicting patient-reported health status identified responders. (B) Cut-off point of FENO level detected at admission for predicting responders identified by improvement in FEV1. |
Discussion
In this longitudinal study, we assessed the value of measuring FENO at admission of AECOPD patients. The study demonstrated that FENO concentrations at admission were related to improvements in FEV1 and patients’ self-reported outcome, suggesting that FENO may predict the response to therapy in patients with AECOPD.
FENO has been recognized as an alternative biomarker of eosinophil, and as asthma is a disease predominated by eosinophil inflammation,22 FENO has been widely used to predict treatment responses. In fact, FENO measurement is recommended to predict asthma severity and the response to Inhaled Corticosteroids (ICS).8,23,24 Since COPD is a heterogeneous disease, some patients are also eosinophil predominated; thus, FENO measurement has also proven useful in COPD management.25,26 Some studies have found that FENO levels are increased in AECOPD,27,28 but the usefulness of FENO measurements and the clinical relevance of these findings remain limited.
In this study, we used both patient-reported health status and improvements in FEV1 to assess treatment response to determine the role of FENO measurements in predicting the overall therapeutic effect in patients with AECOPD. As in a previous study,16 we were unable to detect any consistent relationship between FENO concentration and COPD severity. However, we found that FENO levels measured at admission positively correlated with improvements in FEV1. Interestingly, we also demonstrated that FENO values were negatively related to patient-reported health status, suggesting that patients with a higher level of FENO may have a better prognosis. This may be explained by the good correlation between FENO and eosinophil,29,30 which is also confirmed in this study. It has been shown that patients with higher eosinophil counts experience better clinical outcomes,31 and this is consistent with the findings in our study.
Patient-reported outcomes had a moderate correlation with improvements in FEV1, suggesting that both measurements can provide prognostic information for physicians to better manage AECOPD patients. However, there were only 57 responders at the second visit when taking an increase in FEV1 > 200 mL as a criterion. Given that the mean length of hospital stay was 8.37 ± 2.66 days, obviously, most of the patients were thought to be have met the discharge criteria at the second visit, indicating that an increase in FEV1 > 200 mL is too strict for identifying responders. For some severe patients, it is impossible to get such a huge improvement; if clinicians take this standard into their clinical work, it will dramatically increase the mean hospital stay, economic cost, and risk of nosocomial infections. Conversely, the patient-reported health status identified 146 responders at the second visit, and this is more consistent with the real world in clinical practice. In our previous study, we demonstrated that changes in CAT could evaluate the evolution of health status in patients with AECOPD.17 We also found that FENO was correlated with changes in CAT; patients with a higher FENO level had a greater improvement in CAT score, indicating that FENO is a good biomarker for predicting the treatment response of AECOPD patients not only based on objective lab findings or subjective questionnaires. This study also demonstrated that patients with higher FENO levels at the onset of the exacerbation were discharged home earlier. This is reasonable, as a better functional response and a better health status is usually associated with a more rapid clinical recovery.
The ROC curve analysis was performed to determine the cut-off point of FENO to identify responders. The cut-off point varied according to different criteria for differentiating responders—it was 18.0 ppb for responders identified by patient-reported health status and 30.0 ppb for responders determined by FEV1. In Antus’ study, the authors used an increase in FEV1 over 200 mL as the criterion, and the cutoff point for optimum predictive accuracy was 26.8 ppb, roughly in agreement with the findings of our study. As discussed above, it seems that the evolution of patient-reported health status may be more in line with the real clinical situation and, as such, taking 18.0 ppb as cut-off point may be more useful in clinical practice.
We acknowledge that this study has some limitations. First, we did not have the FENO baseline data before exacerbation, and this would have provided a more meaningful assessment of the role of FENO in patients with AECOPD. However, compared with the FENO level of stable COPD published in other studies, it seems that FENO was increased at exacerbations. Second, as outcome variables, patient-reported health status and hospital stay are not only influenced by treatment response but also by a number of other factors, including the economic situations of the patients and the discretion of the physician. However, we found the changes in FEV1 were closely associated with patient status, and despite the lack of standardized criteria for hospital discharge, we still observed a negative correlation between FENO levels and the length of hospital stay. Finally, there were some biases of the sample size among each group, especially for “much worse” group, but that is reasonable, most of the patients recovered with professional treatment, only a small portion of patients would be even worse. The total number of non-responders identified by patient-reported health status is 36, it fits the minimum number for performing t-test between responders and non-responders. To better investigate the role of FENO in patients with AECOPD, a multicentre study with large sample size is worthy to be performed in the future.
Conclusion
FENO levels determined at hospital admission are potential to predict the overall treatment response in AECOPD patients, as determined by both improvements in patient-reported health status and also functional changes (FEV1).
Abbreviations
AECOPD, acute exacerbation of chronic obstructive pulmonary disease; AUC, area under the curve; CAT, COPD Assessment Test; COPD, chronic obstructive pulmonary disease; FENO, fractional exhaled nitric oxide; FEV1, forced expiratory volume in 1 second; FVC, forced vital capacity; FEV1/FVC, the ratio of forced expiratory volume in 1 second to forced vital capacity; GOLD, Global Initiative for Chronic Obstructive Lung Disease; ICS, inhaled corticosteroids; mMRC, modified Medical Research Council test; PaCO2, partial pressure of carbon dioxide in arterial blood; PaO2, partial pressure of oxygen in arterial blood; ROC, receiver operating characteristic; SD, standard deviation.
Data Sharing Statement
The authors confirm that the data supporting the findings of this study are available within the article. The datasets used and/or analyzed during the current study are available from the corresponding author on reasonable request, and the authors will not share any individual de-identified participant data or other relevant study documents.
Ethics Approval and Consent to Participate
The research protocol was approved by the local Ethics Committee of the Second Xiangya Hospital of Central South University (approval number: zay0410) and the First Affiliated People’s Hospital of Shaoyang College (number: C2016123). This study was conducted in accordance with the Declaration of Helsinki and its amendments. All subjects gave written informed consent to participate in the study.
Acknowledgments
This work was supported by grants from the National Natural Science Foundation of China (NSFC Grant 81770046 and 81970044 to Prof. Ping Chen) and the Fundamental Research Funds for the Central Universities of Central South University (Grant 2017zzts228 to Dr Aiyuan Zhou).
Author Contributions
All authors made a significant contribution to the work reported, whether that is in the conception, study design, execution, acquisition of data, analysis and interpretation, or in all these areas; took part in drafting, revising or critically reviewing the article; gave final approval of the version to be published; have agreed on the journal to which the article has been submitted; and agree to be accountable for all aspects of the work.
Disclosure
None of the authors have a conflict of interest that could have affected this work.
References
1. Vogelmeier CF, Criner GJ, Martinez FJ, et al. Global strategy for the diagnosis, management, and prevention of chronic obstructive lung disease 2017 report. GOLD executive summary. Am J Respir Crit Care Med. 2017;195:557–582. doi:10.1164/rccm.201701-0218PP
2. Groenewegen KH, Schols AM, Wouters EF. Mortality and mortality-related factors after hospitalization for acute exacerbation of COPD. Chest. 2003;124:459–467.
3. Celli BR, Thomas NE, Anderson JA, et al. Effect of pharmacotherapy on rate of decline of lung function in chronic obstructive pulmonary disease: results from the TORCH study. Am J Respir Crit Care Med. 2008;178:332–338. doi:10.1164/rccm.200712-1869OC
4. Makris D, Moschandreas J, Damianaki A, et al. Exacerbations and lung function decline in COPD: new insights in current and ex-smokers. Respir Med. 2007;101:1305–1312. doi:10.1016/j.rmed.2006.10.012
5. Punekar YS, Shukla A, Mullerova H. COPD management costs according to the frequency of COPD exacerbations in UK primary care. Int J Chron Obstruct Pulmon Dis. 2014;9:65–73. doi:10.2147/COPD.S54417
6. Guarascio AJ, Ray SM, Finch CK, Self TH. The clinical and economic burden of chronic obstructive pulmonary disease in the USA. Clinicoecon Outcomes Res. 2013;5:235–245.
7. Malinovschi A, Van Muylem A, Michiels S, Michils A. FeNO as a predictor of asthma control improvement after starting inhaled steroid treatment. Nitric Oxide. 2014;40:110–116. doi:10.1016/j.niox.2014.06.009
8. Neelamegan R, Saka V, Tamilarasu K, et al. Clinical utility of Fractional exhaled nitric oxide (FeNO) as a biomarker to predict severity of disease and response to Inhaled corticosteroid (ICS) in asthma patients. J Clin Diagn Res. 2016;10:FC01–FC06.
9. Price DB, Buhl R, Chan A, et al. Fractional exhaled nitric oxide as a predictor of response to inhaled corticosteroids in patients with non-specific respiratory symptoms and insignificant bronchodilator reversibility: a randomised controlled trial. Lancet Respir Med. 2018;6:29–39. doi:10.1016/S2213-2600(17)30424-1
10. Gao J, Wu F. Association between fractional exhaled nitric oxide, sputum induction and peripheral blood eosinophil in uncontrolled asthma. Allergy Asthma Clin Immunol. 2018;14:21.
11. Gao P, Zhang J, He X, et al. Sputum inflammatory cell-based classification of patients with acute exacerbation of chronic obstructive pulmonary disease. PLoS One. 2013;8:e57678. doi:10.1371/journal.pone.0057678
12. Pascoe S, Locantore N, Dransfield MT, Barnes NC, Pavord ID. Blood eosinophil counts, exacerbations, and response to the addition of inhaled fluticasone furoate to vilanterol in patients with chronic obstructive pulmonary disease: a secondary analysis of data from two parallel randomised controlled trials. Lancet Respir Med. 2015;3:435–442. doi:10.1016/S2213-2600(15)00106-X
13. Gao J, Zhang M, Zhou L, et al. Correlation between fractional exhaled nitric oxide and sputum eosinophilia in exacerbations of COPD. Int J Chron Obstruct Pulmon Dis. 2017;12:1287–1293. doi:10.2147/COPD.S134998
14. Vestbo J, Anderson W, Coxson HO, et al. Evaluation of COPD Longitudinally to Identify Predictive Surrogate End-points (ECLIPSE). Eur Respir J. 2008;31(4):869–873. doi:10.1183/09031936.00111707
15. Li X, Zhou Y, Chen S, et al. Early intervention with tiotropium in Chinese patients with GOLD stages I–II chronic obstructive pulmonary disease (Tie-COPD): study protocol for a multicentre, double-blinded, randomised, controlled trial. BMJ Open. 2014;4(2):e003991. doi:10.1136/bmjopen-2013-003991
16. Antus B, Barta I, Horvath I, Csiszer E. Relationship between exhaled nitric oxide and treatment response in COPD patients with exacerbations. Respirology. 2010;15:472–477. doi:10.1111/j.1440-1843.2010.01711.x
17. Zhou A, Zhou Z, Peng Y, et al. The role of CAT in evaluating the response to treatment of patients with AECOPD. Int J Chron Obstruct Pulmon Dis. 2018;13:2849–2858. doi:10.2147/COPD.S175085
18. Global Initiative for Asthma and Global Initiative for Chronic Obstructive Pulmonary Disease. Diagnosis and initial treatment of asthma, COPD, and asthma-COPD overlap. 2014. Available from: http://ginasthma.org.
19. Global Initiative for Chronic Obstructive Lung Disease(GOLD). Global strategy for the diagnosis, management, and prevention of chronic obstructive pulmonary disease. 2017. Available from: http://goldcopd.org/.
20. Jones PW, Harding G, Wiklund I, et al. Tests of the responsiveness of the COPD assessment test following acute exacerbation and pulmonary rehabilitation. Chest. 2012;142(1):134–140. doi:10.1378/chest.11-0309
21. Hossack T, Woo H. Validation of a patient reported outcome questionnaire for assessing success of endoscopic prostatectomy. Prostate Int. 2014;2(4):182–187. doi:10.12954/PI.14066
22. Possa SS, Leick EA, Prado CM, Martins MA, Tiberio IFLC. Eosinophilic inflammation in allergic asthma. Front Pharmacol. 2013;4:46. doi:10.3389/fphar.2013.00046
23. Verini M, Consilvio NP, Di Pillo S, et al. FeNO as a marker of airways inflammation: the possible implications in childhood asthma management. J Allergy (Cairo). 2010;2010.
24. Rao DR, Phipatanakul W. An overview of fractional exhaled nitric oxide and children with asthma. Expert Rev Clin Immunol. 2016;12:521–530. doi:10.1586/1744666X.2016.1141049
25. Chen FJ, Huang XY, Liu YL, Lin GP, Xie CM. Importance of fractional exhaled nitric oxide in the differentiation of asthma-COPD overlap syndrome, asthma, and COPD. Int J Chron Obstruct Pulmon Dis. 2016;11:2385–2390. doi:10.2147/COPD.S115378
26. Wu Y-K, Su W-L, Huang C-Y, et al. Treatment of chronic obstructive pulmonary disease in patients with different fractional exhaled nitric oxide levels. Medicine (Baltimore). 2018;97(47):e11922. doi:10.1097/MD.0000000000011922
27. Bhowmik A, Seemungal TA, Donaldson GC, Wedzicha JA. Effects of exacerbations and seasonality on exhaled nitric oxide in COPD. Eur Respir J. 2005;26:1009–1015. doi:10.1183/09031936.05.00047305
28. Agusti AG, Villaverde JM, Togores B, Bosch M. Serial measurements of exhaled nitric oxide during exacerbations of chronic obstructive pulmonary disease. Eur Respir J. 1999;14:523–528. doi:10.1034/j.1399-3003.1999.14c08.x
29. Rio Ramirez MT, Juretschke Moragues MA, Fernandez Gonzalez R, et al. Value of exhaled nitric oxide (FeNO) and eosinophilia during the exacerbations of chronic obstructive pulmonary disease requiring hospital admission. COPD. 2018;15:369–376. doi:10.1080/15412555.2018.1482532
30. Tashkin DP, Wechsler ME. Role of eosinophils in airway inflammation of chronic obstructive pulmonary disease. Int J Chron Obstruct Pulmon Dis. 2018;13:335–349. doi:10.2147/COPD.S152291
31. Wu HX, Zhuo KQ, Cheng DY. Peripheral blood eosinophil as a biomarker in outcomes of acute exacerbation of chronic obstructive pulmonary disease. Int J Chron Obstruct Pulmon Dis. 2019;14:3003–3015. doi:10.2147/COPD.S226783
 © 2020 The Author(s). This work is published and licensed by Dove Medical Press Limited. The full terms of this license are available at https://www.dovepress.com/terms.php and incorporate the Creative Commons Attribution - Non Commercial (unported, v3.0) License.
By accessing the work you hereby accept the Terms. Non-commercial uses of the work are permitted without any further permission from Dove Medical Press Limited, provided the work is properly attributed. For permission for commercial use of this work, please see paragraphs 4.2 and 5 of our Terms.
© 2020 The Author(s). This work is published and licensed by Dove Medical Press Limited. The full terms of this license are available at https://www.dovepress.com/terms.php and incorporate the Creative Commons Attribution - Non Commercial (unported, v3.0) License.
By accessing the work you hereby accept the Terms. Non-commercial uses of the work are permitted without any further permission from Dove Medical Press Limited, provided the work is properly attributed. For permission for commercial use of this work, please see paragraphs 4.2 and 5 of our Terms.