")
Back to Journals » International Journal of Nanomedicine » Volume 15
The Use of Near-Infrared Light-Emitting Fluorescent Nanodiamond Particles to Detect Ebola Virus Glycoprotein: Technology Development and Proof of Principle
Authors Feuerstein GZ, Mansfield MA , Lelkes PI , Alesci S, Marcinkiewicz C, Butlin N , Sternberg M
Received 9 May 2020
Accepted for publication 10 August 2020
Published 7 October 2020 Volume 2020:15 Pages 7583—7599
DOI https://doi.org/10.2147/IJN.S261952
Checked for plagiarism Yes
Review by Single anonymous peer review
Peer reviewer comments 2
Editor who approved publication: Prof. Dr. Anderson Oliveira Lobo
Giora Z Feuerstein,1 Michael A Mansfield,2 Peter I Lelkes,3 Salvatore Alesci,1 Cezary Marcinkiewicz,1,3 Nathan Butlin,4 Mark Sternberg1
1Debina Diagnostics Inc., Newtown Square, PA, USA; 2MilliporeSigma, Bedford, MA, USA; 3Department of Bioengineering, Temple University, Philadelphia, PA, USA; 4Axxin Pty Ltd, Fairfield, VIC, Australia
Correspondence: Giora Z Feuerstein
Debina Diagnostics Inc., Newtown Square, PA, USA
Tel +1 4842221575
Email [email protected]
Background: There is a dire need for rapid diagnostic tests of high sensitivity, efficiency, and point-of-test reporting capability to mitigate lethal viral epidemic outbreaks.
Purpose: To develop a new operating system within the lateral flow assay (LFA) format for Ebola virus (EBOV), based on fluorescent nanodiamond particles (FNDP) nitrogen vacancy (NV) emitting near-infrared (NIR) light. Specifically, we aimed to detail technical issues and the feasibility of mobilizing FNDP-NV on nitrocellulose membranes (NCM) and capturing them at test and control lines.
Methods: FNDP-NV-200nm, 400nm or 800nm were linked to anti-EBOV glycoprotein (GP) monoclonal antibodies (mAb) and tested for LFA performance by monitoring NIR emissions using an in vivo imaging system or optoelectronic device (OED). Anti-EBOV recombinant glycoprotein (GP) humanized mAb c13C6 was linked to FNDP-NV-200nm for the mobile phase; and a second anti-GP mouse mAb, 6D8, was printed on NCM at the test line. Goat anti-human IgG (GAH-IgG) served as a nonspecific antibody for conjugated FNDP-NV-200nm at the control line.
Results: FNDP-NV-200nm-c13C6 specifically and dose-dependently bound to recombinant EBOV GP in vitro and was effectively captured in a sandwich configuration at the test line by mAb 6D8. FNDP-NV-200nm-c13C6 was captured on the control line by GAH-IgG. The OED quantitative analysis of NIR (obtained in less than 1 minute) was further validated by an in vivo imaging system.
Conclusion: FNDP-NV-200nm performance as a reporter for EBOV GP rapid diagnostic tests suggests an opportunity to replace contemporary visual tests for EBOV GP and other highly lethal viral pathogens. Mobile, battery-operated OED adds portability, quantitative data, rapid data collection, and point-of-test reporting capability. Further development of FNDP-NV-200nm within a LFA format is justified.
Keywords: Ebola virus, diagnostic lateral flow test, LFA, opto-electronic reader, OER, anti-EBOV antibodies, nitrocellulose membranes, fluidics technology
Introduction
Hemorrhagic fever viruses (HFVs) have been known over 40 years as a major cause of morbidity and mortality in certain regions of the world.1–3 In the West Africa region occasional and Central Africa repeated EBOV outbreaks have devastated communities and continue to harbor global pandemic risk.2–4 Despite large efforts by local governments, the international community, and the World Health Organization, Ebola virus (EBOV) outbreaks remain frequent.5–9 Efforts to develop effective EBOV diagnostic tests and therapeutics have so far yielded mixed results.4
A crucial factor in combating HFV outbreaks is early diagnosis and quarantine of suspected carriers at preclinical infective stages. To this end, proper surveillance systems in regions of high risk must be in place for the rapid mobilization of health authorities during a potential viral outbreak. The lack of diagnostic and surveillance tools that could have accelerated preventative measures are considered to be an important factor in high mortality (60–90%) documented during the recent EBOV epidemic in 2014–2016, in West Africa.6–9 Taken together, a dire need for early diagnostic and surveillance tests of superior sensitivity that can be reported from the point-of-test is still unfulfilled.9–12
In the search for solutions that can address the shortfalls of contemporary EBOV diagnostic and surveillance tests, especially in regard with test sensitivity, we believe transformative changes in the lateral flow assay (LFA) are necessary. Contemporary colorimetric EBOV LFA require direct visual inspection of the strip, which is insufficiently sensitive, only qualitative, and susceptible to interference by sample discoloration. Fluorescent technology is viewed to be superior in sensitivity over colorimetric methods.13,14 Therefore, we considered organic fluorophores, quantum dots (QD), and fluorescent minerals as substitutes for colored particles in LFA.
Organic fluorophores have broad and diverse utilities for imaging and diagnostic tests. However, rapid photo blinking, photo bleaching, and concomitant reduction in fluorescence intensity (especially problematic when using an intense light source for excitation) limit their use in respect to study duration, image resolution, and signal reproducibility.15 For QD probes, advantages include prolonged emission signals and tunable wavelengths.16 QD have already been utilized in diagnostic tests for infectious diseases17,18 at a sensitivity of 0.4 pg./mL for H1N1.19
For the reasons listed above and our own experience in developing medical capabilities built on FNDP-NV21,22 our choice for a new reporter particle for LFA is FNDP-NV. This type of nanodiamond exhibits robust NIR emission without photo bleaching, exquisite stability, and superior material durability.23–25 The NIR fluorescence emitted by these particles is amenable to quantitation by optoelectronic devices (OED).21 We report here the results of preliminary studies aimed at developing FNPD-NV as a reporter system for EBOV LFA that will meet the practical needs required to help abate viral outbreaks.
Materials and Methods
Materials
Source of FNDP-NV and NCM
FNDP-NV-800nm, 400nm, and 200nm (ADAMAS Nanotechnologies, Raleigh, NC, USA) were surface-functionalized with carboxyl groups (–COOH), analyzed for Z-average distribution (Malvern Panalytical Ltd., Malvern, UK), and shipped to Debina Diagnostic Inc., (DDI) as dry powders.21 Three NCM products were tested (MilliporeSigma, St. Louis, MO): Hi-FlowTM Plus 75 (HiF-75), Hi-FlowTM Plus 135 (HiF-135) and Hi-FlowTM Plus 180 (HiF-180). Scanning electron microscopy images of these NCM are shown in Figure 1A.
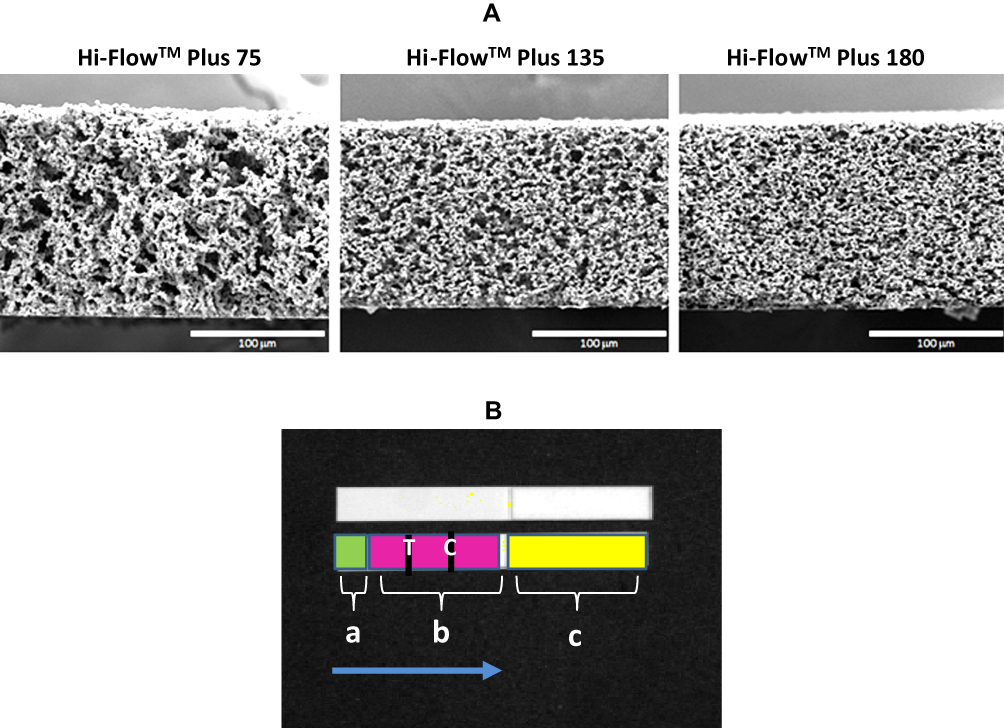 |
Figure 1 Images of NCMs and test strip design. Notes: (A) SEM images of the NCM cross-sections, showing the difference in pore structure. (B) Image of a strip from IVIS-50 instrument showing surface topography. Upper strip represents native image. Lower strip represents computer modeling of FNDP-NV locations: (a) application zone marked in green, (b) migration zone in pink with test (T) and control lines (C) shown, (c) absorption pad marked in yellow, which serves as a sink for unbound particles. The blue arrow indicates the direction of FNDP-NV flow.Abbreviations: SEM, scanning electron microscope; NCM, nitrocellulose membrane; FNDP-NV, fluorescent nanodiamond particles with NV active centers. |
Source of Anti-EBOV-GP Antibodies, rGP and Virus-Like Particles
Goat anti-human immunoglobulin G, Fc region, (GAH-IgG) was obtained from MilliporeSigma. Chimeric humanized anti-EBOV recombinant glycoprotein (GP) monoclonal antibody (mAb) c13C6, mouse mAb anti-EBOV GP 6D8 and rGP (>95% purity) were provided by Dr. John M. Dye, Chief, Viral Immunology, United States Army Medical Research Institute of Infectious Disease (USAMRIID, Fort Detrick MD). The c13C6 mAb is a humanized mouse chimera that interacts with EBOV GP at a discrete mucin-like domain. The murine 6D8 mAb is directed to a non-overlapping epitope (non-redundant to c13C6) of EBOV GP.26–28 Virus-like particles (VLP) were purchased from Integrated BioTherapeutics, Inc., (Gaithersburg, Maryland, USA) to confirm the interaction of antibodies with wild-type GP.
Methods
Preparation of FNDP-NV Suspensions
FNDP-NV-200, -400, -800nm powders were suspended in deionized sterile water to 20 mg/mL and stored at 4°C. Samples of FNDP-NV conjugated to mAb and blocked with BSA were suspended in mobilization buffer (MB) consisting of phosphate-buffered saline (PBS) pH 7.4 (Thermo Fisher, Waltham, MA), 3% bovine serum albumin (BSA) (MilliporeSigma) and 1% Tween-20 (Thermo Fisher).
Sonication of FNDP-NV
Shortly before use suspensions of FNDP-NV were sonicated for 10 min in an E/Mc RAI Ultrasonic water bath model 450 at ambient temperature (20–25°C). Particle dispersion was confirmed using a fluorescence microscope (Olympus IX81, Olympus, Tokyo Japan) with a 40x objective to ensure minimal clumping.
Measurement of Z-Average and ζ-Potential of FNDP-NV
Z-average and ζ-potential were measured in dual purpose capillary cuvettes. Following sonication, particles were suspended in the solutions indicated in Table 1 and immediately tested in a Zetasizer Ver. 7.11 (Malvern Panalytical Ltd., Malvern, UK). Measurements were performed in triplicate for Z-average and once for ζ-potential.
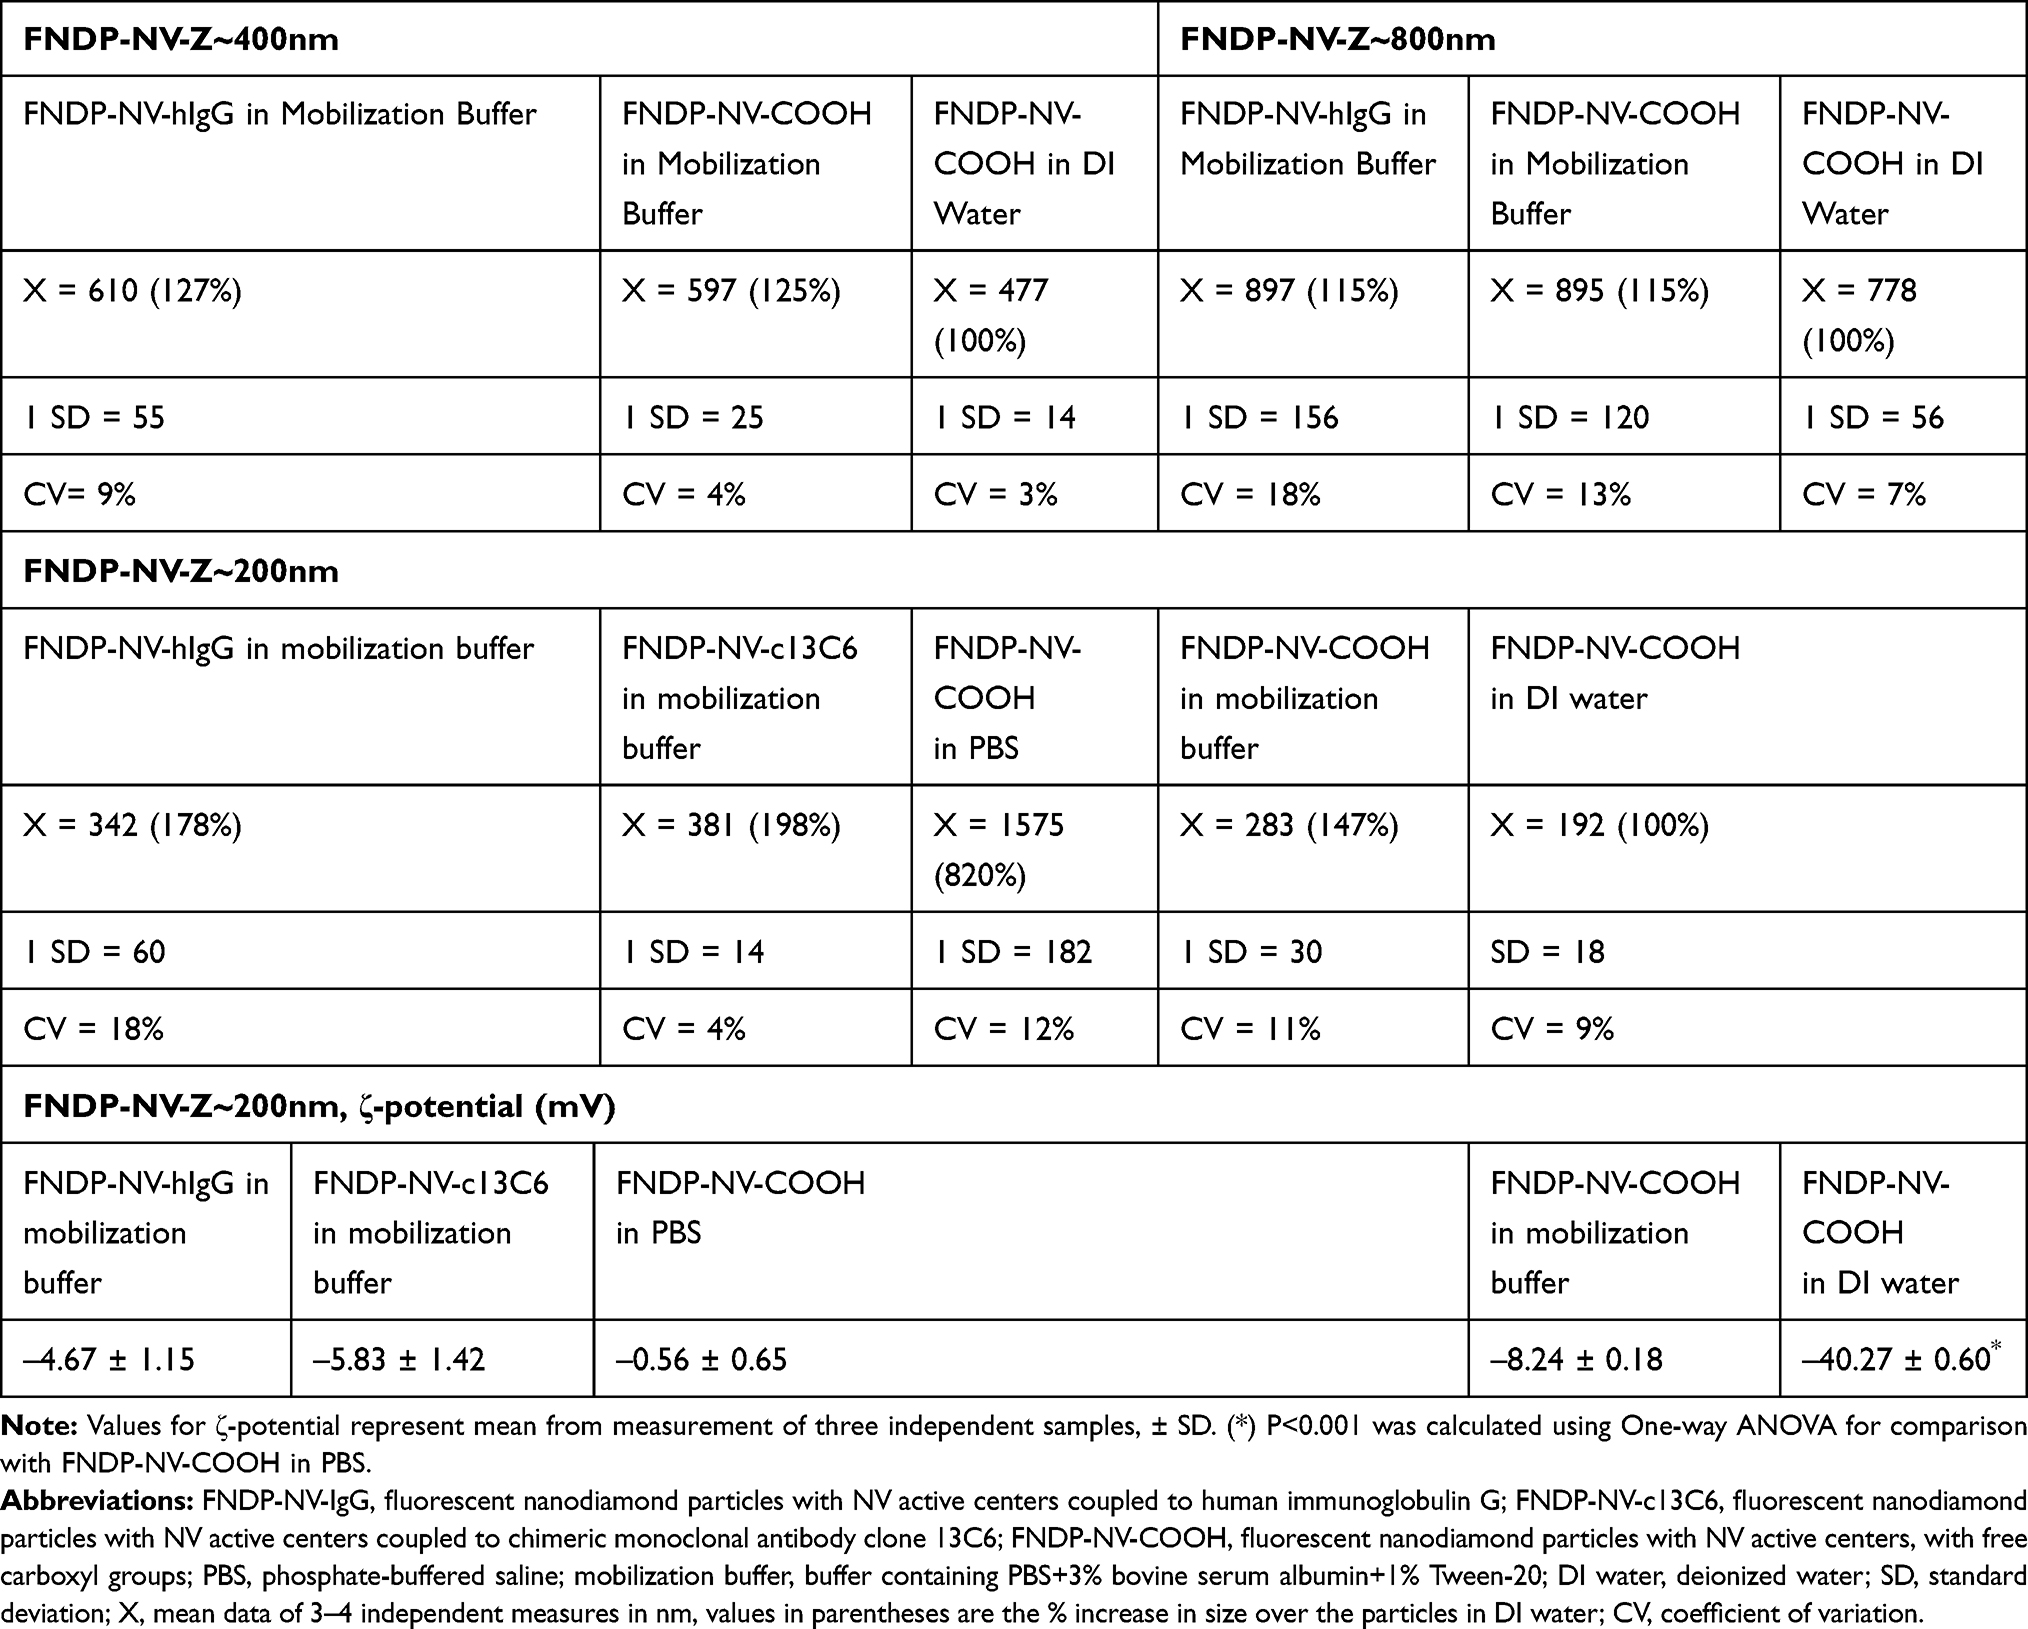 |
Table 1 Z-Average and ζ-Potential of FNDP-NV Preparations Suspended in Water and Buffers |
Ponceau S Staining of NCM
Ponceau S (MilliporeSigma) was used to visualize protein lines striped onto the NCM. Briefly, strips were slipped into 0.1% Ponceau S (w/v) in 5% acetic acid (v/v) along one edge to allow solution to be drawn into the membrane by capillary action. After gentle agitation for 10 min, the stain solution was decanted. Fresh 1% acetic acid was added and swirled for at least 4 min to de-stain the membrane. The strips were removed, blotted dry with clean filter paper, and allowed to dry at room temperature (RT). Protein lines were stained pink.
Recording of NIR Emitted by FNDP-NV on NCM Strips by IVIS-50 or Axxin OED
IVIS-50 in vivo imaging system (IVIS-50, PerkinElmer, Akron, OH) was used as previously described.21,22 NIR recordings were set with excitation filter “Cy5.5 BkG” (580–610 nm) and emission filter “Cy5.5” (695–770 nm). The instrument was set at “binning” 2 over 12 cm observation field. Exposure times varied according to the specific objective of the study. The IVIS-50 operating software, Living Image 4.3.1, was used for data processing (Caliper Life Sciences, Hopkinton, MA).
NIR recording and data processing on the Axxin OED were performed using the AX-2X-S software and a modified AX-2X-S lateral flow reader (P004918, Axxin, Fairfield, Australia). The reader was optimized for use with the FNDP-NV reporters through modifications to both the software and hardware. Briefly, the standard illumination elements for visual and europium nanoparticles were exchanged for light-emitting diodes suitable for excitation with an overlapping absorption maximum of the FNDP-NV particles.
Conjugation of FNDP-NV to IgG
Protein conjugation procedures were previously described.21 Briefly, FNDP-NV were suspended at 1 mg/mL in 0.1 M MES (2-(N-morpholino)-ethane-sulfonic acid) buffer, 0.5 M NaCl, pH 6.0 (Thermo Fisher), containing 2 mM EDC (1-ethyl-3-[3-dimethylaminopropyl]-carbodiimide hydrochloride) (Thermo Fisher) and 5 mM Sulfo-NHS (N-hydroxyl-succinimide) (Thermo Fisher). The activation of FNDP-NV was carried out for 15 min at RT. EDC was then quenched by the addition of β-mercaptoethanol (Thermo Fisher) to a final concentration of 20 mM. Activated FNDP-NV were pelleted by centrifugation for 7 min at 2900 x g at RT. 250 µg of mAb c13C6 or neutral human IgG (hIgG) (Sigma Inc.) in 1 mL of PBS were added to the FNDP-NV pellet to give a particle concentration of 1 mg/mL and then incubated for 2 h. at RT. The reaction was quenched by adding hydroxylamine to a final concentration of 10 mM. FNDP-NV-c13C6 or FNDP-NV-hIgG were separated from the reaction mixture by centrifugation as above and suspended in MB at 1 mg/mL. Residual reactive sites were blocked by incubation at 37°C for 1 hour with BSA present in the MB. Finally, the FNDP-NV-c13C6 or FNDP-NV-hIgG were collected by centrifugation as above and resuspended in MB. Control particles (FNDP-NV-COOH blocked with BSA) were prepared by application of the blocking step to native particles taken from the stock solution.
Verification of c13C6 Conjugation to FNDP-NV and Immunoreactivity by ELISA
Verification of the biological integrity of the c13C6 mAb conjugated to FNDP-NV was performed using ELISA. Particles were pelleted by centrifugation and suspended in PBS only. Particles were immobilized overnight on a 96-well plate (EIA/RIA High Binding, Costar/Corning Inc., NY, NY) at 4°C using in 100 µL per well in serial dilutions ranging from 0.00625 to 0.2 mg/mL in PBS. Thereafter, the plates were washed 3 times with PBS (200 µl per well) and blocked by incubation with 3% BSA in PBS for 1 h at 37°C. GAH-IgG conjugated to alkaline phosphatase (MilliporeSigma), diluted 1:2000 in PBS, was applied to the wells in 100 µL of total volume and incubated for 1 h at 37°C. Plates were then washed 5 times with PBS (200 µl per well). pNPP (p-Nitrophenyl Phosphate, disodium salt, from Sigma Inc.) was added (100 µl per well), and color was developed overnight at 4°C. Optical densities at 405 nm were read using an ELISA plate reader (ELx800, BioTek, Winooski, VT). FNDP-NV-200nm-COOH blocked with BSA served as a control for nonspecific binding.
Sandwich ELISA was performed to verify biological activity of FNDP-NV-200nm-c13C6. Particles were immobilized at densities of 0.1 mg/mL on a 96-well plate and blocked with 3% BSA in PBS as described above. Different concentrations of rGP in PBS containing 1% BSA were then added to the wells, and plate was incubated for 1 hour at 37°C. Rabbit polyclonal anti-rGP (ImmueTechn. Corp., New York, NY) was added to the wells at a concentration of 2 µg/mL in PBS containing 1% BSA, and the plate was incubated at 37°C for 1 h. GAH-IgG conjugated to alkaline phosphatase was as described above, and substrate, pNPP was added for color development. Optical densities at 405 nm were read as described above. FNDP-NV-200nm-COOH blocked with BSA only were served as a control for non-specific binding.
Preparation of NCM Strips
NCM strips were prepared in a configuration specific for the adaptors to be used in the AX-2X-S OED. For FNDP-NV mobility tests, sections of the membrane 6 cm x 30 cm were mounted on adhesive cards (MilliporeSigma). For particle binding tests, strips of the membrane 2.5 cm wide x 30 cm long were mounted on the adhesive cards. Capture antibodies were applied to the membrane using a Matrix™ 1600 Reagent Dispensing Module (Kinematic Automation, Twain Harte, CA). For the control line, GAH-IgG was diluted to 0.5 mg/mL in 10 mM phosphate buffer, pH 7.2, and applied at 1 µL/cm to provide 0.5 µg/cm of line length. For the test line, mouse mAb 6D8 at 1 mg/mL was applied at 1 µL/cm to give 1.0 µg/cm of line length. A strip of SureWick® C083 Cellulose Fiber Sample Pad (MilliporeSigma, Burlington, MA) was applied to the card to serve as the absorbent pad. Cards were cut into strips 5 mm wide (total length of 4 cm) using a Matrix™ 2360 Programmable Shear (Kinematic Automation, Twain Harte, CA).
Mobility of FNDP-NV-hIgG on NCM
The mobility of FNDP-NV-hIgG (all sizes) was evaluated on each type of NCM, using strips that were 6 cm long and having no absorbent pad. FNDP-NV-hIgG was used to assess particle mobility to conserve mAb c13C6 for binding studies. In preliminary studies, we demonstrated that there was no difference in particles linked to hIgG or c13C6 with respect to Z-average or mobility on NCM (data not shown).
Strips were placed vertically in individual wells of 96-well plates (Costar) containing 20 µL of FNDP-NV (any size) suspended in MB; the suspension was sonicated shortly before aliquoting into the wells as described above. Particle concentrations of 1, 0.1, and 0.01 mg/mL were tested to evaluate the relationship of particle mass to NIR intensity and distribution on the application zone (AZ) and migration zone (MZ) of each NCM (Refer to Figure 1B). Upon complete uptake of the particle suspension, the strip was transferred to an adjacent well containing 40 μL of MB. Once the buffer reached the top of the NCM strips, the strips were removed, allowed to dry at RT, inserted into the IVIS-50 chamber, and evaluated for particle distribution. For quantification across the entire strip, the sensitivity of IVIS-50 recording was set to distinguish the particles in the AZ from the MZ (Figure 1B). The fluorescent intensity of blank NCM strips (ie, not exposed to FNDP-NV) served as a background and was subtracted from the respective zones of interest.
Capture of FNDP-NV-hIgG by GAH-IgG on HiF-75
The ability of GAH-IgG, printed as a line on HiF-75 membrane, to capture FNDP-NV conjugated to hIgG or mAb c13C6 was tested first to confirm suitability as a control line capture reagent. The capture of FNDP-NV at the lines was verified by IVIS-50 imaging and fluorescence microscopy (Olympus IX81, Olympus, Tokyo, Japan) using a 40x objective. The location of the GAH-IgG line was verified by Ponceau-S staining.
Identification and Quantitation by IVIS-50 of FNDP-NV-200nm-c13C6/rGP Bound at Test and Control Lines on HiF-75 Membrane
Test and control lines were generated by printing mAb 6D8 and GAH-IgG, respectively, on HiF-75 NCM (as described above). FNDP-NV-200nm-c13C6 were incubated for 15 min at 37°C with EBOV rGP. Complexes of FNDP-NV-200nm-c13C6-rGP were separated from excess rGP by centrifugation and resuspended in MB to the original concentration of 1 mg/mL. Aliquots of the re-suspended particles (20 µL) were distributed into a 96-well plate and processed as described above for the single line studies.
Capture of VLP on HiF-75 NCM
Since the EBOV rGP used in the protocols described above is a recombinant product, we tested a commercial VLP product that carries wild-type EBOV GP (IBT, Gaithersburg MD). For this, we assessed test line formation by FNDP-NV-200nm-c13C6 that was mixed with the VLP. The protocol used was the same as described above for the rGP.
Sensitivity of EBOV GP Detection
The sensitivity of EBOV rGP detection was evaluated on NCM strips printed with both test and control lines as described above. 50 µL aliquots of rGP ranging from 65 pg to 130 ng in MB were incubated with equal volumes of FNDP-NV-200nm-c13C6 suspension at 0.7 mg/mL, for 15 min at 37°C with a brief vortex every 5 min. Each mixture was aliquoted in 20 µL volumes into individual wells of 96-well plates. Single strips were placed into each well. After the particle suspension was fully absorbed (confirmed by direct visual inspection), each strip was transferred into a well containing 40 µL of MB. Once this volume was completely absorbed into the strip, it was transferred to a fume hood for final drying at RT. Dried strips were analyzed on the AX-2X-S OED, and lines were visualized on the IVIS-50.
In a second experiment, sensitivity of EBOV rGP detection was evaluated using rGP diluted in human serum depleted of IgG (MyBioSource, San Diego, CA). The NCM strips were prepared and processed as described above except that the FNDP-NV-200nm-c13C6 suspension was at 1.0 mg/mL. After drying, the strips were analyzed on the AX-2X-S OED and IVIS-50 instruments.
Data Analysis and Statistics
Data are presented as mean ± SD as indicated in figure legends. Statistical analyses were done by ANOVA (where appropriate) using SigmaPlot software (SigmaPlot® 12 SPSS, Systat Software Inc., San Jose CA, USA). Statistical significance was established at a value of P< 0.05.
Results
FNDP-NV Z-Average and ζ-Potential Assessment
The diameter and surface charge of FNDP-NV change after surface modification and are influenced by buffer composition, which in turn can affect particle mobility within the NCM pore structure. For this reason, we examined the effects of surface modification and buffer composition on Z-average of a matrix of surface modifications (Table 1). Z-average of FNDP-NV-400nm or −800nm-hIgG suspended in MB showed moderate Z-average increases of 27% and 15%, respectively, compared to Z-average of FNDP-400nm and −800nm-COOH suspended in DI water; coefficients of variation (CV) were 9% and 18%, respectively. FNDP-NV-200nm-hIgG and FNDP-NV-200nm-c13C6 in MB exhibited Z-average increases of 78% and 98%, respectively, compared to FNDP-NV-200nm-COOH in DI water (Table 1). FNDP-NV-200nm-COOH in MB showed an increase in Z-average of 47% compared to FNDP-NV-200nm-COOH in DI water while dispersion in PBS caused an increase of 720%. This is most likely a consequence of aggregation. However, the hypothesized aggregation effect of PBS was mitigated by the BSA in the MB, reducing the increase of the Z-average to 98%. Our data align with measurements of much smaller nanodiamonds.18–20 The Z-average of FNDP-NV-200nm-c13C6 suspended in MB with a narrow CV of 4% contributed to their selection for further studies.
The ζ-potential of FNDP-NV-200nm-COOH, reported by the manufacturer at −40mV to −50mV, was measured after suspension in DI water, MB, or PBS and after covalent attachment of hIgG or c13C6. The ζ-potential of FNDP-NV-200nm-COOH suspended in DI water was −40.27 mV in accordance with the manufacturer’s specifications. Coupling of FNDP-NV-200nm to hIgG or c13C6 antibodies and suspension in MB increased the ζ-potential to −4.67 mV and −5.83 mV, respectively. It is interesting to note that suspension of FNDP-NV-200nm-COOH in PBS virtually decreased the negative charge to −1.66 mV. The effects of changes in the ζ-potential on particle migration were not examined further in this study.
Conjugation of c13C6 to FNDP-NV-200nm, -400nm or -800nm and Confirmation by ELISA
The mass of antibody bound by the FNDP-NV was inversely related to particle diameter (Figure 2A). Thus, the highest level of mAb c13C6 per mass of particles was accommodated by FNDP-NV-200nm. This was likely due to the increase in total particle surface area to volume ratio and the increased number of particles per unit mass as diameter decreased. No difference was observed between the amounts of hIgG and mAb c13C6 conjugated to FNDP-NV-200nm (Figure 2B). Importantly, the FNDP-NV-200nm-c13C6 particles were capable of recognizing rGP (Figure 2C).
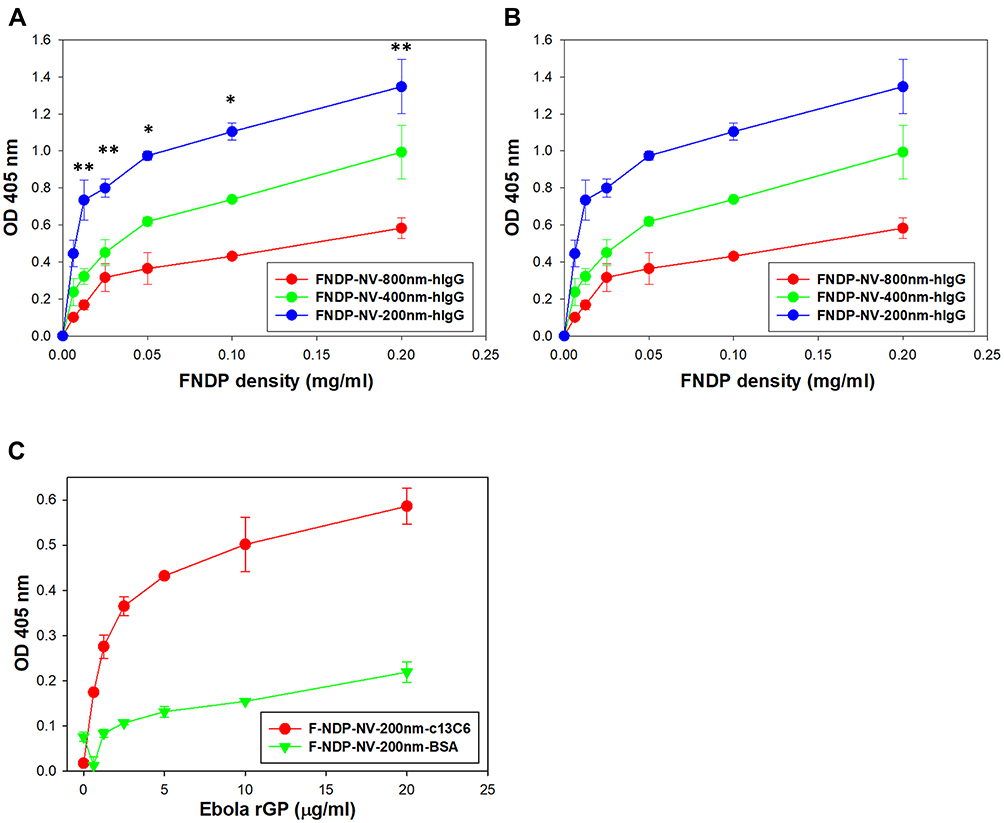 |
Figure 2 Verification of antibody conjugation and reactivity on FNDP-NV-COOH by ELISA. Notes: hIgG and mAb c13C6 were covalently coupled to FNDP-NV-COOH. BSA was passively adsorbed to the FNDP-NV-COOH surface. In (A) and (B), ELISA was performed by direct binding of GAH-IgG AP conjugate to immobilized particles. (A) Recognition of hIgG coupled to FNDP-NV with diameters of 800, 400, or 200 nm. One-way ANOVA for the difference between 200 nm and 400/800 nm particles (*) P<0.001, (**) P<0.01. (B) Comparison of hIgG and mAb c13C6 coupled to FNDP-NV-200nm. FNDP-NV-200nm/BSA was the control. (C) Sandwich ELISA for rGP was used to measure antibody binding activity. FNDP-NV-200nm-c13C6 and FNDP-NV-200nm/BSA at 0.1 mg/mL were immobilized on a 96-well plate and then incubated with rGP. Bound rGP was detected using rabbit polyclonal anti-rGP, followed by GAR-IgG AP conjugate. Error bars represent SD of three independent experiments.Abbreviations: FNDP-NV-COOH, fluorescent nanodiamond particles with NV active centers, surface-functionalized with free carboxyl groups; FNDP-NV-hIgG, fluorescent nanodiamond particles with NV active centers, coupled to human immunoglobulin G; FNDP-NV-c13C6, fluorescent nanodiamond particles with NV active centers, coupled to chimeric monoclonal antibody clone c13C6; FNDP-NV-COOH/BSA, fluorescent nanodiamond particles with NV active centers, passively adsorbed with bovine serum albumin; ELISA, enzyme-linked immunosorbent assay; hIgG, human immunoglobulin G; GAH-IgG, goat anti-human immunoglobulin G; AP, alkaline phosphatase; mAb, monoclonal antibody; GAR-IgG, goat anti-rabbit IgG; SD, standard deviation. |
NCM Selection Based on Patterns of FNDP-NV Fluidics on Various NCM
The distribution patterns of FNDP-NV-[200nm-, 400nm,-800nm]-hIgG on HiF-75, HiF-135, and HiF-180 NCMs were evaluated after flowing particles up the strips in MB. Discrete fluorescent signals in the AZ and MZ were measured by IVIS-50 and graphed (Figure 3). This set of graphs shows the variation in particle distribution as a function of the fluorescent signals. All strips showed retention of particles in the AZ, especially FNDP-NV-800nm at the highest concentration of 1 mg/mL. Particles retention in the AZ decreased with particle size and concentration. IVIS-50 images also demonstrated more homogeneous distribution in the MZ, especially on HiF-75 NCM.
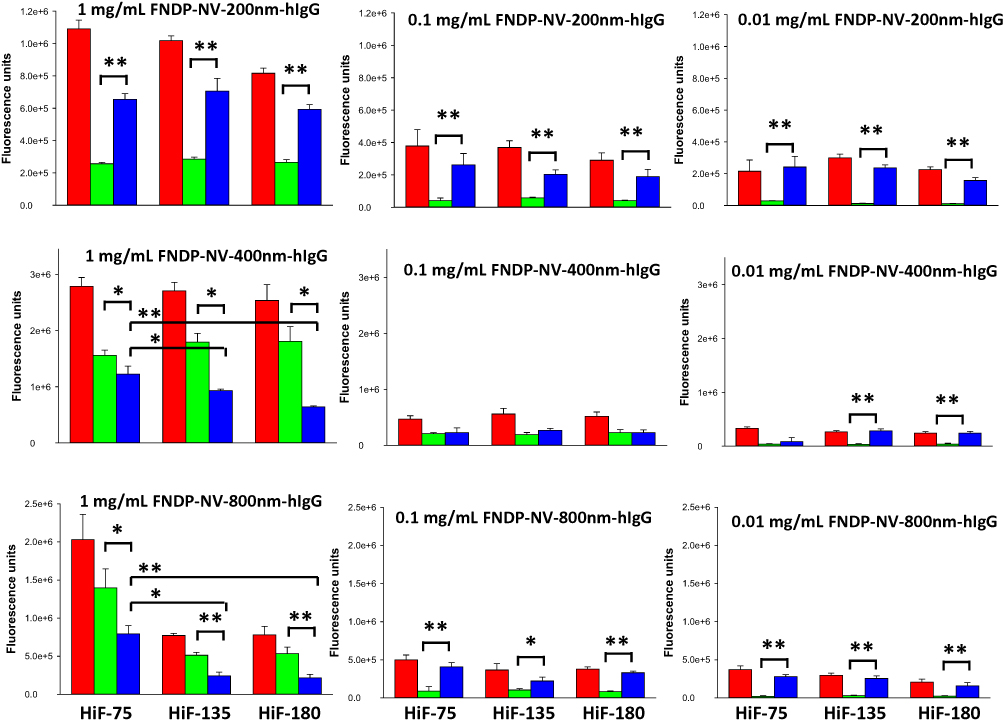 |
Figure 3 Quantitation of FNDP-NV-hIgG fluorescence on NCM strips. Notes: The FNDP-NV indicated in each panel was run up the NCM strip in MB. After drying, strips were scanned by IVIS-50. The image of each strip was partitioned into AZ and MZ, and the fluorescent signals were determined. In each panel, the red bar represents the total fluorescence of the strip. Green bars represent the fluorescence of the AZ. Blue bars represent the fluorescence of the MZ. Blank strips were used for background subtraction. Error bars represent SD of the mean of three independent strips. (*) P<0.05 One-way ANOVA; (**) P<0.005 One-way ANOVA.Abbreviations: FNDP-NV-hIgG, fluorescent nanodiamond particles with NV active centers, coupled to human immunoglobulin G; NCM, nitrocellulose membrane; HiF, Hi-FlowTM Plus; AZ, application zone; MZ, migration zone; SD, standard deviation. |
Particle distribution was further analyzed by calculating the ratio of fluorescence on the MZ to that on the AZ (Figure 4 and Table 2). The highest fluorescence signals were obtained at a particle concentration of 1 mg/mL. Since samples diluted to 0.1 and 0.01 mg/mL showed significantly lower signal intensity, we focused on results generated by the highest concentration of 1 mg/mL. At this concentration, FNDP-NV-200nm-hIgG distribution on the MZ exceeded retention on the AZ for all three NCM types, with MZ/AZ ratios ranging from 2.25 to 2.55. For the FNDP-NV-400nm-hIgG and FNDP-NV-800nm-hIgG, proportionally more particles were retained in the AZ than migrated into the MZ on each type of NCM; all MZ/AZ ratios were <1. The apparent lack of mobility of these larger particles makes them less desirable for development of a complete LFA. Based on these results, we selected FNDP-NV-200nm particles and HiF-75 NCM for the subsequent proof-of-concept studies.
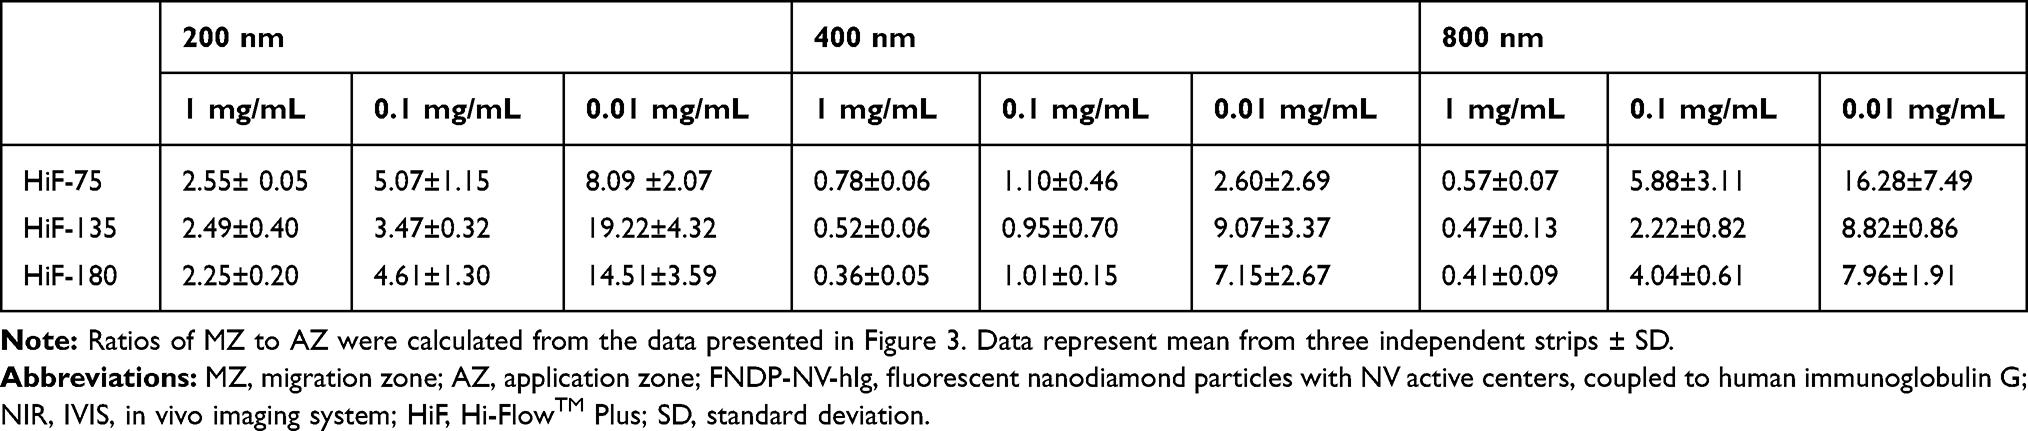 |
Table 2 Ratio of Different Sizes (200, 400, 800 nm) of FNDP-NV-hIgG Fluorescence in the MZ to Fluorescence in the AZ Measured by IVIS-50 |
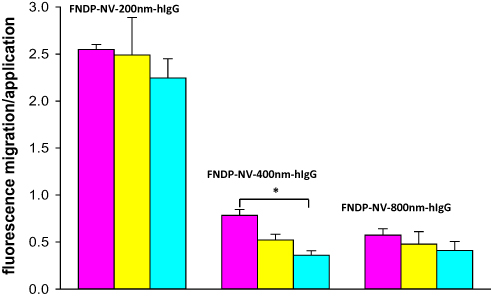 |
Figure 4 Ratio of MZ to AZ fluorescence after mobilization of FNDP-NV-hIgG on NCMs. Notes: Ratios of MZ to AZ were calculated from the data presented in Figure 3. Values for the 1 mg/mL FNDP-NV-hIgG concentration only are graphed. Pink bars represent HiF-75, yellow bars HiF-135, and cyan bars HiF-180. (*) P<0.001 One-way ANOVA.Abbreviations: MZ, migration zone; AZ, application zone; FNDP-NV-hIgG, fluorescent nanodiamond particles with NV active centers, coupled to human immunoglobulin G; NCM, nitrocellulose membrane; HiF, Hi-FlowTM Plus; SD, standard deviation. |
Assessment of Capture Line Position on HiF-75 NCM Using GAH-IgG to Bind Mobilized FNDP-NV-200nm-hIgG
Because the test line defines the test result, we evaluated signal intensity as a function of the location of the line. GAH-IgG was used as the capture antibody for FNDP-NV-200nm-hIgG particles to conserve mAb c13C6. As the capture line was located closer to the AZ at the bottom of the strip, signal intensity increased (Figure 5A) and was 50% higher on the lines 5.5 cm from the top of the strip compared to the lines at 3.5 cm (Figure 5B), which is counterintuitive. The overall flow rate of the membrane slows as the liquid front moves up the strip, and this should produce more favorable kinetics of antibody binding for lines farther up the membrane. We do not have an explanation for this observation.
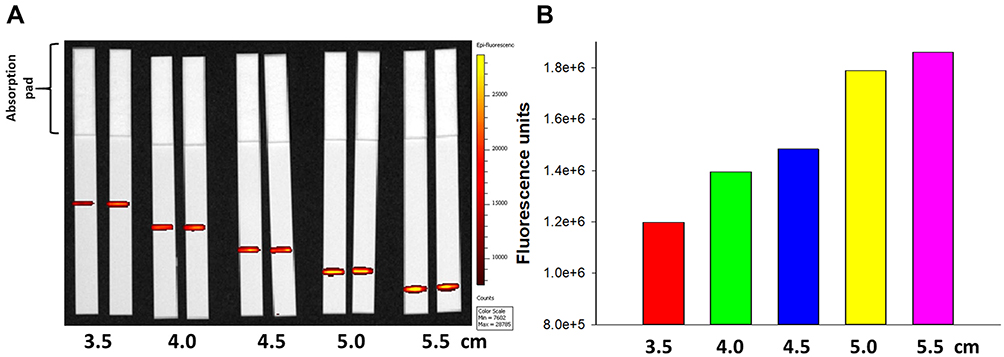 |
Figure 5 Effect of line location on binding of FNDP-NV-200nm-hIgG. Note: (A) HiF-75 NCM strips (6 cm long) were printed with GAH-IgG at 1 µg/cm of line length, at the distances from the top of the strip shown on the abscissa. Strips were run in duplicate and imaged using IVIS-50 with 30 sec exposure. (B) Fluorescence intensity of lines in (A). Bars represent the mean of each pair of strips.Abbreviations: FNDP-NV-200nm-hIgG, fluorescent nanodiamond particles with NV active centers, 200nm diameter, coupled to human immunoglobulin G; NCM, nitrocellulose membrane; HiF, Hi-FlowTM Plus; GAH-IgG, goat anti-hIgG. |
Capture of FNDP-NV-200nm-c13C6-rGP Complex on HiF-75 NCM by mAB 6D8 Printed on Test Line
Mouse mAb 6D8 recognizes an epitope on EBOV rGP distinct from the epitope recognized by mAb c13C6. To test the ability of mAb 6D8 to serve as a capture reagent on the NCM, it was printed onto strips which were then processed with preformed complexes of FNDP-NV-200nm-c13C6 and rGP (Figure 6A). The FNDP-NV-200nm-c13C6-rGP complexes were captured by mAb 6D8. Increasing the amount of mAb 6D8 by a factor of 3 increased the fluorescent signal by a factor of 3 (Figure 6B) suggesting a need for further exploration of the stoichiometry of particles and antibodies. A low but measurable signal was noted on the control strips (no rGP), indicating nonspecific interaction of the particles linked to c13C6 with mAb 6D8 printed on the test line. Whether this non-specific interaction is due to the antibody and/or BSA or just the physical barrier to the particles per-se remains to be explored.
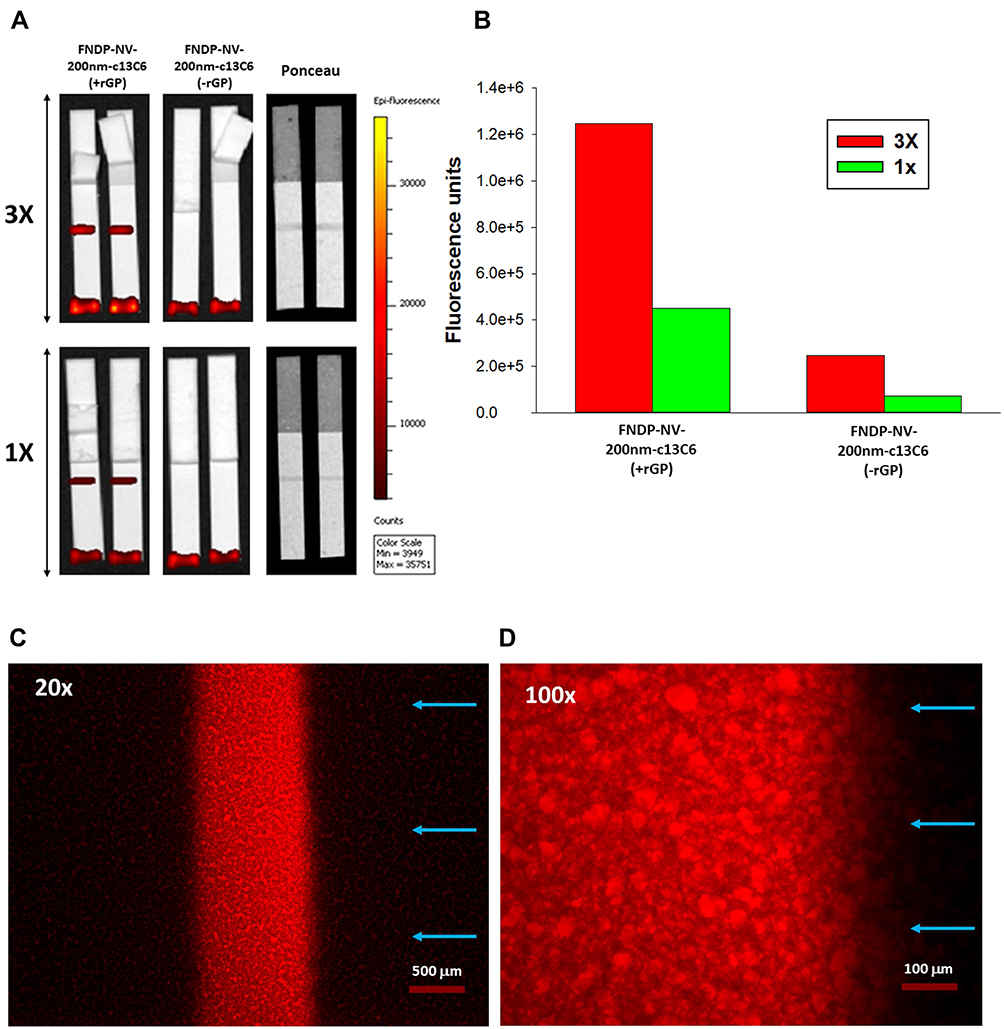 |
Figure 6 Capture of FNDP-NV-200nm-c13C6-rGP by mAb 6D8. Notes: (A) Images of HiF-75 strips printed with mAb 6D8 at 1 (1x) and 3 (3x) µg/cm of line length and processed with of FNDP-NV-200nm-c13C6 complexed (+) or not (-) with rGP. Particles and rGP were incubated at 37°C for 5 minutes at a mass ratio of 1:1.3 (particles to rGP). Excess rGP was removed by centrifugation and pellet resuspension in MB to a particle concentration of 1 mg/mL. 1 µg of FNDP-NV-200nm-c13C6-rGP complex was applied to the AZ and mobilized with 40 µL of MB. Line position on the strip was verified by Ponceau S staining. Strips were imaged using IVIS-50 at 1 min exposure time. (B) Quantitation of capture lines in (A) by IVIS-50. Means are graphed. (C–D) Fluorescence microscope images of captured particles on strips from the 3x-printed 6D8 mAb line. Blue arrows indicate the direction of particle flow.Abbreviations: FNDP-NV-200nm-c13C6-GP, fluorescent nanodiamond particles with NV active centers, 200 nm diameter, coupled to mAb c13C6 mAb and complexed with rGP; HiF, Hi-FlowTM Plus; mAb, monoclonal antibody, rGP, recombinant GP; MB mobilization buffer; AZ, application zone. |
Distribution of the FNDP-NV-200nm-c13C6-rGP particles on the strip was examined using fluorescence microscopy (Figure 6C and D). Under low magnification, the particles were preferentially localized on the leading edge relative to the direction of sample flow (Figure 6C). This was expected since this edge is where the particles first contact the 6D8 mAb. Under higher magnification, the mottled appearance of the fluorescence may be due to the presence of particle aggregates or non-uniform distribution of monomeric particles on the underlying nitrocellulose.
Functionality of Test and Control Lines on NCM
NCM strips were prepared using mAB 6D8 as the capture antibody at the test line and GAH-IgG as the capture antibody at the control line. On one set of strips, these lines were placed closer to the AZ to determine if more intense signals could be generated, as observed in Figure 5. Fluorescence was measured using 10 sec or 60 sec excitation pulses in the IVIS-50 (Figure 7A) to test for minimum duration of excitation, a factor that could contribute to overall test time. The 60-sec excitation time produced signals 6-fold greater than the 10-sec excitation, indicating linear relationship. When the fluorescence of the lines was quantified, the signals were greater for both the test and control lines placed closer to the AZ (Figure 7B), as observed in Figure 5. The lower signal intensity of the control lines was expected because formation of the immune-complex at the test line depletes the fluid stream of available particles.
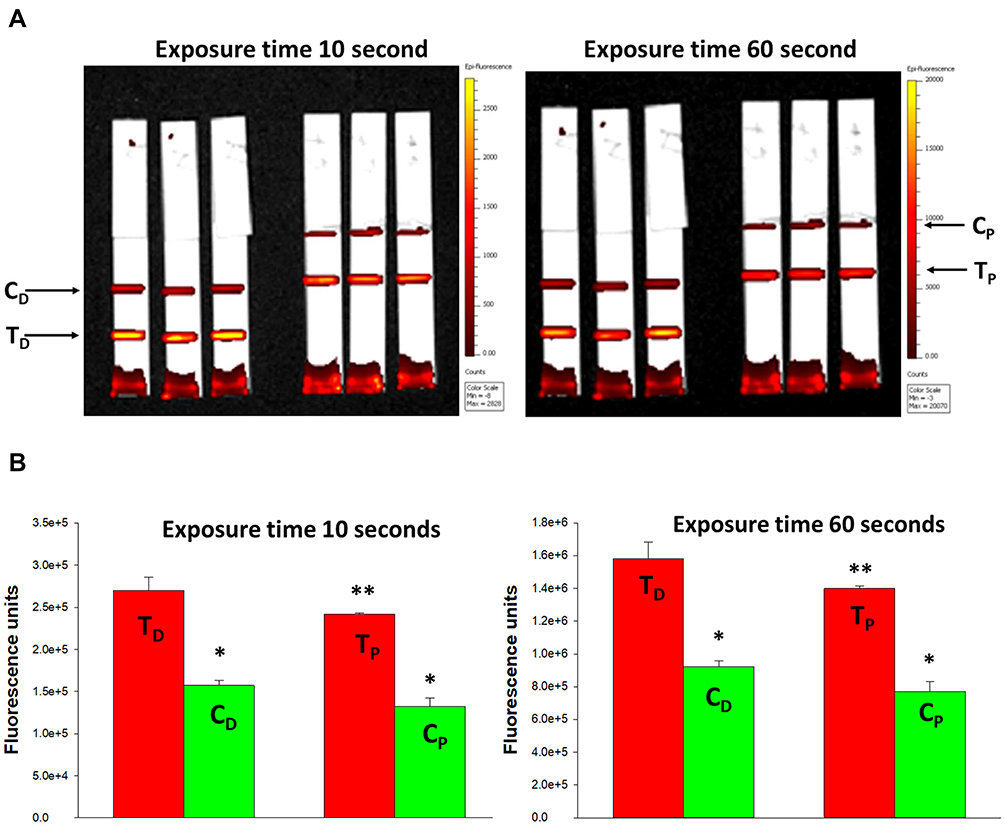 |
Figure 7 Capture of FNDP-NV-200nm-c13C6-rGP on HiF-75 using mAb 6D8 and GAH-IgG. Notes: (A) IVIS-50 images of triplicate strips where test lines (T) are closest to the AZ and control lines (C) 5 mm above the test line. FNDP-NV-200nm-c13C6 were incubated with rGP at 37°C for 5 minutes in a mass ratio of 1:1.3 (particles to rGP). Excess rGP was removed by centrifugation and pellet resuspension in MB to a particle concentration of 1 mg/mL. (B) Quantification by IVIS-50 of fluorescent signals at 10-sec or 60-sec excitation times. Bars are the mean of N = 3 ± SD. One-way ANOVA was calculated between test and control lines for all the experimental options. (*) P<0.001 for TD line and TP line; (**) P<0.05 for all options.Abbreviations: FNDP-NV-200nm-c13C6, fluorescent nanodiamond particles with NV active centers, 200 nm diameter, coupled to humanized chimeric c13C6 monoclonal antibody; mAb, monoclonal antibody; GAH-IgG, goat-anti-human immunoglobulin G; AZ, application zone; rGP, recombinant GP; TD and TP, test lines in distal and proximal positions relative to the top of the strip; CD and CP, control lines distal and proximal relative to the top of the strip; SD, standard deviation. |
Detection of VLP Using FNDP-NV-200nm-c13C6 and mAb 6D8
VLP are non-infectious viral fragments that carry proteins of the wild-type EBOV (Figure 8B).28–30 While the previous studies demonstrate the ability to detect rGP, we wanted to determine if this antibody system would also recognize wild-type GP in a LFA format. Therefore, we repeated the detection protocol using EBOV VLP as the antigen, FNDP-NV-200nm-c13C6 as the fluorescent particle, and mAb 6D8 as the capture antibody on the NCM. Pre-incubation of the VLP with FNDP-NV-200nm-c13C6 for as little as 5 min produced significant signal (Figure 8A, C, D). Signal intensity appears to have plateaued between 30 and 60 min of pre-incubation (Figure 8C and D). Smearing of the fluorescence on the strips for the 30-min and 60-min pre-incubations may reflect attachment of multiple particles to individual VLPs (Figure 8B). This would cause the formation of aggregates with limited mobility on the membrane. Overall, these data suggest that FNDP-NV-200nm-c13C6 are capable of binding wild-type EBOV GP.
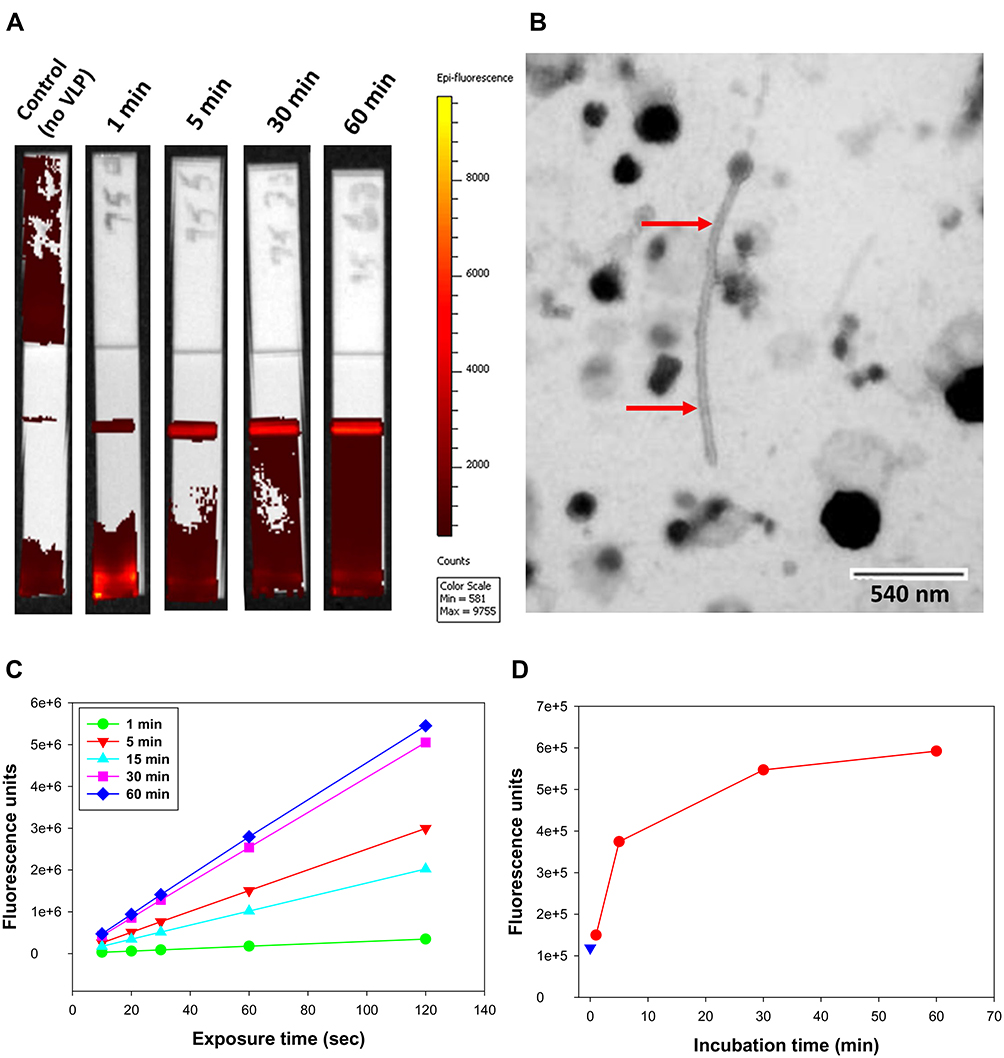 |
Figure 8 IVIS-50 analysis of strips run with FNDP-NV-200nm-c13C6 preincubated with VLP. Note: (A) IVIS-50 images of HiF-75 NCM strips. mAb 6D8 was printed on HiF-75 NCM. FNDP-NV-200nm-c13C6 were preincubated with VLP at 37°C for the times indicated above the strips. Excess VLP was removed by pelleting the particles by centrifugation and resuspending the pellets in MB to a particle concentration of 1 mg/mL, from which 20 µL was applied on the membrane followed by 40 µL MB. IVIS-50 images were made using 10 sec. exposures. (B) TEM image of VLPs. Elongated particle resembling EBOV is indicated by red arrows. Image was provided courtesy of Dr. F. Holtsberg (IBT Gaithersburg, MD). (C) Total fluorescence of test lines in (A) as a function of exposure time. Each curve represents a different incubation time of FNDP-NV-200nm-c13C6 with VLP. Background fluorescence from the control strip (no VLP) was subtracted to account for nonspecific interactions. (D) Graphic presentation of total fluorescence intensity retained at the 6D8 capture lines after analysis by IVIS-50. The excitation time for all strips was 10 sec. Fluorescence from the control strip (no VLP) is represented by blue triangle.Abbreviations: FNDP-NV-200nm-c13C6, fluorescent nanodiamond particles with NV active centers, 200 nm diameter, coupled to humanized chimeric c13C6 monoclonal antibody; VLP, virus-like particles; NCM, nitrocellulose membrane; HiF, Hi-FlowTM Plus; MB, mobilization buffer; EBOV, Ebola virus; mAb, monoclonal antibody; TEM, transmission electron microscopy. |
Sensitivity of rGP Detection Using an OED
To assess the limits of rGP detection by FNDP-NV-200nm-c13C6 using an AX-2X-S OED, rGP samples ranging from 0.065 ng to 130 ng (~4 logs) were each suspended in MB with a constant mass of FNDP-NV-200nm-c13C6. Test strips with mAb 6D8 at the test line and GAH-IgG at the control line were run with these samples. Fluorescent signal intensities at the test and control lines were measured using the AX-2X-S OED (Figure 9A-C), and the strips were imaged on the IVIS-50 (Figure 9D). The signal intensities shown in Figure 9A are mirrored by the strip images shown in Figure 9D. Inspection of the control strips labelled “0 GP” provides visual evidence for the statistically significant signal intensities at the test line for all rGP amounts. Overall, 0.065 ng of rGP, the lowest rGP mass tested, translates to 382 attomoles (382 x 10−18 moles), assuming a molecular weight of rGP at 170,000 Da.
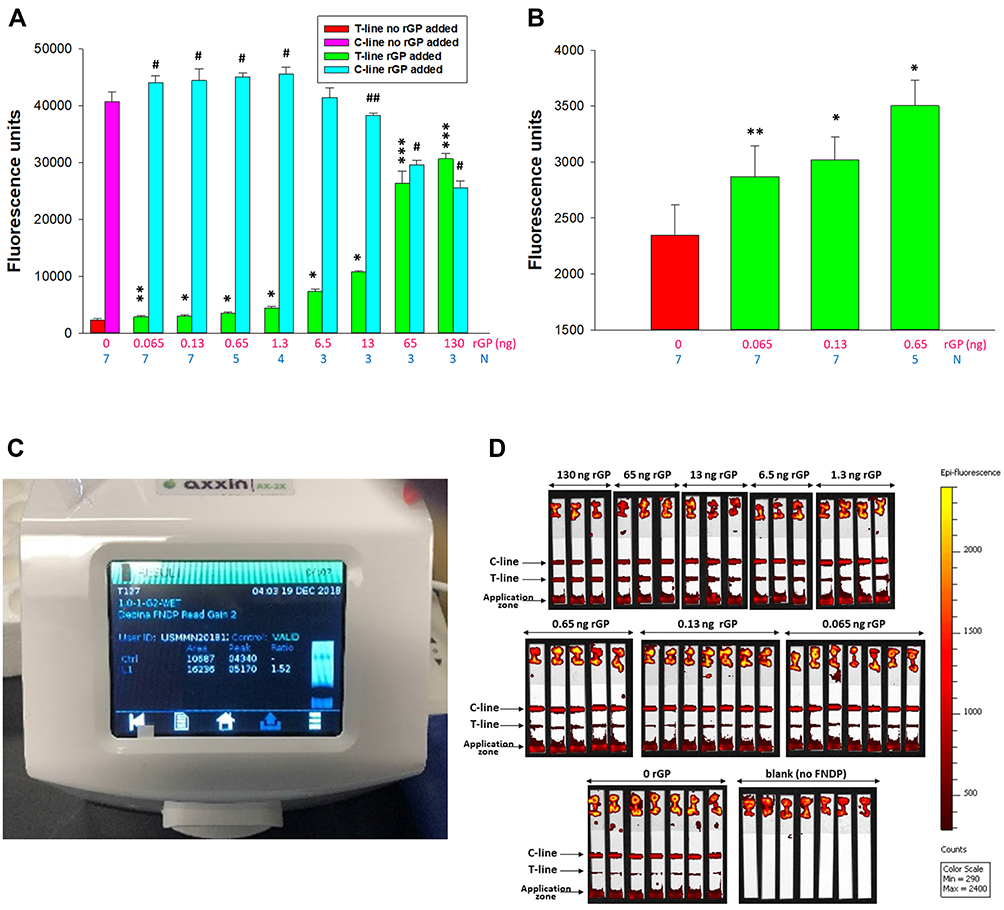 |
Figure 9 Sensitivity of FNDP-NV-200nm-c13C6-rGP detection using an AX-2X-S OED.Note: (A) Fluorescence intensity of the test line and control line . Error bars represent SD from the number of replicates indicated by the blue number below each mass of rGP mass (pink numbers). Test Line: (*) P<0.001, (**) P=0.004 and (***) P=0.017 was calculated using One-way ANOVA for difference between strips run with FNDP-NV-200nm-c13C6 and with FNDP-NV-200nm-c13C6-rGP. Control Line: (#) P<0.001, (##) P=0.05 was calculated using One-way ANOVA for difference between strips run with FNDP-NV-200nm-c13C6 and with FNDP-NV-200nm-c13C6-GP (F=12.995). (B) Test line signals for the three lowest rGP masses (green bars) and “0 rGP” control (red bar). Pink numbers below bars represent mass of rGP applied on the application zone while blue numbers indicate the number of independent strips used for each rGP mass. (*) P<0.001, (**) P=0.004 was calculated using One-way ANOVA for difference between strips run with FNDP-NV-200nm-c13C6 and with FNDP-NV-200nm-c13C6-rGP. (C) Screen shot of AX-2X-S OED display. (D) IVIS-50 images of test strips.Abbreviations: FNDP-NV-200nm-c13C6, fluorescent nanodiamond particles with NV active centers, 200 nm diameter, coupled to chimeric c13C6 monoclonal antibody; rGP, recombinant glycoprotein; mAb, monoclonal antibody; SD, standard deviation; N, number of strips per sample; ng, nanograms. |
In contrast to the data presented above, the sensitivity was significantly reduced when the rGP was diluted in human serum (depleted of IgG) and mixed with FNDP-NV-200nm-c13C6 (Figure 10). While all rGP-spiked samples had significantly higher NIR emission at the test line compared to the control with no rGP (Figure 10A), there was no apparent difference among samples containing less than 6.5 to 13 ng. Analysis of the rGP-spiked samples by OED after subtraction of the control sample (Figure 10B) further suggests inconsistent difference across rGP concentration below 6.5–13 ng. Figure 10C shows IVIS visualization of all test strips. Particles were detected on all test lines including the control strip with no rGP, suggesting that particles carrying FNDP-NV-200nm-c13C6 are captured on the 6D8 printed line. Finally, native particles (FNDP-NV-COOH) and FNDP-NV-COOH blocked with BSA had very low T and C-line signals while suspended in same human serum preparation.
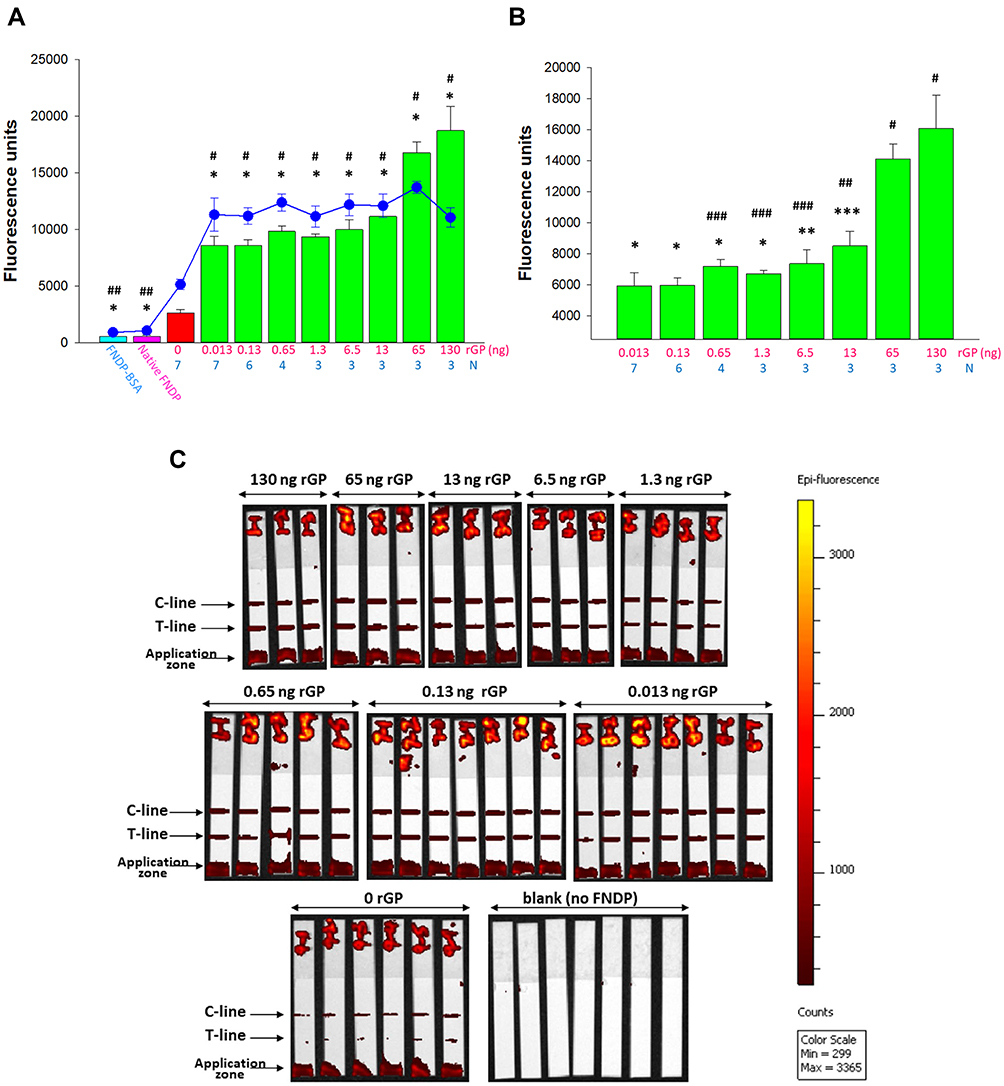 |
Figure 10 Sensitivity of FNDP-NV-200nm-c13C6-rGP detection in human serum (depleted of IgG) using an AX-2X-S OED. Notes: (A) Fluorescence intensity of the test line (bar graph) and control line (blue line). Error bars represent SD from the number of replicates indicated by the blue number below each mass of rGP mass (pink numbers). Test Line: (*) P<0.001 and Control Line (#) P<0.001, (##) P=0.003 were calculated using One-way ANOVA for difference between strips run with FNDP-NV-200nm-c13C6 and with FNDP-NV-200nm-c13C6-rGP. (B) Fluorescence intensity of T-line for various amounts of rGP (indicated by pink numbers) deducted by background of FNDP-NV-200nm-c13C6 (rGP = 0 ng). (*) P<0.001, (**) P = 0.003, (***) P = 0.005 were calculated using One-way ANOVA for difference between strips run with the highest (130 ng) amount of rGP. (#) P<0.001, (##) P = 0.003, (###) P<0.05 were calculated using One-way ANOVA for difference between strips run with the lowest (0.013 ng) amount of rGP. (C) IVIS-50 images of test strips.Abbreviations: FNDP-NV-200nm-c13C6, fluorescent nanodiamond particles with NV active centers, 200 nm diameter, coupled to chimeric c13C6 monoclonal antibody; rGP, recombinant glycoprotein; mAb, monoclonal antibody; SD, standard deviation; N, number of strips per sample; ng, nanograms. |
Discussion
The key objective of this research was to detail technical parameters to guide the replacement of current LFA systems assessed by visual inspection of results. This objective is rooted in the desire to develop a new reporter system that offers better sensitivity, quantitation, speed, efficiency, and point-of-test data transmission. The need for significantly improved sensitivity of diagnostic test for highly infectious, lethal viruses, was already stressed during the devastating EBOV epidemic of 2014–2016 in West Africa31–33 and endemic outbreaks thereafter.34,35 The ongoing COVID-19 pandemic is the latest example of the need for highly sensitive rapid diagnostic tests to enable early, robust responses to epidemic and pandemic risks, including identification of pre-symptomatic individuals who are considered infectious.36
The use of FNDP-NV and NIR fluorescence as a novel reporter system requires careful detailing of all elements that govern the LFA format, including physical properties of the particles (size, mass, mobility), compatibility with NCMs, and selection of buffers to optimize particle mobility. Developing operating parameters, assessing feasibility, and demonstrating proof of concept were considered essential first steps. Use of NIR fluorescence has been a key consideration for this operating system due to its stability, durability, minimal interferences by biological materials, broad span of linearity, and quantitation.21,22,36 Analysis focused on: a. selecting the suitable FNDP-NV by size and concentration after conjugation to antibodies (Figures 2–4, and Table 1); b. selecting the NCM that allows proper migration of the preferred FNDP-NV (Figures 1 and 3); c. establishing stoichiometric relationships among the variables (Figures 2–4); d. defining the MB compatible with FNDP-NV and rGP; and e. implementing a portable OED for rapid, quantitative analysis (Figure 9C).
The antibody pair selected for these studies was developed at USAMRIID and shown to be non-redundant with respect to their complementary binding of EBOV rGP.26,28 Preservation of immunological function after conjugation to the particles was demonstrated by using ELISA for binding of rGP to FNDP-NV-200nm-c13C6 (Figure 2C). Analysis of FNDP-NV particle size, concentration, and mobility in various NCM (Figure 3, 4) led to the selection of FNDP-NV-200nm as the preferred particle (among the three tested) and HiF-75 as the preferred NCM (among the three tested). The sensitivity studies (Figure 9) suggested that 7 µg of FNDP-NV-200nm applied on the AZ of the strip allowed for detection of as little as 65 pg rGP applied by the 7 μgU FNDP-NV-200nm. We speculate that the sensitivity of the OED test might be superior to 65 pg with full optimization. This assumption is based on the total mass of rGP applied to the AZ with the mobilization of less than half of the particles across the test and control lines. Thus, analysis of NIR fluorescence from the AZ indicated 111,551 fluorescent units (FU), while the test line generated 31523 FU and the control line 97559 FU. Assuming a linear relationship between NIR FU and particle mass, the signal at the test line accounts for only 11.3% of the total FU retained on the NCM, suggesting that the amount of rGP at the test line is only of 7.3 pg (41 attomoles).
Not unexpectedly, the data generated with rGP suspended in human serum (depleted of IgG) suggest interference of serum components to the extent that test sensitivity is reduced significantly. The specific components in the human serum responsible for this situation have not been determined at this time. Since native particles (FNDP-NV-200nm-COOH) coated with BSA or kept in the original uncoated state do not appear to interact with capture antibodies at the test and control lines (Figure 10A), we surmise that the c13C6 antibody conjugated with particles interacts with serum factors to facilitate deposition. Thus, the issue might be ameliorated by using antibodies that lack the ‘stickiness’ c13C6 seems to convey. It is however pertinent to suggest that same impact is likely to be seen with human plasma and blood. Since the prototype platform used so far is different from the final intended test system by virtue of FNDP-NV-200-antibody to be printed on the strip positioned in an adaptor and devoid of prolonged interaction between the specimen medium and the particle linked antibody, interference could be limited. Finally, LFA tests that process nasal and oropharyngeal specimens lacking plasma/serum ingredients would not likely suffer from non-specific interferences. This possibility remains to be tested.
Retention of large mass of particles at the AZ (Figures 3, 6, 7) suggests current method of loading the particles on the strip by vertical absorption is not optimal. In a complete test strip, particles will be printed on a conjugate pad in a dispersed manner and migrate across the strip placed horizontally, which should alleviate at least some of this issue. It is therefore reasonable to suggest that particle mass in the AZ zone could be significantly reduced in a complete test strip, thereby conserving FNDP-NV particles, reducing the background signal in negative controls blank, and ultimately increasing test sensitivity.
Acknowledging that the use of rGP in the feasibility studies requires the confirmation with a natural wild-type GP, we proceeded to test EBOV VLP, a non-infective derivative of EBOV that carries wild-type GP (Figure 8B).28–30 Although this study was limited in scope, VLP deposition at the test line was clearly observed at the low particle loads. Longer pre-incubation (30 to 60 min) of VLP with the particles resulted in “smearing” of particles along the MZ. We speculate that slower flowing aggregates formed when multiple particles adhered to multiple VLP are a possible cause for this observation.
An essential component in transforming traditional LFA tests (visual readout) to a quantitative, unbiased, and high throughput format is the need for an OED. We have sponsored and tested a customized OED (Axxin AX-2X-S) that features mobility (battery-operated option), point-of-test data reporting, and most importantly, high sensitivity and speed. The ability to analyze test strips in less than a minute offers throughput of >1440 tests per day per device. Our calculation for a single test is estimated at $1 dollar per test (strip materials, reagents, particles and adaptor) exclusive of labor and overhead. The proof-of-concept studies presented here comprise a foundation for the full development of a commercial LFA based on fluorescent nanodiamond particles as a reporter system.
Summary
The experimental data presented here are the first report of the use of fluorescent nanodiamond particles in the LFA format. Our data suggest the potential for superior sensitivity in the detection of EBOV. The durable design and application of an OED offer quantitative data acquisition in <1 min and the potential to process 1440 tests per day on a single OED in a field setting. Most importantly, there is the potential for sub-femtomole sensitivity that would permit the diagnosis of asymptomatic carriers of EBOV and individuals in the preclinical stages of the diseases.
Disclosure
Nathaniel G. Butlin reports instrument customization was performed by Axxin Pty Ltd paid by Debina, Inc., during the conduct of the study; and is a salaried employee of Axxin Pty Ltd, functioning as the VP of Strategic Alliances & Ventures, outside the submitted work. Giora Z Feuerstein, Salvatore Alesci, Mark Sternberg, and Cezary Marcinkiewicz are employees of Debina Diagnostics Inc. Michael A Mansfield is an employee of MilliporeSigma. The authors report no other potential conflicts of interest in conducting this work.
References
1. Salata C, Calistri A, Alvisi G, Celestino M, Paroli C, Palu G. Ebola virus entry: from molecular characterization to drug discovery. Viruses. 2019;11(3):274–294.
2. Biedron C, Lyman M, Stuckey MJ, et al. Evaluation of infection prevention and control readiness at frontline health care facilities in high-risk districts bordering Ebola virus disease-affected areas in the Democratic Republic of the Congo - Uganda, 2018. MMWR. 2019;68(39):851–854.
3. Holding M, Ihekweazu C, Stuart JM, Oliver I. Learning from the epidemiological response to the 2014/15 Ebola virus disease outbreak. J Epidemiol Glob Health. 2019;9(3):169–175.
4. Gostin LO, Tomori O, Wibulpolprasert S, et al. Toward a common secure future: four global commissions in the wake of ebola. PLoS Med. 2016;13(5):e1002042.
5. Dzau VJ, Sands P. Beyond the Ebola battle – winning the war against future epidemics. N Engl J Med. 2016;375(3):203–204.
6. Tembo J, Simulundu E, Changula K, et al. Recent advances in the development and evaluation of molecular diagnostics for Ebola virus disease. Expert Rev Mol Diagn. 2019;19(4):325–340.
7. Fleck F. Rapid Ebola tests hold promise. Bull World Health Organ. 2015;93(4):215–216.
8. Vogel G. Infectious diseases. Testing new Ebola tests. Science. 2014;345(6204):1549–1550.
9. Urassa W, Meurant R, Wood D. ReEBOV antigen rapid test kit for Ebola. Lancet. 2015;386(10010):2253–2254.
10. Banerjee R, Jaiswal A. Recent advances in nanoparticles-based lateral flow immunoassay as a point of care diagnostic tool for infectious agents and disease. Analyst. 2018;143(9):1970–1996.
11. Duan D, Fan K, Zhang D, et al. Nanozyme-strip for rapid local diagnosis of Ebola. Biosens Bioelectron. 2015;74:134–141.
12. Brangel P, Sobarzo A, Parolo C, et al. A serological point-of-care test for the detection of IgG antibodies against Ebola virus in human survivors. ACS Nano. 2018;12:63–73.
13. Say JM, van Vreden C, Reilly DJ, Brown LJ, Rabeau JR, King NJC. Luminescence nanodiamonds for biological applications. Biophys Rev. 2011;3(4):171–184.
14. Pashchenko O, Shelby T, Banerjee T, Santra S. A comparison of optical, electrochemical, magnetic, and colorimetric point-of-care biosensors for infectious disease diagnosis. ACS Infect Dis. 2018;4(8):1162–1178.
15. Purdey MS, Thompson JG, Monro TM, Abell AD, Schartner EP. A dual sensor for pH and hydrogen peroxide using polymer-coated optical fibre tips. Sensors (Basel). 2015;15(12):31904–31913.
16. Lidke DS, Arndt-Jovin DJ. Imaging takes a quantum leap. Physiology(Bethesda). 2004;19:322–325.
17. Qasim M, Lim D-J, Park H, Na D. Nanotechnology for diagnosis and treatment of infectious diseases. J Nanosci Nanotechnol. 2014;14(10):7374–7387.
18. Myers FB, Lee LP. Innovations in optical microfluidic technologies for point-of-care diagnostics. Lab Chip. 2008;8(12):2015–2031.
19. Takemura K, Adegoke O, Takahashi N, et al. Versatility of a localized surface plasmon resonance-based gold nanoparticle-alloyed quantum dot nanobiosensor for immunofluorescence detection of viruses. Biosens Bioelectron. 2017;89(Pt 2):998–1005.
20. Lee SF, Osborne MA. Photodynamics of a single quantum dot: fluorescence activation, enhancement, intermittency, and decay. J Am Chem Soc. 2007;129(29):8936–8937.
21. Marcinkiewicz C, Gerstenhaber JA, Sternberg M, Lelkes PI, Feuerstein G. Bitistatin-functionalized fluorescent nano-diamond particles specifically bind to purified human platelet integrin receptor αIIbβ3 and activated platelets. Int J Nanomedicine. 2017;12:3711–3720.
22. Gerstenhaber JA, Barone FC, Marcinkiewicz Cet al. Vascular thrombus imaging in vivo via near infra-red fluorescent nanodiamond particles bioengineered with the disintegrin bitistatin (Part II). Int J Nanomedicine. 2017;12:8471–8482.
23. Torelli MD, Nunn NA, Shenderova OA. A perspective on fluorescent nanodiamond bioimaging. Small. 2019;15(48):e1902151.
24. Reineck P, Gibson BC. Near-infrared fluorescent nanomaterials for bioimaging and sensing. Adv Optical Mater. 2017;5(2):1–26.
25. Turcheniuk K, Mochalin VN. Biomedical applications of nanodiamonds (Review). Nanotechnology. 2017;28(25):252001.
26. Murin CD, Fusco ML, Bornholdt ZA, et al. Structures of protective antibodies reveal sites of vulnerability on Ebola virus. Proc Natl Acad Sci. 2014;111(48):17182–17187.
27. Saphire EO, Schendel SL, Fusco ML, et al. Systematic analysis of monoclonal antibodies against Ebola virus GP defines features that contribute to protection. Cell. 2018;174(4):938–952.
28. Vu H, Shulenin S, Grolla A, et al. Quantitative serology assays for determination of antibody responses to ebola virus glycoprotein and matrix protein in nonhuman primates and humans. Antiviral Res. 2016;126:55–61.
29. Warfield KL, Bosio CAM, Welcher BC, et al. Ebola virus-like particles protect from lethal Ebola virus infection. Proc Natl Acad Sci USA. 2003;100(26):15889–15894.
30. Carra JH, Martins KAO, Schokman RD, Robinson CG, Steffens JT, Bavari S. A thermostable, chromatographically purified Ebola nano-VLP vaccine. J Transl Med. 2015;13:228.
31. Singh B, Ganguly A, Sunwoo HH. Current and future diagnostic tests for Ebola virus disease. J Pharm Pharm Sci. 2016;19(4):530–551.
32. Nouvellet P, Garske T, Mills HL, et al. The role of rapid diagnostics in managing Ebola epidemics. Nature. 2015;528(7580):S109–S116.
33. Jean Louis F, Huang JY, Nebie YK, et al. Implementation of broad screening with Ebola rapid diagnostic tests in Forécariah, Guinea. Afr J Lab Med. 2017;6(1):484.
34. Frieden TR. Still not ready for Ebola. Science. 2018;360(6393):1049.
35. Coarsey CT, Esiobo N, Narayan R, et al. Strategies in Ebola virus disease (EVD) diagnostics at the point of care. Crit Rev Microbiol. 2017;43(6):779–798.
36. Wei WE, Li Z, Chiew CJ, Yong SE, Toh MP, Lee VJ. Pre-symptomatic transmission of SARS-CoV-2 – Singapore, January 23-March 16, 2020. MMWR Morb Mortal Wkly Rep. 2020;69(14):411–415.
 © 2020 The Author(s). This work is published and licensed by Dove Medical Press Limited. The full terms of this license are available at https://www.dovepress.com/terms.php and incorporate the Creative Commons Attribution - Non Commercial (unported, v3.0) License.
By accessing the work you hereby accept the Terms. Non-commercial uses of the work are permitted without any further permission from Dove Medical Press Limited, provided the work is properly attributed. For permission for commercial use of this work, please see paragraphs 4.2 and 5 of our Terms.
© 2020 The Author(s). This work is published and licensed by Dove Medical Press Limited. The full terms of this license are available at https://www.dovepress.com/terms.php and incorporate the Creative Commons Attribution - Non Commercial (unported, v3.0) License.
By accessing the work you hereby accept the Terms. Non-commercial uses of the work are permitted without any further permission from Dove Medical Press Limited, provided the work is properly attributed. For permission for commercial use of this work, please see paragraphs 4.2 and 5 of our Terms.