")
Back to Journals » Journal of Inflammation Research » Volume 15
The Transcriptional Landscapes and Key Genes in Brain Arteriovenous Malformation Progression in a Venous Hypertension Rat Model Revealed by RNA Sequencing
Authors Li S , Tao W, Huang Z, Yan L, Chen B, Zeng C, Chen F
Received 10 November 2021
Accepted for publication 4 February 2022
Published 26 February 2022 Volume 2022:15 Pages 1381—1397
DOI https://doi.org/10.2147/JIR.S347754
Checked for plagiarism Yes
Review by Single anonymous peer review
Peer reviewer comments 2
Editor who approved publication: Professor Ning Quan
Shifu Li, Wengui Tao, Zheng Huang, Langchao Yan, Bo Chen, Chudai Zeng, Fenghua Chen
Department of Neurosurgery, Xiangya Hospital, Central South University, Changsha, People’s Republic of China
Correspondence: Fenghua Chen, Department of Neurosurgery, Xiangya Hospital, Central South University, Changsha, 410008, Hunan, People’s Republic of China, Email [email protected]
Background: Brain arteriovenous malformations (bAVM) are abnormal vascular lesions characterized by direct connections between arteries and veins without an intervening capillary bed. The primary goal for brain AVM treatment is to prevent rupture and hemorrhage; however, the underlying molecular mechanisms are still unknown.
Methods: We constructed venous hypertension (VH) rat model with end-to-end anastomosis of the proximal left common carotid artery and the left distal external jugular vein. Thirty-eight adult rats were randomly assigned to four groups: the 0-week (n=5), the 1-week VH group (n=12), the 3-week VH group (n=9), and the 6-week VH group (n=12). We measured the hemodynamics and diameter of the arterialized veins. An RNA sequencing of arterialized veins was conducted, followed by comprehensive bioinformatics analysis to identify key genes and biological pathways involved in VH progression. The candidate genes from RNA-Seq were validated by RT-qPCR and immunostaining in human tissues.
Results: We observed high-flow and low resistance characteristics in VH models. A total of 317 upregulated and 258 downregulated common genes were consistently differentially expressed during VH progression. Thirteen co-expression modules were obtained by WGCNA analysis, and 4 key modules were identified. Thirteen genes: Adamts8, Adamtsl3, Spon2, Adamtsl2, Chad, Itga7, Comp, Itga8, Bmp6, Fst, Smad6, Smad7, Grem1, and Nog with differential expressions were identified using the density of maximum neighborhood component (DMNC) algorithm in Cytohubba. The expression of five potential genes (Adamts8, Adamtsl3, Spon2, Adamtsl2, Itga8) were increased in RT-qPCR, while in human bAVM tissue, the protein levels of Adamtsl2 and Itga8 were significant elevated and Spon2 and Adamtsl3 were decreased.
Conclusion: The identified gene networks of Adamtsl3, Spon2, Adamtsl2, and Itga8 provided key genes for further intervention.
Graphical Abstarct:
Keywords: WGCNA, xCells, focal adhesion, vascular microenvironment, bioinformatics
Graphical Abstract:

Introduction
Brain arteriovenous malformations (bAVM) are abnormal vascular lesions comprising conglomerations of vessels (nidus) within the brain parenchyma with direct connections between arteries and veins without an intervening capillary bed.1 The incidence of AVMs is approximately 1 per 100,000 per year in unselected populations and 18 per 100,000 in adults.2 The abnormal formation of high-flow, low-resistance shunt results in high vascular pressure, particularly in veins, increasing the risk of rupture.3 Cerebral hemorrhage and seizures are the most common presenting symptoms of AVM. The risk of an initial intracranial hemorrhage from an unruptured bAVM is approximately 1% per person-year,3 increasing fivefold once ruptured.
Several studies have used a rat model with venous hypertension (VH) created by producing an arteriovenous shunt between the carotid artery and external jugular vein to investigate the pathogenesis of arteriovenous malformations (AVMs).4,5 Past studies have primarily focused on the etiology and development of AVM with little attention to molecular mechanisms of AVM rupture affected by high-flow hemodynamics. In the present study, we established VH rat models and performed RNA sequencing on venous samples at 0, 1, 3, and 6 weeks after the operation to depict the transcriptional landscapes and uncover the potential molecules of the impaired vessel under a persistent high-flow condition.
Materials and Methods
Animals and Groups
We purchased a total of 38 adult Sprague-Dawley rats (2 months old, 250–300 g) from the Department of Laboratory Animals of Central South University (Changsha, China). The protocol for animal experimentation was approved by the Institutional Experimental Animal Care and Use Committee of Central South University (Changsha, China). Animal care was complied with the Guide for the Care and Use of Laboratory Animals.6 All rats were bred and kept in a standard and pathogen-free animal facility. The 38 rats were randomly assigned to four groups with a random number: the 0-week group (n=5), the 1-week VH group (n=12), the 3-week VH group (n=9), and the 6-week VH group (n=12).
Surgical Procedures and Hemodynamic Measurements
A VH rat model was constructed as previously described.7,8 All surgical procedures were performed in a standard sterile environment. The rats were anesthetized by intraperitoneal anesthesia with pentobarbital sodium (50 mg/kg), supplemented during surgical procedures if needed. Following a ventral midline neck incision after anesthesia, the proximal left common carotid artery and the left distal external jugular vein were exposed and anastomosed side by side, using no. 10-0 monofilament nylon suture under a microscope. Subsequently, we ligated the distal left common carotid artery and the proximal portion of the left external jugular vein. For the control, rats were sham-operated without anastomosis and vein ligation.
For all rats, an ultrasonic Doppler was used to measure external jugular vein hemodynamic parameters, including peak velocity (ie, maximal velocity), mean velocity, pulsatility index (PI), and resistance index (RI), reflecting the vascular resistance before sacrifice. The diameter of the distal external jugular veins was measured using a vernier caliper.
Samples Collection, RNA Extraction, and Transcriptome Sequencing
The rats were anesthetized using chloral hydrate at 0 weeks (the control), 1 week, 3 weeks, and 6 weeks after VH, and the external jugular veins were sampled and stored separately at −80°C conditions. Total RNA was extracted from the tissues using Trizol (Invitrogen, Carlsbad, CA, USA) according to manual instructions. After total RNAs were qualified and quantified using a NanoDrop and Agilent 2100 bioanalyzer (Thermo Fisher Scientific, MA, USA), Oligo (dT)-attached magnetic beads were used to purify mRNA. PCR was conducted to generate cDNA libraries purified with AMPure XP beads (Beckman Coulter, Brea, CA, USA), and adaptor sequences were removed, followed by low-quality reads filtering. The raw sequencing data turned into clean reads by filtering and quality control. The clean reads were aligned to reference genes (Rattus norvegicus) by Bowtie2 to obtain the quantitative mRNA expression matrix. Raw data was standardized by log2 conversion. Principal component analysis (PCA) was presented to detect and remove outliers and identify samples with high similarity using R “factoextra” packages.
Analysis of Differential Gene Expression (DEGs)
The differential genes between 0 weeks and 1 week, 3 weeks, and 6 weeks of VH were analyzed using the limma package.9 Significantly deregulated transcripts were identified using the criteria of the absolute value of log2FoldChange >1 and P < 0.05. Volcano plots were constructed with the R software ggplot2 package to show significantly deregulated transcripts and genes. The top 500 deregulated genes were visualized using the heatmap.
Biological Pathways Enrichment Analysis
Gene set enrichment analysis (GSEA) is a computational method that assesses whether an a priori defined set of genes shows statistical significance instead of a single gene compared with the traditional enrichment analysis.10 GSEA was performed to explore the specifically related pathways of our expression profiles with 1000 permutations. The pathway gene set (C2: KEGG) of the Molecular Signatures Database was used as the input gene set for analysis. Normalized enrichment scores >1.5 and normalized p-values <0.05 were used as the screening criteria. The top 3 up-and down-regulated terms were shown if available.
Visualization of Cell Types with xCell Analysis
To further discover the vascular microenvironment, xCell,11 a method converting gene expression profiles to enrichment scores of 64 immune, and stromal cell types across samples, was used to calculate these cell composition scores.
KEGG of Common Deregulated Genes
The common up and downregulated genes were intersected in an online website (http://bioinformatics.psb.ugent.be/webtools/Venn/) and enriched for Kyoto Encyclopedia of Genes and Genomes (KEGG) with the clusterProfiler package in R.12
Co-Expression Analysis Based on WGCNA
Weighted gene co-expression network analysis (WGCNA) constructed by the WGCNA package13 in R was used to identify the co-expression network and cluster genes into different modules. Genes with the top 25% median averaged variance (mad) were selected to the following steps. First, we selected the soft threshold power (β) based on the scale-free topology criterion using the pick Soft Threshold function. Then, the dendrogram was generated by calculating the topological overlap matrix (TOM) dissimilarity between genes to identify gene modules by the dynamic tree cut method. The minimum number of genes in each module was 30, and the threshold of merging modules was set to 0.25 using the dynamic cutting tree method.
Selection of Key Modules Correlated with AVM Progression
Module eigengene (ME), summarizing each module’s expression profile, was calculated, and the relevance of intra-ME between modules was displayed using R ggcor packages. The modules correlated with the “Time” trait (representing the progression of venous hypertension trait during 0, 1, 3, and 6 weeks) with significance (p < 0.05), and a great relationship (r > 0.5 or <−0.5) was assumed to the key module for further analysis by using the moduleTraitCor and moduleTraitPvalue algorithms.
Temporal Gene Expression Profiles
For further exploring the genes with AVM progression, the Short Time-series Expression Miner (STEM) software was used to analyze the genes from the above key modules and identify temporal expression profiles. All parameters were set to the default values. The number of permutations per gene was 50, and the minimum correlation of profiles was 0.7. The significant level was set at p<0.05 with a Bonferroni correction method.
The Potential Pathways of Genes from STEM Analysis
We identified and combined the genes from the clusters of STEM analysis. The protein–protein interaction (PPI) network of genes was established with a minimum required interaction score of 0.4 on STRING database analysis (https://www.string-db.org/). The network was imported into the Cytoscape for visualization. Cluego, a Cytoscape plugin, was used for functional enrichment analysis to identify potential KEGG pathways. The results were also displayed using a heatmap.
Key Genes and the Prediction of Upstream miRNA
Cytoscape plugin cytoHubba was used to identify the top 15 key genes, using the density of the maximum neighborhood component (DMNC) algorithm. Three databases – miRDB (mirdb.org), TargetScan (targetscan.org), and miRWalk (mirwalk.umm.uni-heidelberg.de) were used to predict the upstream miRNA. We intersected the three database results for robust prediction. Then, the relationships of miRNA–mRNA–modules were constructed.
Small Molecule Drug Analysis
CMap (portals.broadinstitute.org/cmap/), a large-scale database of genome-wide transcriptional expression data from cultured human cells treated with bioactive small molecules, was used to identify candidate small molecule drugs with the potential to treat AVM patients. We uploaded key genes from the above analysis into the CMap web tool, following homological mapping to the human gene. The resultant small molecules with negative connectivity scores were considered for therapeutic agents because they could suppress the expression of these gene signatures.
Validation with Reverse-Transcription Quantitative Polymerase Chain Reaction (RT-qPCR)
Five significant representative genes (Adamtsl2, Adamtsl3, Adamts8, Spon2, and Itga8) were selected and validated by RT-qPCR using the ABI 7500 real-time PCR system (Applied Bioscience, Foster City, CA, USA). The RNA left after RNA-sequencing was reverse transcribed to complementary DNAs (cDNAs) with Evo M-MLV reverse transcriptase kit (Axygen Scientific, Union City, CA) according to instructions. SYBR Green Pro Taq HS Kit (Axygen Scientific, Union City, CA) and 0.4 μmol of each primer pair were used to amplify the cDNA. The results were analyzed using the ΔΔCt method and expressed as ratio of the internal control, GAPDH. Data presented are the average of three independent experiments.
Immunohistochemical and Dual Immunofluorescence Assays
The AVM nidus structures were harvested from patients who underwent resection of AVM and the control intracranial vascular tissues were from intractable epileptic patients who had corrective surgery at Xiangya hospital between January 2021 and December 2021. The collected tissues were fixed in 10% formalin, and embedded in paraffin. Four micrometers thick paraffin sections were rehydrated and endogenous peroxidase activity was quenched for 30min in 3% H2O2. Then sections were incubated in blocking buffer (5% bovine serum albumin in PBS) for 1 h at room temperature, then incubated with primary antibodies at 4°C overnight, followed by 60 minutes in horseradish peroxidase-conjugated secondary antibody (2 ug/mL; Abcam, England), and DAB Horseradish Peroxidase Color Development kit (P0203, Beyotime) was used for coloration. All specimens were counterstained with hematoxylin (Beyotime). The primary antibodies were anti ADAMTSL2 antibody (rabbit, 1:200; GeneTex, USA), anti ADAMTSL3 antibody (rabbit, 1:200; Bioss, USA), anti ITGA8 antibody (rabbit, 1:200; Abmart, China), anti ADAMTS8 antibody (rabbit, 1:200; Abmart, China), anti SPON2 antibody (rabbit, 1:200; Abmart, China), and anti α-SMA antibody (rabbit, 1:400; Abmart, China) used for IHC analysis. Sections were scanned using OLYMPUS CX41 and Leica Application Suite 4.0 software. The expression was semiquantitatively measured as previously described. Scoring of immunoreactivity was as follows: 0, no staining; 1, mild staining; 2, moderate staining; and 3, intense staining. Two researchers blinded to the clinical information performed the scorings, and the average of the data of the two observations was used.
Dual immunofluorescence was performed in sections from AVM and control tissues using the antibodies anti α-SMA (rabbit, 1:400; Abmart, China) and anti-ADAMTSL2 antibody (rabbit, 1:200; GeneTex, USA), followed by incubation with Alexa Fluor CY3-conjugated anti-mouse rabbit IgG (1:300, Jackson ImmunoResearch) and Alexa Fluor 488-conjugated anti-rabbit IgG (1:400, Jackson ImmunoResearch). Nuclei were stained with DAPI (1:1000; Sigma-Aldrich, USA), and the images were collected using a fluorescent microscope (Leica, × 20 magnifications).
Statistical Analysis
The R software (version R-4.1.0) was used for statistical analysis. The Wilcox test was used to compare the differences between the two groups, and the ANOVA test was used among groups. Significance level was denoted by *p‐value < 0.05, **p‐value < 0.01, ***p‐value < 0.001, ****p‐value < 0.0001.
Results
Hemodynamics and Diameter Measurements
We measured the relevant hemodynamic parameters and the diameters of the arterialized veins of each rat at the time points corresponding to their groups. Compared with 0 weeks, 1, 3, and 6-week rats had a larger maximal and mean velocity and venous diameter, while the PI and RI presented decreasing trends (Figure 1A–E, *p<0.05). The diameters of the hypertension models were dilated compared with the control group under the microscope (shown in Figure 1F). The values of these parameters are listed in Table 1.
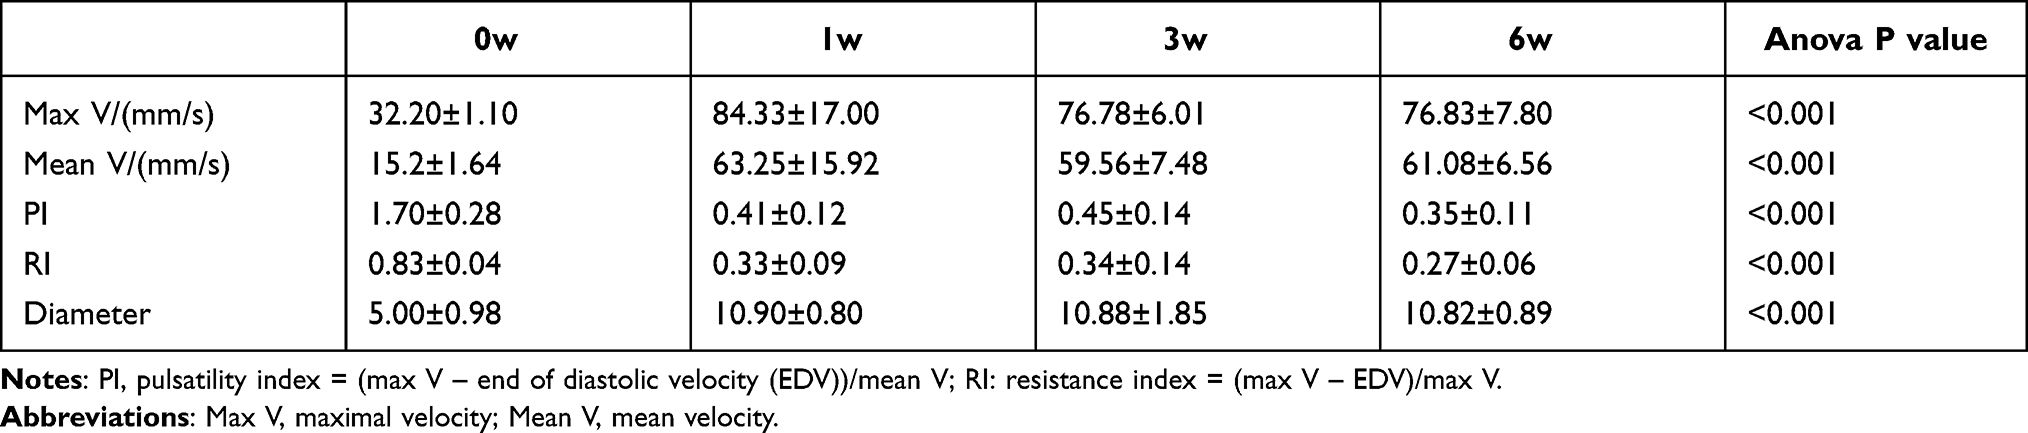 |
Table 1 The Hemodynamic Parameters and Diameter of the External Jugular Vein |
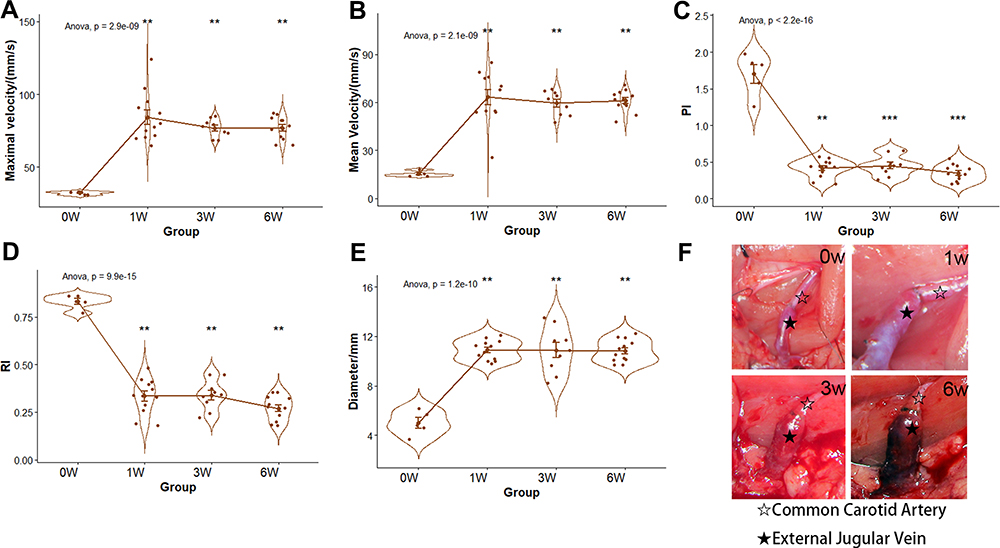 |
Figure 1 The hemodynamics, diameter, and microscopic views of EJV. (A–D) the comparisons of EJV hemodynamic parameters (E) the comparison of EJV diameter (F) the microscopic views of EJV at 0, 1, 3, and 6 weeks. **p-value < 0.01, ***p-value < 0.001. Black and white stars indicates common carotid artery and external jugular vein, respectively. Abbreviations: PI, pulsatility index; RI, resistance index; EJV, external jugular vein. |
Identification of DEGs at Four Time Points
We collected the venous parts of all models and extracted the mRNAs to depict the expression profiles at 0, 1, 3, and 6 weeks. After removing the duplicated gene mapped with multiple probes, a total of 20,177 genes successfully remained.
The results of principal component analysis (PCA) are shown in Figure S1. We separately analyzed the DEGs between venous hypertension and the control using the limma packages. In the first week, a total of 1528 significant DEGs (792 upregulated and 736 downregulated) were identified (p-value < 0.05, FC > 2, Figure 2A). We performed an unsupervised hierarchical clustering analysis for the top 500 DEGs, and the heatmap showed different expressions between two groups (Figure 2A). We identified 1416 DEGs (801 upregulated and 615 downregulated) and 1164 DEGs (636 upregulated and 528 downregulated) at 3 weeks and 6 weeks, respectively. The volcano and heatmaps of the top 500 DEGs are shown in Figure 2B and C. For the details of DEGs see Tables S1–S3.
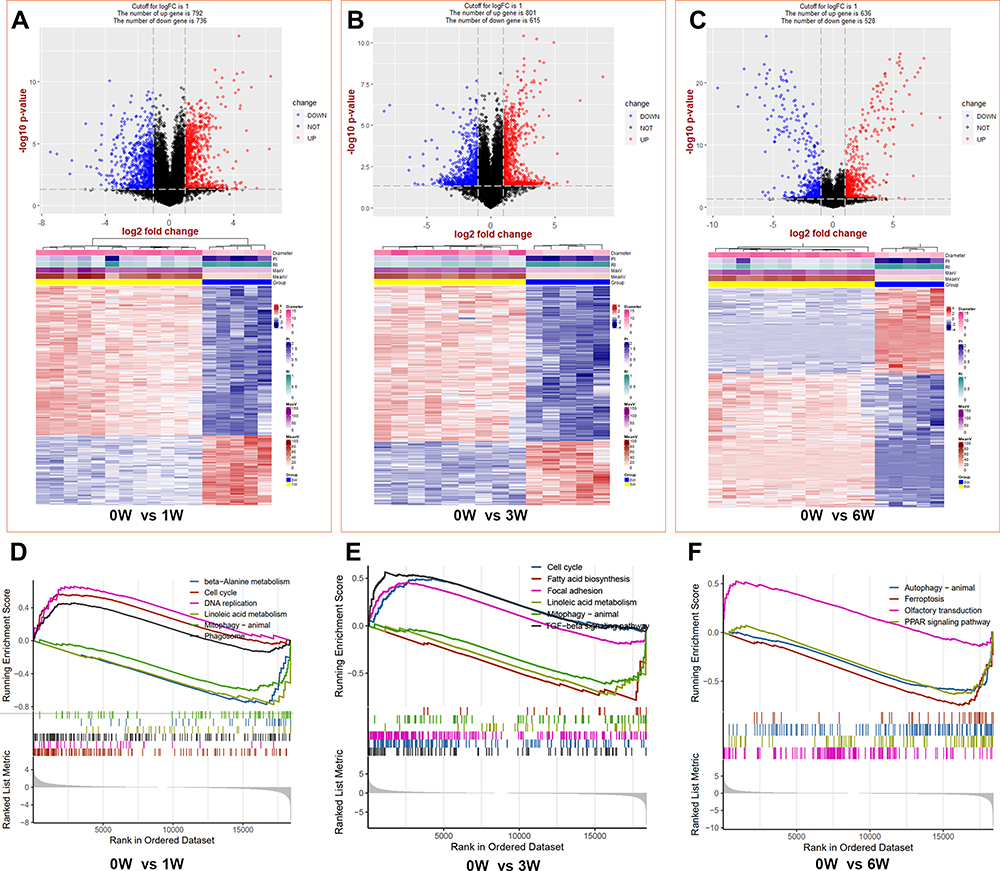 |
Figure 2 The identifications and GSEA analysis of DEGs between venous hypertension models and the control. (A–C) the top is the volcano of DEGs and the bottom are the heat map of the top 500 DEGs at 1, 3, and 6 weeks, respectively. (D–F) Gene set enrichment analysis (GSEA) at 1, 3, and 6 weeks, respectively. Abbreviations: PI, pulsatility index; RI, resistance index. |
Enrichment of GSEA
The results show that cell cycle, focal adhesion, and TGF-beta signaling pathways were upregulated, while the metabolism-related pathways, mitophagy, and autophagy were downregulated during the progression of venous hypertension (Figure 2D–F).
The Abundance of Vascular Microenvironmental Cells
Figure 3 compared the lymphoid, myeloid, and stromal cells abundance among control and VH models. Lymphocyte infiltrations were observed and involved in the VH process, especially the B cells, memory B cells, Th2 cells, and Treg cells (Figure 3A), while the abundance of the myeloid cells was decreased, like dendritic cells (Figure 3B). The compositions of the stromal cell were elevated; however, the abundance of smooth muscle cells was decreased in Figure 3C.
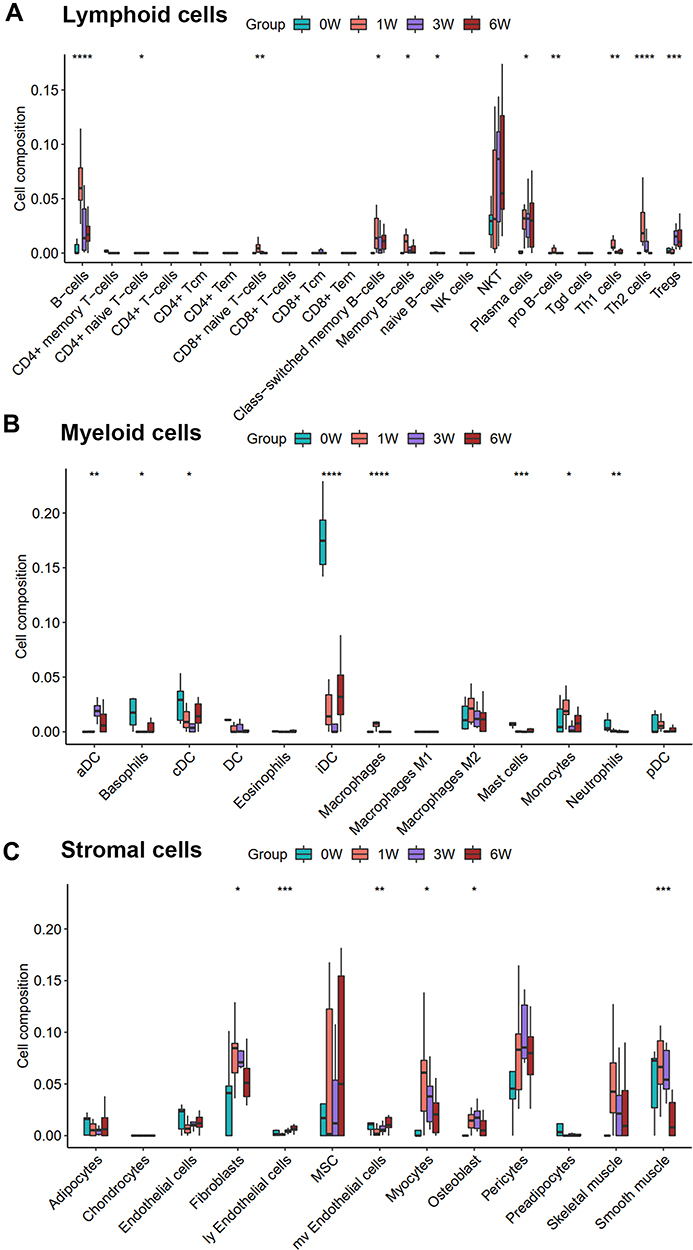 |
Figure 3 The change of abundance of cell types during the process of venous hypertension. (A–C) Boxplot charts of lymphoid cells, myeloid cells, and stromal cells, respectively. *p-value < 0.05, **p-value < 0.01, ***p-value < 0.001, ****p-value < 0.0001. |
Enrichment of KEGG Terms
We further identified 317 upregulated and 258 downregulated common genes that were consistently differentially expressed during AVM progression in the VH model after intersecting the results of three-time points (Figure 4A and B). To identify the potential biological pathways involved in the VH, we conducted KEGG analyses of the common up and downregulated genes. The KEGG results were consistent with the GSEA results (Figure 4C and D). The ECM–receptor interaction, TGF-beta signaling pathway, and focal adhesion were enriched in up-regulated genes, while the metabolism-related pathways were enriched in down-regulated genes.
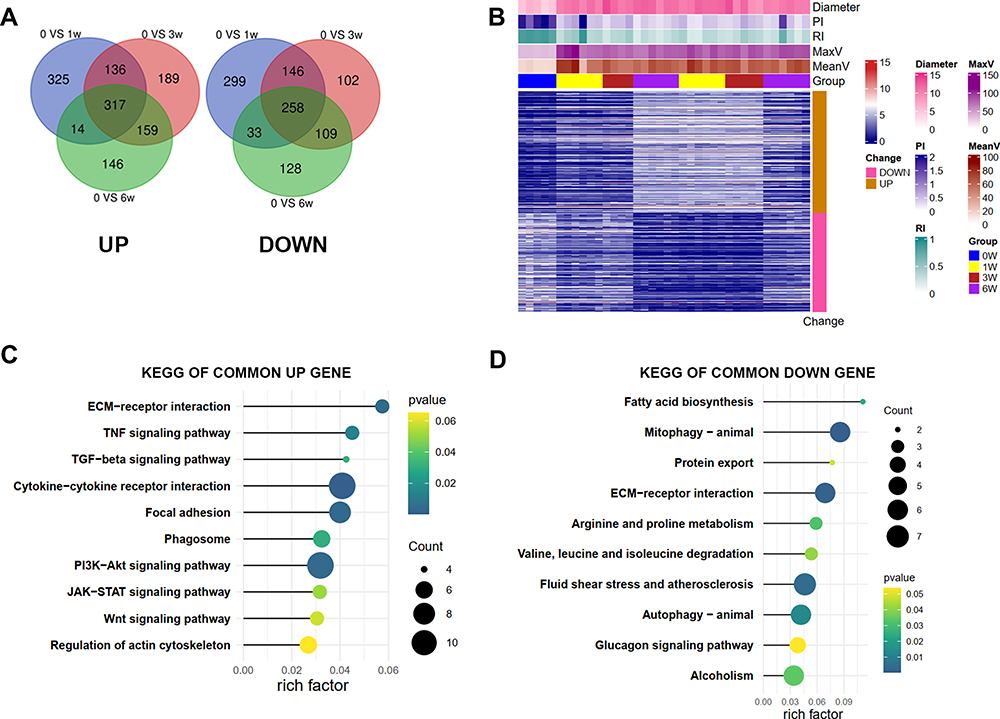 |
Figure 4 The identifications and the KEGG enrichments of common DEGs during the process of venous hypertension. (A) the common DEGs of up and down-regulated genes; (B) the heatmap of the common deregulated gene; (C) the KEGG enrichment analysis of up and (D) down-regulated common genes. Risk factors-the ratio of the number of genes annotated in a pathway to the number of all genes annotated in this pathway. |
Gene Co-Expression Network Analysis
We analyzed 5044 genes of the top 25% genes of mad to construct the co-expression network using the WGCNA algorithm. First, we performed sample clustering analysis to detect outliers of our 38 samples (Figure 5A). After removing the outliers, we converted the Pearson’s correlation matrix of the genes into a strengthening adjacency matrix by power β = 4 based on a scale-free topology (Figure 5B). We obtained 13 related co-expression modules after merging the module with the threshold of 0.25 and a minimum gene size of 30 (Figure 5C). Heatmap depicted the topological overlap matrix (TOM) among genes based on co-expression modules. A redder background indicates a higher module correlation (Figure 5D). Then, we constructed a Module–Trait relationship to detect the key modules related to the sample traits (Figure 5E). As a result, four modules with significantly coexpressed genes that were strongly related to the “Time” (0, 1, 3, and 6 weeks) trait were observed. Red (288 genes, r=0.63), yellow (539 genes, r=−0.63), purple (77 genes, r= −59), and brown (592 genes, r=0.54) modules were identified as the key modules, all modules with p-value <0.01 indicating an important gene set for further study (Figures 5F and S2).
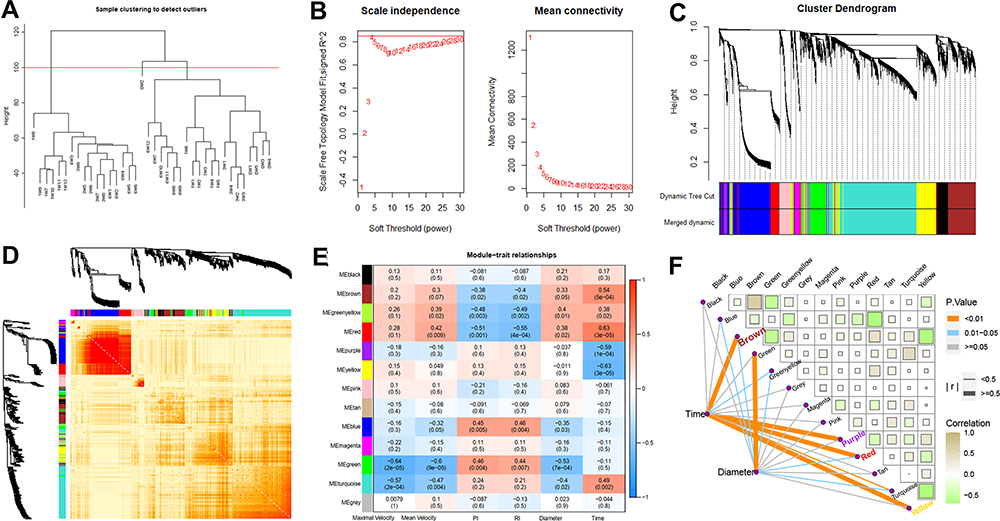 |
Figure 5 Co-expression network constructed by WGCNA to identify the key modules related to the VH progression. (A) outliers detection based on hierarchical clustering (B) the calculation of the optimal soft threshold (C) the construction of gene co-expression modules (D) the heat map of 400 genes randomly selected from these modules (E) the relationships of modules and sample traits (F) four key modules highly correlated with the “Times” trait (correlation > 0.5 or < −0.5). |
STEM Analysis
The STEM software was used to determine the temporal expression profiles related to VH progression. The genes from the above four co-expression modules were imported into the STEM. Eight significant clusters (cluster 48, 42, 49, 29, 30, 1, 9, 40, which are persistently up or down regulated) were identified with p<0.05 (Figure 6A). The expression patterns of these genes in the eight clusters were visualized by a heatmap (Figure 6B). A PPI network was constructed, and enrichment analysis of all significant clusters was performed using the Cluego to test the main biological function of these genes. The connections of pathways and related genes are shown in Figure 5C. Among these terms, six important biological pathways: ECM–receptor interaction, focal adhesion, leukocyte transendothelial migration, phosphatidylinositol signaling system, regulation of actin cytoskeleton, and TGF-beta signaling pathway were also previously identified and may serve as the potential research targets. The expression patterns of involved genes in these six pathways are presented in Figure 6D.
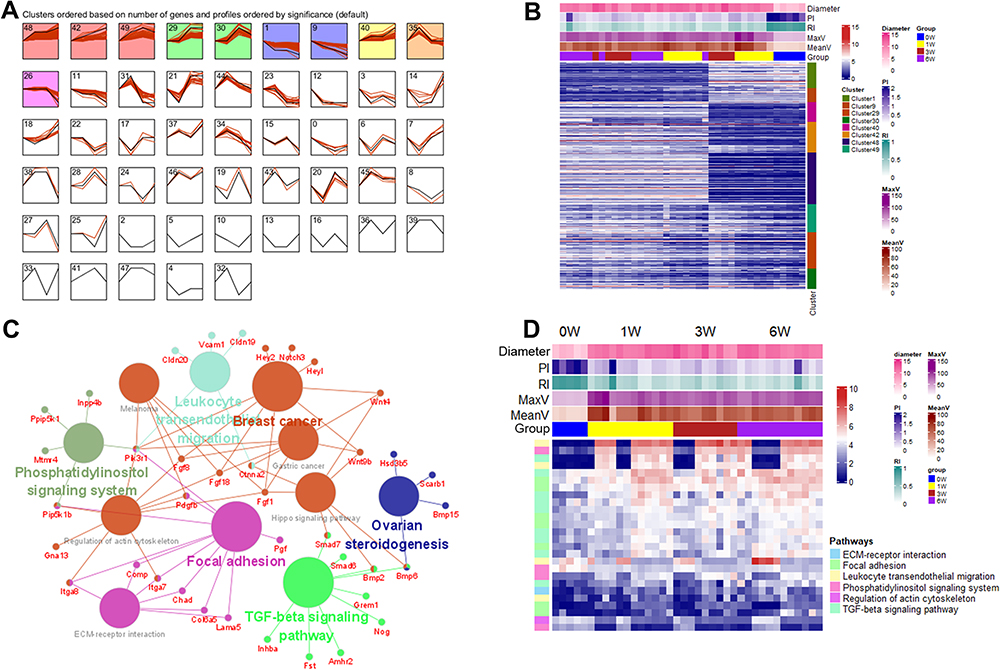 |
Figure 6 STEM analysis to identify gene clusters and pathways. (A) identification of eight clusters (cluster 48, 42, 49, 29, 30, 1, 9, 40) based on STEM analysis of the genes from key WGCNA modules; (B) the heat map of genes in the eight significant clusters; (C) the KEGG pathways identified by the Cluego. (D) the expression patterns of genes involved in six important biological functions. Abbreviation: STEM, the Short Time-series Expression Miner. |
The Key Genes and Upstream miRNA Prediction
The Cytoscape plugin cytoHubba was used to identify the hub genes from the PPI network. The top 15 genes were identified using the DMNC algorithm (Figure 7A). Adamts9 and Chad were excluded as they did not show significant expression among groups. The expression correlation of the remaining 13 genes is shown in Figures 7B and S3. Then, three miRNA-gene databases were searched to trace the upstream miRNA of the 13 genes. Among them, Spon2, Smad6, Adamtsl2, Bmp6, Comp, and Adamts8 did not match with their miRNA after intersecting the three databases. A total of 35 miRNAs were predicted, and miR-25a-5p, miR-27a-3p, and miR-92b-3p had three target genes. Itga8 and Smad7 were the top 2 genes with 13 and 14 upstream miRNAs, respectively. The network of genes and their upstream miRNA and co-expression modules of WGCNA are constructed in Figure 7C with a sankey diagram.
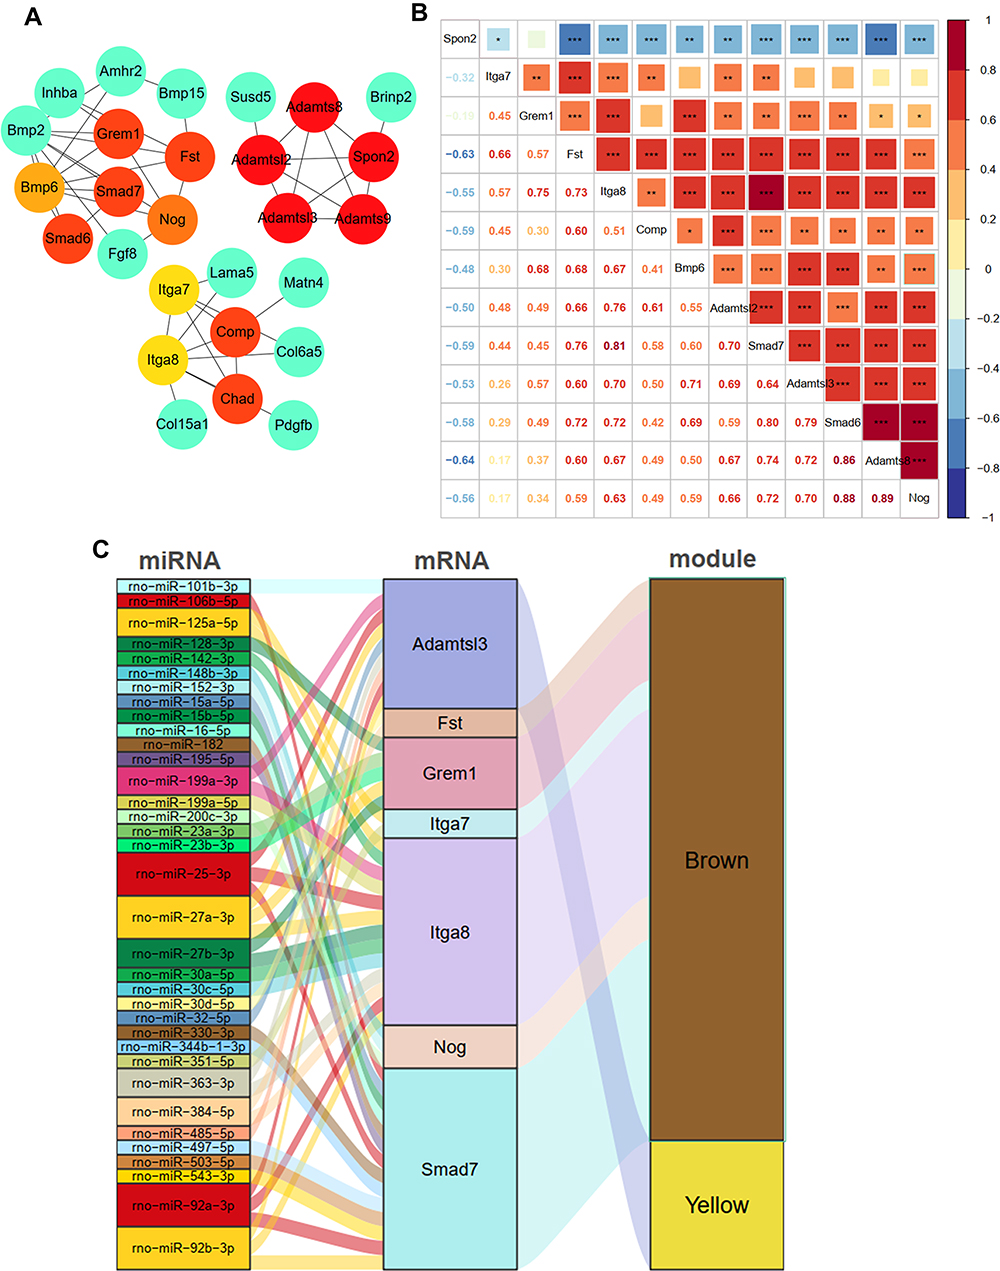 |
Figure 7 Identification of candidate genes and construction of miRNA-Gene network. (A) the top 15 genes identified by the DMNC algorithm; (B) the relationships of 13 different expression genes during venous hypertension; (C) the miRNA–mRNA–modules network. *p-value < 0.05, **p-value < 0.01, ***p-value < 0.001. |
Small Molecule Drug Analysis
The above 13 genes (after removing Adamts9 and Chad) were homologically mapped to human gene symbols before importing them into the connectivity Map (cMap). The score (combination of the up scores and down scores) was most negatively connected with our query signatures if equal to −1. A total of 6100 small molecules were matched. Of these, 9 drugs with a score < −0.9 were identified as follows: isoflupredone, diethylcarbamazine, ondansetron, Chicago Sky Blue 6B, lithocholic acid, estradiol, metoprolol, mimosine, and ajmaline (Table 2). Their conformer structures are shown in Figure S4.
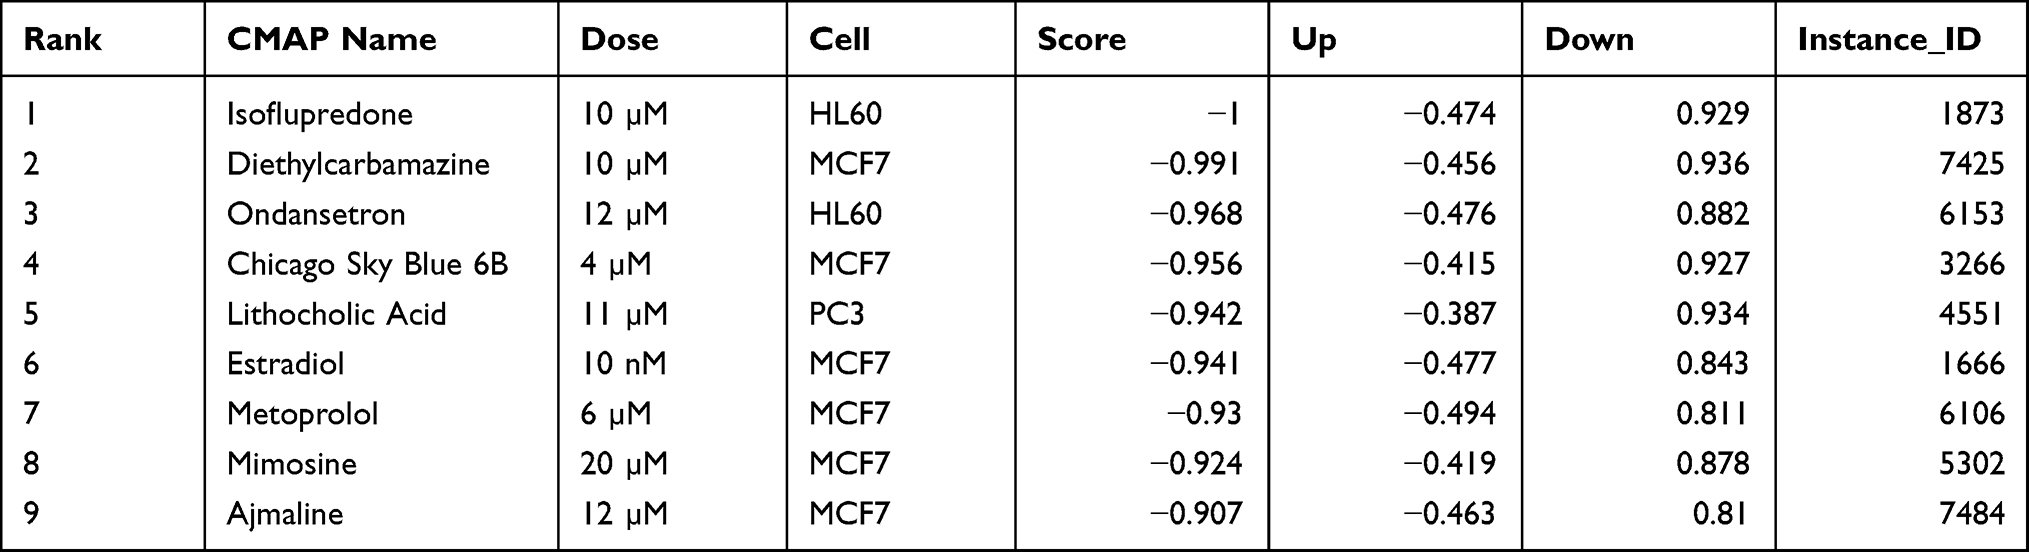 |
Table 2 Identified 9 Small Molecular Components from CMAP |
RT-qPCR Internal Validation and Immunostaining in AVM Tissue
Five DEGs (four most connective genes: Adamtsl2, Adamtsl3, Adamts8, and Spon2 and one gene with the one of most miRNA targets: Itga8) were selected to evaluate the consistency of the microarray by conducting the RT-qPCR. The primer sequences used for the real-time PCR analysis are presented in Table 3. From baseline level to 6 weeks VH, the expression levels of the five genes were increased (Figure 8). Among them, Adamtsl2, Adamtsl3, Adamts8, and Itga8 showed great consistency with our bioinformatics analysis, while the expression level of Spon2 showed difference, which presents the decreasing trend in RNA-sequencing.
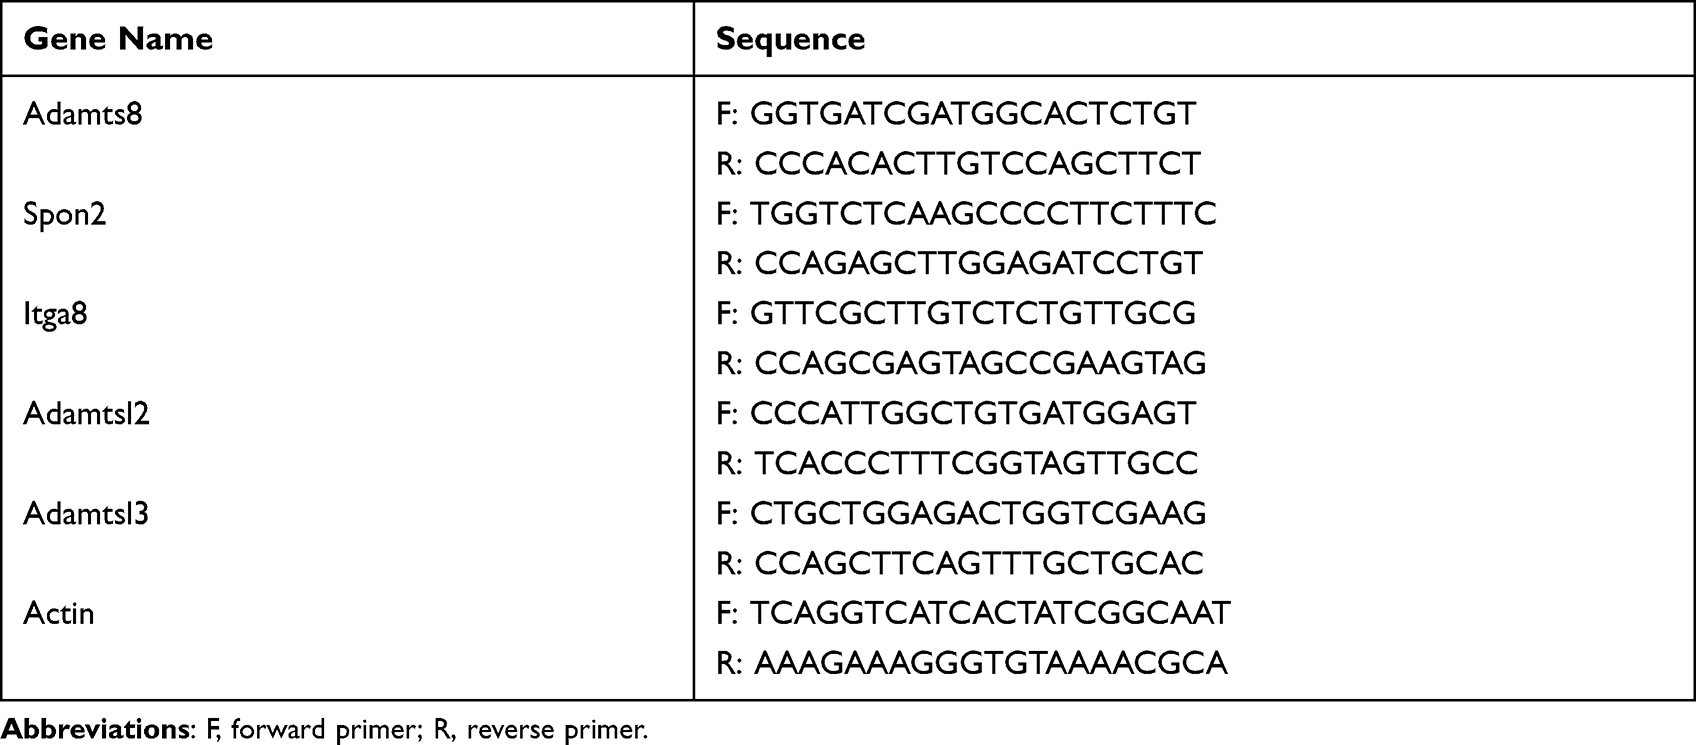 |
Table 3 Primers Used for Quantitative RT-qPCR Analysis |
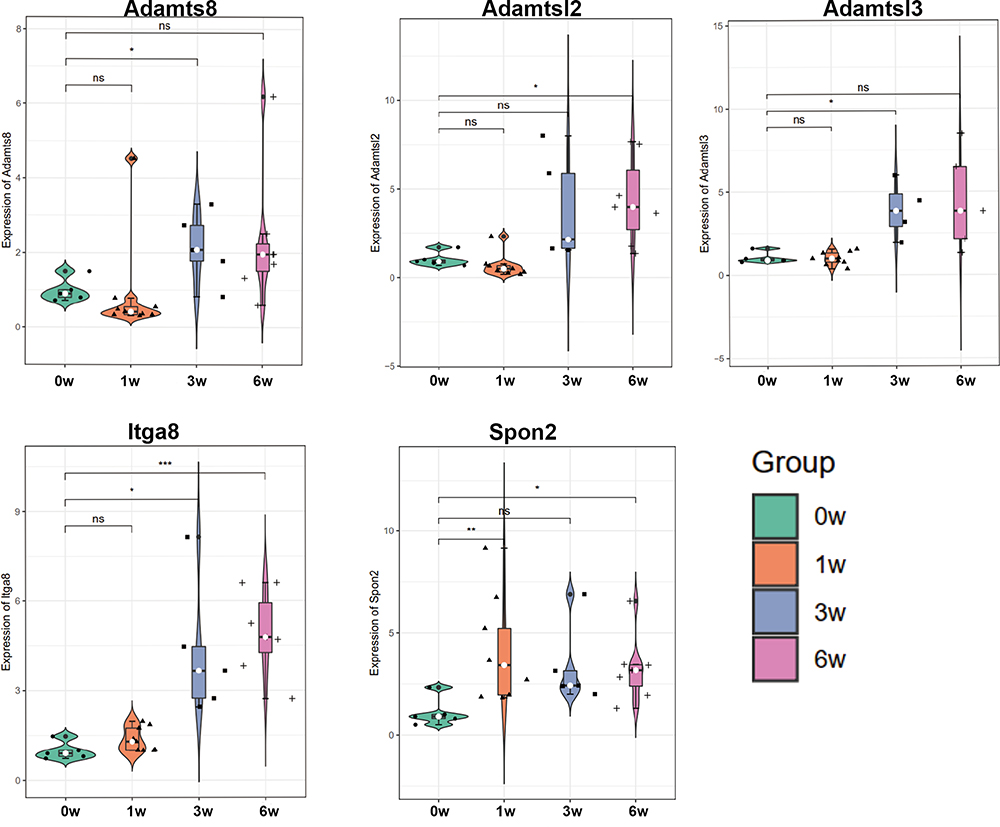 |
Figure 8 Validation of the expression levels of five candidate genes (Adamts8, Adamtsl2, Adamtsl3, Itga8, and Spon2) by RT-qPCR among groups. *p-value < 0.05, **p-value < 0.01, ***p-value < 0.001. |
To detect the expression of the five genes in human tissue, we performed immunohistochemical experiments in bAVM and normal intracranial vascular tissue. Besides, to verify whether the abundance of smooth muscle cells (VSMC) was decreased, the expression of α-SMA was also detected. Although RT-qPCR analysis showed the increasing of mRNA of SPON2, the expression of its protein in bAVM was decreased compared with the normal tissue, consistent with RNA-Seq (Figure 9A). Our results showed that in protein level, ADAMTSL2 and ITGA8 were elevated, same with the bioinformatics and RT-qPCR analysis (Figure 9B–D). We observed the decreasing trend of α-SMA in bAVM tissue, but no significant difference was detected (Figure S5A and D). No difference was observed in bAVM for the ADAMTS8 (Figure S5B), and significant decreasing of ADAMTSL3 were detected and presented in Figure S5C, although opposite with the result of our RT-qPCR analysis.
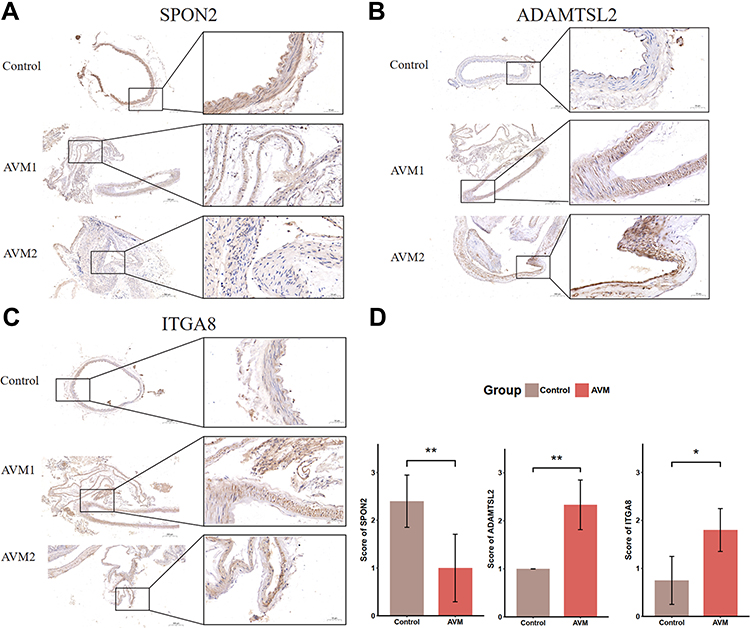 |
Figure 9 Detection of SPON2, ADAMTSL2, and ITGA8 in human tissue sample. Immunohistochemical staining of control (up) and AVM (middle and bottom) tissue samples for SPON2 (A), ADAMTSL2 (B) and ITGA8 (C). (D) shows the significant difference of staining scores of SPON2, ADAMTSL2, and ITGA8. AVM indicates brain arteriovenous malformations. *p-value < 0.05, **p-value < 0.01. |
Considering the important role of ADAMTSL2, we further performed a dual immunofluorescence assay with α-SMA to localize its position in vascular tissue. We observed ADAMTSL2 was increased in bAVM and localized in the VSMC in Figure S6.
Discussion
AVM-associated hemorrhage has a 5–10% chance of death and a 30–50% chance of permanent disabling or neurologic deficits.14 The primary goal for brain AVM treatment is to prevent rupture and hemorrhage. Although the hemodynamics are responsible for rupture, the cellular and molecular mechanisms are still unclear. Therefore, it is indispensable to identify underlying mechanisms before rupture. Our study established VH rat models with high-flow arteriovenous shunting. Then, we conducted RNA sequencing of the vein at various time points to identify potential genes, pathways, and small therapeutic components using integrated bioinformatics analysis. The candidate genes were further validated in VH groups with RT-qPCR and immunostaining.
Hemodynamic parameters showed that VH models presented with high-flow and low-resistance characteristics, similar to pathophysiological AVM conditions. In GSEA analysis, the cell cycle and DNA replication were upregulated, while some metabolism processes were downregulated, implying a shift from catabolism to anabolism in VH conditions. To uncover which type of cells were involved, we used the xCell algorithms to generate cell-type enrichment scores and adjust them to cell-type proportion. In our results, the abundances of B, T helper-2 (Th2), and regulatory T (Treg) lymphocytes were elevated. Early studies15,16 showed the importance of neuroinflammation in bAVM pathophysiology. Th2 and Treg are dominantly cellular sources of pathogenic IL-6, a key pro-inflammatory cytokine contributing to brain AVM intracranial hemorrhage.15 We also observed that most myeloid cells were suppressed in our VH models, especially the immature DC, basophils, mast cells, and neutrophils. The macrophages were increased at the first week while reverting to the control levels in 3 and 6 weeks. It is a little contrast with an early study where Chen et al identified that macrophages are frequent in the vascular wall of AVM tissue, while the neutrophils were also observed.17 These contrasting observations highlight the complexity of inflammation in bAVMs. In the stromal enrichments, the levels of Smooth muscular cells (SMC) were decreased. SMCs are crucial to maintaining vascular homeostasis. Following vessel injury, the quiescent, differentiated contractile SMC underwent a phenotypic transition to a secretory phenotype to secrete extracellular matrix (ECM), causing vascular remodeling and instability.18 These were agreeable with the next KEGG results of commonly deregulated genes. Based on the enrichment results, we hypothesized that the inflammation, phenotypic change in SMC, and the unbalanced ECM accumulation could contribute to the instability of the vessel, conformable with an RNA-seq study in human AVM.19 However, in our next immunohistochemical experiment, no significant decreasing of α-SMA was observed. Besides, future VSMC differentiation experiments are necessary to exploring SMC roles in bAVM.
To verify our findings and identify potential key genes, we established a co-expression network with the WGCNA algorithm. Instead of focusing only on differential gene expression, WGCNA uses expression information to identify a set of co-expression genes and establish the associations of thousands of genes with phenotypes into associations between several gene modules and sample traits. We constructed 13 modules, of which only 4 modules exhibited a significant and tight relationship with “Time” (that is, correlated with the progression of VH).
For the genes in these 4 modules, we further identified significant gene clusters with specific expression patterns by applying the Short Time-series Expression Miner (STEM) software in different time points of VH. The STEM analysis screened 8 clusters with 344 genes, mostly correlated with the VH. After constructing the PPI network, Cluego established the interaction of KEGG pathways and genes involved in these pathways. Six pathway terms were identified and may play a role in AVM. The 6 terms include focal adhesion, TGF-beta signaling pathway, phosphatidylinositol signaling system, ECM–receptor interaction, and leukocyte transendothelial migration pathways, further proving our previous analysis. Focal adhesions (dense plaques) located at the plasma membrane of smooth muscle cells are associated with the actin cytoskeleton. Mechanical stress or external stimuli could induce remodeling of focal adhesions, simultaneous with the cytoskeletal rearrangement.20 In our hypertension venous rat model, high-flow perfusion could trigger the focal adhesion pathway and cause vascular remodeling by altering ECM components and SMC architecture. Hereditary hemorrhagic telangiectasia (HHT), linked to 5% of bAVMs, is associated with three genes: ENG, ALK1, and SMAD4. All three genes are components of signal transduction of TGF-β family members, a signaling pathway essential for angiogenesis.21 TGF-β regulates tissue remodeling and wound healing, but upregulated signaling leads to excess ECM deposition,18 which may cause the instability of the vessel. Research has shown the role of TGF-β22 in AVM formation; however, it seems to be inactivated or minimally activated in BAVM rupture.
To elucidate the pathological mechanism from gene levels, the top 15 genes were identified using cytoHubba. Of these, two genes (Adamts9 and Chad) showing insignificant expression among groups were removed. The remaining genes were Adamts8, Adamtsl3, Spon2, Adamtsl2, Chad, Itga7, Comp, Itga8, Bmp6, Fst, Smad6, Smad7, Grem1, and Nog. Among them, Adamts8, Adamtsl3, Spon2, and Adamtsl2 showed high connectivity. The ADAMTS (a disintegrin and metalloproteinase with thrombospondin motifs) family participated in ECM degradation and correlated with cardiovascular diseases (atherosclerosis, hypertension, aneurysm, myocardial infarction, and heart failure).23 ADAMTS family may influence the adhesion and recruitment of macrophages in atherosclerosis.24 The interplay between AVM and ADAMTS is still unclear, especially during rupture. In our next experiments, we verified the expression of Adamtsl2 with RT-qPCR in VH rat and immunohistochemical staining in human tissue. The roles of Adamtsl2 in vascular pathological process were previously studied. Kato et al found the mRNA expression of Adamtsl2 that is involved in forming the extracellular matrix network was suppressed by candesartan treatment, therefore, normalizing the vascular distensibility and cerebral blood flow in arteriopathy.25 The increasing expressions of Adamtsl2 in heart disease were also observed.26,27 SPON2 belongs to the F-spondin family of secreted extracellular matrix proteins, and act as pattern recognition receptors to regulate immunity. The transcriptional activation of SPON2 can promote macrophage chemotaxis ability in vascular endothelial cells, and the endothelial derived chemoattractive cue for macrophage migration can be suppressed after SPON2 deletion.28 However, in our RNA-Seq and immunohistochemical analysis, the expression of SPON2 was down-regulated. Further studies are needed to explore the relationship between SPON2 and immunity.
Further, we identified miR-25a-3p, miR-27a-3p, and miR-92b-3p with the prediction of the upstream miRNA of these genes because they interact with three target genes. miR-27a-3p can reduce calcium deposition in vascular smooth muscle cells by targeting activating transcription factor 3 (ATF3)29 and inhibit SMC proliferation by suppressing the expression of Rho guanine nucleotide exchange factor 26 (ARHGEF26).30 Inhibition of miR-92b-3p can attenuate VSMC proliferation induced by hypoxia. Both miR-27a-3p and miR-92b-3p played vital roles in VSMC proliferation; furthermore, they had the shared target – Itga8 in our study. Besides, we observed and validated the expression level of Itga8 was up-regulated. In the early analysis of expression and promoter, Itga8, a highly restricted integrin gene, showed abundant expression in SMC.31 In a chronic renal interstitial fibrosis study, Itga8 can attenuate tubulointerstitial fibrosis via regulation of TGF-β signaling, fibroblast activation, and/or immune cell infiltration.32 Its role was firstly identified in our work in AVM, and the role of it and the upstream miRNA need to be deeply studied in future AVM analysis. Last, we predicted some small molecular components with a reverse relationship of these genes from CMap. Estradiol,33 diethylcarbamazine,34 and mimosine35 showed their efficacy in vascular treatments and may serve as potential drugs for treating AVM in the future.
This study has some limitations. First, the sample sizes are small in every group. The reasons are that the rats were divided into four groups to observe the progression of VH models, which cause the dilution in every sample. Besides, the VH modeling techniques are difficult, bringing a poor survival rate for these models. Second, the expression of the candidate genes was preliminarily validated in bAVM, but the exactly mechanisms of them need further exploring. Last, the genes and the predicted miRNA and drugs also need to be validated in a real-world situation. Therefore, the validation and intervention researches will be conducted in the future.
Conclusion
We depicted the transcriptional landscapes and key genes in a venous hypertension rat model via RNA sequencing with comprehensive analysis. The inflammation, phenotypic change in SMC, and the unbalanced ECM accumulation could contribute to the instability of the vessel and ultimately lead to rupture. The identified gene networks of Adamtsl3, Spon2, Adamtsl2, and Itga8 provided key genes for further intervention.
Ethics Approvals
This study was approved by the Ethics Committee of Xiangya Hospital and Central South University (number: 201803717).
Acknowledgments
The authors would like to thank Qian Zhang (Central South University) for the technical assistance of the wet lab experiments (qPCR and immunohistochemistry).
Funding
This study has received funding by grants from the National Natural Science Foundation of China (Grant Number 81873756) and the Fundamental Research Funds for the Central Universities of Central South University (Grant Number 160171016).
Disclosure
The authors declare that they have no competing interests.
References
1. Friedlander RM. Clinical practice. Arteriovenous malformations of the brain. N Engl J Med. 2007;356(26):2704–2712. doi:10.1056/NEJMcp067192
2. Al-Shahi R. A systematic review of the frequency and prognosis of arteriovenous malformations of the brain in adults. Brain. 2001;124(Pt 10):1900–1926. doi:10.1093/brain/124.10.1900
3. Lawton MT, Rutledge WC, Kim H, et al. Brain arteriovenous malformations. Nat Rev Dis Primers. 2015;1:15008. doi:10.1038/nrdp.2015.8
4. Herman JM, Spetzler RF, Bederson JB, Kurbat JM, Zabramski JM. Genesis of a dural arteriovenous malformation in a rat model. J Neurosurg. 1995;83(3):539–545. doi:10.3171/jns.1995.83.3.0539
5. Terada T, Higashida RT, Halbach VV, et al. Development of acquired arteriovenous fistulas in rats due to venous hypertension. J Neurosurg. 1994;80(5):884–889. doi:10.3171/jns.1994.80.5.0884
6. National Research Council (US) Committee for the Update of the Guide for the Care and Use of Laboratory Animals. Guide for the care and use of laboratory animals. The National Academies Collection: Reports funded by National Institutes of Health. Washington (DC): National Academies Press (US)Copyright © 2011, National Academy of Sciences; 2011.
7. Bederson JB, Wiestler OD, Brüstle O, Roth P, Frick R, Yaşargil MG. Intracranial venous hypertension and the effects of venous outflow obstruction in a rat model of arteriovenous fistula. Neurosurgery. 1991;29(3):341–350. doi:10.1227/00006123-199109000-00002
8. Cheng P, Ma L, Shaligram S, et al. Effect of elevation of vascular endothelial growth factor level on exacerbation of hemorrhage in mouse brain arteriovenous malformation. J Neurosurg. 2019;132(5):1566–1573. doi:10.3171/2019.1.JNS183112
9. Ritchie ME, Phipson B, Wu D, et al. limma powers differential expression analyses for RNA-sequencing and microarray studies. Nucleic Acids Res. 2015;43(7):e47. doi:10.1093/nar/gkv007
10. Subramanian A, Kuehn H, Gould J, Tamayo P, Mesirov JP. GSEA-P: a desktop application for gene set enrichment analysis. Bioinformatics. 2007;23(23):3251–3253. doi:10.1093/bioinformatics/btm369
11. Aran D, Hu Z, Butte AJ. xCell: digitally portraying the tissue cellular heterogeneity landscape. Genome Biol. 2017;18(1):220. doi:10.1186/s13059-017-1349-1
12. Yu G, Wang LG, Han Y, He QY. clusterProfiler: an R package for comparing biological themes among gene clusters. Omics. 2012;16(5):284–287. doi:10.1089/omi.2011.0118
13. Langfelder P, Horvath S. WGCNA: an R package for weighted correlation network analysis. BMC Bioinform. 2008;9:559. doi:10.1186/1471-2105-9-559
14. Solomon RA, Connolly ES
15. Chen Y, Pawlikowska L, Yao JS, et al. Interleukin-6 involvement in brain arteriovenous malformations. Ann Neurol. 2006;59(1):72–80. doi:10.1002/ana.20697
16. Pawlikowska L, Tran MN, Achrol AS, et al. Polymorphisms in genes involved in inflammatory and angiogenic pathways and the risk of hemorrhagic presentation of brain arteriovenous malformations. Stroke. 2004;35(10):2294–2300. doi:10.1161/01.STR.0000141932.44613.b1
17. Chen Y, Zhu W, Bollen AW, et al. Evidence of inflammatory cell involvement in brain arteriovenous malformations. Neurosurgery. 2008;62(6):1340–1349. doi:10.1227/01.neu.0000333306.64683.b5
18. Xie Y, Ostriker AC, Jin Y, et al. LMO7 is a negative feedback regulator of transforming growth factor β signaling and fibrosis. Circulation. 2019;139(5):679–693. doi:10.1161/CIRCULATIONAHA.118.034615
19. Hauer AJ, Kleinloog R, Giuliani F, et al. RNA-sequencing highlights inflammation and impaired integrity of the vascular wall in brain arteriovenous malformations. Stroke. 2020;51(1):268–274. doi:10.1161/STROKEAHA.119.025657
20. Ohanian J, Pieri M, Ohanian V. Non-receptor tyrosine kinases and the actin cytoskeleton in contractile vascular smooth muscle. J Physiol. 2015;593(17):3807–3814. doi:10.1113/jphysiol.2014.284174
21. Barbosa Do Prado L, Han C, Oh SP, Su H. Recent advances in basic research for brain arteriovenous malformation. Int J Mol Sci. 2019;20(21):5324. doi:10.3390/ijms20215324
22. Moftakhar P, Hauptman JS, Malkasian D, Martin NA. Cerebral arteriovenous malformations. Part 1: cellular and molecular biology. Neurosurg Focus. 2009;26(5):E10.
23. Zhong S, Khalil RA, Disintegrin A. Metalloproteinase (ADAM) and ADAM with thrombospondin motifs (ADAMTS) family in vascular biology and disease. Biochem Pharmacol. 164; 2019:188–204.
24. Ashlin TG, Kwan AP, Ramji DP. Regulation of ADAMTS-1, −4 and −5 expression in human macrophages: differential regulation by key cytokines implicated in atherosclerosis and novel synergism between TL1A and IL-17. Cytokine. 2013;64(1):234–242. doi:10.1016/j.cyto.2013.06.315
25. Kato T, Manabe RI, Igarashi H, et al. Candesartan prevents arteriopathy progression in cerebral autosomal recessive arteriopathy with subcortical infarcts and leukoencephalopathy model. J Clin Invest. 2021;131(22). doi:10.1172/JCI140555
26. Rypdal KB, Erusappan PM, Melleby AO, et al. The extracellular matrix glycoprotein ADAMTSL2 is increased in heart failure and inhibits TGFβ signalling in cardiac fibroblasts. Sci Rep. 2021;11(1):19757. doi:10.1038/s41598-021-99032-2
27. Trenson S, Hermans H, Craps S, et al. Cardiac microvascular endothelial cells in pressure overload-induced heart disease. Circ Heart Fail. 2021;14(1):e006979. doi:10.1161/CIRCHEARTFAILURE.120.006979
28. Li N, Liu S, Zhang Y, et al. Transcriptional activation of matricellular protein spondin2 (SPON2) by BRG1 in vascular endothelial cells promotes macrophage chemotaxis. Front Cell Dev Biol. 2020;8:794. doi:10.3389/fcell.2020.00794
29. Choe N, Kwon DH, Ryu J, et al. miR-27a-3p targets ATF3 to reduce calcium deposition in vascular smooth muscle cells. Mol Ther Nucleic Acids. 2020;22:627–639. doi:10.1016/j.omtn.2020.09.030
30. Zahedi F, Nazari-Jahantigh M, Zhou Z, et al. Dicer generates a regulatory microRNA network in smooth muscle cells that limits neointima formation during vascular repair. Cell Mol Life Sci. 2017;74(2):359–372. doi:10.1007/s00018-016-2349-0
31. Kitchen CM, Cowan SL, Long X, Miano JM. Expression and promoter analysis of a highly restricted integrin alpha gene in vascular smooth muscle. Gene. 2013;513(1):82–89. doi:10.1016/j.gene.2012.10.073
32. Marek I, Lichtneger T, Cordasic N, et al. Alpha8 integrin (Itga8) signalling attenuates chronic renal interstitial fibrosis by reducing fibroblast activation, not by interfering with regulation of cell turnover. PLoS One. 2016;11(3):e0150471. doi:10.1371/journal.pone.0150471
33. Vieira RF, Breithaupt-Faloppa AC, Matsubara BC, et al. 17β-estradiol protects against lung injuries after brain death in male rats. J Heart Lung Transplant. 2018;37(11):1381–1387. doi:10.1016/j.healun.2018.06.015
34. Abaitey AK, Parratt JR. Cardiovascular effects of diethylcarbamazine citrate. Br J Pharmacol. 1976;56(2):219–227. doi:10.1111/j.1476-5381.1976.tb07445.x
35. Trimmel K, Cvikl B, Müller HD, et al. L-mimosine increases the production of vascular endothelial growth factor in human tooth slice organ culture model. Int Endod J. 2015;48(3):252–260. doi:10.1111/iej.12307
 © 2022 The Author(s). This work is published and licensed by Dove Medical Press Limited. The full terms of this license are available at https://www.dovepress.com/terms.php and incorporate the Creative Commons Attribution - Non Commercial (unported, v3.0) License.
By accessing the work you hereby accept the Terms. Non-commercial uses of the work are permitted without any further permission from Dove Medical Press Limited, provided the work is properly attributed. For permission for commercial use of this work, please see paragraphs 4.2 and 5 of our Terms.
© 2022 The Author(s). This work is published and licensed by Dove Medical Press Limited. The full terms of this license are available at https://www.dovepress.com/terms.php and incorporate the Creative Commons Attribution - Non Commercial (unported, v3.0) License.
By accessing the work you hereby accept the Terms. Non-commercial uses of the work are permitted without any further permission from Dove Medical Press Limited, provided the work is properly attributed. For permission for commercial use of this work, please see paragraphs 4.2 and 5 of our Terms.