")
Back to Journals » International Journal of Nanomedicine » Volume 11
The synergistic effect of TiO2 nanoporous modification and platelet-rich plasma treatment on titanium-implant stability in ovariectomized rats
Authors Jiang N, Du P, Qu W, Li L, Liu Z, Zhu S
Received 23 May 2016
Accepted for publication 6 July 2016
Published 16 September 2016 Volume 2016:11 Pages 4719—4733
DOI https://doi.org/10.2147/IJN.S113375
Checked for plagiarism Yes
Review by Single anonymous peer review
Peer reviewer comments 3
Editor who approved publication: Dr Linlin Sun
Nan Jiang,1,2 Pinggong Du,2 Weidong Qu,2 Lin Li,2 Zhonghao Liu,2 Songsong Zhu1
1State Key Laboratory of Oral Diseases and Department of Oral and Maxillofacial Surgery, West China Hospital of Stomatology, Sichuan University, Chengdu, 2Yantai City Stomatological Hospital, Yantai, People’s Republic of China
Abstract: For several decades, titanium and its alloys have been commonly utilized for endosseous implantable materials, because of their good mechanical properties, chemical resistance, and biocompatibility. But associated low bone mass, wear and loss characteristics, and high coefficients of friction have limited their long-term stable performance, especially in certain abnormal bone-metabolism conditions, such as postmenopausal osteoporosis. In this study, we investigated the effects of platelet-rich plasma (PRP) treatment and TiO2 nanoporous modification on the stability of titanium implants in osteoporotic bone. After surface morphology, topographical structure, and chemical changes of implant surface had been detected by scanning electron microscopy (SEM), atomic force microscopy, contact-angle measurement, and X-ray diffraction, we firstly assessed in vivo the effect of PRP treatment on osseointegration of TiO2-modified implants in ovariectomized rats by microcomputed tomography examinations, histology, biomechanical testing, and SEM observation. Meanwhile, the potential molecular mechanism involved in peri-implant osseous enhancement was also determined by quantitative real-time polymerase chain reaction. The results showed that this TiO2-modified surface was able to lead to improve bone implant contact, while PRP treatment was able to increase the implant surrounding bone mass. The synergistic effect of both was able to enhance the terminal force of implants drastically in biomechanical testing. Compared with surface modification, PRP treatment promoted earlier osteogenesis with increased expression of the RUNX2 and COL1 genes and suppressed osteoclastogenesis with increased expression of OPG and decreased levels of RANKL. These promising results show that PRP treatment combined with a TiO2-nanomodified surface can improve titanium-implant biomechanical stability in ovariectomized rats, suggesting a beneficial effect to support the success of implants in osteoporotic bone.
Keywords: TiO2 nanotubes, PRP, titanium implants, ovariectomized rats
Introduction
For several decades, titanium and its alloys have been commonly utilized for endosseous implanted materials, because of their good mechanical properties, chemical resistance, and biocompatibility. But associated low bone mass, wear and loss characteristics, and high coefficients of friction have limited their long-term stability, especially in certain abnormal intraosseous conditions, such as postmenopausal osteoporosis, which is characterized by low osseous mass and microenvironmental disruption of bones.1–3 Under these circumstances, the stability of implants depends on two aspects: 1) the osseous microenvironment around the implant, resting with the quality and quantity of the bone substance; and 2) the osseointegration (OI) of the implant, defined as the performance of direct bone–implant interface bonding.4 Many attempts, such as drug therapy, chemical modification, and surface roughening, have been made to enhance implant stability in osteoporotic bone, but the results are still less than satisfactory.5–7
Over the course of the past few years, major strides have been made in TiO2-nanosystem surface modification, due to a lot of significant progress in electrochemistry, catalysis, energetics, and corrosion.8–10 Many researchers have applied electrochemical anodization technique to create TiO2 nanotubes or nanopores on the surface of biomaterials to stimulate cell proliferation, cell adhesion, or mineralization of osteoblasts in vitro, and have achieved some good results.11–13 In addition, it has been proved that TiO2 nanotubes can generate better OI in vivo, due to their biomimetic scale and bone-resembling elasticity.14 However, the effects of TiO2 on titanium implant stability under osteoporotic conditions are still largely unknown.
Platelet-rich plasma (PRP) is defined as a concentration of platelets within the small plasma fraction of autologous blood, and can be produced through many methods.15 There are high quantities of some key growth factors, PDGF-AB, TGFβ1, VEGF, and many other cytokines.16 According to the literature, PRP has a definite effect in improving bone healing. Some encouraging results from animal studies have also proved the promising effect of PRP on osteogenesis.17,18 In addition, PRP has been demonstrated to promote bone regeneration and to suppress adipogenesis within the marrow of ovariectomized (Ovx) senescence-accelerated mice.19,20 However, whether PRP treatment can accelerate the surrounding bone mass of titanium implants in osteoporotic bone remains unknown.
Therefore, the present study aimed to explore the synergistic effect of TiO2 nanoporous modification and PRP treatment on titanium-implant stability in osteoporotic bone. The in vitro properties of the sample surface were determined by scanning electron microscopy (SEM), atomic force microscopy (AFM), X-ray diffraction (XRD), and hydrophilic testing. Then, the titanium rod-shaped implants were positioned into the proximal tibial metaphysis and medullary canal of Ovx rats and divided into four groups: control implant without any other treatment (group A); anodized TiO2 nanoporous implant (group B); control implant with PRP treatment (group C); and anodized TiO2 nanoporous implant with PRP treatment (group D). Twelve weeks after operation, the proximal tibiae containing implants were evaluated by microcomputed tomography (micro-CT) examinations, histology, biomechanical testing and SEM observation. Meanwhile, the potential molecular mechanisms involved in peri-implant osseous enhancement were also determined by quantitative reverse-transcription polymerase chain reaction (qRT-PCR).
Materials and methods
Preparation of samples
A total of 96 cylindrical titanium implants (length 12 mm, diameter 0.9 mm) were employed as base materials for further surface treatments. After being processed in acetone, alcohol, and deionized water, all the samples were dried at 45°C for further treatment; 48 cylinders were used as the control group, while 48 were prepared by a hydrothermal procedure to create TiO2 nanotubes. A one-step anodization to prepare the samples was completed using an Autolab PGSTAT302N electrochemical workstation (Metrohm AG, Herisau, Switzerland). The 48 implants of the treatment group were separately etched in a mixture of HNO3:HF:H2O at a ratio of 14:6:80 for 12 hours. A platinum plate and a sample were then placed to the anode and cathode of a direct current power generator. The TiO2 nanotubes were manufactured in a 20 wt% H2O glycerol solution and 0.5 wt% NH4F, at continuous pulse power for 1 hour (24 V and 24 mA/cm2) and a 0.02-millisecond cycle. All samples were cleaned in distilled water and sterilized by autoclaving.
Surface characterization
The morphology and topography of the sample surface was scanned by field-emission SEM (Inspect F; FEI, Hillsboro, OR, USA) and AFM (Nanoscope MultiMode & Explore SPM; Veeco Instruments Inc., Plainview, NY, USA). Meanwhile, surface roughness was routinely characterized by AFM, which proceeded under tapping mode in ambient air with a scan size of 5×5 μm2 and a scan rate of 0.7016 Hz. The root mean square, Z-range, and surface-area difference were calculated using the NanoScope imaging software. Ten different zones for each group of implants were measured for statistical analysis. Hydrophilic tests were conducted in the conventional way. Photographs of a spherical water droplet on the surface were taken, and the contact angles (CAs) were surveyed. The XRD pattern was determined by an X’Pert Pro MPD diffractometer (Philips, Amsterdam, the Netherlands). The speed of scanning was set at 0.75°/min, and the angle range was carried out at 10°–80° for phase-composition analysis.
PRP preparation
PRP was separated from human whole blood, which was obtained from the Yantai Blood Center, using the MCS® blood cell-separation system (Haemonetics Corporation, Braintree, MA, USA). A standard two-step centrifugation protocol was applied, and the PRP was stored at −20°C after precipitation (Figure S1).21 To confirm the quality of usable PRP and the consistency of different groups, TGFβ1 was utilized as a purified calibrator for concentrated PRP according to data from previous studies.15,19 Finally, relative density was established at 750 pg/mL, which has proved optimal for cell proliferation and osteogenic differentiation in previous research.16,22
Animals and surgical procedures
A total of 48 female Sprague Dawley rats (age 3 months, weight 210–230 g) were obtained from the Animal Research Center of Sichuan University and randomly assigned into four groups. All rats were raised under climate-controlled conditions (25°C, 55% humidity, and 12 hours of light alternating with 12 hours of darkness) and fed a standard diet. All animal care and experiments were approved by the Ethics Review Committee of West China School of Stomatology, Sichuan University. Ethical and legal approval was obtained prior to the commencement of this study. All animal care and experiments were guided in line with the standards of the Animal Research Committee of the West China School of Stomatology, Sichuan University, and conducted in accordance with international guidance on animal welfare.
Implantation was carried out 12 weeks after bilateral ovariectomy, when the standard osteoporotic animal had been established. Detailed methods can be found in previous work of ours.3 Briefly, all animals were narcotized by abdominal injections of ketamine and local anesthesia of lidocaine. After the tibia was surgically exposed, a 1 mm hole was made vertically along the axis of the bone. Both 0.9% NaCl solutions and PRP (0.1 mL/leg) were directly injected into the bone marrow cavity of the hind tibia. Then, the implants were placed into the medullary canal of both tibiae, as shown in Figure 1A. Cefazolin (10 mg/kg) injection was administered intramuscularly for 3 days after the operation to control infection.
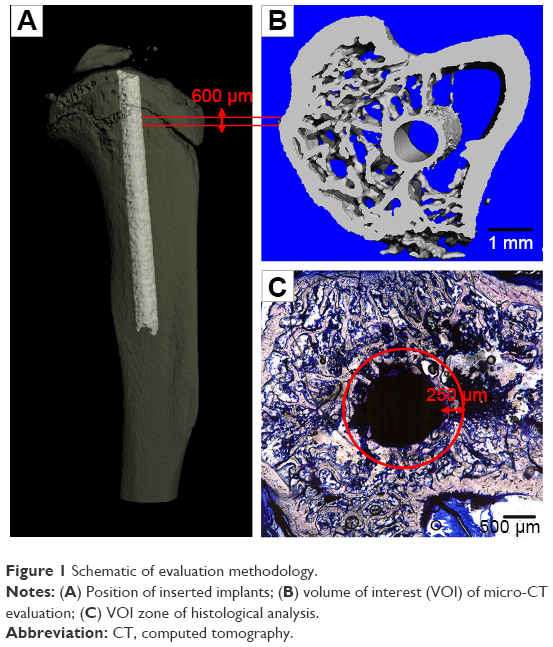 | Figure 1 Schematic of evaluation methodology. |
After these processes, these rats were divided into the following groups: group A, control implant without any other treatment; group B, anodized TiO2 nanoporous implant; group C, control implant with PRP treatment; and group D, anodized TiO2 nanoporous implant with PRP treatment.
Micro-CT evaluation
At 12 weeks after implantation, the specimens (n=8 specimens per group) were scanned by a high-resolution micro-CT scanner system (μCT 80; Scanco Medical AG, Brüttisellen, Switzerland). For the best X-ray transmission effect and the appropriate signal-to-noise ratio, the relevant parameters (voltage, electric current, and integration time) were set to 70 kV, 120 μA and 700 ms. The isotropic layer thickness of reconstruction was set to 10 μm. To distinguish the implant and bone from other tissues, multilevel thresholds were applied. The threshold value for bone was set at 200, while for implants it was set at 700. To suppress the noise points in the volumes as much as possible, the constrained Gaussian filter value was maintained at σ=1. 2 and support =1 in peripheral quantitative evaluation. The bone section around implants from 1.5 mm below the growth plate to a distal 60 slices with a ring radius of 250 μm from the implant surface was defined as the volume of interest (VOI; Figure 1B). The following properties of the cancellous bone in the VOI zone were calculated: the bone volume (BV) per total (specimen) volume (TV), connectivity density (ConnD), mean trabecular number (Tb.N), mean trabecular separation (Tb.Sp), and the percentage of OI.
Histological analysis
At 12 weeks after implantation, rats were killed by overanesthesia, and tibiae with implants were harvested. The specimens (n=7 specimens per group) were examined for undecalcified dissections. Firstly, the tibiae containing implants were fixed in 4% formalin-buffered solution for 3 days. Next, these specimens were rinsed by distilled water and progressively dehydrated in a graded series of ethanol (20%, 40%, 60%, 75%, 90%, and 100%). Subsequently, all samples were impregnated in methyl methacrylate and finally embedded in modified poly(methyl methacrylate) resin (Technovit 7200 VLC; Exact Apparatebau GmbH, Norderstedt, Germany). After resin hardening, each specimen was longitudinally sectioned in 80 μm-thick slices using a rotary cutting saw (SP1600; Leica Microsystems, Wetzlar, Germany). Then, all histologic slices were ground to approximately 50 μm with a Leica SP2600 and burnished by a polishing machine (MetaServ 2000; Buehler Ltd, Lake Bluff, IL, USA). Tissue slices were stained in 1% Van Gieson staining solution. The histological evaluation was performed under a Leica DM-RBE microscope on sections approximately 2 mm below the epiphyseal plate. The following landmarks were surveyed: bone:area ratio (BA), measured as the percentage of mature bone to the whole tissue region, which was defined within a ring area extending 250 μm from the implant surface (Figure 1C); and bone:implant contact (BC), calculated as the percentage of the linear fraction of mineralized bone in direct contact with the implant interface. A semiautomated digitizing image-analyzer system, consisting of a computer-coupled Nikon (Tokyo, Japan) DXM1200 digital camera and NIS-Elements F2.20 image software was used for image analysis.
Biomechanical testing
After micro-CT scanning was finished, biomechanical testing was carried out on these specimens (n=8 specimens per group) to assess implant/bone-bonding strength. Peak torque values (N/mm2) and forces at start of rotation (N) were recorded with the help of a biomechanical measuring instrument (BSC30; Ningbo Yinbo Scientific Equipment, Ningbo, People’s Republic of China). Epiphyseal bone was dissected to expose the implant, and the tissues formed on the mesial surface were removed. A self-curing plastic mold was used to fix the sample. The compression speed was set at 1 mm/min.
SEM observation of divorced implants
After the biomechanical test, the divorced implants from the tibia were collected for SEM observation. All samples were fixed in 2.5% glutaraldehyde overnight. After that, the implants were washed with phosphate-buffered saline and dehydrated with alcohol of varying concentration gradients (35%, 50%, 70%, 90%, and 100%). The prepared samples were then dried employing an EMS 850 critical point dryer (Electron Microscopy Sciences, Hatfield, PA, USA) and coated with a thin gold film for SEM detection.
Quantitative real-time PCR analysis
The osseous tissues surrounding the implant (1 mm mesial and distal to the implantation site) were collected for qRT-PCR testing to explore the potential molecular mechanisms involved in OI after 1, 7, and 14 days (n=9 specimens per group). The expression of adipogenic and osteogenic factors, including PPARγ2, leptin, Runx2, Col1, OPG, and RANKL, were detected. Tissues were carefully harvested, and total RNA was isolated with the help of the RNeasy minikit (Qiagen NV, Venlo, the Netherlands). At 260 nm absorbance, RNA concentration was detected using a NanoDrop spectrophotometer (ND-1000; Thermo Fisher Scientific, Waltham, MA, USA). Reverse transcription was performed, and complementary DNA (cDNA) was synthesized using up to 1 μg of isolated RNA, by a first-strand cDNA-synthesis kit (Takara, Tokyo, Japan) according to the manufacturer’s protocol. The qRT-PCR assay was performed using a QuantiFast SYBR green PCR kit (Qiagen). GAPDH was employed as a housekeeping gene, and the primer sequences used in this study are listed in Table S1.
Statistical analysis
Data expressed as mean ± standard deviation were analyzed using the SPSS 16.0 software (SPSS, Chicago, IL, USA). One-way analysis of variance and the Student–Newman–Keuls test were used to determine the level of significance. P<0.05 was considered statistically significant, and P<0.01 considered highly significant.
Results and discussion
Surface characteristics
Representative SEM images of the control implant and the anodized TiO2 nanoporous implant are shown in Figure 2. SEM examinations clearly depicted the surface topography of anodized TiO2 nanoporous implants (Figure 2F). The surface of anodized TiO2 nanoporous implants was covered with a large amount of nanosize holes (20–60 nm in radius, 10–40 nm in height), which were distributed uniformly and extensively (Figure S2). Qualitative results by AFM are shown in Figure 3, and quantitative roughness analysis is presented in Table 1. Photographs of a spherical water droplet on surfaces were taken with a CA of 84°±5.7° on control implants and a flat water film with a CA of 28°±3.6° on TiO2 nanoporous modified implants (Figure 2G and H). The XRD pattern of TiO2 nanoporous samples is shown in Figure 4, with the presence of both Ti and TiO2 phases from the substrate, indicating that the electrochemical anodization treatment resulted in the formation of TiO2 nanopores on the original titanium surface.
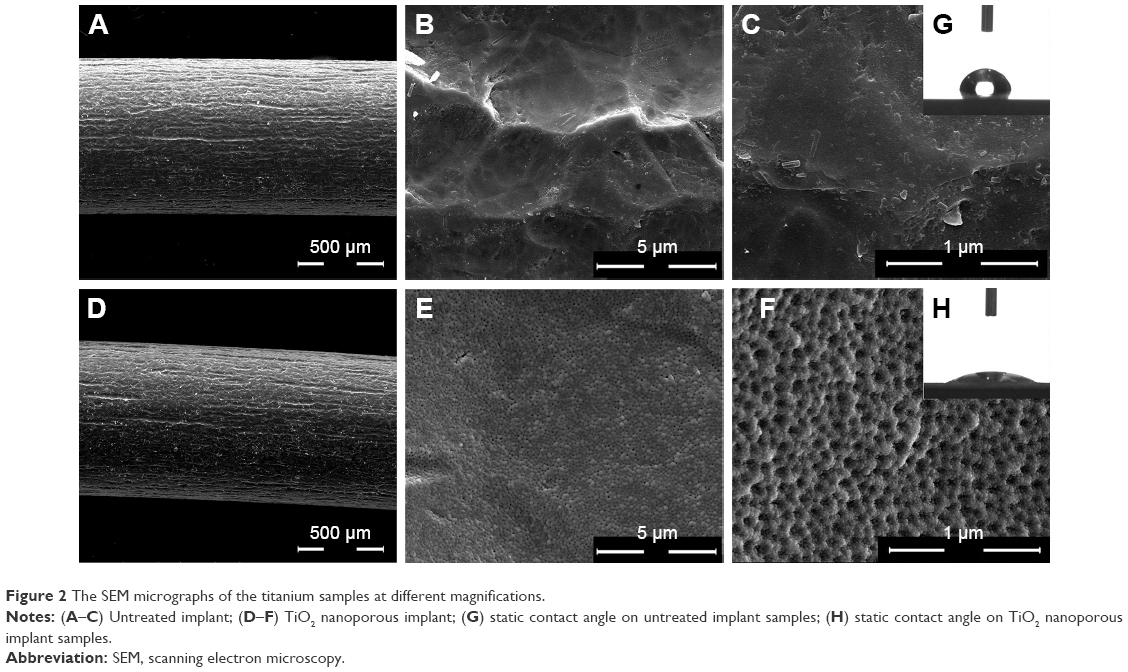 | Figure 2 The SEM micrographs of the titanium samples at different magnifications. |
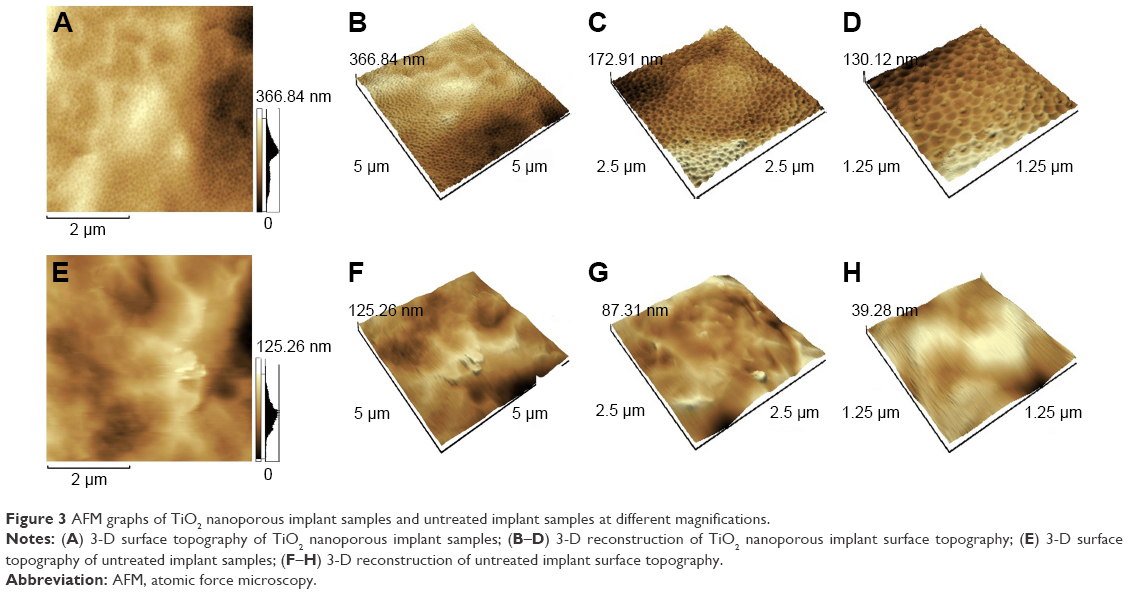 | Figure 3 AFM graphs of TiO2 nanoporous implant samples and untreated implant samples at different magnifications. |
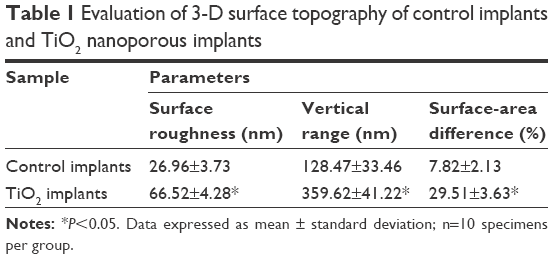 | Table 1 Evaluation of 3-D surface topography of control implants and TiO2 nanoporous implants |
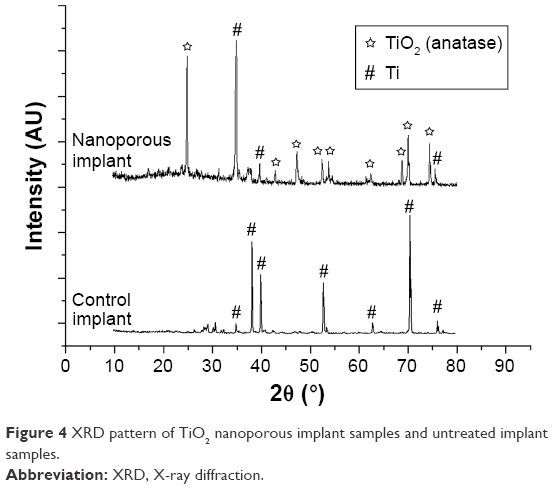 | Figure 4 XRD pattern of TiO2 nanoporous implant samples and untreated implant samples. |
Surface morphology, phase composition, and interface energy are three key factors influencing the osteoconduction and biological activity of implant coatings. For surface topography, these are significantly affected by magnitude. Pores that are too small (<30 nm) are supposed to cause potential cell cytotoxicity, and may be detrimental for cell adhesion and proliferation or even result in cell apoptosis.23 In this study, nanosize was used, because appropriate diameter has been reported to possess the ability to accelerate bone growth (50–100 nm diameter, 10–60 nm height).24,25 After the anodizing modification, a much rougher surface was obtained on the TiO2 nanoporous implants, with root mean square increased by 2.73-fold (P<0.01), the Z-range by 2.08-fold (P<0.01) and surface-area difference by 3.11-fold (P<0.01). Meanwhile, hydrophilia was greatly improved due to the anatase TiO2 nanoporous surface, with a CA decrease of more than 50°. Accordingly, these changes could prove advantageous for OI.26
Clinical observation
No death or infection was found postoperatively. After dissection and harvest of the whole tibia, the implants from four groups all remained inside the proximal marrow cavity of the tibiae. Cortical bone healing was observed after 3 months of implantation, and surgical holes were restored completely in all four groups.
Micro-CT evaluation
To evaluate the OI of implants and new bone formation around the implant, micro-CT analysis was performed. The images and results of quantitative analysis are shown in Figure 5. The implants are marked in white and the bone in gray in the image. A significant difference in the quantity of bone in the VOI was surveyed in transverse and sagittal images. BV around implant surfaces in the bone marrow cavity of group D was obviously higher than that in the other groups. With regard to the quantitative results, the micromorphology of tibiae in group A was characterized by the lowest values in BV/TV (22.91%), %OI (28.23%), ConnD (21.42%), and Tb.N (3.36), but the highest value in Tb.Sp (432.68 μm). Compared to group A, values in BV/TV, ConnD, and Tb.N were significantly higher in group C (P<0.05), while %OI was improved simultaneously for group B (P<0.05). As to group D, there was greater restoration in bone apposition around implants, with a robust increase in BV/TV (49.62%), %OI (70.13%), ConnD (48.32%) and Tb.N (10.63), but the lowest value in Tb.Sp (165.28 μm).
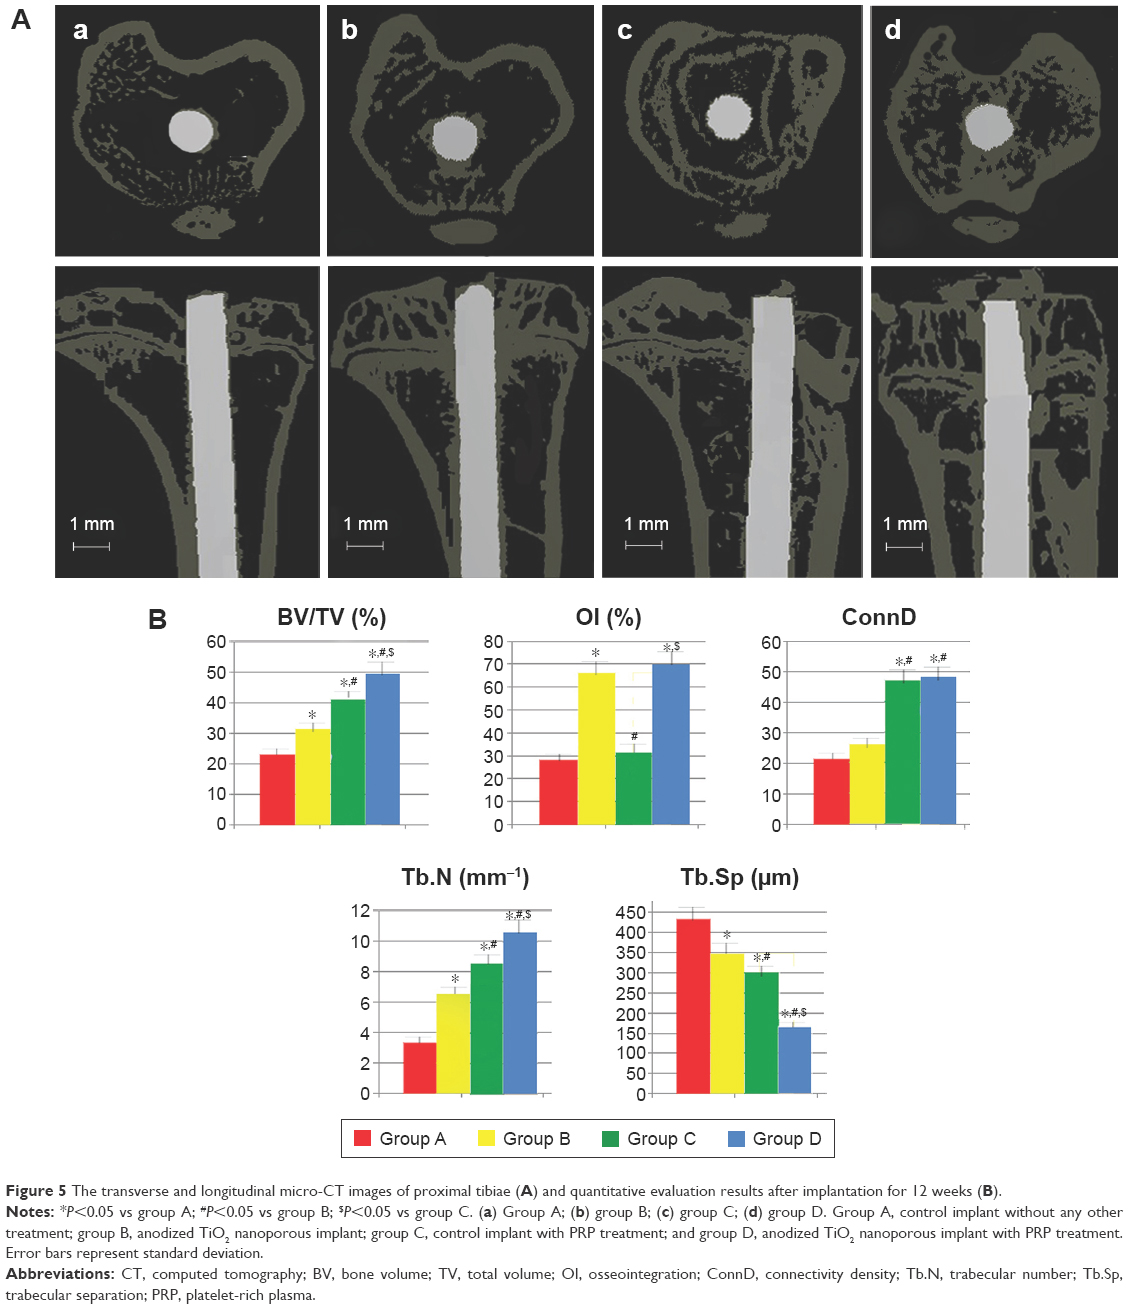 | Figure 5 The transverse and longitudinal micro-CT images of proximal tibiae (A) and quantitative evaluation results after implantation for 12 weeks (B). |
Histological analysis
Stained histological sections and results from histomorphometry presented as BA and BC are shown in Figure 6. After a 12-week period of bone healing around implants, a BA of 9.33% and a BC of 12.11% were observed in group A, while BA values in group B, group C, and group D were 12.52%, 35.66%, and 52.91%, and BC values 65.68%, 18.41%, and 79.67%, respectively. Group D showed the highest potency in enhancing BA (P<0.05), while group C was next (P<0.05). In addition, there was no significant difference between group A and group B (P>0.05), and these groups were the two lowest. However, in terms of BC values, BC for groups B and D was similar (P>0.05), but significantly higher than groups A and C (P<0.05).
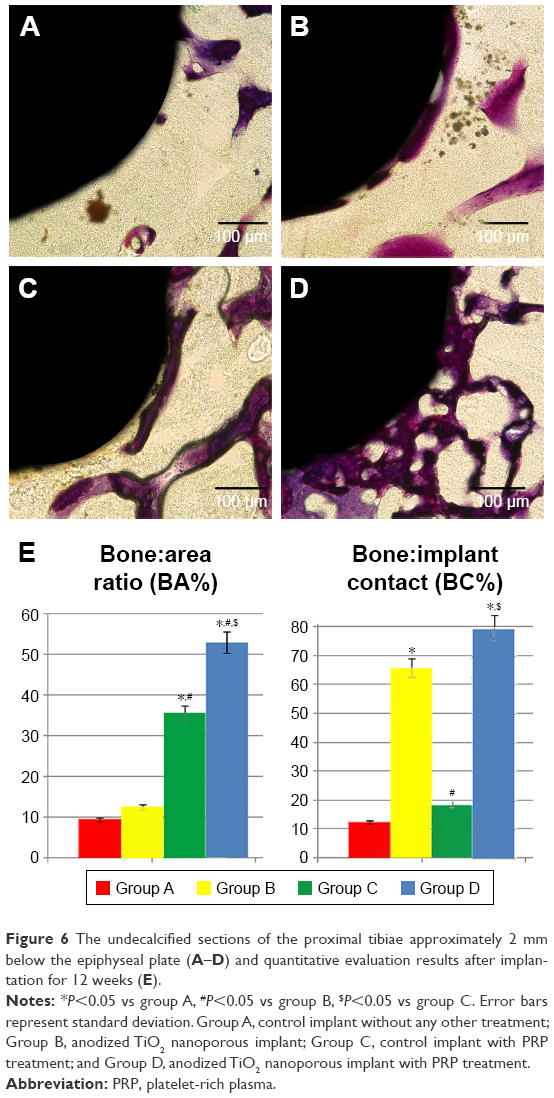 | Figure 6 The undecalcified sections of the proximal tibiae approximately 2 mm below the epiphyseal plate (A–D) and quantitative evaluation results after implantation for 12 weeks (E). |
No adverse effects (such as osteonecrosis or inflammatory responses) were observed in the clinical inspection and histological figures after 12 weeks’ implantation, indicating good biocompatibility of all implants in Ovx rats. Histological detection and micro-CT evaluation showed all implants remained in the tibias at the initial operating position, and no sign of loosening or dislocation had taken place, demonstrating that the implants were able to connect bones well under all these circumstances. Quantitative analyses revealed that, both for %OI and BC level, groups B and D were higher than groups A and C, indicating the beneficial effects of TiO2 nanoporous modification, which was consistent with results from previous studies.27,28 In the meantime, BV around implants of groups C and D was similar but significantly higher compared to that for groups A and B, reflecting the ability of PRP to increase the amount of bone mass surrounding implants in Ovx rats, which might be explained by the fact that PRP treatment mainly exerted its action via promoting bone regeneration and suppressing adipogenesis within the marrow.19
Biomechanical analysis
Results of biomechanical analysis are exhibited in Table 2, expressed as ultimate shear strength and maximal push-out force. At 12 weeks after implantation, the mechanical fixation of the implants in group D was significantly higher than that in other three groups (P<0.05), while group A had the lowest (P<0.01). In addition, the load to failure of group C was higher than that of group B, but less than that of group D (P<0.05) in both the peak-torque test and the push-out experiment.
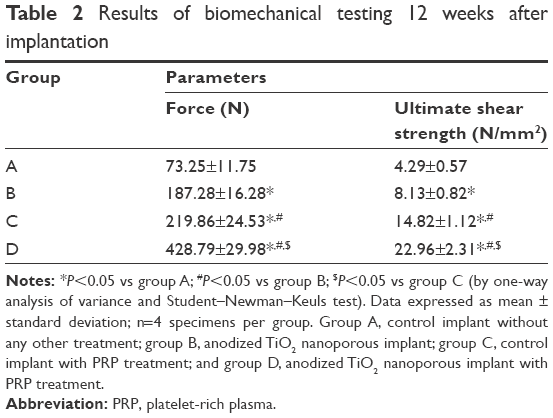 | Table 2 Results of biomechanical testing 12 weeks after implantation |
SEM observation of the divorced implants
Figure 7 shows the SEM morphology of the divorced implants from the different groups after 12-week implantation in the Ovx tibia. The implant surfaces of group A were smooth and covered by very little bone mass. However, some new bones formed on the surface of the implants from group B. More bone formation was found on the implant surfaces from group C when compared with implants from group B, but half of the implant surfaces still lacked bone covering. Large blocks of bone mass with dense and thick trabeculae covered the surface of implants from group D, suggesting commendable interface bonding between the implants and the newly formed bones.
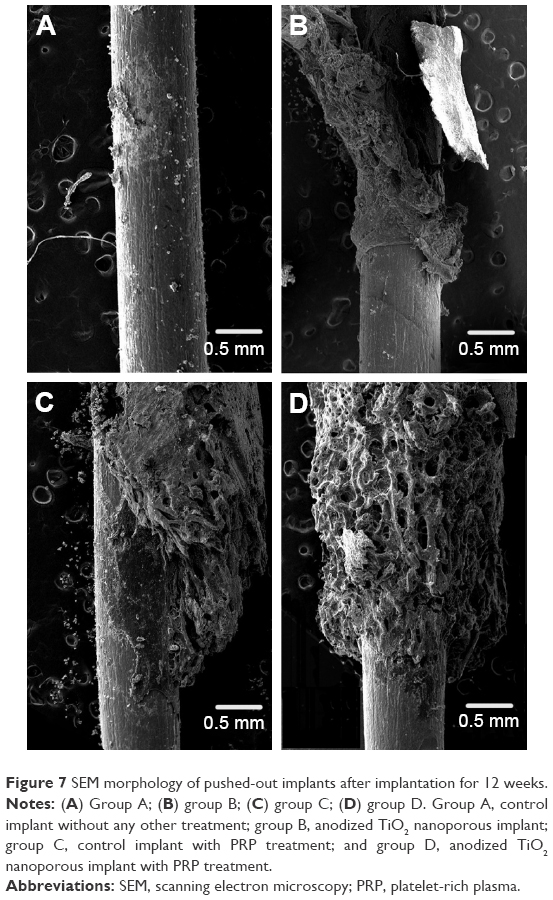 | Figure 7 SEM morphology of pushed-out implants after implantation for 12 weeks. |
Biomechanical tests were used to characterize the biomechanical stability of implants in osteoporotic bone. Previous research has demonstrated that growth factors in PRP contribute to enhancement of healing of osteoporotic fractures and nanodesigned surfaces accelerate OI of titanium implants.4,20 In this current study, the push-out force of group D was notably higher than the other three groups, probably because of the following reasons. First, the use of PRP increases the bone quantity in the VOI, indicating the application of PRP can promote osteogenesis around the implant.20,29 On the other hand, the bioactivity properties of the group D samples were improved by anatase TiO2 nanoporous modification, generating high interface bonding between the implants and the adherent bone,30,31 as confirmed by SEM examination, micro-CT, and histology. Furthermore, it was notable that there were varieties of residual bones attaching on the four different groups in SEM images. Compared with group D, less new bone formation was observed around group B implants and worse integration around group C sample. When terminal force was applied in group B, there was not enough bone to withstand the strength, while the bone tissues were stripped easily at the interface in group C. However, in group D, when physical strength was exerted, a lot of trabecular microfractures took place to withstand the push-out force, because of the high interface bonding, which increased to almost double that of group B and group C (P<0.05).
Gene expression of osteogenic and adipogenic markers
qRT-PCR was performed at days 1, 7, 14 after implantation to evaluate specific gene expression in the newly formed tissue, and the results are summarized in Figure 8. At all time points, PPARγ2- and leptin-expression levels were downregulated, while Runx2- and Col1-expression levels were significantly increased in PRP-treated samples when compared to respective control samples (P<0.01). In addition, it was observed that TiO2 nanoporous modification resulted in a significant increase in the expression of RUNX2 and COL1 mRNA (P<0.05) but no obvious effect on the expression of PPARγ2 or leptin genes (P>0.05). At the same time, increased expression of OPG and decreased levels of RANKL were observed in PRP-treated sample groups (P<0.05), while no change in OPG or RANKL expression was found after TiO2 nanoporous modification (P>0.05). Compared with the other groups, group D had the highest expression levels of Runx2 and Col1 (P<0.05), indicating the synergistic effect of TiO2 nanoporous modification, and indicating that PRP treatment was a very efficient way to improve osteogenesis in osteoporotic bone.
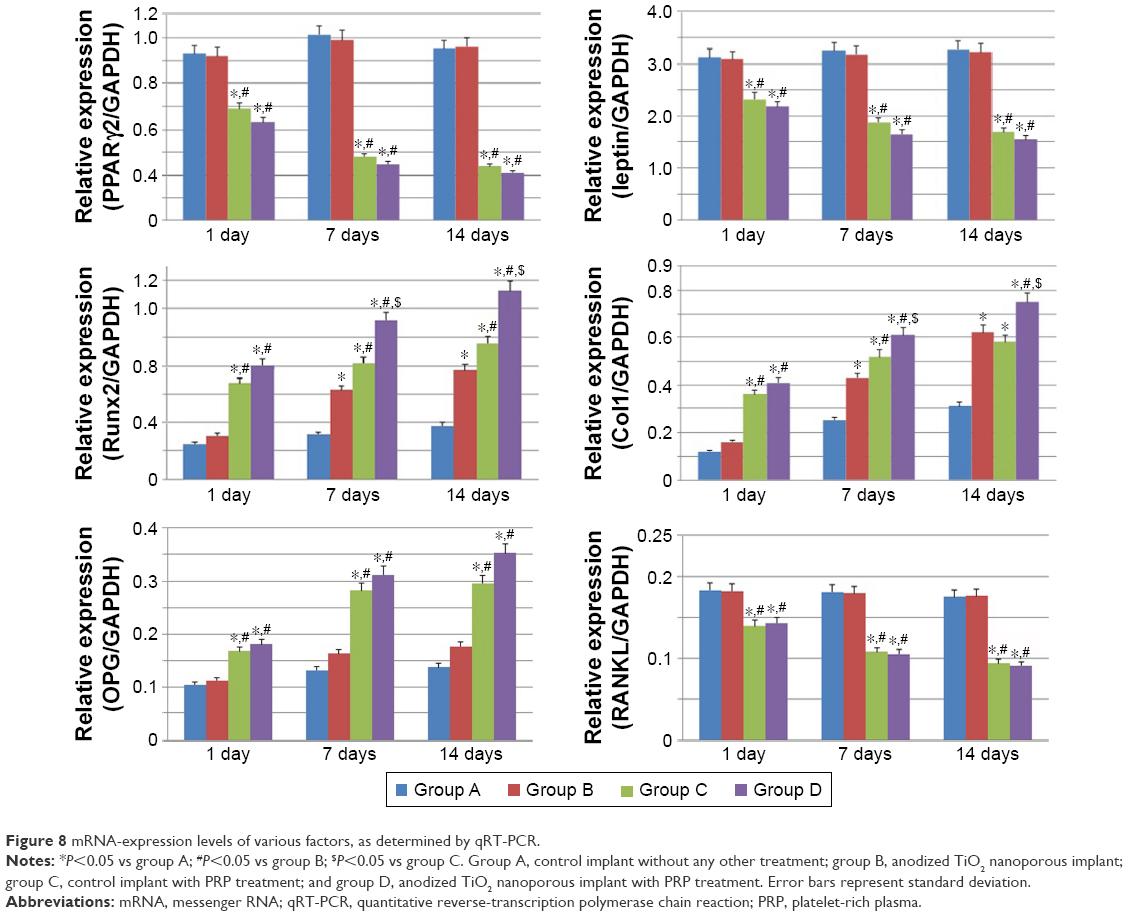 | Figure 8 mRNA-expression levels of various factors, as determined by qRT-PCR. |
According to the qRT-PCR results, the addition of PRP not only inhibited adipogenesis but also promoted osteogenesis around the implants, while TiO2 nanoporous modification promoted osteogenesis only. Meanwhile, PRP treatment resulted in increased expression of OPG and decreased levels of RANKL, as an indication of osteoclastogenesis suppression, but TiO2 nanoporous modification showed no effect on the expression of OPG or RANKL, indicating this surface modification could not work on osteoclasts around implants. These results are in accordance with previous evidence.22,32 The effect of downregulating adipogenesis regulators of PRP may be caused by enhancing BMP2 and BMPR1B and suppressing BMPR1A pathways in preadipocytes, while suppression of osteoclastogenesis may occur through the RANKL–OPG pathway.33,34 However, there was another interesting finding for osteogenic genes in this study. In PRP-treated samples, RUNX2- and COL1-expression levels were obviously improved at day 1. However, upregulation of these osteogenic genes enhanced by surface modification reached its highest at day 7, which was much later than PRP treatment. These findings collectively indicated that osteogenesis promoted by PRP in the bone marrow was prior to the OI accelerated by TiO2 nanoporous modification in Ovx rats. Combined with the results of biomechanical testing, in which group C showed better stability than group B, we demonstrated PRP treatment was more prerequisite and fundamental in the program of bone-implant healing.
To sum up, the excellent performance of group D implants can be attributed to the significant enhancement of osteogenesis at the local implantation site (caused by PRP treatment) and remarkable acceleration of OI on the surface (caused by TiO2 nanoporous modification), as shown in Figure 9.35,36 The presence of nanopores can reduce relative movement at the bone–implant interface, provide a better route for OI, and achieve mechanical interlocking, while the application of PRP can suppress adipogenesis and facilitate osteogenesis in osteoporotic bones, both of which are particularly beneficial for the biomechanical stability of implants at osteoporotic sites.37
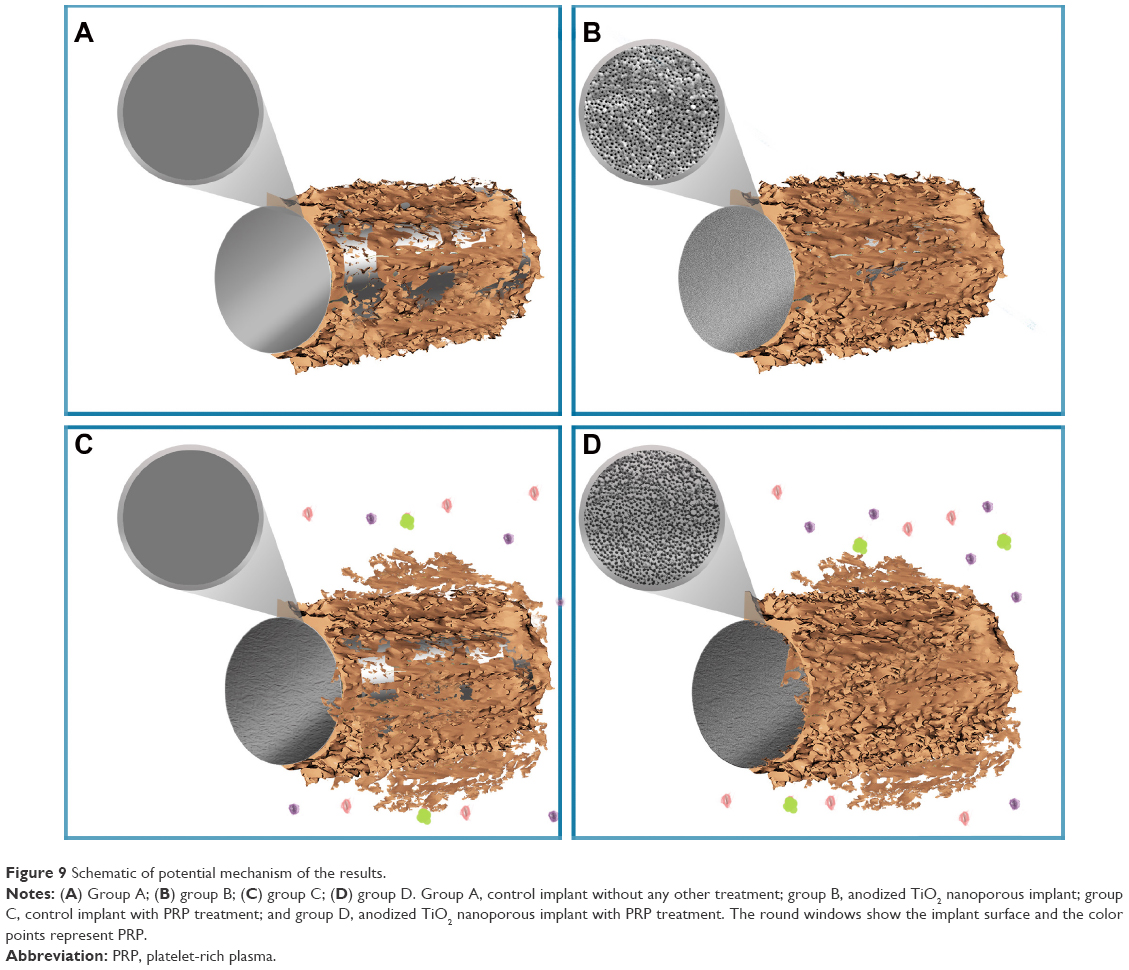 | Figure 9 Schematic of potential mechanism of the results. |
Conclusion
In the present study, the synergistic effect of TiO2 nanoporous modification and PRP treatment on titanium-implant OI in Ovx rats was determined. The in vivo animal study demonstrated this nanomodified surface can lead to better bone–implant contact, while PRP treatment can increase osteogenesis at the local implantation site. Compared with surface modification, PRP treatment promoting osteogenesis (both Runx2 and Col1 expression) is much earlier. PRP treatment combined with a TiO2-nanomodified Ti surface can improve the biomechanical stability of implants in osteoporotic bone.
Acknowledgments
This study was supported by grants from the National Basic Research Program of China (2012CB933902, Program 973) and Science Funds of Yantai (2014WS042).
Disclosure
The authors report no conflicts of interest in this work.
References
Papaspyridakos P, Mokti M, Chen CJ, Benic GI, Gallucci GO, Chronopoulos V. Implant and prosthodontic survival rates with implant fixed complete dental prostheses in the edentulous mandible after at least 5 years: a systematic review. Clin Implant Dent Relat Res. 2014;16(5):705–717. | ||
Gokcen-Rohlig B, Yaltirik M, Ozer S, Tuncer ED, Evlioglu G. Survival and success of ITI implants and prostheses: retrospective study of cases with 5-year follow-up. Eur J Dent. 2009;3(1):42–49. | ||
Li Y, Zou S, Wang D, Feng G, Bao C, Hu J. The effect of hydrofluoric acid treatment on titanium implant osseointegration in ovariectomized rats. Biomaterials. 2010;31(12):3266–3273. | ||
Facca S, Lahiri D, Fioretti F, et al. In vivo osseointegration of nano-designed composite coatings on titanium implants. ACS Nano. 2011;5(6):4790–4799. | ||
Tateishi H, Okamoto Y, Kinoshita K, Hibi H, Ueda M. Effects of implant surface on bone healing around titanium screw implants in ovariectomized rats. Int J Oral Maxillofac Implants. 2013;28(5):e252–e259. | ||
Dikicier E, Karaçayli U, Dikicier S, Günaydin Y. Effect of systemic administered zoledronic acid on osseointegration of a titanium implant in ovariectomized rats. J Craniomaxillofac Surg. 2014;42(7):1106–1111. | ||
Ramalho-Ferreira G, Faverani LP, Prado FB, Garcia IR, Okamoto R. Raloxifene enhances peri-implant bone healing in osteoporotic rats. Int J Oral Maxillofac Surg. 2015;17(6):798–805. | ||
Alghamdi HS, van Oirschot BA, Bosco R, et al. Biological response to titanium implants coated with nanocrystals calcium phosphate or type 1 collagen in a dog model. Clin Oral Implants Res. 2013;24(5):475–483. | ||
Wehling J, Dringen R, Zare RN, Maas M, Rezwan K. Bactericidal activity of partially oxidized nanodiamonds. ACS Nano. 2014;8(6):6475–6483. | ||
Wang D, Kou R, Choi D, et al. Ternary self-assembly of ordered metal oxide-graphene nanocomposites for electrochemical energy storage. ACS Nano. 2010;4(3):1587–1595. | ||
Brammer KS, Frandsen CJ, Jin S. TiO2 nanotubes for bone regeneration. Trends Biotechnol. 2012;30(6):315–322. | ||
Tsaryk R, Peters K, Unger RE, et al. Improving cytocompatibility of Co28Cr6Mo by TiO2 coating: gene expression study in human endothelial cells. J R Soc Interface. 2013;10(86):20130428. | ||
Park J, Bauer S, Schlegel KA, Neukam FW, von der Mark K, Schmuki P. TiO2 nanotube surfaces: 15 nm – an optimal length scale of surface topography for cell adhesion and differentiation. Small. 2009;5(6):666–671. | ||
Zhao L, Wang H, Huo K, et al. The osteogenic activity of strontium loaded titania nanotube arrays on titanium substrates. Biomaterials. 2013;34(1):19–29. | ||
Intini G. The use of platelet-rich plasma in bone reconstruction therapy. Biomaterials. 2009;30(28):4956–4966. | ||
Marx RE. Platelet rich plasma: growth factor enhancement for bone graft. Oral Surg. 1998;85(6):638–646. | ||
Stefani CM, Machado MA, Sallum EA, Sallum AW, Toledo S, Nociti FH. Platelet-derived growth factor/insulin-like growth factor-1 combination and bone regeneration around implants placed into extraction sockets: a histometric study in dogs. Implant Dentistry. 2000;9(2):126–131. | ||
Shayesteh YS, Eshghyar N, Moslemi N, et al. The effect of platelet-rich plasma on healing of palatal donor site following connective tissue harvesting: a pilot study in dogs. Clin Implant Dent Relat Res. 2012;14(3):428–433. | ||
Liu HY, Wu AT, Tsai CY, et al. The balance between adipogenesis and osteogenesis in bone regeneration by platelet-rich plasma for age-related osteoporosis. Biomaterials. 2011;32(28):6773–6780. | ||
Chen L, Yang X, Huang G, et al. Platelet-rich plasma promotes healing of osteoporotic fractures. Orthopedics. 2013;36(6):e687–e694. | ||
Mazzucco L, Balbo V, Cattana E, Borzini P. Platelet-rich plasma and platelet gel preparation using Plateltex. Vox Sang. 2008;94(3):202–208. | ||
Kanno T, Takahashi T, Tsujisawa T, Ariyoshi W, Nishihara T. Platelet-rich plasma enhances human osteoblast-like cell proliferation and differentiation. J Oral Maxillofac Surg. 2005;63(3):362–369. | ||
Rocco L, Santonastaso M, Mottola F, et al. Genotoxicity assessment of TiO2 nanoparticles in the teleost Danio rerio. Ecotoxicol Environ Saf. 2015;113:223–230. | ||
Frandsen CJ, Brammer KS, Jin S. Variations to the nanotube surface for bone regeneration. Int J Biomater. 2013;2013:513680. | ||
Ivanova EP, Hasan J, Webb HK, et al. Natural bactericidal surfaces: mechanical rupture of Pseudomonas aeruginosa cells by cicada wings. Small. 2012;8(16):2489–2494. | ||
Moon SH, Lee SJ, Park IS, et al. Bioactivity of Ti-6Al-4V alloy implants treated with ibandronate after the formation of the nanotube TiO2 layer. J Biomed Mater Res B Appl Biomater. 2012;100(8):2053–2059. | ||
Rivera-Chacon DM, Alvarado-Velez M, Acevedo-Morantes CY, et al. Fibronectin and vitronectin promote human fetal osteoblast cell attachment and proliferation on nanoporous titanium surfaces. J Biomed Nanotechnol. 2013;9(6):1092–1097. | ||
Prodanov L, Lamers E, Domanski M, Luttge R, Jansen JA, Walboomers XF. The effect of nanometric surface texture on bone contact to titanium implants in rabbit tibia. Biomaterials. 2013;34(12):2920–2927. | ||
Malhotra A, Pelletier MH, Yu Y, Walsh WR. Can platelet-rich plasma (PRP) improve bone healing? A comparison between the theory and experimental outcomes. Arch Orthop Trauma Surg. 2013;133(2):153–165. | ||
He Z, Sheng Y, Masako N, Dong JL, Cooper LF, Ko CC. Proliferation of preosteoblasts on TiO2 nanotubes is FAK/RhoA related. RSC Adv. 2015;5(48):38117–38124. | ||
Wang X, Gittens RA, Song R, et al. Effects of structural properties of electrospun TiO2 nanofiber meshes on their osteogenic potential. Acta Biomater. 2012;8(2):878–885. | ||
Grandfield K, Gustafsson S, Palmquist A. Where bone meets implant: the characterization of nano-osseointegration. Nanoscale. 2013;5(10):4302–4308. | ||
Muruganandan S, Roman AA, Sinal CJ. Adipocyte differentiation of bone marrow-derived mesenchymal stem cells: cross talk with the osteoblastogenic program. Cell Mol Life Sci. 2009;66(2):236–253. | ||
Blake GM, Griffith JF, Yeung DK, Leung PC, Fogelman I. Effect of increasing vertebral marrow fat content on BMD measurement, T-score status and fracture risk prediction by DXA. Bone. 2009;44(3):495–501. | ||
Tang C, Li X, Wang F, Cui X, Zhu Y. [Effect of local application of insulin like growth factor-1 gelatin sponge complex on osseointegration around implant in osteoporosis rats]. Zhonghua Kou Qiang Yi Xue Za Zhi. 2015;50(7):418–422. Chinese. | ||
Liang Y, Li H, Xu J, et al. Strontium coating by electrochemical deposition improves implant osseointegration in osteopenic models. Exp Ther Med. 2015;9(1):172–176. | ||
Sul YT. Electrochemical growth behavior, surface properties, and enhanced in vivo bone response of TiO2 nanotubes on microstructured surfaces of blasted, screw-shaped titanium implants. Int J Nanomedicine. 2010;5:87–100. |
Supplementary materials
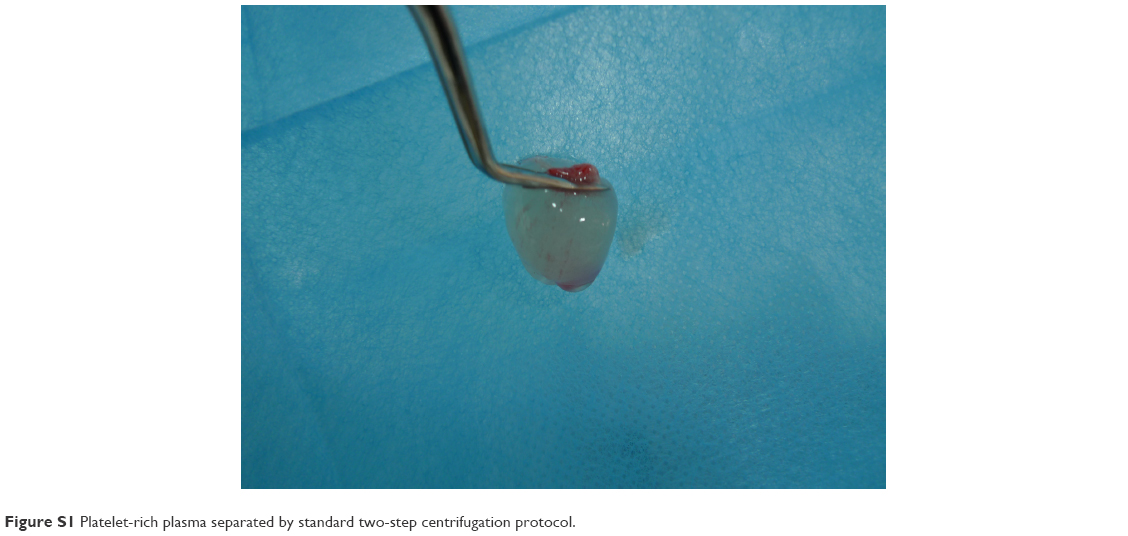 | Figure S1 Platelet-rich plasma separated by standard two-step centrifugation protocol. |
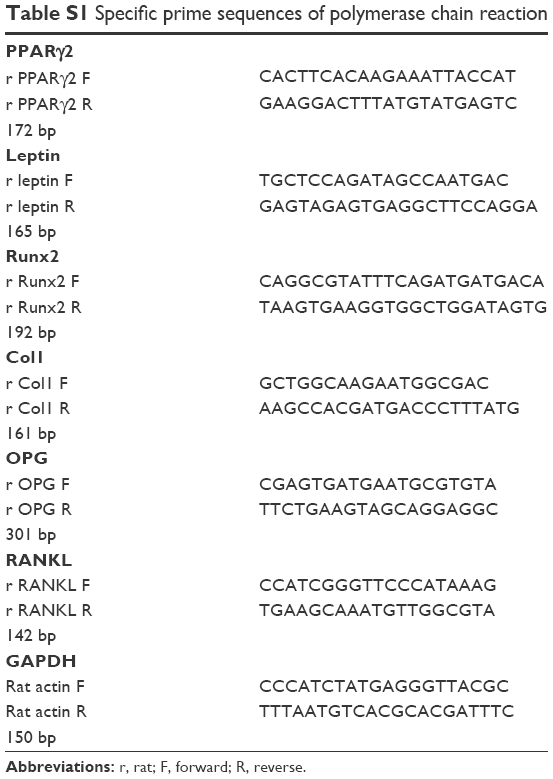 | Table S1 Specific prime sequences of polymerase chain reaction |
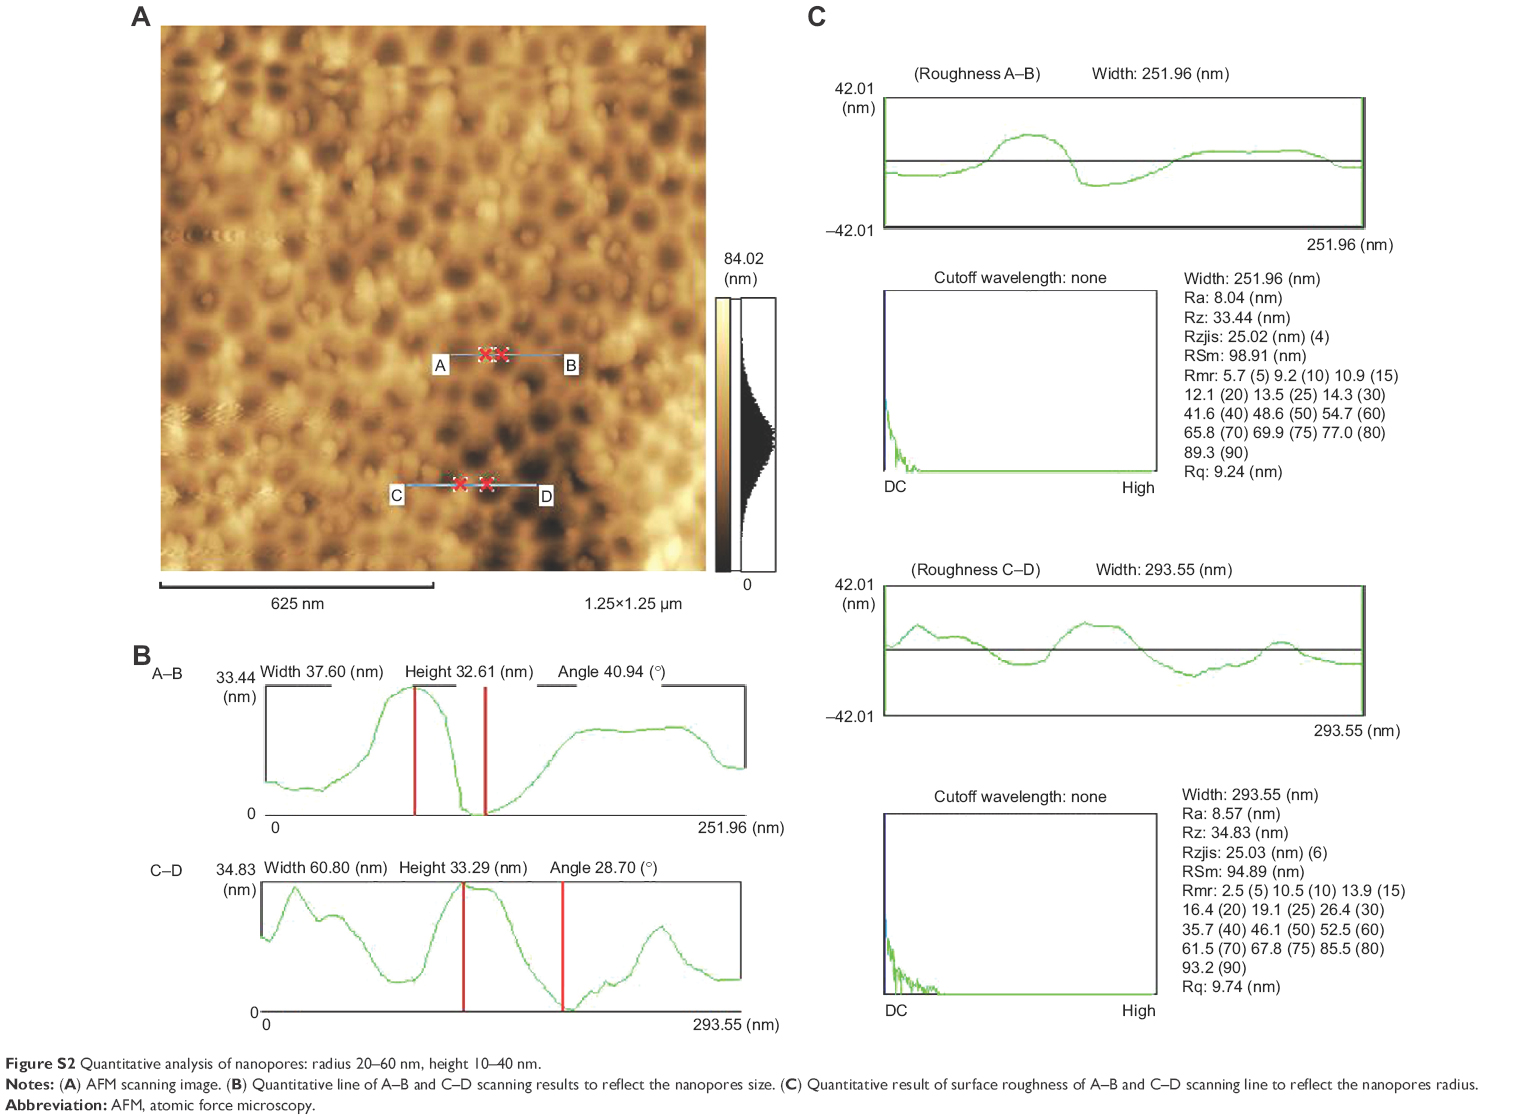 | Figure S2 Quantitative analysis of nanopores: radius 20–60 nm, height 10–40 nm. |
 © 2016 The Author(s). This work is published and licensed by Dove Medical Press Limited. The full terms of this license are available at https://www.dovepress.com/terms.php and incorporate the Creative Commons Attribution - Non Commercial (unported, v3.0) License.
By accessing the work you hereby accept the Terms. Non-commercial uses of the work are permitted without any further permission from Dove Medical Press Limited, provided the work is properly attributed. For permission for commercial use of this work, please see paragraphs 4.2 and 5 of our Terms.
© 2016 The Author(s). This work is published and licensed by Dove Medical Press Limited. The full terms of this license are available at https://www.dovepress.com/terms.php and incorporate the Creative Commons Attribution - Non Commercial (unported, v3.0) License.
By accessing the work you hereby accept the Terms. Non-commercial uses of the work are permitted without any further permission from Dove Medical Press Limited, provided the work is properly attributed. For permission for commercial use of this work, please see paragraphs 4.2 and 5 of our Terms.