")
Back to Journals » Cancer Management and Research » Volume 11
The synergistic antileukemic effects of eltrombopag and decitabine in myeloid leukemia cells
Authors Shi M , Xu F , Yang X , Bai Y, Niu J, Drokow EK , Chen M, Chen Y, Sun K
Received 8 May 2019
Accepted for publication 5 August 2019
Published 6 September 2019 Volume 2019:11 Pages 8229—8238
DOI https://doi.org/10.2147/CMAR.S213931
Checked for plagiarism Yes
Review by Single anonymous peer review
Peer reviewer comments 2
Editor who approved publication: Dr Antonella D'Anneo
Mingyue Shi,1–3 Fangfang Xu,4 Xiawan Yang,2 Yanliang Bai,2 Junwei Niu,2 Emmanuel Kwateng Drokow,2 Mingyi Chen,3 Yuqing Chen,2 Kai Sun2
1Division of Graduate, Department of Hematology, The Second Clinical Medical School and the Second Affiliated Hospital of Zhengzhou University, Zhengzhou, People’s Republic of China; 2Department of Hematology, Zhengzhou University People’s Hospital and Henan Provincial People’s Hospital, Zhengzhou, People’s Republic of China; 3Department of Pathology and Laboratory Medicine, UT Southwestern Medical Center, Dallas, TX 75390, USA; 4Department of Research and Discipline Development, Zhengzhou University People’s Hospital and Henan Provincial People’s Hospital, Zhengzhou, People’s Republic of China
Correspondence: Kai Sun; Yuqing Chen
Department of Hematology, Zhengzhou University People’s Hospital and Henan Provincial People’s Hospital, #7 Weiwu Road, Zhengzhou 450003, Henan, People’s Republic of China
Tel +86 182 3711 0038
Email [email protected]
[email protected]
Background: Hypomethylating agents (HMAs), such as decitabine (DAC), are currently used as first-line therapy for patients with high-risk myelodysplastic syndromes (MDS) and acute myelogenous leukemia (AML) not eligible for standard chemotherapies. Exacerbation of thrombocytopenia is one of the prevalent complications after HMA treatment. Eltrombopag (EP), an oral thrombopoietin receptor agonist, can efficiently stimulate megakaryopoiesis and elevate platelet counts in MDS/AML patients. However, the significance of combining EP with HMAs in patients with high-risk MDS/AML has not been determined.
Purpose: To explore the impacts and mechanisms of EP and/or DAC on leukemia cell growth and to explore whether EP exhibits antileukemic effects in the context of DAC treatment in human myeloid leukemia cell lines.
Methods: In our study, we assessed the anti-leukemic effect of EP in the context of DAC treatment by measuring cell proliferation, apoptosis, cell-cycle distribution, and intracellular reactive oxygen species (ROS) levels.
Results: Our results showed that the combination of EP and DAC had a more obvious antiproliferative effect than that of DAC as a single agent. EP mainly induced S or G0/G1 phase cell cycle arrest, and DAC arrested the cell cycle in the S or G2/M phase. The combination of EP and DAC had a synergistic effect on cell cycle arrest. Furthermore, single-agent treatment with EP or DAC induced a change in intracellular ROS levels, and the combination of EP and DAC had a synergistic effect on ROS levels, exacerbating leukemia cell death.
Conclusion: Our study provides in vitro evidence of the synergistic antileukemic effect and potential mechanisms of the combination of DAC and EP on myeloid leukemia cells.
Keywords: eltrombopag, decitabine, myeloid leukemia, reactive oxygen species, ROS
Introduction
Myelodysplastic syndromes (MDS) and acute myelogenous leukemia (AML) are heterogeneous groups of clonal hematopoietic diseases, characterized by inefficient hematopoiesis and leukemic blast proliferation frequently affecting older adults.1 Hypomethylating agents (HMAs), such as 5-aza-2ʹ-deoxycytidine (DAC) and azacytidine are presently approved for the therapy of advanced-stage MDS, chronic myelomonocytic leukemia (CMML), and AML that are ineligible for standard chemotherapy or allogenic stem-cell transplantation.2–4 The response rates of HMAs ranged from 10% to 60% in patients with MDS and AML.4–8 Although the efficacy of HMAs has been demonstrated, their clinical application is largely restrained by bone marrow cytotoxicity.9
Myelosuppression, including severe thrombocytopenia, is prevalent and causes the majority of mortality and morbidity in AML and MDS patients.10 HMA-based treatments in those patients frequently induce thrombocytopenia during induction chemotherapy.9 Clinical studies of azacytidine have revealed that grade 3 or 4 hematological toxicity of thrombocytopenia occurs in around 85% of patients with high-risk MDS.11,12 Thrombocytopenia has recently been defined as an independent negative prognostic factor in MDS patients.13 Treatment for high-risk MDS and AML with thrombocytopenia remains challenging because most chemotherapeutic agents are associated with the development or exacerbation of thrombocytopenia. DAC-based therapy is the current standard first-line treatment for MDS/AML patients; however, dose reduction or treatment cessation due to thrombocytopenia has limited the widespread use of DAC.6 Thus, there is an urgent need to develop combination therapies capable of recovering platelet counts in the context of chemotherapy in MDS and AML.
Eltrombopag (EP), an oral thrombopoietin receptor agonist, can stimulate megakaryopoiesis and elevate platelets by binding to c-MPL.14 Previous studies have demonstrated that EP inhibits leukemia cell proliferation and stimulates megakaryopoiesis in bone marrow cells from AML and MDS patients.15,16 EP can induce rapid cell death in AML cell lines, and its anti-leukemic function does not depend on c-MPL.17 A previous study also found that EP suppresses leukemia cell growth by reducing intracellular iron and blocking the cell cycle in G1 phase.18 An in vivo study further indicated the anti-leukemic activity of EP in prolonging the survival of two mouse leukemia models.18 This anti-leukemic effect was also observed in an AML patient with nucleophosmin 1 (NPM1) mutation. After 2 months of treatment with EP, that patient achieved short-term remission of AML.19 A preclinical study also showed that EP in combination with lenalidomide suppresses leukemia cell growth while preserving the advantageous effect of stimulating megakaryocyte growth.20
In our present study, we explored whether EP exhibited antileukemic effects in the context of DAC treatment in human myeloid leukemia cell lines. Previous studies have shown that EP causes the apoptosis of leukemia cells by changing the intracellular reactive oxygen species (ROS) metabolism.18,21 ROS are a group of reactive chemical entities including hydroxyl radicals, hydrogen peroxide (H2O2), and superoxide anions that participate in cell death. ROS regulate various cellular procedures including cell motility, cell cycle progression, and growth factor signaling.22 The alteration of ROS levels, whether increase or decrease, leads to activation of the stress response.21 Likewise, the generation of ROS during apoptosis has also been identified in several leukemia cell lines treated with DAC.23,24 DAC has been found to induce delayed and sustained ROS accumulation and G1 or G2/M cell cycle block, depending on the leukemia cell types.25
Several clinical trials have already explored the efficacy and safety of EP in high-risk MDS and AML (NCT00903422, NCT01890746, and NCT01440374).26,27 The results indicate that EP administration is safe in high-risk MDS and AML populations and reduces the frequencies of bleeding and platelet transfusion without stimulating malignant hematopoiesis. However, the synergistic effect of EP and HMAs in patients has not been determined. A preclinical study in MDS/AML patient-derived cells assessed EP activity in the context of HMAs. The results revealed that concurrent treatment of EP and azacytidine in leukemia cells did not induce the proliferation of leukemic cells.28 One randomized phase 2 clinical trial (NCT02446145) that compares DAC plus EP or placebo in older patients with AML not eligible for induction chemotherapy is ongoing, and the result has not been reported yet.29
Here, we performed an in vitro study to explore the impacts and mechanisms of EP and/or DAC on leukemia cell growth. For the first time, we assessed the synergistic anti-proliferative effect of the combination of EP and DAC by using in vitro assays to measure cell proliferation, apoptosis, cell cycle distribution and ROS generation. Our study provides in vitro evidence of the efficacy of EP when simultaneously treated with DAC in myeloid leukemia cells.
Materials and methods
Reagents and cell culture
Eltrombopag (SB-497115-GR, SB497115) was purchased from Selleck Chemicals and dissolved in dimethyl sulfoxide (DMSO) (Sigma, USA) and decitabine was purchased from Shandong Qilu Pharmaceutical Co., Ltd. (China). Human myeloid leukemia cell lines (K562 and THP-1) were purchased from the China Center for Type Culture Collection (CCTCC) and were cultured in RPMI 1640 medium (HyClone, USA) containing 10% fetal bovine serum (FBS, SeraPro, Germany), 1% penicilin/streptomycin (Wuhan Servicebio Technology Co., Ltd., China) and incubated at 37 °C with 5% CO2.
Drug treatment
Leukemia cell lines were cultured with 2.5, 5, 10 or 30 μg/mL EP or 0.5, 5, 10, or 20 μmol/L DAC single agents for 24, 48, 72 or 96 hrs. For the combination treatments, EP and DAC were used concurrently in the two cell lines in the following combinations: 2.5 μg/mL EP with 20 μmol/L DAC, 5 μg/mL EP with 20 μmol/L DAC, 10 μg/mL EP with 20 μmol/L DAC, 30 μg/mL EP with 20 umol/L DAC.
Cell viability analysis
Cell counting kit-8 (CCK-8) (Dojindo, Japan) was utilized to detect the viability of leukemia cells. A leukemia cell suspension (100 μL, 5×10⁴ cells/mL) was added to a 96-well plate. Different concentrations of DAC and EP alone or in combination as described above were added to the medium from day 0 and the cells were treated for 72 hrs in an incubator (37 °C, 5% CO2). Before testing the cell viability, 10 μL CCK-8 was added into each well. The plate was incubated 2 hrs. Then, the absorbance was recorded by a microplate reader (Rayto, USA) at 450 nm. The cell viability rate (%) was calculated as follows: (OD450sample−OD450blank)/(OD450control−OD450blank)×100%.
Cell apoptosis assay
Leukemia cell lines were treated with EP, DAC, and EP plus DAC for 72 hrs, and then 5×10⁵ cells were collected by centrifugation. The cells were washed with phosphate-buffered saline (PBS, Servicebio, China) and resuspended in 500 µL of 1× binding buffer. The cells were incubated with 5 µL annexin V-FITC and 5 µL propidium iodide (PI) for 5 min in the dark (room temperature). Then, a flow cytometer (Beckman, USA) was used to analyze leukemia cell apoptosis at excitation wavelength (Ex) of =488 nm and emission wavelength (Em) of =585±21 nm. The apoptotic cells consisted of early apoptotic cells with positive Annexin V and negative PI staining and late apoptotic cells that were double positive for Annexin V and PI.
Cell cycle analysis
Leukemia cell lines were treated with EP, DAC, and EP plus DAC for 72 hrs, and then the leukemia cells were harvested and resuspended in PBS. Next, 75% cold ethanol was added to the cells and the cells were fixed on ice overnight. The cells were washed with PBS and resuspended in staining buffer with 50 µg/mL PI and PBS (including 100 µg/mL RNase A). The above suspension was incubated at 4°C (overnight). Data on cell cycle distributions were acquired using a flow cytometer. FlowJo software was used to analyze the cell cycle distributions.
ROS analysis
Leukemia cell lines were cultured at varying concentrations of EP and/or DAC for 72 hrs. Then leukemia cells were collected and resuspended in PBS. Cell concentrations were adjusted to 1×10⁶-2×10⁸ cells/mL. The cells were stained the cells with 10 µM DCFH-DA at 37 °C for 20 min and mixed and inverted every 3–5 min. The stained leukemia cells were washed once with PBS, and the signal was analyzed the signal at Ex =488 nm and Em =585±20 nm by flow cytometry.
Statistical analysis
The data were evaluated by GraphPad Prism 7.0. All statistical analyses were tested in at least 3 biological replicates and are shown as the mean ± SD. Statistical comparisons of different groups were performed by t tests (and nonparametric tests). Statistically significant differences were considered when the p-value was <0.05.
Results
Synergistic antileukemic effects of EP and DAC in myeloid leukemia cells
An important concern about the possible use of EP and DAC together in AML/MDS patients is that EP might affect the antileukemic effect of DAC in these diseases. To evaluate the potential anti-leukemic effects of EP, myeloid leukemia cells (THP-1 and K562) were cultured with EP, DAC, and the combination of EP and DAC.
We first evaluated the cell viability of both cell lines treated with EP (2.5, 5, 10 and 30 μg/mL) or DAC (0.5, 5, 10 and 20 μmol/L) single agents for 24, 48, 72 and 96 hrs. Consistent with previous studies15–18 we found that in both cell lines, EP did not stimulate the proliferation of leukemia cells but suppressed leukemia cell growth. As shown in Figure 1A–D, EP at 5–30 μg/mL or DAC at 0.5–20 μmol/L exhibited antiproliferation effects in a dose- and time-dependent manner in K562 and THP-1 cells. In K562 cells, after 72 hrs of treatment, the cell viabilities with EP (2.5, 5, 10 and 30 μg/mL) treatment were 99.46%, 89.68%, 52.29%, and 38.40%, respectively, and the cell viabilities with DAC (0.5, 5, 10 and 20 μmol/L) were 73.13%, 53.47%, 47.01%, and 46.05%, respectively. In THP-1 cells, the cell viabilities of EP (2.5, 5, 10 and 30 μg/mL) were 92.58%, 61.42%, 25.98%, and 21.50%, respectively; when treated with DAC (0.5, 5, 10 and 20 μmol/L), the cell viabilities were 87.21%, 78.56%, 61.66%, and 57.21%, respectively.
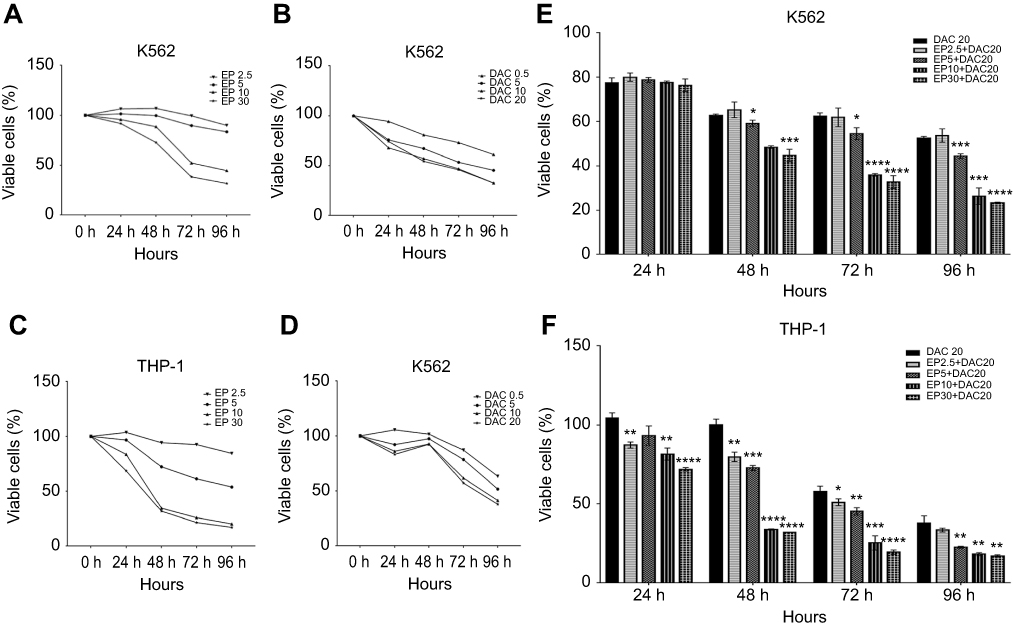 |
Figure 1 Effect of eltrombopag (EP) and/or decitabine (DAC) on the viability of myeloid leukemia cells. (A) Viability of K562 cells incubated with EP (2.5, 5, 10 and 30 μg/mL) alone for 24, 48, 72 and 96 hrs. (B) Viability of K562 cells cultured with DAC (0.5, 5, 10 and 20 μmol/L) alone for 24, 48, 72 and 96 hrs. (C) Viability of THP-1 cells incubated with EP (2.5, 5, 10 and 30 μg/mL) alone for 24, 48, 72 and 96 hrs. (D) Viability of THP-1 cells cultured with DAC (0.5, 5, 10 and 20 μmol/L) alone for 24, 48, 72 and 96 hrs. (E) Viability of K562 cells treated with EP plus DAC (2.5 μg/mL EP +20 μmol/L DAC, 5 μg/mL EP +20 μmol/L DAC, 10 μg/mL EP +20 μmol/L DAC and 30 μg/mL EP +20 μmol/L DAC) for 24, 48, 72 and 96 hrs. (F) Viability of THP-1 cells treated with EP (2.5, 5, 10 and 30 μg/mL) combined with DAC (20 μmol/L) for 24, 48, 72 and 96 hrs. Data are represented as the mean ± SD (****p<0.0001; ***p<0.001; **p<0.01; *p<0.05). |
To measure the effects of EP plus DAC on leukemia cell proliferation, based on the above single-agent studies, we selected the most efficacious DAC concentration (20 μmol/L) to test in combination with different concentrations of EP, including EP 2.5 μg/mL + DAC 20 μmol/L (EP2.5+DAC20), EP 5 μg/mL + DAC 20 μmol/L (EP5+DAC20), EP 10 μg/mL + DAC 20 μmol/L (EP10+DAC20) and EP 30 μg/mL + DAC 20 μmol/L (EP30+DAC20). We found that in the K562 cell line, EP at 5–30 μg/mL combined with DAC (20 μmol/L) significantly inhibited the proliferation of K562 cells after 48 hrs of treatment (Figure 1E). The viabilities of the cells after treatment for 72 hrs with the four different combinations of EP plus DAC described above, were 61.87%, 54.50%, 35.97%, and 32.73%, respectively (Figure 1E). In the THP-1 cell line, different concentrations of EP (2.5–30 μg/mL) combined with DAC (20 μmol/L) resulted in significantly increased antileukemic effects compared to that of DAC as a single agent in a dose- and time-dependent manner (Figure 1F). After incubation for 72 h, the viabilities of THP-1 cells treated with the four different combinations of EP plus DAC were 51.04%, 45.33%, 25.33%, and 19.54%, respectively (Figure 1F).
Overall, the combination treatment of EP plus DAC showed a more obvious antileukemic effect in K562 and THP-1 cell lines in comparison to that of treatment with DAC alone. These results also suggest that compared with K562 cells, THP-1 cells are more sensitive to EP plus DAC treatment.
EP and DAC combination treatment increases the apoptosis of myeloid leukemia cells
THP-1 and K562 cells were cultured with 5 μg/mL EP, 30 μg/mL EP, 20 μmol/L DAC, 5 μg/mL EP +20 μmol/L DAC and 30 μg/mL EP +20 μmol/L DAC for 72 hrs, and EP- and/or DAC-induced apoptosis was measured.
As illustrated in Figure 2A and B, in K562 cells, the ratios of apoptotic cells (early plus late apoptotic cells) after incubation with EP5, DAC20, EP5+DAC20, EP30 and EP30+DAC20 for 72 hrs were 15.33%, 18.99%, 26.11%, 90.26%, and 80.9%, respectively, while in THP-1 cells (Figure 2C and D), the ratios of apoptotic cells after incubation with EP5, DAC20, EP5+DAC20, EP30 and EP30+DAC20 for 72 hrs were 15.99%, 24.33%, 51.59%, 89.89%, and 93.81%, respectively. As shown in Figure 2C and D, in both cell lines, compared to the untreated control, EP or DAC as single agents induced a significant increase in the apoptosis of leukemia cells (p=0.0012 or p=0.0024 in K562 cells, p=0.0064 or p=0.0218 in THP-1 cells, respectively). Moreover, the combination of EP and DAC lead to increased leukemia cell apoptosis compared to that of DAC as a single agent. In the K562 cell line, the fraction of apoptotic cells was 15.33% following treatment with 5 μg/mL EP and 18.99% following treatment with 20 μmol/L DAC alone for 72 hrs. The ratio increased to 26.11% with the combination treatment of EP5+DAC20 (p=0.0001 and p=0.0062, compared to EP alone and DAC alone, respectively). The ratio further increased to 80.9% with the combination treatment of EP30+DAC20 compared to DAC20 (p<0.0001). In the THP-1 cell line, the fraction of apoptotic cells was 15.99% following treatment with 5 μg/mL EP and 24.33% following treatment with 20 μmol/L DAC alone for 72 hrs. This fraction increased to 51.59% with the combination treatment of EP5+DAC20 (p<0.0001 and p=0.0023, respectively). The ratio further increased to 93.81% with the combination treatment of EP30+DAC20 compared to DAC20 (p<0.0001).
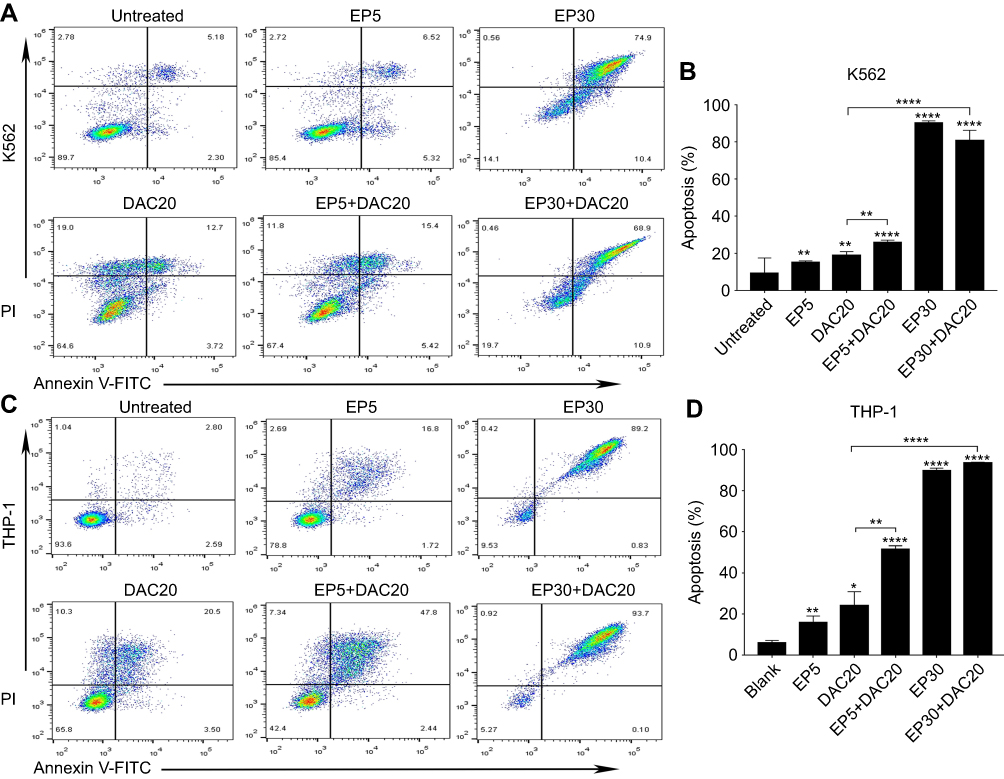 |
Figure 2 Eltrombopag (EP) and/or decitabine (DAC) induced apoptosis in myeloid leukemia cell lines. (A) The ratios of apoptotic K562 cells following EP and/or DAC treatment. (B) Comparison of the percentage of apoptotic cells induced by different concentrations of EP and/or DAC treatment of K562 cells. (C) The ratios of apoptotic THP-1 cells following EP and/or DAC treatment. (D) Comparison of the percentage of apoptotic cells induced by different concentrations of EP and/or DAC treatment of THP-1 cells. Data are represented as the mean ± SD (****p<0.0001; **p<0.01; *p<0.05). |
In both cell lines, EP and DAC could induce leukemia cell apoptosis. The combination of different concentrations of EP with DAC induced remarkably increased apoptosis of leukemia cells compared with DAC single agent treatment.
Effect of treatment with EP and/or DAC on cell cycle distribution
A previous study has already identified that EP suppresses leukemia cell growth by reducing the intracellular iron and leading to cell-cycle block in G1 phase.18 DAC treatment leads to G1 or G2/M cell-cycle block, depending on the leukemia cell type.25 In our study, we assessed the effects of EP and/or DAC on the cell cycle distributions of myeloid leukemia cells by PI staining and flow cytometry.
Both cell lines were cultured with 5 μg/mL EP, 30 μg/mL EP, 20 μmol/L DAC, 5 μg/mL EP +20 μmol/L DAC and 30 μg/mL EP +20 μmol/L DAC for 72 hrs, and then the cell cycle distribution was analyzed. We found that in K562 cells, EP at 5 μg/mL resulted in cell cycle arrest in S phase (the proportion of cells increased from 38.1% to 43.99%, p=0.0062) and G2/M phase (increased from 15.1% to 18.09%, p=0.0203) (Figure 3A and B). In addition, EP at 30 μg/mL, consistent with the previous study,18 resulted in G0/G1 phase cell cycle arrest (increased from 46.72% to 65.74%, p=0.0006). DAC at 20 μmol/L caused S phase arrest (increased from 38.1% to 43.47%, p=0.0034) (Figure 3A and B). In THP-1 cells, consistent with K562 cells, EP at 5 μg/mL induced S phase arrest (increased from 21.03% to 26.93%, p=0.0296), and EP at 30 μg/mL resulted in G0/G1 phase cell cycle arrest (increased from 65.27% to 79.78%, p=0.0296). However, we found a slightly different cell cycle distribution after DAC treatment. DAC at 20 μmol/L caused cell cycle arrest in the G2/M phase (increased from 13.02% to 25.79%, p=0.0006) (Figure 3C and D).
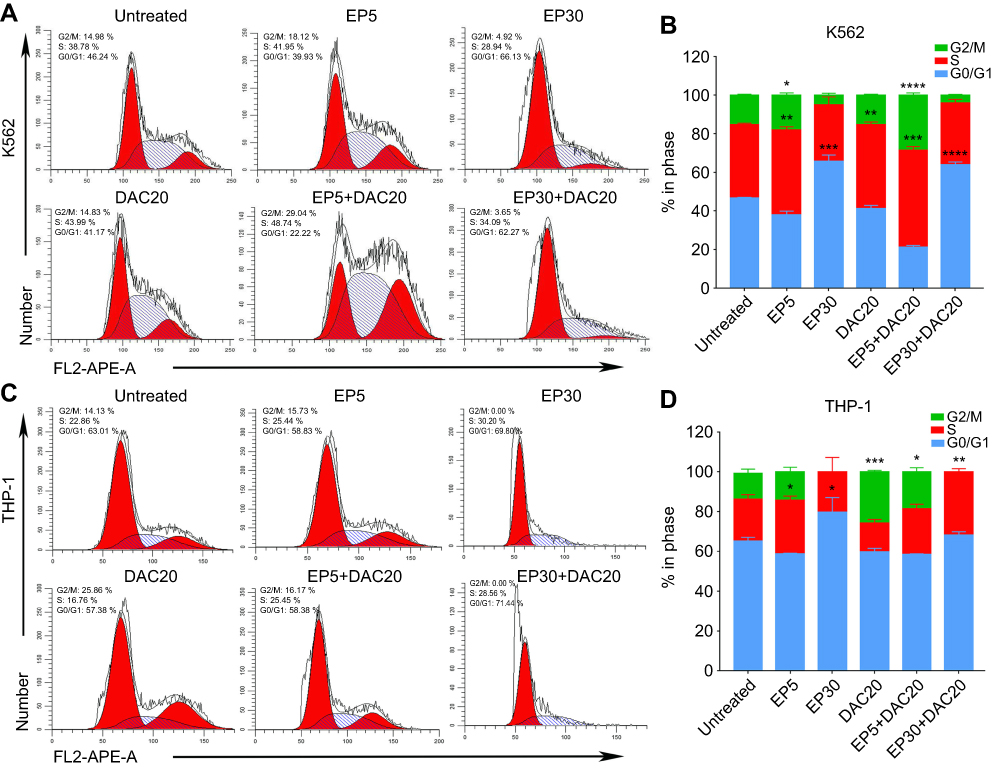 |
Figure 3 Effect of eltrombopag (EP) and/or decitabine (DAC) on cell cycle distribution in myeloid leukemia cell lines. (A) Variation in the cell cycle distribution of K562 cells cultured with EP and/or DAC and the comparison of significantly increased proportions of cells in different phases of the cell cycle. (B) Cell cycle distributions of K562 cells following EP and/or DAC treatment. (C) Variation in the cell cycle distribution of THP-1 cells cultured with EP and/or DAC and the comparison of significantly increased proportions of cells in different phases of the cell cycle. (D) Cell cycle distributions of THP-1 cells following EP and/or DAC treatment. Data are represented as the mean ± SD (****p<0.0001; ***p<0.001; **p<0.01; **p<0.05). |
When leukemia cells were cultured with EP plus DAC, the cell cycle distribution varied with the different concentrations of EP. In the K562 cell line, EP5+DAC20 induced cell cycle arrest in the S phase (increased from 38.1% to 50.12%, p=0.0006) and the G2/M phase (increased from 15.18% to 28.51%, p<0.0001). EP30+DAC20 led to G0/G1 phase cell cycle arrest (increased from 46.72% to 63.95%, p<0.0001) (Figure 3A and B). In the THP-1 cell line, EP5+DAC20 induced G2/M phase cell cycle arrest (increased from 13.02% to 18.56%, p=0.0314). EP30+DAC20 caused S phase cell cycle arrest (increased from 21.03% to 31.633%, p=0.0027) (Figure 3C and D).
In the K562 and THP-1 cell lines, EP at a relatively low concentration (5 μg/mL) mainly induces cell cycle arrest in the S phase, while high-dose EP (30 μg/mL) causes cell cycle arrest in the G0/G1 phase. DAC20 induces cell cycle block in the G2/M or S phase depending on the leukemia cell type. The combination of EP5 and DAC20 had a synergistic effect on S and G2/M phase arrest with a prolonged S phase. The combination of high-dose EP with DAC mainly caused cell cycle arrest in G0/G1 or S phase.
Effect of EP and DAC on intracellular ROS levels
A previous study suggests that EP induces leukemia cell apoptosis and that this effect is associated with a dramatic reduction in ROS.21 Likewise, the generation of ROS during apoptosis has been identified in several leukemia cell lines treated with DAC.23 In our study, myeloid leukemia cells were incubated with EP, DAC, or EP plus DAC at various concentrations for 72 hrs, and the generation of intracellular ROS was examined by DCFH-DA-based flow cytometry.
In K562 and THP-1 cells, decreased ROS levels were observed when using 5 μg/mL EP treatment (p<0.0313 and p<0.0031, respectively); however, significantly increased ROS levels were found when using 30 μg/mL EP treatment (p<0.0036 and p<0.0021, respectively) in comparison with the untreated control (Figure 4A–D). ROS levels in K562 and THP-1 cells were different after DAC treatment. Decreased ROS levels were observed in K562 cells after 20 μmol/L DAC treatment, while increased ROS levels were found in THP-1 cells. Compared to DAC single-agent treatment, the combination of EP5+DAC20 significantly decreased ROS levels (p<0.0489 and p<0.0001), while EP30+DAC20 dramatically increased ROS levels (p<0.0002 and p<0.031) (Figure 4B and D). Consistent with a previous study,21 our results demonstrate that EP at a relatively low concentration (5 μg/mL) induced leukemia cell apoptosis associated with a significantly decreased intracellular ROS, while EP at a relatively higher concentration (30 μg/mL) significantly increased intracellular ROS.
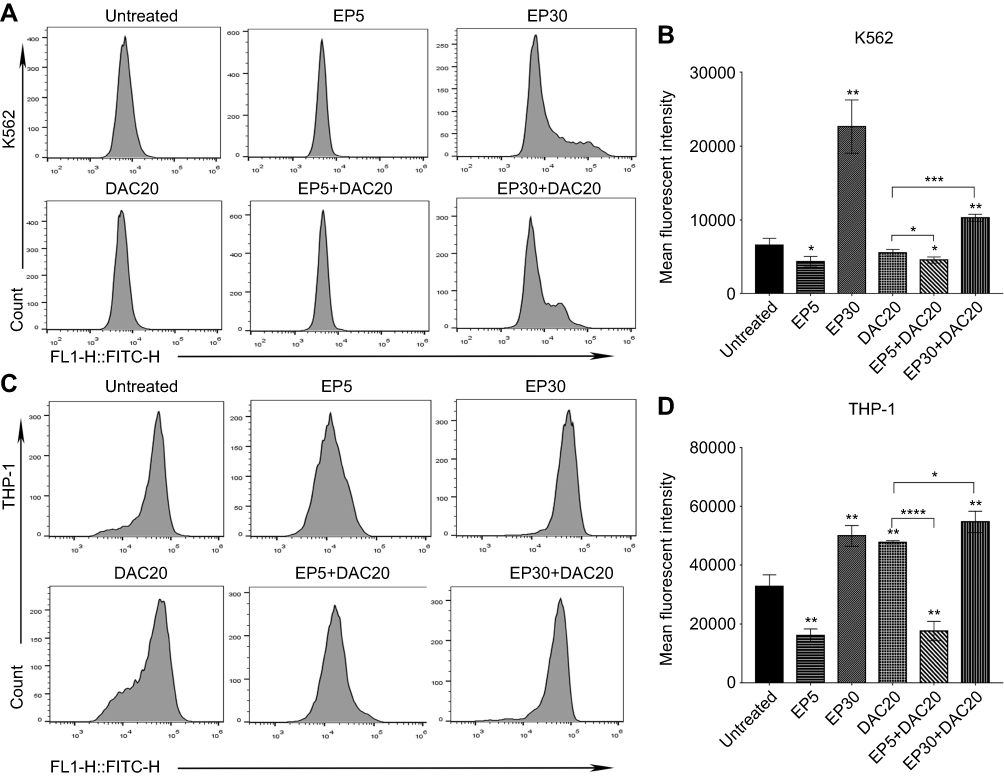 |
Figure 4 Intracellular ROS changes induced by eltrombopag (EP) and/or decitabine (DAC) in myeloid leukemia cells. (A) Intracellular ROS levels in K562 cells following different doses of EP and/or DAC treatment were examined by flow cytometry. (B) Comparison of the ROS alterations in K562 cells cultured with EP and/or DAC. (C) Intracellular ROS levels in THP-1 cells following different doses of EP and/or DAC treatment were examined by flow cytometry. (D) Comparison of the ROS alterations in THP-1 cells incubated with EP and/or DAC. Data are represented as the mean ± SD (****p<0.0001; ***p<0.001; **p<0.01; *p<0.05). |
Therefore, we propose that the synergistic antileukemic effect of EP and DAC is related to the change in intracellular ROS. DAC induced intracellular ROS changes depending on the leukemia cell type. A drop in ROS concentration was observed when K562 cells were treated with 20 μmol/L DAC, while an increase in ROS production was observed in THP-1 cells. Interestingly, in both cell lines, we found that the combination of low-dose EP and DAC induced increased leukemia cell apoptosis with significantly decreased ROS. In contrast, the combination of high-dose EP and DAC induced around 90% leukemia cell apoptosis and was associated with remarkably increased ROS.
Discussion
The risk of bleeding-related mortality and morbidity often occurs in AML and MDS patients, especially in those patients who have undergone HMA-based therapies with thrombocytopenia complications.1–3 Studies have shown that EP is able to inhibit leukemia cell proliferation as well as stimulate megakaryopoiesis.17–20 In this study, we examined whether EP exerted anti-leukemic activities in the context of DAC treatment using in vitro assays that measure cell proliferation, apoptosis, cell cycle distribution, and ROS production.
Concern has been raised in the use of thrombopoietin mimetic agents in MDS and AML patients, as c-MPL is also present on a considerable percentage of myeloid leukemia cells.30,31 Therefore, it is important to identify whether EP stimulates blast cells expressing c-MPL to proliferate. Previous studies15–20 have demonstrated that EP does not increase leukemia cell proliferation; in contrast, preclinical ex vivo and in vivo studies have found that EP has an antiproliferation effect on leukemia cells. The cytotoxicity of EP, unlike its ability to promote megakaryopoiesis, does not depend on c-Mpl.17 This anti-leukemic effect was also observed in an AML patient with a NPM1 mutation.19 Consistent with those studies,15–18,24 our results reveal that continuous EP (5–30 μg/mL) or DAC (>0.5 μmol/L) single-agent treatment suppresses the proliferation of K562 and THP-1 cells.
Phase I/II clinical studies on EP have already demonstrated safety and efficacy in high-risk MDS and AML patients.26,27 However, there is still much controversy about the application of EP in patients simultaneously treated with HMAs. One phase III clinical trial (NCT02158936) that examined the capability of EP in intermediate or high-risk MDS patients using azacytidine treatment was terminated because of the slower platelet and increased risk of developing AML, and the usage of EP combined with HMAs in patients with MDS is, therefore, contraindicated.32 Although that clinical study did not observe a synergistic effect of azacytidine and EP in MDS patients, concerns about concomitant treatment with EP and HMAs have been raised. Recently, one preclinical study of EP combined with azacytidine assessed the antileukemic effect of EP in the context of azacytidine treatment in MDS/AML patient-derived cells.28 The results revealed that concurrent treatment of EP and azacytidine in leukemia cells increased the proliferation of leukemic cells in vitro.28 Interestingly, another in vitro study showed that low-dose DAC was able to improve megakaryocyte maturation and platelet production.33 This possible therapeutic benefit of DAC supports our hypothesis that AML/MDS patients with severe thrombocytopenia may benefit from low-dose DAC combined with EP treatment. The potential effect of EP combined with DAC is being investigated in a clinical trial, and the results have not yet been reported.29
In our present study, we found that the combination of different concentrations of EP and DAC showed more obvious antiproliferative effects than DAC (20 μmol/L) as a single agent. We further found that the combination of EP and DAC inhibited leukemia cell growth and induced cell apoptosis and cell cycle distribution related to changes in intracellular ROS. EP at a relatively low concentration (5 μg/mL) mainly induced cell cycle arrest in the S phase, while high-dose EP (30 μg/mL) resulted in cell cycle arrest in the G0/G1 phase. DAC caused G2/M or S phase cell cycle arrest. The combination of lower concentration EP plus DAC had a synergistic effect in the S and G2/M phase arrest, while high-dose EP combined with DAC induced arrest in the G0/G1 or S phase.
ROS are involved in various signal transduction processes, and regulate cell growth, proliferation, and differentiation.23,24 The quantity of ROS that is required for normal cell function varies among cell types and relies on the metabolic state of the cell. Studies have found that ROS levels are excessive during the progression of cancers.22 The alteration of ROS levels, whether increased or decreased, leads to stress response activation.21 Consistent with a previous study,21 our results demonstrated that EP at a relatively lower concentration (5 μg/mL) induced leukemia cell apoptosis which was related to a significant decrease in ROS, while EP at a relatively higher concentration (30 μg/mL) dramatically increased the intracellular ROS of leukemia cells. We further identified that DAC induced changes in ROS depending on cell type. More interestingly, we found that the combination of low-dose EP and DAC induced increased leukemia cell apoptosis with significantly decreased ROS. In contrast, high-dose EP combined with DAC induced around 90% leukemia cell apoptosis which was associated with remarkably increased ROS. Therefore, we propose that the synergistic antileukemic effect of EP and DAC is related to the alteration of intracellular ROS.
In summary, in this study, we found that EP or DAC is cytotoxic to myeloid leukemia cells and for the first time show that the synergistic antileukemic effects of EP and DAC are associated with changes in intracellular ROS. Our results provide evidence of the efficacy of the combination DAC and EP in myeloid leukemia cells. The combination of EP and low-dose DAC may improve platelet numbers, lessen hematologic toxicity, and ameliorate patient morbidity. Further in vivo studies of the mechanisms of EP DAC combination treatment on leukemia cells are needed.
Acknowledgments
This study was partially supported by the National Natural Science Foundation of China (No. 81471589, No. 81273259), the Health Bureau of Henan Province, People's Republic of China (No. 201201005) and the foundation and frontier research grant of Henan provincial Science and Technology Bureau, People's Republic of China (No. 142300410078 and No. 162102310293), and Sansheng Chunya Funds for Young Scientists. The authors gratefully acknowledge financial support from the China Scholarship Council (201807040012).
Author contributions
All authors contributed to data analysis, drafting and revising the article, gave final approval of the version to be published, and agree to be accountable for all aspects of the work.
Disclosure
The authors report no conflicts of interest in this work.
References
1. Klepin HD. Myelodysplastic syndromes and acute myeloid leukemia in the elderly. Clin Geriatr Med. 2016;32:155–173. doi:10.1016/j.cger.2015.08.010
2. Santini V. How I treat MDS after hypomethylating agent failure. Blood. 2019;133:521–529. doi:10.1182/blood-2018-03-785915
3. Zeidan AM, Hu X. Hypomethylating agent therapy use and survival in older patients with chronic myelomonocytic leukemia in the united states: A large population-based study. Cancer. 2017;123:3754–3762. doi:10.1002/cncr.30814
4. Malik P, Cashen AF. Decitabine in the treatment of acute myeloid leukemia in elderly patients. Cancer Manag Res. 2014;6:53–61. doi:10.2147/CMAR.S40600
5. Cruijsen M, Lubbert M, Wijermans P, Huls G. Clinical results of hypomethylating agents in aml treatment. J Clin Med. 2014;4:1–17. doi:10.3390/jcm4010001
6. Cashen AF, Schiller GJ, O’Donnell MR, DiPersio JF. Multicenter, phase II study of decitabine for the first-line treatment of older patients with acute myeloid leukemia. J Clin Oncol. 2010;28(4):556–561. doi:10.1200/JCO.2009.23.9178
7. Gotze K, Muller-Thomas C, Peschel C. The role of azacitidine in the management of myelodysplastic syndromes (mds). Cancer Manag Res. 2009;1:119–130.
8. DiNardo CD, Pratz K, Pullarkat V, et al. Venetoclax combined with decitabine or azacitidine in treatment-naive, elderly patients with acute myeloid leukemia. Blood. 2019;133:7–17. doi:10.1182/blood-2018-08-868752
9. Gao C, Wang J, Li Y, et al. Incidence and risk of hematologic toxicities with hypomethylating agents in the treatment of myelodysplastic syndromes and acute myeloid leukopenia: A systematic review and meta-analysis. Medicine. 2018;97:e11860. doi:10.1097/MD.0000000000011860
10. Bryan J, Jabbour E, Prescott H, Kantarjian H. Thrombocytopenia in patients with myelodysplastic syndromes. Semin Hematol. 2010;47:274–280. doi:10.1053/j.seminhematol.2010.02.006
11. Silverman LR, Demakos EP, Peterson BL, et al. Randomized controlled trial of azacitidine in patients with the myelodysplastic syndrome: a study of the cancer and leukemia group B. J Clin Oncol. 2002;20:2429–2440. doi:10.1200/JCO.2002.04.117
12. Fenaux P, Mufti GJ, Hellstrom-Lindberg E, et al. Efficacy of azacitidine compared with that of conventional care regimens in the treatment of higher-risk myelodysplastic syndromes: a randomised, open-label, phase III study. Lancet Oncol. 2009;10:223–232. doi:10.1016/S1470-2045(09)70234-7
13. Svensson T, Chowdhury O, Garelius H, et al. A pilot phase i dose finding safety study of the thrombopoietin-receptor agonist, eltrombopag, in patients with myelodysplastic syndrome treated with azacitidine. Eur J Haematol. 2014;93:439–445. doi:10.1111/ejh.12383
14. Olnes MJ, Scheinberg P, Calvo KR, et al. Eltrombopag and improved hematopoiesis in refractory aplastic anemia. N Engl J Med. 2012;367:11–19. doi:10.1056/NEJMoa1200931
15. Will B, Kawahara M, Luciano JP, et al. Effect of the nonpeptide thrombopoietin receptor agonist eltrombopag on bone marrow cells from patients with acute myeloid leukemia and myelodysplastic syndrome. Blood. 2009;114:3899–3908. doi:10.1182/blood-2009-04-219493
16. Kalota A, Gewirtz AM. A prototype nonpeptidyl, hydrazone class, thrombopoietin receptor agonist, sb-559457, is toxic to primary human myeloid leukemia cells. Blood. 2010;115:89–93. doi:10.1182/blood-2009-06-227751
17. Erickson-Miller CL, Kirchner J, Aivado M, May R, Payne P, Chadderton A. Reduced proliferation of non-megakaryocytic acute myelogenous leukemia and other leukemia and lymphoma cell lines in response to eltrombopag. Leuk Res. 2010;34:1224–1231. doi:10.1016/j.leukres.2010.02.005
18. Roth M, Will B, Simkin G, et al. Eltrombopag inhibits the proliferation of leukemia cells via reduction of intracellular iron and induction of differentiation. Blood. 2012;120:386–394. doi:10.1182/blood-2011-12-399667
19. Platzbecker U, Sockel K, Schonefeldt C, et al. Induction of short-term remission with single agent eltrombopag in refractory nucleophosmin-1-mutated acute myeloid leukemia. Haematologica. 2014;99:e247–e248. doi:10.3324/haematol.2014.111948
20. Tamari R, Schinke C, Bhagat T, et al. Eltrombopag can overcome the anti-megakaryopoietic effects of lenalidomide without increasing proliferation of the malignant myelodysplastic syndrome/acute myelogenous leukemia clone. Leukemia Lymphoma. 2014;55:2901–2906. doi:10.3109/10428194.2014.894186
21. Kalota A, Selak MA, Garcia-Cid LA, Carroll M. Eltrombopag modulates reactive oxygen species and decreases acute myeloid leukemia cell survival. PLoS One. 2015;10:e0126691. doi:10.1371/journal.pone.0126691
22. Hole PS, Pearn L, Tonks AJ, et al. Ras-induced reactive oxygen species promote growth factor-independent proliferation in human cd34+ hematopoietic progenitor cells. Blood. 2010;115:1238–1246. doi:10.1182/blood-2009-12-255992
23. Brodska B, Holoubek A. Generation of reactive oxygen species during apoptosis induced by DNA-damaging agents and/or histone deacetylase inhibitors. Oxid Med Cell Longev. 2011;2011:253529. doi:10.1155/2011/253529
24. Shin DY, Park YS, Yang K, et al. Decitabine, a DNA methyltransferase inhibitor, induces apoptosis in human leukemia cells through intracellular reactive oxygen species generation. Int J Oncol. 2012;41:910–918. doi:10.3892/ijo.2012.1546
25. Fandy TE, Jiemjit A, Thakar M, Rhoden P, Suarez L, Gore SD. Decitabine induces delayed reactive oxygen species (ros) accumulation in leukemia cells and induces the expression of ros generating enzymes. Clin Cancer Res. 2014;20:1249–1258. doi:10.1158/1078-0432.CCR-13-3045
26. Platzbecker U, Wong RS, Verma A, et al. Safety and tolerability of eltrombopag versus placebo for treatment of thrombocytopenia in patients with advanced myelodysplastic syndromes or acute myeloid leukaemia: A multicentre, randomised, placebo-controlled, double-blind, phase 1/2 trial. Lancet Haematol. 2015;2:e417–e426. doi:10.1016/S2352-3026(15)00149-0
27. Mittelman M, Platzbecker U, Afanasyev B, et al. Eltrombopag for advanced myelodysplastic syndromes or acute myeloid leukaemia and severe thrombocytopenia (aspire): A randomised, placebo-controlled, phase 2 trial. Lancet Haematol. 2018;5:e34–e43. doi:10.1016/S2352-3026(17)30228-4
28. Cole S, Benard L, Carvajal LA, et al. Pre-clinical modeling of concomitant therapy with azacytidine and eltrombopag in MDS/AML. Blood. 2017;130:2950.
29. Buckstein R. Eltrombopag use in higher risk myeloid cancers: fitting a square “pag” into a round hole? Lancet Haematol. 2019;6:e111–e112. doi:10.1016/S2352-3026(19)30010-9
30. Sangkhae V, Etheridge SL, Kaushansky K, Hitchcock IS. The thrombopoietin receptor, mpl, is critical for development of a jak2v617f-induced myeloproliferative neoplasm. Blood. 2014;124:3956–3963. doi:10.1182/blood-2014-07-587238
31. Li H, Zhao N, Li Y, et al. c-MPL is a candidate surface marker and confers self-renewal, quiescence, chemotherapy resistance, and leukemia initiation potential in leukemia stem cells. Stem Cells. 2018;36:1685–1696.
32. Dickinson M, Cherif H, Fenaux P, et al. Azacitidine with or without eltrombopag for first-line treatment of intermediate- or high-risk mds with thrombocytopenia. Blood. 2018;132:2629–2638. doi:10.1182/blood-2018-06-855221
33. Zhou H, Hou Y, Liu X, et al. Low-dose decitabine promotes megakaryocyte maturation and platelet production in healthy controls and immune thrombocytopenia. Thromb Haemost. 2015;113:1021–1034. doi:10.1160/TH14-04-0342
 © 2019 The Author(s). This work is published and licensed by Dove Medical Press Limited. The full terms of this license are available at https://www.dovepress.com/terms.php and incorporate the Creative Commons Attribution - Non Commercial (unported, v3.0) License.
By accessing the work you hereby accept the Terms. Non-commercial uses of the work are permitted without any further permission from Dove Medical Press Limited, provided the work is properly attributed. For permission for commercial use of this work, please see paragraphs 4.2 and 5 of our Terms.
© 2019 The Author(s). This work is published and licensed by Dove Medical Press Limited. The full terms of this license are available at https://www.dovepress.com/terms.php and incorporate the Creative Commons Attribution - Non Commercial (unported, v3.0) License.
By accessing the work you hereby accept the Terms. Non-commercial uses of the work are permitted without any further permission from Dove Medical Press Limited, provided the work is properly attributed. For permission for commercial use of this work, please see paragraphs 4.2 and 5 of our Terms.