")
Back to Journals » Risk Management and Healthcare Policy » Volume 13
The Study of Out-of-pocket Payment and the Exposure of Households with Catastrophic Health Expenditures Following the Health Transformation Plan in Iran
Authors Nemati E, Khezri A , Nosratnejad S
Received 22 June 2020
Accepted for publication 18 August 2020
Published 22 September 2020 Volume 2020:13 Pages 1677—1685
DOI https://doi.org/10.2147/RMHP.S264943
Checked for plagiarism Yes
Review by Single anonymous peer review
Peer reviewer comments 2
Editor who approved publication: Professor Marco Carotenuto
Esmat Nemati,1 Ali Khezri,2 Shirin Nosratnejad3,4
1Department of Accreditation and Supervision on Treatment, Dezful University of Medical Sciences, Dezful, Iran; 2School of Nursing and Midwifery, Bam University of Medical Sciences, Bam, Iran; 3Iranian Center of Excellence in Health Services Management, School of Management and Medical Informatics, Tabriz University of Medical Sciences, Tabriz, Iran; 4Department of Health Economics, School of Management and Medical Informatics, Tabriz University of Medical Sciences, Tabriz, Iran
Correspondence: Shirin Nosratnejad
School of Management and Medical Informatics, Tabriz University of Medical Sciences, Daneshgah Avenue, Tabriz, Iran
Tel/ Fax +989 125166149
Email [email protected]
Introduction: One of the main objectives of health systems is providing financial protection against out-of-pocket (OOP) health expenditures. According to the 2011 report by the World Health Organization in the Eastern Mediterranean Regional Office (EMRO), a huge portion of health service in Iran is paid OOP, which is around 58% of the total health system expenditure. Furthermore, all over the world, around 25 million households (100 million people) are trapped in poverty as a result of paying health service costs. Therefore, this research was aimed at investigating the OOP and exposure of households with catastrophic health expenditures (CHE) following the implementation of a health transformation plan in Tabriz, Iran.
Methods: A descriptive-analytic study was conducted on a cross-sectional basis. The sample included 400 households, who were interviewed using the World Health Survey questionnaire, and then OOP payment and exposure of households to CHE were estimated, and the effective factors on OOP payment and the determinants of CHE were analyzed using a regression model.
Results: After implementing the health transformation plan, the average share of households’ OOP payments, toward their ability to pay was 13.2%. In addition, 11.25% of the households were exposed to CHE in Tabriz. The key determinants of OOP were income, dental services, pharmaceuticals, radiology, and physiotherapy. The factors affecting CHE were income, insurance status, marital status, dental services, pharmacy, physiotherapy, and radiological services.
Conclusion: Based on the results of the current study and compared to similar research conducted prior to this plan, it is obvious that the transformation plan was able to achieve its goal in “reducing OOP payments”. However, health services such as dental, pharmacy, physiotherapy, and radiology would increase the likelihood of facing OOP payments. These variables should be considered by health policy-makers in order to review and revise the content of recent reform to provide financial protection against OOP for people.
Keywords: out-of-pocket payments, OOP, households, catastrophic health expenditures, CHE, health transformation plan, Iran
Introduction
Costs are imposed on health systems and people due to economic crises, lack of health system resources, new medical technologies, and catastrophic health expenditure (CHE).1 According to the information collected from 89 countries, direct out-of-pocket (OOP) payments for health services has moved individuals to the extent of financial disaster and poverty. It is estimated that in these countries, up to 10% of the population suffer from health-related financial disasters each year, that pushes them around 4% below the poverty line. Based on the data covering 90% of the world’s population, each year, 100 million people are pushed below the poverty line as a result of using health services and OOP payments.1,2 In addition, according to the 2011 World Health Organization (WHO) report on Eastern Mediterranean Regional Office (EMRO), the share of OOP payment for the total health sector expenditure was 58%.3 Thus, one of the main goals of policymakers and health planners in each country is to provide people with financial security against diseases that contribute to the direct contribution of OOP payments.4 Therefore, many people are forced not to seek or use health services due to their financial conditions. As a result, people suffer from illness and lose their job, which moves them toward poverty.1 According to WHO, about 25 million households (100 million individuals) worldwide are trapped in poverty as the result of such financial problems.5
Based on a study conducted in nine countries in Southeast Asia, at least 30% of health financing has been through OOP payment.6 Hence, the WHO has emphasized the protection of households against health-care expenditure. In this regard, equity in the financing of households is the main goal of health systems. In the context of equity, the WHO has put forward the Fair Financial Contribution Index (FFC), which measures fairness in the distribution of financial burdens for health-care costs in communities. OOP payments are the costs of receiving health-care services, typically at the place of service.7 Some households are forced to sell assets and borrow money from people to receive care services, which results in facing CHE and weakening the economy of households, which highlight the importance of paying attention to OOP payments. It has been estimated that 150 million people worldwide pay through OOP, which increases their CHE. Therefore, based on the reports, about 100 million people are at the risk of poverty.1
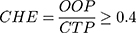
In Bangladesh, around five million people are under the poverty line due to OOP payments for health care. In addition, according to the statistical reports for India and China, 37 and 32 million people, respectively, are under the poverty line due to OOP payment.8 OOP payment is the main payment method for health care in most low and middle-income countries.9,10 This includes 63% of all health care costs in Bangladesh, where increasing the OOP payment exposes the households to CHE.11 The WHO recognizes households facing CHE when the household’s OOP expenditure on health is equal to or higher than 40% of the household’s capacity to pay.12,13 The Health Transformation Plan (HTP) incorporates the rules and regulations related to the program “reducing the payment of hospitalized patients in hospitals affiliated with the Ministry of Health and Medical Education”. These rules have been drafted as program packages for the transformation of the health system in May 2014. The plan was designed to reduce direct payments of hospitalized patients eligible for basic health insurance to 10% of the total costs of admission to hospitals affiliated with the Ministry of Health and Medical Education. Moreover, it aims at preventing patients from leaving hospitals for purchasing drugs, equipment, medical consumables, and diagnostic services.14
Household’s ability to pay refers to the situation where the household’s income is higher than their livelihoods. The difference between the total household’s gross expenditure and expenditure for the minimum livelihood indicates their payment capacity. In the case of households whose food costs are lower than the minimum subsistence level, the payment capacity is equal to the gross margin minus the food costs.15
Therefore, the financial protection of families from such payments, and consequently their interaction with poverty, is one of the supreme goals of health systems around the world. WHO is calling for global health coverage by providing access to health care through reducing OOP payments for health-care services to decrease livelihood costs.11,16
Today, the lack of financial protection in health is considered a disease for health systems. The clearest indication is that households suffer not only from the burden of disease, but also from the burden of economic poverty. In other words, they suffer from CHE and poverty caused by health financing. Therefore, early detection by health policy makers and legislation of novel preventive rules in the payment process can have a positive effect on the financial protection of individuals.17 Consequently, the present study aims to investigate the amount of OOP payments and exposure of households to CHE and its effective factors after the implementation of the health transformation plan in Tabriz. The results of this study can be applied by identifying the amount of OOP payment and CHE of households, as well as minimizing the costs involved.
Materials and Methods
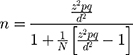
A descriptive-analytic study was conducted on a cross-sectional basis in Tabriz, Iran in April 2017. Regarding the nature of the current study, a Morgan table was used for determining the sample size. Taking into consideration a very large statistical society, with a confidence level of 95% and a marginal error of 5%, the minimum sample size was determined as 400 households. Generally, a total of 1197 individuals were interviewed from the households.
The sampling process was done through cluster analysis, which included 10 regions of Tabriz, divided into five regions geographically (north, south, east, west, and center). From each geographic region, districts were randomly selected and each district was sampled in proportion to the population of that area.
Households were interviewed using a questionnaire. In the case of household’s avoidance to take part in the interview after three attempts, another household was substituted.
Data Collection Tools
World Health Survey (WHS) questionnaire was used for the purpose of collecting data for the current study. The questionnaire was developed in 2003 to evaluate the performance of health systems based on three goals set by the WHO. The validity and reliability of the questionnaire in native language have been confirmed in a study by Kavosi et al.18
The questionnaire consists of two parts:
- Sociodemographic questions of household members and household heads.
- The health needs of household members, health insurance status, wealth and income status, and a question about household’s expenditures during the previous month.
The questionnaires were completed after receiving the informed consent from household’s head and assuring him/her of the confidentiality of the research information by the researchers. After completing the data collection process, the data were analyzed using the Stata Statistical Software 14 for Windows.
Data Analysis
Using the questionnaire, the required data about the households’ situations were collected. The next step, focused on the household’s expenditures (as an indicator of income detected) and then food expenses (as a minimum survival cost). Afterward, the household’s capacity to pay (CTP) was calculated and the household OOP payment rate was determined by calculating direct medical and direct non-medical costs. Finally, CHE was calculated as below:


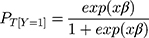
For determining the effective factors on OOP and exposure to CHE, ordinary least squares regression (OLS) and logistic regression (LR) were performed, respectively. Finally, STATA 14 software was used to analyze the data. The general form of this regression is as follows:
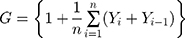
Then the Gini coefficient was applied to determine the distribution of CHE among different income deciles. The Gini coefficient was calculated from the Lorenz curve as follows:


Results
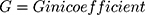
According to the data from the questionnaire, 373 (93.25%) household heads were male and 27 (6.75%) were female. Also, 253 (31.75%) individuals from households were males and the remaining 544 (68.25%) were female.
The age of household heads varied in the range of 25–89 years old. Regarding the level of education, the highest frequency of education was school level including 242 individuals (30.26%) and the lowest frequency was attributed to people with a doctoral level degree. Regarding the insurance coverage, 97% of the households benefited from insurance. A large portion of health-care expenditure (92%) was provided from household active incomes. The second largest source of health-care expenditure was from household savings (37%). Considering the amount of income, the highest income was about $342–685 per month which included 42.5% of the households and the lowest, which was about $1.371–1.714, included nine households (Table 1).
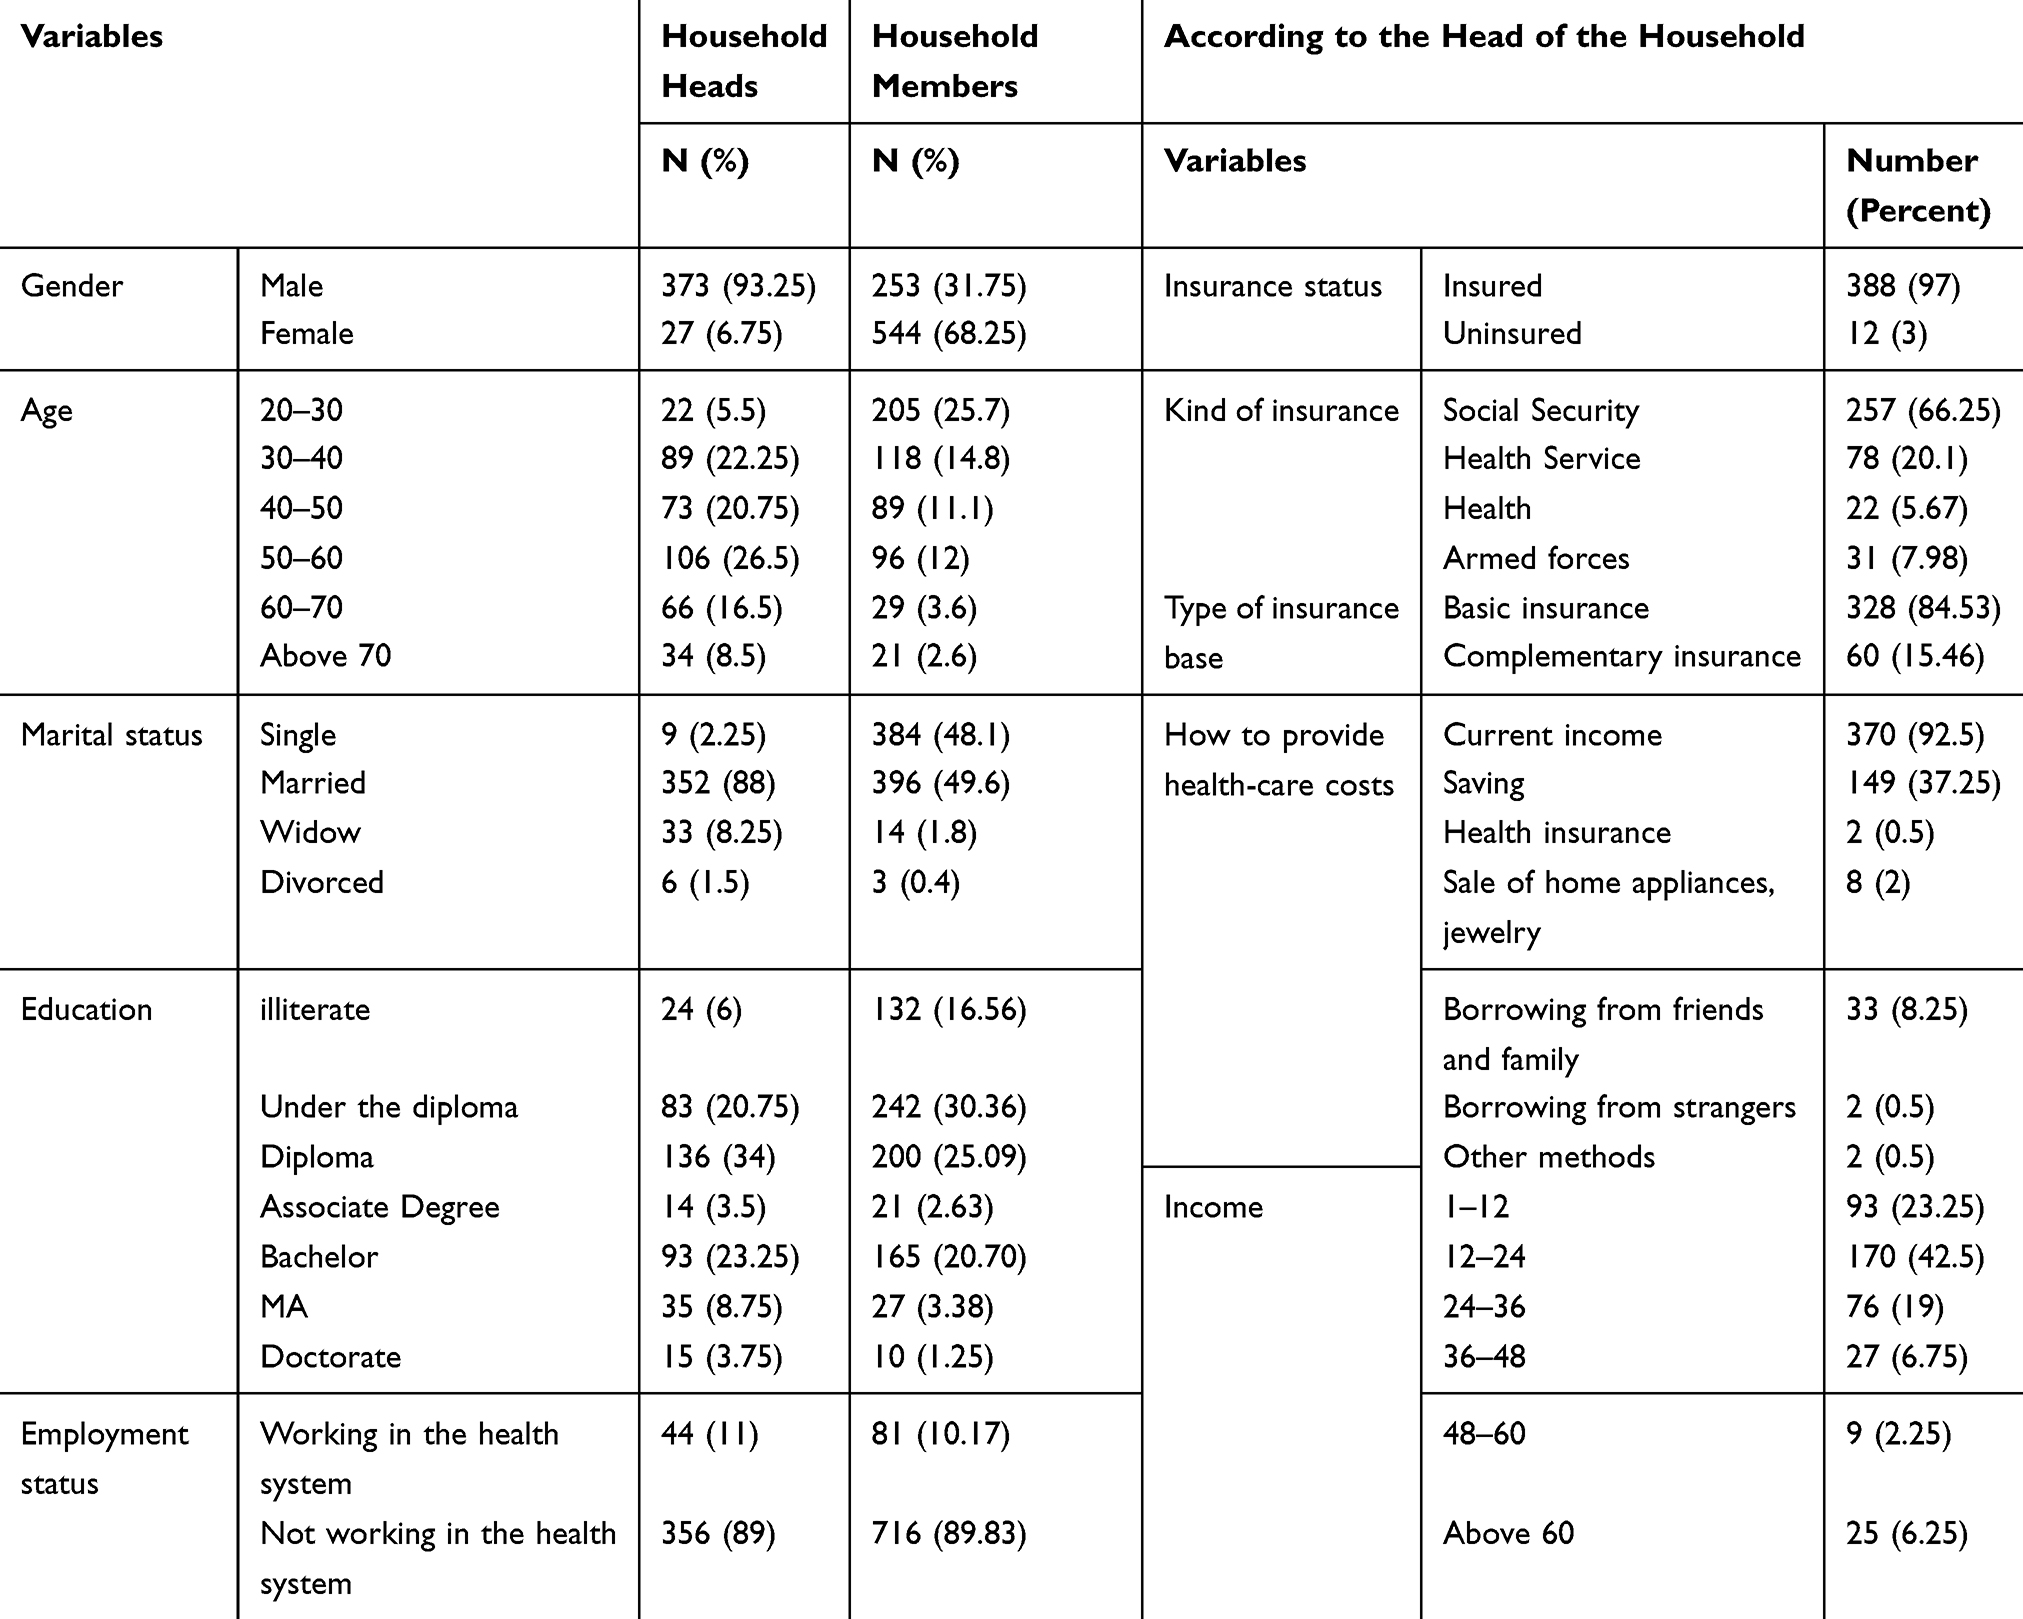 |
Table 1 Frequency Distribution of Households/Individual Characteristics |
Determining the Amount of OOP Payment of Households
The average share of OOP payments of households is about 13.2% of their income, the lowest of which is 0% and the highest share is 233.33% (SD: 26.9 ). The average capacity to pay among households is $483.3, with the lowest being about −$861.1 and the highest as $4500 (SD: 18.3 ). The negative amount of payment for some households indicates that the cost of food is higher than household’s income, and households are forced to sell home furniture or borrow money from relatives and others to provide a minimum amount of livelihood (Table 2).
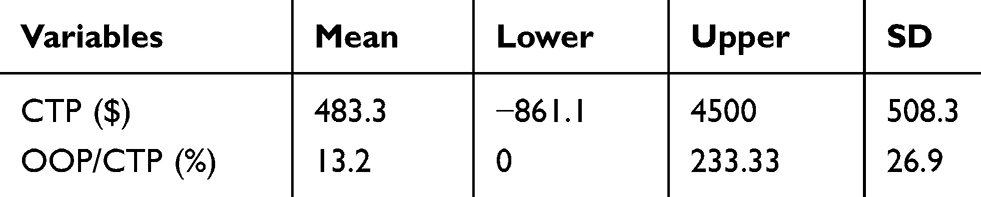 |
Table 2 Average Share of the OOP Payment of the Household |
The average monthly OOP payment of households was $771 per month. Figure 1 indicates the share of OOP among households for different services.
 |
Figure 1 The share of household OOP payment in different services. |
It is noteworthy that, among the households, 11.25% have been exposed to CHE.
The results of estimating the factors affecting OOP payment are reported in Table 3.
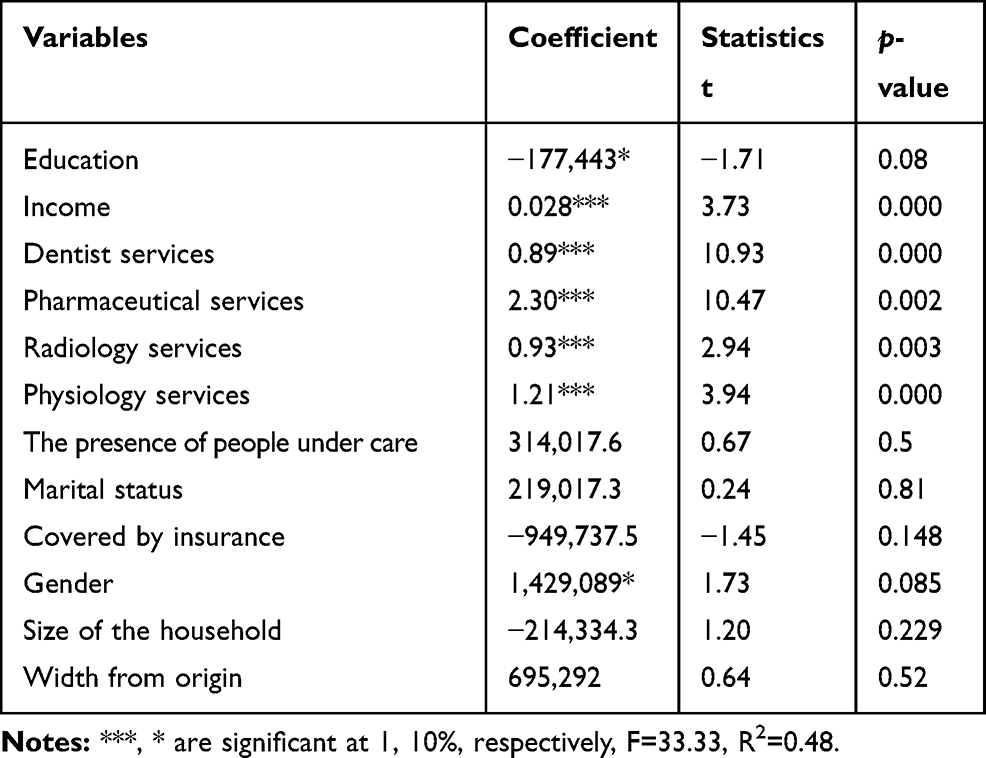 |
Table 3 Factors Influencing the OOP Payments |
Among all the effective factors, income, dental services, pharmaceuticals, radiology, and physiotherapy indicate a positive and significant effect on OOP payment. The findings suggest that an increase in each of these variables, will raise the amount of OOP payment.
Moreover, the results of estimating the factors affecting CHE are reported in Table 4.
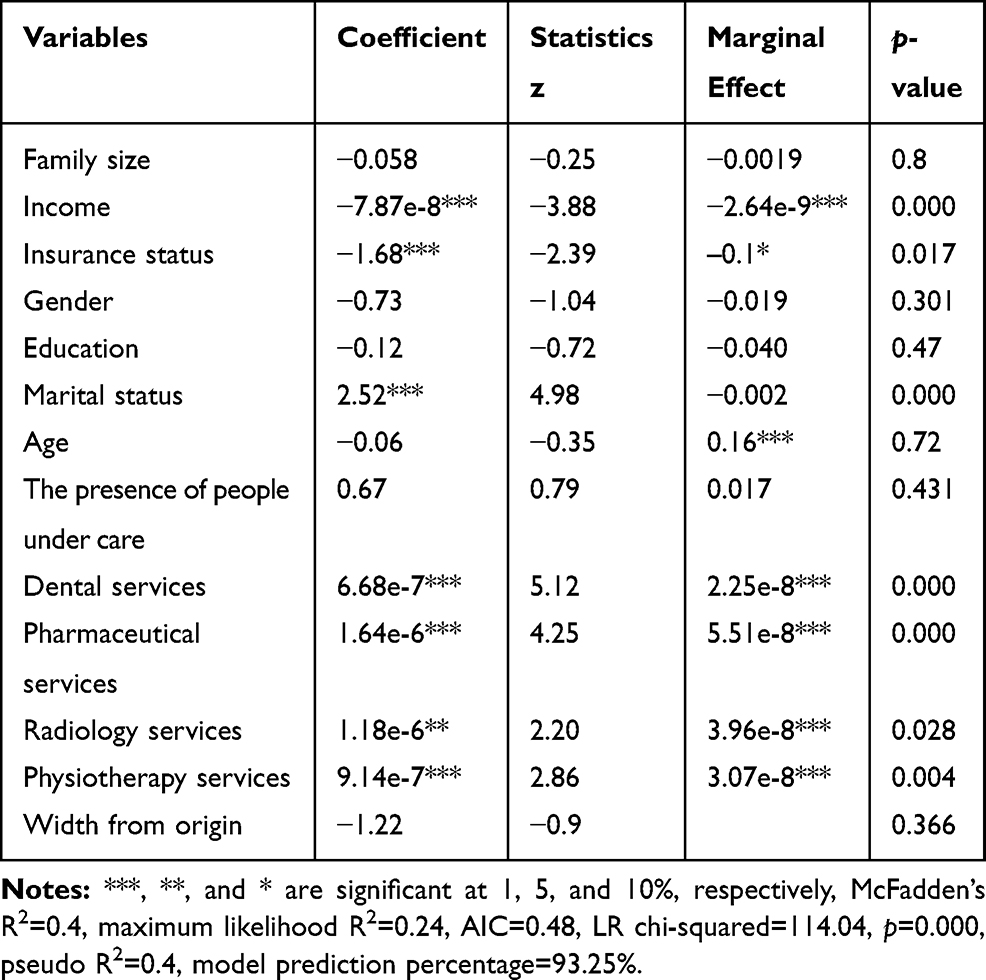 |
Table 4 The Effective Factors on the CHE |
Income, insurance status, marital status, dental services, pharmacy, and physiotherapy at the level of 1% and radiological services at the level of 5% are statistically significant. The standard goodness of fit of McFadden's R2 is 40%.
According to Table 4, the age variable has a negative coefficient, indicating that the probability of facing CHE for the head of household especially at higher ages is low. Furthermore, age as a variable is not statistically significant. Insurance coverage is another important variable in dealing with CHE. This negative sign suggests that as the probability of insurance coverage goes up, the possibility of facing CHE decreases. It also indicates that the model expresses a significant estimation model within a 99% interval. The final effect suggests that by insuring households, the likelihood of exposure to CHE is reduced by −0.1%. Such a small coefficient indicates the inefficiency of the insurance system in preventing CHE.
According to Table 4, income, as a measure of economic inequality, has a negative significant effect on the probability of CHE at a 99% confidence level.
The single (code 0) and married (code 1) were found positive and significant (at 99% level). Therefore, it is clear that the probability of facing CHE for households with married parents was higher than that of single-headed households. This suggests that the likelihood of exposure to CHE would be as high as 0.16% for married individuals.
People under care (ie, those with disabilities, children, and the elderly) are considered as groups with high probability of CHE. The presence of any individual from this group in the household increases the possibility of CHE. Although not statistically significant, the positive effect of the presence of individuals from such vulnerable groups calls for a need to provide attention and support for preventing CHE in the households.
The distribution of households in terms of CHE at different income deciles was studied carefully. Figure 2 shows the percentage of households exposed to CHE in each income decile. Households in the first income decile (the poorest group) were exposed to CHE (28 households) most frequently. In the other words, families in a higher decile had a lower probability of facing CHE.
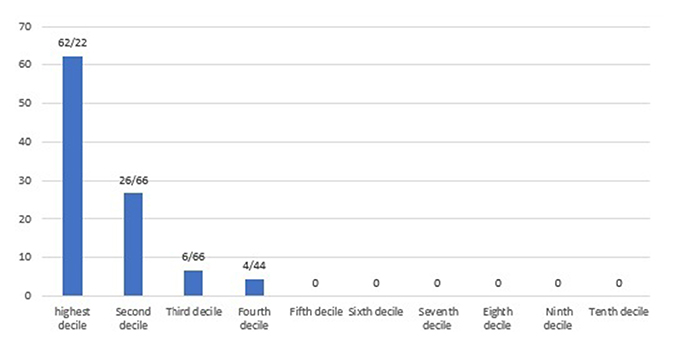 |
Figure 2 The distribution of CHE in different income decile of households. |
The Gini coefficient for OOP among households was 0.58, indicating that the gap among the households in terms of the distribution of OOP was considerably high during the study period. Lorenz curves related to the distribution of OOP in Tabriz are shown in Figure 3. As presented in the diagram, the gap between the curve and the line of equality is high, which indicates a high degree of inequality in the distribution of OOP among the households of Tabriz during the study period.
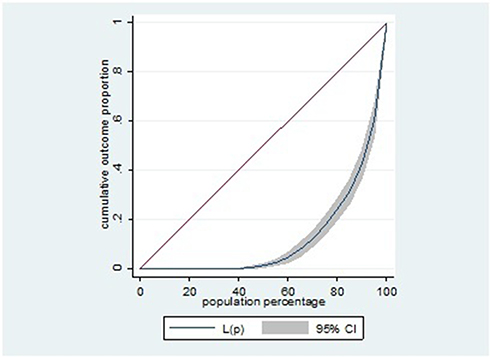 |
Figure 3 Lorenz curve for distribution of OOP. |
Discussion
The purpose of the current study was to determine the amount of OOP payment and exposure of households to CHE and its effective factors after implementing the health system transformation plan in Tabriz.
The OOP payment of households was estimated as 13.2% of their incomes. In the study of Mehralhassani et al, the total health expenditure and OOP payments in Iran’s provinces were estimated and found that OOP payments in East Azarbaijan were 48.72% during 2014.19
According to the WHO, the percentage of health expenditure in Iran was estimated at 5.6% of GDP. Meanwhile, private spending was 56.6% of total health expenditure and the total OOP payment was 96.6% of the total private expenditures. This indicates that almost 100% of private health expenditure was paid by households themselves.20 The high share of households’ OOP payments has long been a serious challenge for the country. The implementation of the health care transformation plans on “reducing the amount of OOP payment” and the actions taken in this area has considerably decreased such costs. Mohamadi and Zaraei studied the effect of the health system transformation plan on payment contribution of health insurers at Ilam University Hospitals during 2010 and 2011. According to their findings, the final contribution paid by health insurers to public hospitals in December 2011 decreased by about 5.10% compared to the same period in the previous year.21
The results showed that after the implementation of the health transformation plan, 11.25% of the households were exposed to CHE. Compared to the internal statistics before implementing the health transformation plan, studies such as Panahi et al had revealed that the proportion of household exposure to CHE was estimated to be 30% in Tabriz.22
According to the estimated Gini coefficient (0.58), the distribution of health-care costs for households in Tabriz was relatively undesirable. Inequality, in particular, is linked to the welfare and well-being of social strata such as access to health. It increases the pressure from the burden of consumption expenditure on households and affects their health in an undesirable manner.
Based on the findings of Dehghan et al, most hospital managers believed that as one of the seven guidelines of the health transformation plan; the implementation of reducing OOP payment was more successful and effective and contributed to the promotion of the health system compared to the other five guidelines.23
In a study by Semnani in 2002, the share of peoples’ OOP payment was estimated to be 57%. His findings revealed that households with low income spend 40% of their income on health care, whereas affluent households spend 9% of their income on health-care services.24 In the study of Barati et al, the share of people in health spending has steadily increased over the years 1996 to 2006 in Kerman.25 Comparing the results, it is clear that the health transformation plan has had a positive effect on reducing the cost of OOP payment. In another study in Asian countries, it was concluded that in developing countries, households with a fair economic situation spend a high proportion of their incomes on health expenditures.26 Somkotra et al reported that in Thailand CHE was passed from the poor families to the wealthy ones due to the implementation of public insurance coverage. Their findings can be justified based on the fact that that the poor use public health services and wealthy households use the private sector;27 however, their findings are not in agreement with the those of the current study. In another study in Thailand, the implementation of public health insurance has led to the reduction of CHE in households.28 Compared to the results of the current study, it is clear that even after implementing the health system transformation plan in Tabriz, the insurance coverage has not been effective in reducing health costs. In a 2000 survey by the WHO among eight developing countries, it was found that households in these countries did not pay more than 25% of their health costs.29
In the present study, insurance coverage indicated a negative, but not significant, effect on OOP payment costs. It is suggested that during the study years, insurance coverage was not successful in providing the necessary support for households in confronting medical costs. This means that OOP payment health and treatment are still subject to social and economic inequalities of households and insurance coverage has not been effective in reducing such an association. Some researchers, such as Galárraga et al30 and Sparrow et al,31 regard the ethical risks of insurance as one of the factors that increase the cost of OOP payment. They recommend that insurance should only cover the vulnerable and poor population as a support. Others, such as Merlis et al32 and Xu et al,33 declare that insurance is a cause of reducing the OOP payment.
The results of this study were in agreement with those of Jung and Liu Streeter34 and some other similar authors,35,36 who reported that income had a positive effect on the cost of OOP payment.
The results of the current study also showed that the explanatory variable of household size negatively affected CHE. Moreover, based on these results, increasing the members of the household resulted in an increase in the number of employed members and thus decreased the possibility of facing CHE. The results obtained regarding the effect of the household member as an explanatory variable on the probability of CHE in the current study are in good agreement with the results of a similar study by Moghadam et al. The results of his research indicated that with increasing a households’ members, the likelihood of exposure to CHE of health and other catastrophes decreased. Households with one or two members were more exposed to CHE than households with members between three and five or more than six members;37 which is in line with the results of the present study. Meanwhile, the results of a study in Turkey by Yardim et al showed that an increase in the members of the household by one individual resulted in an increase in expenses by 2% and an increase in the probability of facing CHE for health services of 4.0%.38 It is clear that these findings are not consistent with the results of the present study.
The findings from the current study showed that, in female-headed households, the likelihood of CHE was high. In a study conducted in Gujarat, Ranson concluded that female-headed households had more health-care costs due to their lower income levels. He also found a meaningful positive correlation with a coefficient of 1.5 between the female head of the household and the possibility of CHE;39 which is also in line with our results.
The presence of member with a health problem in a household was another variable that showed a positive relationship with the probability of CHE. Certainly, in such a household, expenses were high and the capacity to pay was low, which increased the possibility of confronting CHE. This result is also in line with the findings of Su et al,6 who reported that with an increase in the number of patient members of the household, the likelihood of exposure to CHE in health care would increase.
Galárraga et al also concluded that households with members suffering from diabetes, hypertension, and gastritis were more likely to be exposed to CHE even with an insurance coverage.30 It is suggested that adding a patient or a disabled member to a household increased the likelihood of confronting CHE in health services by 3%.40 The results of these studies are also in agreement with findings of the current research.
According to the research findings, the Gini coefficient for health expenditure among households of Tabriz was 0.58. In a study on rural and urban households in Tehran, Ghaedamini et al concluded that the inequality in health expenditure was severe based on the Gini coefficient for the period between 1989 and 2006 (between 0.6 and 0.8).41 In a study of Hadian et al, the Gini coefficient for health expenditure among rural households was 13% in 1998 and 0.13 in 2009. For urban households, the Gini coefficient for health-care expenditures was equal to 0.18 and 0.14 between 1998 and 2009, respectively.42
Conclusion
The health system transformation plan has been implemented with an emphasis on meeting the health needs of people. Based on the results of current study and compared to similar studies conducted before the health transformation plan, it is suggested that the plan has been able to achieve its goal in “reducing the amount of people OOP payments”.
These changes were mainly contributed by patients with specific treatment demands, who were dissatisfied with the continuation of treatment before the implementation of the plan due to the high levels of OOP payment, However, by implementing the transformation plan and reducing the amount of franchise, they have been pursuing their treatment. Considering the high inequality in the distribution of CHE among the households of Tabriz in the study period and the large gap between the curve and the equality line, it is noteworthy that the reduction of this amount would have desirable affects and might be a great achievement for human development. Today, governments have put the principle of social justice at the top of their agenda and have focused on its attainment at macro level on equality and the reduction of regional disparities, focusing on infrastructure affairs such as health and education. Finally, according to other studies conducted at the country level, it has been concluded that CHE in health-care services has decreased at the household level, indicating a desirable performance of the health transformation plan in achieving its main goal of reducing OOP payments and protecting households against health payments.
Ethical Considerations
We received ethical approval from Tabriz University of Medical Sciences (contract no. IR.TBZMED.REC.05/95/3084) for conducting this study.
Acknowledgment
The authors are thankful to the Department of Health Economics, School of Health Management and Information Sciences, Tabriz University of Medical Sciences.
Disclosure
The authors declare that they have no conflicts of interest in this work.
References
1. Xu K, Evans DB, Carrin G, Aguilar-Rivera AM, Musgrove P, Evans T. Protecting households from catastrophic health spending. Health Aff. 2007;26(4):972–983. doi:10.1377/hlthaff.26.4.972
2. World Health Statistics.2012. Available from: https://www.who.int/gho/publications/world_health_statistics/EN_WHS2012_Full.pdf.
3. Fazaeli AA, Seyedin H, Moghaddam AV, et al. Fairness of financial contribution in Iranian health system: trend analysis of national household income and expenditure, 2003–2010. Glob J Health Sci. 2015;7(5):260. doi:10.5539/gjhs.v7n5p260
4. Raghfar H, Khezri M, Vaez MZ, Sangari MK. Impact of Health Insurance Inefficiency on Poverty Among Iranian Households. 2013.
5. World Health Organization. Designing health financing systems to reduce catastrophic health expenditure. 2005. Available from: https://www.who.int/health_financing/documents/cov-pb_e_05_2-cata_sys/en/ https://www.who.int/health_financing/documents/en/.
6. Su TT, Kouyaté B, Flessa S. Catastrophic household expenditure for health care in a low-income society: a study from Nouna District, Burkina Faso. Bull World Health Organ. 2006;84:21–27. doi:10.2471/BLT.05.023739
7. World Health Organization. The world health report 2000—health systems: improving performance. Available from: https://www.who.int/whr/2000/en/.
8. Van Doorslaer E, O’Donnell O, Rannan‐Eliya RP, et al. Catastrophic payments for health care in Asia. Health Econ. 2007;16(11):1159–1184. doi:10.1002/hec.1209
9. Wagstaff A, Doorslaer E. Catastrophe and impoverishment in paying for health care: with applications to Vietnam 1993–1998. Health Econ. 2003;12(11):921–933. doi:10.1002/hec.776
10. Van Doorslaer E, O’Donnell O, Rannan-Eliya RP, et al. Effect of payments for health care on poverty estimates in 11 countries in Asia: an analysis of household survey data. The Lancet. 2006;368(9544):1357–1364. doi:10.1016/S0140-6736(06)69560-3
11. Rannan-Eliya R. Bangladesh national health accounts 1997–2007. Health Economics Unit, Ministry of Health and Family Welfare, Government of Bangladesh. 2012.
12. Piroozi B, Moradi G, Nouri B, Bolbanabad AM, Safari H. Catastrophic health expenditure after the implementation of health sector evolution plan: a case study in the west of Iran. Int j Health Pol Manage. 2016;5(7):417. doi:10.15171/ijhpm.2016.31
13. Xu K, Evans DB, Kawabata K, Zeramdini R, Klavus J, Murray CJ. Household catastrophic health expenditure: a multicountry analysis. The Lancet. 2003;362(9378):111–117. doi:10.1016/S0140-6736(03)13861-5
14. Set of Guidelines for the Development of the Health System. Ministry of Health and Medical Education.
15. Johansson MW, Persson M. Swedish households’ indebtedness and ability to pay: a household level study. Press Commun. 2006;30:234.
16. World Health Organization. Sustainable health financing, universal coverage and social health insurance. World Health Assembly Resolution. 2005;58:139–140.
17. Knaul FM, Frenk J. Health insurance in Mexico: achieving universal coverage through structural reform. Health Aff. 2005;24(6):1467–1476. doi:10.1377/hlthaff.24.6.1467
18. Kavosi Z, Rashidian A, Pourmalek F, et al. Measuring household exposure to catastrophic health care expenditures: a Longitudinal study in Zone 17 of Tehran. Hakim Res J. 2009;12(2):38–47.
19. Mehrolhassani M, Najafi B, Yazdi Feyzabadi V, et al. Total health expenditures and proportion of out-of-pocket payments in Iranian provinces; 2008-2014. Iranian J Epidemiol. 2017;12(5SpecialIssue):1–12.
20. World Health Organization. World Health Statistics. World Health Organization; 2010; 2010.
21. Mohamadi E, Zaraei G Investigating the effect of health care improvement plan on the payment of the insured in Iranian health insurance organization (case study: hospitalized patients in collegiate hospitals of Ilam city in December 2013 and 2014). J Ilam Univ Med Sciences. 2017;24(6):178–188.
22. Panahi H, Janati A, Narimani M, Assadzadeh A, Mohammadzadeh P, Naderi A. Catastrophic expenditures for hospitalized patients in Tabriz, Iran. J PAYESH. 2014;6(13):655–663.
23. Dehghan A, Mirjalili M, Zare Mehrjardi M, Kazemeini S. Performance of health care system reform plan from the perspective of university hospitals executives in Yazd province in 2015. Manag Strat Health Sys. 2016;1:1.
24. Semnani SH, Keshtkar A.A, Assessing of equality on health care cost in Gorgans population laboratory study. J Gorgan Univ Med Sciences. 2003;12(5):53-59.
25. Barati A, Ghaderi H, Hajhassani D. Health Services Utilization Trends Among Households In Kerman: 1996-2002. 2006.
26. O’Donnell O, Van Doorslaer E, Rannan-Eliya RP, et al. Who pays for health care in Asia. J Health Econ. 2008;27(2):460–475. doi:10.1016/j.jhealeco.2007.08.005
27. Somkotra T, Lagrada LP. Which households are at risk of catastrophic health spending: experience in Thailand after universal coverage. Health Aff. 2009;28(3):w467–w478. doi:10.1377/hlthaff.28.3.w467
28. Somkotra T, Lagrada LP. Payments for health care and its effect on catastrophe and impoverishment: experience from the transition to Universal Coverage in Thailand. Soc Sci Med. 2008;67(12):2027–2035. doi:10.1016/j.socscimed.2008.09.047
29. World Health Organization. The World Health Report 2000 Health Systems: Improving Performance. World Health Organization; 2000.
30. Galárraga O, Sosa-Rubí SG, Salinas A, Sesma S The impact of universal health insurance on catastrophic and out-of-pocket health expenditures in Mexico: A model with an endogenous treatment variable. Health Econometrics and Data Group Working Paper. 2008; 8:12.
31. Sparrow R, Suryahadi A, Widyanti W. Social health insurance for the poor: targeting and impact of Indonesia’s Askeskin programme. Soc Sci Med. 2013;96:264–271. doi:10.1016/j.socscimed.2012.09.043
32. Merlis M, Gould D, Mahato B, Fund C. Rising Out-Of-Pocket Spending for Medical Care: A Growing Strain on Family Budgets. Citeseer; 2006.
33. Xu K, Evans D, Carrin G, Aguilar-Rivera AM Designing health financing systems to reduce catastrophic health expenditure. 2005.
34. Jung J, Liu Streeter J. Does health insurance decrease health expenditure risk in developing countries? The case of China. South Econ J. 2015;82(2):361–384. doi:10.1002/soej.12101
35. You X, Kobayashi Y. Determinants of out-of-pocket health expenditure in China. Appl Health Econ Health Policy. 2011;9(1):39–49. doi:10.2165/11530730-000000000-00000
36. Lorenz C Out-of-pocket household health expenditures and their use in National Health Accounts: evidence from Pakistan. Asia Health Policy Program Working Paper. 2009:9.
37. Moghadam MN, Banshi M, Javar MA. Iranian household financial protection against catastrophic health care expenditures. Iran J Public Health. 2012;41(9):62.
38. Yardim MS, Cilingiroglu N, Yardim N. Catastrophic health expenditure and impoverishment in Turkey. Health Policy (New York). 2010;94(1):26–33. doi:10.1016/j.healthpol.2009.08.006
39. Ranson MK. Reduction of catastrophic health care expenditures by a community-based health insurance scheme in Gujarat, India: current experiences and challenges. Bull World Health Organ. 2002;80:613–621.
40. Rivero CC, Ruiz GAL, Barrera RM, Levet CGC. Catastrophic expenditure in health and income elasticities by item of expenditure in health services in Mexico. Well-Being Soc Pol. 2006;2(1):47–69.
41. Ghaedamini GH, Sharifian Sani M, Raghfar H, Salehi M. Inequality trend of selected items of consumption household basket in Tehran: 1989–2006. Social Welfare Quarterly. 2011;40(11):315–339.
42. Hadian M, Ghorbani A, Ghiasvand H, Naghdi S Inequality in health and food expenditure, study of Iranian urban and rural households. J Sabzevar Univ Med Sciences. 2013;4(20): 435–446.
 © 2020 The Author(s). This work is published and licensed by Dove Medical Press Limited. The full terms of this license are available at https://www.dovepress.com/terms.php and incorporate the Creative Commons Attribution - Non Commercial (unported, v3.0) License.
By accessing the work you hereby accept the Terms. Non-commercial uses of the work are permitted without any further permission from Dove Medical Press Limited, provided the work is properly attributed. For permission for commercial use of this work, please see paragraphs 4.2 and 5 of our Terms.
© 2020 The Author(s). This work is published and licensed by Dove Medical Press Limited. The full terms of this license are available at https://www.dovepress.com/terms.php and incorporate the Creative Commons Attribution - Non Commercial (unported, v3.0) License.
By accessing the work you hereby accept the Terms. Non-commercial uses of the work are permitted without any further permission from Dove Medical Press Limited, provided the work is properly attributed. For permission for commercial use of this work, please see paragraphs 4.2 and 5 of our Terms.