")
Back to Journals » OncoTargets and Therapy » Volume 13
The Somatic Mutation Landscape and RNA Prognostic Markers in Stomach Adenocarcinoma
Authors Zhang X , Zheng P , Li Z, Gao S, Liu G
Received 25 May 2020
Accepted for publication 12 July 2020
Published 4 August 2020 Volume 2020:13 Pages 7735—7746
DOI https://doi.org/10.2147/OTT.S263733
Checked for plagiarism Yes
Review by Single anonymous peer review
Peer reviewer comments 3
Editor who approved publication: Prof. Dr. Takuya Aoki
Xiulei Zhang,1 Peiming Zheng,2 Zhen Li,1 Shanjun Gao,1 Guangzhi Liu1,3,4
1Department of Microbiome Laboratory, Henan Provincial People’s Hospital, People’s Hospital of Zhengzhou University, Zhengzhou 450003, People’s Republic of China; 2Department of Clinical Laboratory, Henan Provincial People’s Hospital, People’s Hospital of Zhengzhou University, Zhengzhou 450003, People’s Republic of China; 3Department of Obstetrics and Gynecology, Henan Provincial People’s Hospital, People’s Hospital of Zhengzhou University, Zhengzhou 450003, People’s Republic of China; 4Henan Key Laboratory of Stem Cell Differentiation and Modification, Henan Provincial People’s Hospital, People’s Hospital of Zhengzhou University, Zhengzhou 450003, People’s Republic of China
Correspondence: Peiming Zheng; Guangzhi Liu
People’s Hospital of Zhengzhou University, Zhengzhou 450003, People’s Republic of China
Tel +86 37165897605
Email [email protected]; [email protected]
Purpose: Stomach cancer is one of the highest incidence and mortality malignancies worldwide. Our study aimed to illustrate the somatic mutation landscape and identify molecular markers of stomach cancer.
Materials and Methods: By integrated analysis of sequencing data and clinical data of stomach adenocarcinoma (STAD) from The Cancer Genome Atlas (TCGA) database, we identified several susceptibility genes and novel molecular markers and validated their potential function by the starBase website. Further, we validated the clinical value of two candidate lncRNAs in collected STAD samples by RT-qPCR.
Results: We illustrated the distributions of mutation frequencies and types to get the top 20 high-mutation frequency genes in STAD. We also found 2127 mRNAs, 129 miRNAs, and 170 lncRNAs that were differentially expressed. We identified four lncRNA-miRNA-mRNA ceRNAs (PVT1, MAGI2-AS3, MIR17HG, KCNQ1OT1). Besides, 27 mRNAs (PDE4C, ID1, AQP3, VCAN, FAP, NOX4, ANGPT2, SERPINE1, SPARC, PDGFRB, FN1, MFAP2, CSMD2, INHBA, COL10A1, MATN3, P4HA3, ADAMTS12, DGKI, OLFML2B, TMEM200A, FNDC1, CTHRC1, CHST1, F5, COL5A2, TUBB3) and two lncRNAs (MIR4458HG, LINC01235) showed a significant prognostic value, and their prognostic values were validated by the starBase website. What’s more, the clinical values of MIR4458HG and LINC01235 were also demonstrated in collected STAD samples.
Conclusion: We constructed the lncRNA ceRNA networks and identified 20 high-mutation frequency genes and 29 prognostic markers (27 mRNAs and two lncRNAs).
Keywords: STAD, mutation, ceRNA, lncRNA, prognostic marker
Introduction
Stomach cancer is one of the most common malignancies worldwide, with high incidence and mortality, and one of the main stomach cancer pathological types is stomach adenocarcinoma (STAD).1 Although there are several universal genetic changes that are involved in the development of STAD, identifying mechanisms that underlie cancer progression remains challenging due to a complicated signaling pathway network. Therefore, identification of potential biomarkers and novel targets for diagnosis, prognosis, and treatment is urgently needed.
With the rapid progress in the high-throughput next generation sequencing (NGS) technology, characterization of genome-wide variations and discovery of novel oncotargets have become more feasible. Only a small percentage of mutations cause genetic disorders, thus it’s very significant for identification of somatic variants from big sequencing data. Bioinformatics based on gene expression profiles will provide new clues for seeking for novel molecular diagnostic and prognostic markers. Increasing evidence has shown that mRNA, miRNA, and lncRNA play an important role in the occurrence and development of cancer, including cell proliferation, differentiation, cell cycle, apoptosis, mesenchymal transition, and drug resistance.2,4 mRNA can be translated into a functional protein that is involved in various pathology and physiology processes. miRNA interacts with mRNA to degrade it or inhibit its translation. LncRNA takes an important part in tumorigenesis by various mechanisms such as ceRNA, RNA decoy, transcription regulation, and epigenetic modification.5 That lncRNA acts as ceRNA in lncRNA-miRNA-mRNA form involves in kinds of tumorigenesis, such as stomach cancer, breast cancer, kidney cancer, head and neck squamous cancer, lung cancer, or prostate cancer.6 By analyzing the sequencing data of STAD from The Cancer Genome Atlas (TCGA) database, we aimed to investigate the distinct mRNA, miRNA, and lncRNA biomarkers that show clinical significance in STAD.
In this study, we investigate the top 20 high-mutation frequency genes and identify the highest single nucleotide variant (SNV) C>T transition. We find 2127 mRNAs, 129 miRNAs, and 170 lncRNAs (P-value≤0.01, |log2Fold change|≥1) in STAD samples. We also find several abnormal signaling pathways such as cell cycle, cellular senescence, and p53 signaling pathway in STAD. Besides, we found 27 mRNAs and two lncRNAs that show significant prognostic value in STAD, and their prognostic values are validated by the starBase database.7 In summary, our results provide the somatic mutation landscape, the differential RNA expression profiles, and potentially diagnostic and prognostic markers of STAD.
Materials and Methods
Data Download
The data of Stomach adenocarcinoma (STAD) were downloaded from TCGA database (http://tcga-data.nci.nih.gov/) using the gdc-client. The data included somatic variants, RNA-seq, miRNA-seq, and clinical data. This study met the publication guidelines stated by TCGA. All data used in the study were obtained from TCGA, and hence ethics approval and informed consent were not required. The demographic and clinical features of the STAD patients are summarized in Table 1.
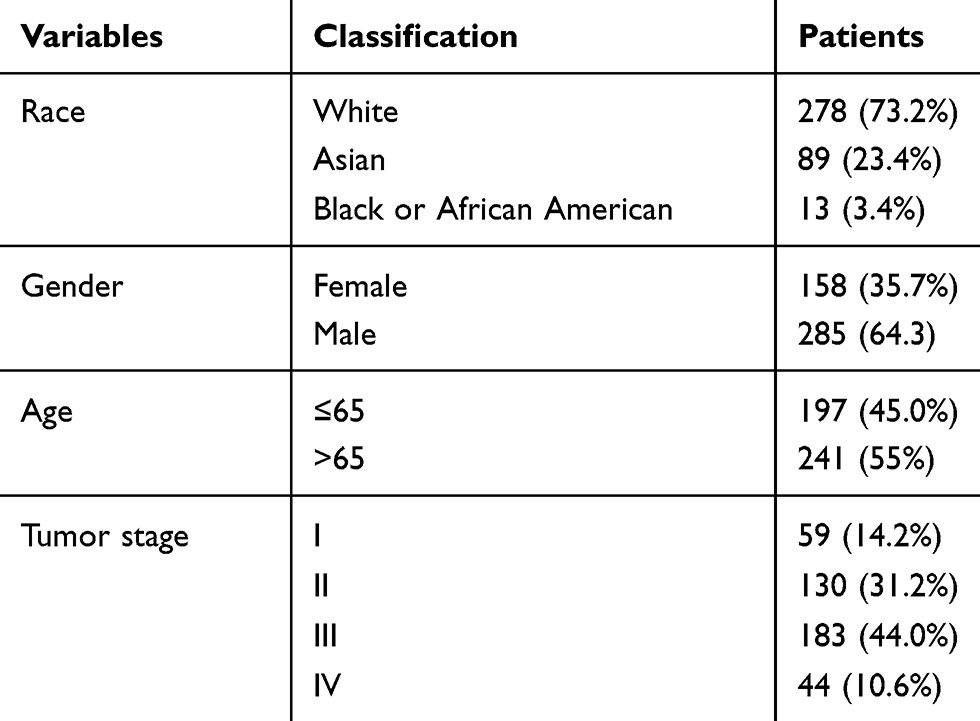 |
Table 1 The Demographic and Clinical Features of the STAD Patients |
Analysis and Visualization of Mutation Landscape
Variant numbers and types in each STAD sample were calculated, analyzed, and visualized using the Mutation Annotation Format (MAF) files from the TCGA website via the R package maftools.8 The Oncogenic Pathways function was checked for enrichment of known Oncogenic Signaling Pathways in TCGA cohorts.9
Differential Expression Analysis
We first filtered duplicated samples and non-Primary Tumor and non-Solid Tissue Normal samples in RNA-seq and miRNA-seq metadata. Then we merged raw counts data and did TMM normalization and voom transformation. The differential expression analysis was performed by R package limma and the cut-off was a P-value≤0.01 and |log2Fold change|≥1.10 All differential expression RNAs were visualized in volcano plot and heatmap by R package ggplot2.11
Functional Enrichment Analysis
Gene Ontology (GO) and Kyoto Encyclopedia of Genes and Genomes (KEGG) functional enrichment analysis were performed by R package clusterProfiler and a P-value≤0.05 was set as the cut-off.12 Protein–Protein Interaction (PPI) was analyzed by the STRING website (http://string-db.org/cgi/input.pl) and displayed using Cytoscape.13
ceRNA Network Analysis
Analysis of the lncRNA-miRNA-mRNA network was based on calculating hypergeometric probability, Pearson’s correlation, and Regulation similarity by R package GDCRNATools.14 Common miRNAs targeting both lncRNA and mRNA were identified using the starBase database. ceRNAs were selected with thresholds of hyperPvalue≤0.05, corPvalue≤0.05, and regSim≠0. The ceRNA networks were visualized in Sankey plot using R package ggalluvial.
Survival Analysis
Kaplan-Meier and Log rank test were employed to determine the relationship between all differential expression RNAs (mRNAs, miRNAs, lncRNAs) and overall survival of STAD patients. A P-value≤0.05 was regarded as significant.
Validation and Coexpression Analysis
Validation of the differential expression analysis and prognostic value of candidate differential expression RNAs (mRNAs, lncRNAs) were performed through the starBase database. Pearson’s correlation is calculated to measure the expression correlation between lncRNA and mRNA (|cor|≥0.3, P-value≤0.05).
Patients Samples and RT-qPCR Validation
Normal, paracancer, and cancer samples from 20 STAD patients were obtained by resection from Henan Provincial People’s Hospital between January 26, 2019 and September 8, 2019. The samples were dissected by a professional pathologist. Tissue 1–2 cm away from the cancer was used as the paracancer sample, and tissue 3–5 cm away from the cancer was used as the normal sample. All enrolled patients were newly diagnosed with STAD. The inclusion criteria were as follows: 1) all subjects were diagnosed by gastroscopy and histopathology and 2) did not undergo any preoperative treatment. The exclusion criteria were as follows: 1) combined with other cancer patients and 2) combined with heart, kidney, and liver dysfunction. All clinicopathological data for the STAD samples, including age, sex, clinical stage, and histological grade, were obtained from the clinical and pathological records. This study was performed in accordance with the rules of the Declaration of Helsinki of 1975 (revised in 2013) and approved by the Clinical Research Ethics Committee. Informed consent forms were obtained from all subjects before they participated in the study. Tissue samples were stored in RNAlater stabilization solution (Thermo Fisher Scientific, USA) at −80°C. Tissue samples were homogenized by TissueLyser using 3 mm steel balls in TRIzol reagent (Thermo Fisher Scientific) to extract total RNA according to the manufacturer’s instructions. The RNAs were then DNase I treated and reverse-transcribed with HiScript II 1st Strand cDNA Synthesis Kit (Vazyme, China), followed by qPCR on a StepOnePlus machine (Thermo Fisher Scientific) using SYBR Green master mix (Vazyme) and specific primers (18S, forward-GTAACCCGTTGAACCCCATT, reverse-CCATCCAATCGGTAGTAGCG; MIR4458HG, forward-CCTATTGGTCCCAGGTGTCG, reverse-ATGGGTGCCATTGACGTCTT; LINC01235, forward-GTCTCTCACAGGTCAACGCA, reverse-TGTGTCCCCTTTTGGCTGAA). The qPCR reaction condition was set as following, holding stage (95°C, 5 minutes); cycling stage (95°C, 10 seconds; 60°C 30 seconds; 40 cycle); melt curve stage (95°C, 15 seconds; 60°C, 1 minute; 95°C, 15 seconds; in step and hold mode). Besides, the specificity of primers has been tested by melt curve and nucleic acid gel electrophoresis.
Results
The Somatic Mutation Landscape in STAD
To illustrate the somatic variants of STAD, we utilized the Mutation Annotation Format (MAF) files from the TCGA website and performed the variants annotation. We found that the main Variant Classification was Missense Mutation, the main Variant type was single nucleotide polymorphism (SNP), and the main single nucleotide variant (SNV) Class was C>T transition (Figure 1A). We further performed functional enrichment analysis of the mutated genes and found they mainly enriched in RTK-RAS, WNT, NOTCH, Hippo, PI3K, Cell Cycle, MYC, TGFβ, TP53, and NRF2 signaling pathway (Figure 1B). We also analyzed the mutation landscape of the top 20 genes that sorted by mutation frequency, and they were TTN, TP53, MUC16, LRP1B, SYNE1, ARID1A, CSMD3, FAT4, FLG, PCLO, HMCN1, CSMD1, OBSCN, ZFHX4, DNAH5, RYR2, SPTA1, KMT2D, FAT3, and PIK3CA (Figure 1C). Identification and characterization of somatic variants would help us understand the susceptibility genes in STAD.
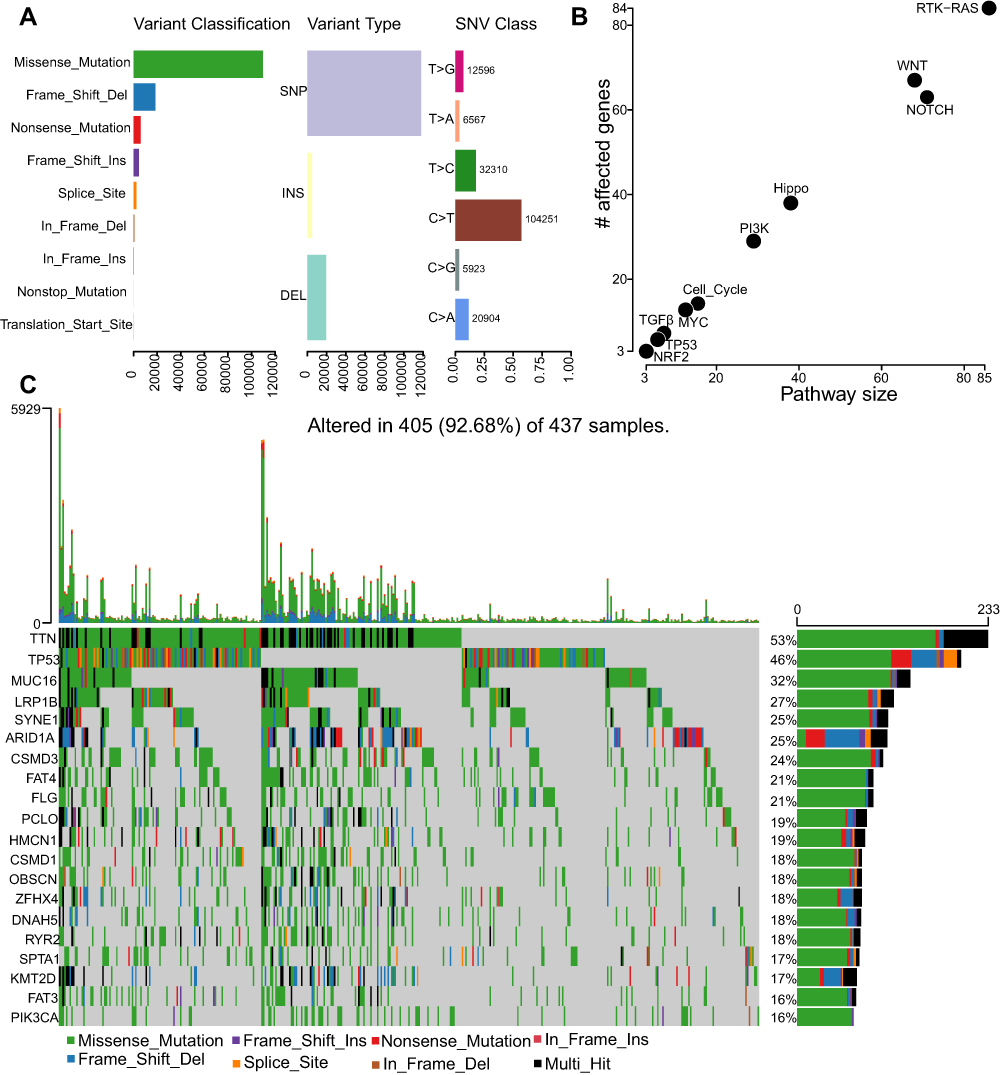 |
Figure 1 The somatic mutation landscape in STAD. (A) Bar plot of the distribution of mutation spectra in STAD. The distribution of Variant classifications, Variant types, and SNVs and their Variant numbers in STAD. (B) Dot plot of the pathway enrichment analysis of the mutated genes. (C) Oncoplot displaying the somatic mutation landscape of STAD cohort. Genes are ordered by their mutation frequency. |
Expression Profiles of mRNA, miRNA, and lncRNA in STAD
To get the expression profiles of mRNA, miRNA, and lncRNA and identify functional RNAs of STAD, we analyzed the RNA-seq and clinical data of STAD from TCGA database. We found 2127 mRNAs (935 up-regulated and 1192 down-regulated), 129 miRNAs (70 up-regulated and 59 down-regulated) and 170 lncRNAs (119 up-regulated and 51 down-regulated) (P-value≤0.01, |log2Fold change|≥1) (Figure 2 and Table S1). These differentially expressed mRNAs, miRNAs, and lncRNAs may take an important role in the occurrence and development of STAD.
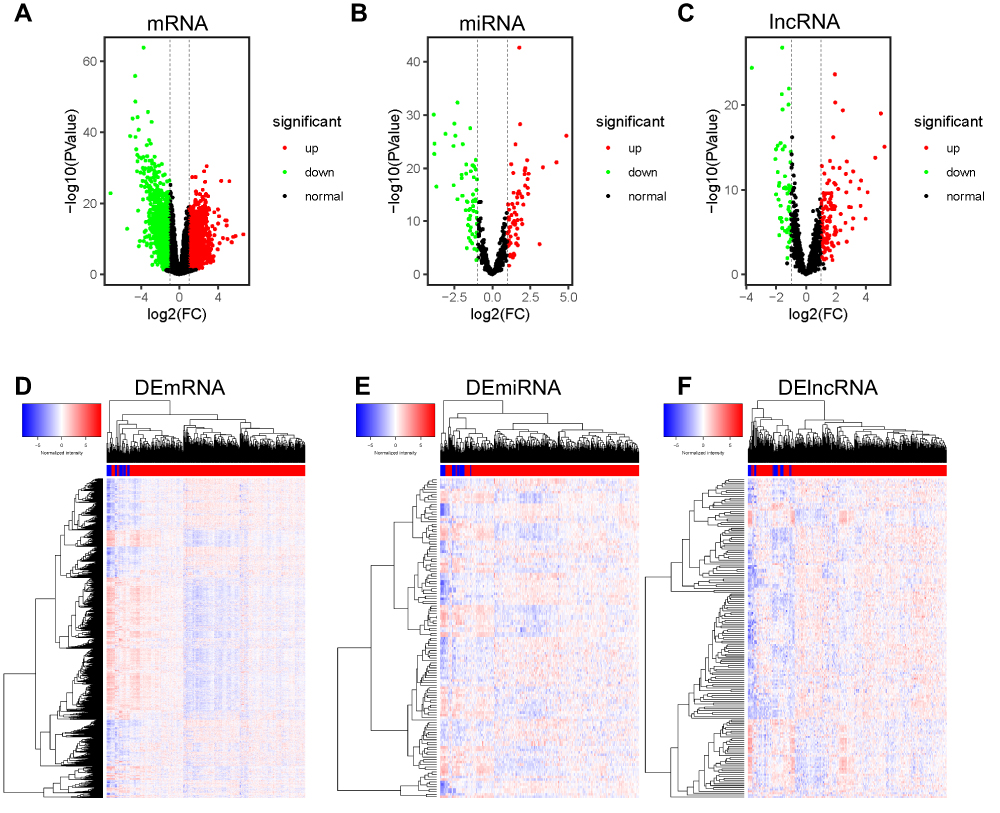 |
Figure 2 Expression profiles of mRNA, miRNA, and lncRNA in STAD. (A–C) Volcano plot of expression profiles of mRNA, miRNA, and lncRNA. The red dot represents up-regulated RNAs, the green dot represents down-regulated RNAs, and the black dot represents normal RNAs. (D–F) Heatmap of differentially expressed RNAs (DERNAs). The DERNAs are selected with thresholds of P-value≤0.01 and |log2Fold change|≥1. |
Functional Enrichment Analysis of the Differentially Expressed mRNAs
To illustrate the key signaling pathways and molecular working mechanisms in the occurrence and development of STAD, we did the GO, KEGG, and PPI bioinformatic analysis. Comparative GO analysis of the misregulated mRNAs indicated that up-regulated GO terms mainly included nuclear division, organelle fission, and chromosome segregation and down-regulated GO terms were mainly enriched in muscle function and modulation of chemical synaptic transmission (Figure 3A). Further functional enrichment analysis of the misregulated mRNAs by KEGG revealed that the primary activated signaling pathways in STAD included cell cycle, cellular senescence, and p53 signaling pathway and the inhibited signaling pathways mainly included oxytocin, calcium, and MAPK signaling pathway (Figure 3B). We wanted to find the hub mRNAs in the specific signaling pathway, so we did Protein–Protein Interaction (PPI) analysis of the misregulated mRNAs enriched in the cell cycle and p53 signaling pathways. CDK1 were located in the center of the PPI networks and may be the hub mRNA (Figure 3C and D). These methods will help us further discover the key mRNAs and abnormal signaling pathways in the progression of STAD.
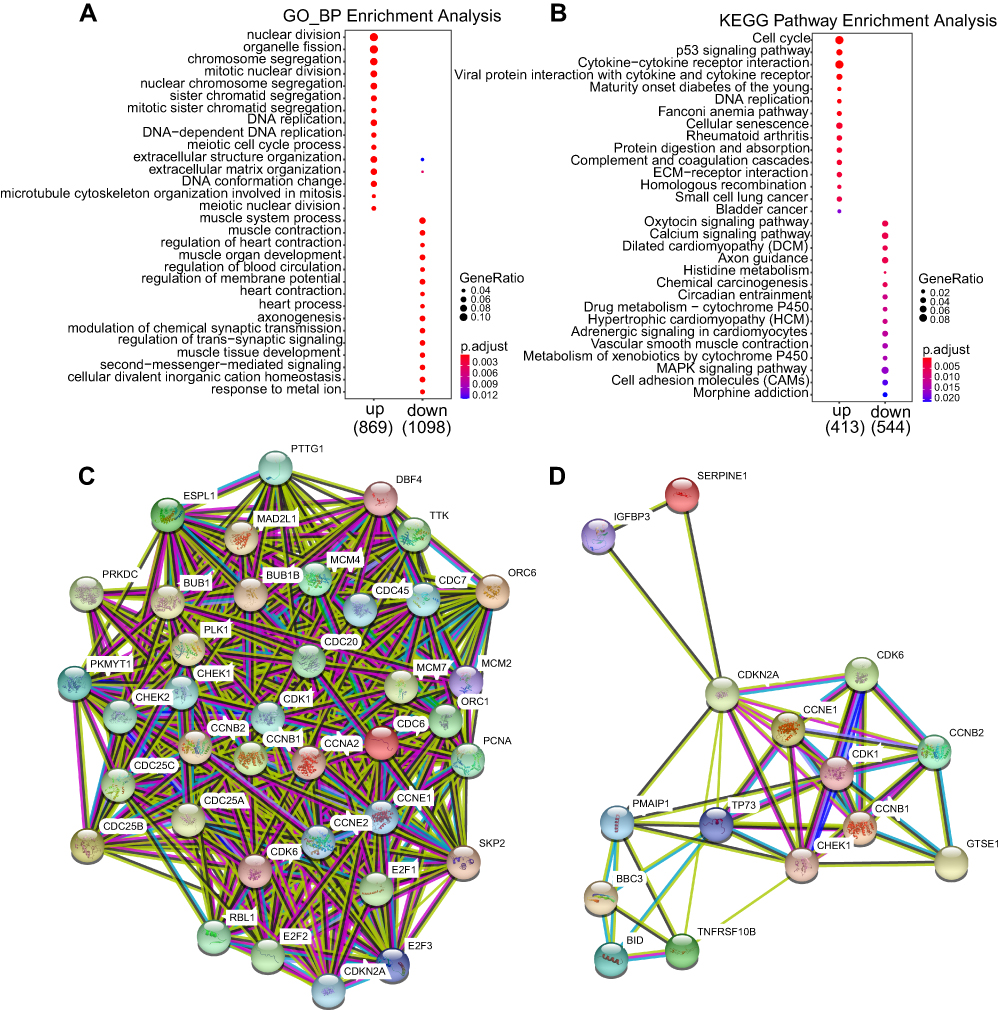 |
Figure 3 Functional enrichment analysis of misregulated mRNAs. (A) Bar plot of GO analysis of misregulated mRNAs. (B) Dot plot of KEGG analysis of misregulated mRNAs. (C, D) PPI network analysis of misregulated mRNAs enriched in (C) cell cycle, (D) p53 signaling pathway. |
Identification of ceRNA Network in STAD
By using GDCRNATools, we built the ceRNA network on the basis of the mRNA, miRNA, and lncRNA expression profiles in STAD. It is well known that lncRNAs and mRNAs have co-expression patterns in ceRNA networks. LncRNA-miRNA interaction and miRNA-mRNA interaction were collected from the starBase database. By calculating the hypergeometric probability, Pearson’s correlation and overall regulation similarity, 45 mRNA nodes, 21 miRNA nodes, four lncRNA nodes, and 130 edges were identified from differential expression profiles (Figure 4). We got four ceRNA lncRNAs (PVT1, MAGI2-AS3, MIR17HG, KCNQ1OT1) and the ceRNA network may help us further understand their complicated working mechanisms in the progression of STAD.
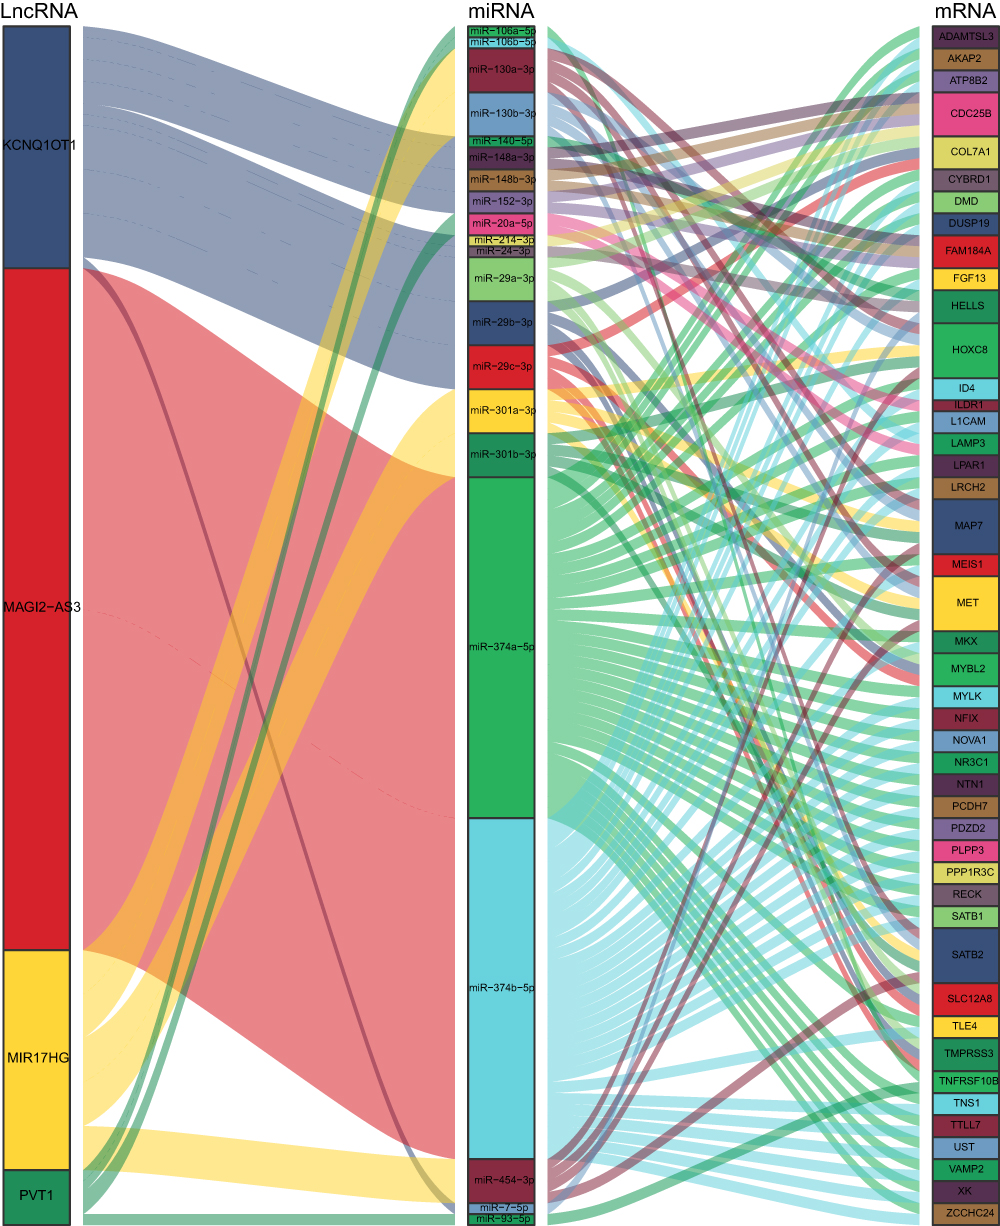 |
Figure 4 The regulatory network of four lncRNA ceRNAs. Sankey plot of the lncRNA ceRNA network, each rectangle represents a gene, and the connection degree of each gene is visualized based on the size of the rectangle. |
The Prognostic Value of DEmRNAs, DEmiRNAs, and DElncRNAs in STAD
To identify the key RNAs that were related to the overall survival of STAD patients, we did the Kaplan Meier (KM) survival analysis of the differentially expressed mRNAs, miRNAs, and lncRNAs. We got 32 mRNAs, and two lncRNAs that were significantly related with the overall survival of STAD patients. We further validated the expression levels and prognostic value of these candidate mRNAs and lncRNAs by starBase database. Twenty-seven out of 32 mRNAs and both lncRNAs were validated of their differential expression levels and significant prognostic value. Among the 29 RNAs, mRNAs (PDE4C, ID1, AQP3) and lncRNA MIR4458HG were down-regulated and positively related with the overall survival, and mRNAs (VCAN, FAP, NOX4, ANGPT2, SERPINE1, SPARC, PDGFRB, FN1, MFAP2, CSMD2, INHBA, COL10A1, MATN3, P4HA3, ADAMTS12, DGKI, OLFML2B, TMEM200A, FNDC1, CTHRC1, CHST1, F5, COL5A2, TUBB3), and LINC01235 were up-regulated and negatively related with the overall survival (Figure 5). The consistency of our analyzed results with the starBase database results demonstrated the correctness of our analysis procedure and the clinical significance of these validated mRNAs and lncRNAs. The up-regulated and overall survival negatively related RNAs may play an oncogenic role and the down-regulated and overall survival positively related RNAs may act as tumor suppressors. Further, these mRNAs and lncRNAs may work as potentially prognostic markers.
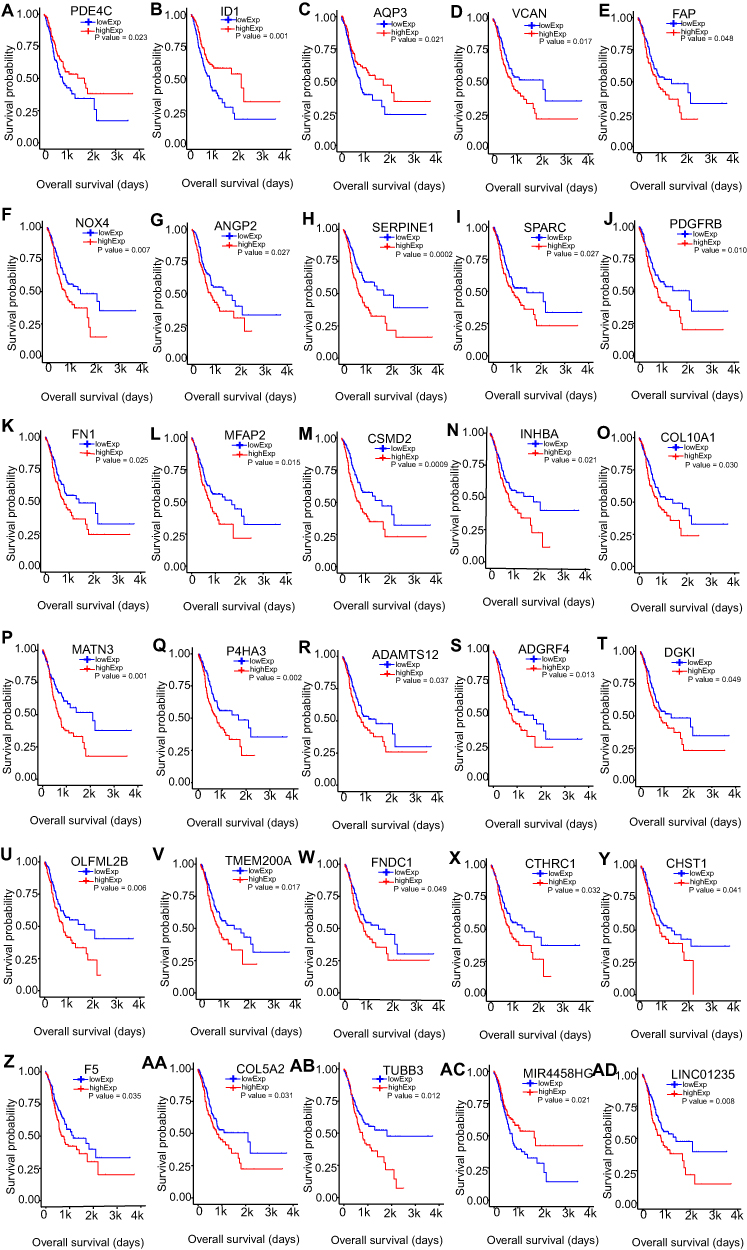 |
Figure 5 Overall survival analysis of misregulated mRNAs and lncRNAs in STAD (A–AD). Kaplan–Meier survival curve for the correlation of misregulated mRNAs and lncRNAs with overall survival of STAD patients. The red curve represents the high-expressed group, the blue curve represents the low-expressed group, and they are separated by the median. |
Potential Function of Candidate lncRNAs
Using Pearson’s correlation analysis of the relationship between differential expression lncRNAs and mRNAs, we identified tens of significantly correlated mRNAs of the candidate lncRNAs MIR4458HG and LINC01235 (Figure 6A and B, Table S2). For example, MIR4458HG was positively correlated with antitumor gene Cyclin-dependent kinase inhibitor 1C (CDKN1C) and LINC01235 were positively correlated with oncogenes NOTCH3. These analyses may demonstrate the important function of the two candidate lncRNAs and give us a clue to study their working mechanism.
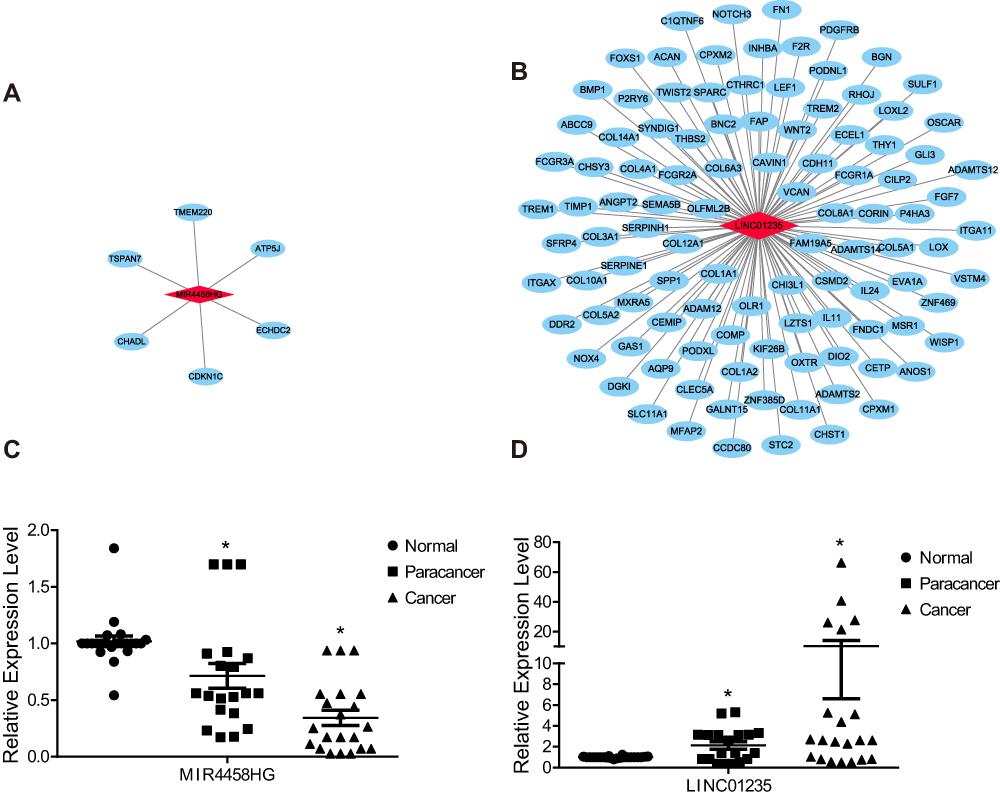 |
Figure 6 The potential function of the two candidate lncRNAs. (A, B) The network of the two candidate lncRNAs with misregulated mRNAs; LncRNA, light red diamond; mRNA, light blue ellipse. (C, D) Bar plot of the relative expression levels of the two candidate lncRNAs in collected STAD samples, and P-value≤0.05 is regarded as significant. |
Validation of the Expression Levels of the Two Candidate lncRNAs
We performed RT-qPCR experiment to validate the expression levels of the two candidate lncRNAs that showed clinical significance using the collected STAD samples. We found that MIR4458HG was low expressed in para-cancer and cancer samples when compared with the normal samples, and also low expressed in cancer samples when compared with para-cancer samples (Figure 6C). Besides, LINC01235 was high expressed in para-cancer and cancer samples when compared with the normal samples, and also high expressed in cancer samples when compared with para-cancer samples (Figure 6D). The expression levels of the two candidate lncRNAs were significantly correlated with the pathological state (normal, para-cancer, and cancer), and they may be meaningful indicators for the progression of STAD.
Discussion
In this study, we utilized the somatic variants, RNA-seq, miRNA-seq, and clinical data of STAD from TCGA database and analyzed the mRNA, miRNA, and lncRNA expression profiles. We found that the Missense Mutation ranked the maximum Variant numbers (>1×10⁵), the C>T transition accounted for the most single nucleotide variant (SNV) Classes (>50%), and top 20 high-mutation frequency genes (such as TP53, 46%). Previous studies also have demonstrated that TP53 mutations were independent markers of bad prognosis in many cancer types, including stomach cancer.15 We further identified 2127 DEmRNAs, 129 DEmiRNAs, and 170 DElncRNAs. Among these DEmRNAs, growth arrest-specific gene 1 (GAS1) was down-regulated and reported to suppress stomach cancer growth via modulating the Bcl-2/Bax ratio and the activity of caspase-3.16 The up-regulated transcription factor SOX4 was proved to be an unfavorable prognostic factor for stomach cancer.17 Among these DEmiRNAs, miR-30a was down-regulated and demonstrated to inhibit stomach cancer invasion, metastasis, and drug resistance by inhibiting the EMT.18 Among these DElncRNAs, up-regulated HOTTIP was proved as an oncogene in several types of cancers including stomach cancer.19 The previous studies have demonstrated the important function of several selected RNAs, and these differentially expressed mRNAs, miRNAs, and lncRNAs may act as potential targets or markers of STAD. Besides, the GO and KEGG enrichment analysis of misregulated mRNAs revealed that the main abnormal signaling pathway in STAD included cell cycle, p53, and cellular senescence. And further PPI network analysis of mRNAs enriched in a specific signaling pathway may demonstrate CDK1 as the hub gene in STAD.
One of the lncRNA working mechanisms was acting as ceRNA by competitively binding miRNAs. By lncRNA-mRNA coexpression analysis, lncRNA-miRNA and miRNA-mRNA interaction analysis, we identified four lncRNAs (PVT1, MAGI2-AS3, MIR17HG, KCNQ1OT1) that may work as ceRNAs in STAD. In previous studies, PVT1 and MAGI2-AS3 were proved as oncogenes in stomach cancer and MIR17HG was demonstrated as an anticancer gene.20,22 MAGI2-AS3 was down-regulated and may act as a miRNA sponge of miR-374a-5p and miR-374b-5p in STAD. Previous studies also demonstrated the ceRNA characteristic of MAGI2-AS3, and it could suppress the development of breast cancer and hepatocellular cancer by targeting the miR-374a-5p or miR-374b-5p.23,24 The lncRNA ceRNA network analysis could give us clues to identify functional lncRNAs and study their complicated working mechanisms in STAD.
By differential analysis and KM survival analysis of mRNAs, miRNAs, and lncRNAs, we got 29 candidate RNA prognostic markers of STAD, and furthermore, their prognostic values were validated by the starBase database. Among the 29 RNAs, mRNAs (PDE4C, ID1, AQP3) and lncRNA MIR4458HG were down-regulated and positively related with the overall survival, and mRNAs (VCAN, FAP, NOX4, ANGPT2, SERPINE1, SPARC, PDGFRB, FN1, MFAP2, CSMD2, INHBA, COL10A1, MATN3, P4HA3, ADAMTS12, DGKI, OLFML2B, TMEM200A, FNDC1, CTHRC1, CHST1, F5, COL5A2, TUBB3) and LINC01235 were related with unfavorable overall survival. In previous studies, ID1, AQP3, FAP, NOX4, ANGPT2, SERPINE1, SPARC, PDGFRB, FN1, INHBA, COL10A1, MATN3, P4HA3, OLFML2B, TMEM200A, FNDC1, and CTHRC1 have demonstrated their oncogene features. For example, COL10A1 was induced by TGF-β1-SOX9 axis and promoted invasion and metastasis in stomach cancer via epithelial-to-mesenchymal transition.25 The rest genes were also important enzymes or cellular components by searching their symbol in UniPro and GeneCard website. All these mRNAs and lncRNAs may serve as potential prognostic markers of STAD.
Conclusions
Our work presented the mutation landscapes and identified top 20 high-mutation frequency genes that may be susceptibile genes in STAD. We further identified hundreds of differentially expressed mRNAs, miRNAs, and lncRNAs, illustrated abnormal signaling pathways, and selected the hub genes (CDK1) by PPI analysis of p53 and cell cycle signaling pathway. Besides, we found four lncRNA ceRNAs on the basis of the mRNA, miRNA, and lncRNA expression profiles in STAD. What’s more, we got 27 mRNAs and two lncRNAs that showed a significant prognostic value and their prognostic values were validated by the starBase database. We validated the clinical significance of MIR4458HG and LINC01235 in collected STAD samples, and they may be meaningful indicators for the progression of STAD.
Abbreviations
STAD, stomach adenocarcinoma; TCGA, The Cancer Genome Atlas; LncRNAs, long-noncoding RNAs; ceRNA, competing endogenous RNA; DERNA, differentially expressed RNA.
Data Sharing Statement
The data used to support the findings of this study are included within the article.
Disclosure
The authors report no conflicts of interest in this work.
References
1. Bray F, Ferlay J, Soerjomataram I, et al. Global cancer statistics 2018: GLOBOCAN estimates of incidence and mortality worldwide for 36 cancers in 185 countries. CA Cancer J Clin. 2018;68(6):394–424. doi:10.3322/caac.21492
2. Garzon R, Calin GA, Croce CM. MicroRNAs in Cancer. Annu Rev Med. 2009;60(1):167–179. doi:10.1146/annurev.med.59.053006.104707
3. Prensner JR, Chinnaiyan AM. The emergence of lncRNAs in cancer biology. Cancer Discov. 2011;1(5):391–407. doi:10.1158/2159-8290
4. Zhang X, Gao S, Li Z, et al. Identification and analysis of estrogen receptor α promoting tamoxifen resistance-related lncRNAs. Biomed Res Int. 2020;2020:1–10. doi:10.1155/2020/9031723
5. Hu W, Alvarez-Dominguez JR, Lodish HF. Regulation of mammalian cell differentiation by long non-coding RNAs. EMBO Rep. 2012;13(11):971–983. doi:10.1038/embor.2012.145
6. Zhang Y, Xu Y, Feng L, et al. Comprehensive characterization of lncRNA-mRNA related ceRNA network across 12 major cancers. Oncotarget. 2016;7(39):64148–64167. doi:10.18632/oncotarget.11637
7. Li JH, Liu S, Zhou H, et al. starBase v2.0: decoding miRNA-ceRNA, miRNA-ncRNA and protein-RNA interaction networks from large-scale CLIP-Seq data. Nucleic Acids Res. 2014;42(D1):D92–D97. doi:10.1093/nar/gkt1248
8. Mayakonda A, Lin DC, Assenov Y, et al. Maftools: efficient and comprehensive analysis of somatic variants in cancer. Genome Res. 2018;28(11):1747–1756. doi:10.1101/gr.239244.118
9. Sanchez-Vega F, Mina M, Armenia J, et al. Oncogenic signaling pathways in the cancer genome atlas. Cell. 2018;173(2):321–337. doi:10.1016/j.cell.2018.03.035
10. Ritchie ME, Phipson B, Wu D, et al. limma powers differential expression analyses for RNA-sequencing and microarray studies. Nucleic Acids Res. 2015;43(7):1–13. doi:10.1093/nar/gkv007
11. Wickham H. ggplot2. Wiley Interdiscip Rev Comput Stat. 2011;3(2):180–185. doi:10.1002/wics.147
12. Yu G, Wang LG, Han Y, et al. clusterProfiler: an R package for comparing biological themes among gene clusters. OMICS. 2012;16(5):284–287. doi:10.1089/omi.2011.0118
13. Shannon P, Markiel A, Ozier O, et al. Cytoscape: a software environment for integrated models of biomolecular interaction networks. Genome Res. 2003;13(11):2498–2504. doi:10.1101/gr.1239303
14. Lee SR, Roh YG, Kim SK, et al. Activation of EZH2 and SUZ12 regulated by E2F1 predicts the disease progression and aggressive characteristics of bladder cancer. Clin Cancer Res. 2015;21(23):5391–5403. doi:10.1158/1078-0432.CCR-14-2680
15. Petitjean A, Achatz MI, Borresen-Dale AL, et al. TP53 mutations in human cancers: functional selection and impact on cancer prognosis and outcomes. Oncogene. 2007;26(15):2157–2165. doi:10.1038/sj.onc.1210302
16. Wang H, Zhou X, Zhang Y, et al. Growth arrest-specific gene 1 is downregulated and inhibits tumor growth in gastric cancer. FEBS J. 2012;279(19):3652–3664. doi:10.1111/j.1742-4658.2012.08726.x
17. Chen J, Ju HL, Yuan XY, et al. SOX4 is a potential prognostic factor in human cancers: a systematic review and meta-analysis. Clin Transl Oncol. 2016;18(1):65–72. doi:10.1007/s12094-015-1337-4
18. Wang LL, Zhang XH, Zhang X, et al. MiR-30a increases cisplatin sensitivity of gastric cancer cells through suppressing epithelial-to-mesenchymal transition (EMT). Eur Rev Med Pharmacol Sci. 2016;20(9):1733–1739.
19. Chang S, Liu J, Guo S, et al. HOTTIP and HOXA13 are oncogenes associated with gastric cancer progression. Oncol Rep. 2016;35(6):3577–3585. doi:10.3892/or.2016.4743
20. Zhao J, Du P, Cui P, et al. LncRNA PVT1 promotes angiogenesis via activating the STAT3/VEGFA axis in gastric cancer. Oncogene. 2018;37(30):4094–4109. doi:10.1038/s41388-018-0250-z
21. Chen L, Yao H, Wang K, et al. Long non-coding RNA MALAT1 regulates ZEB1 expression by sponging miR-143-3p and promotes hepatocellular carcinoma progression. J Cell Biochem. 2017;118(12):4836–4843. doi:10.1002/jcb.26158
22. Bahari F, Emadi-Baygi M, Nikpour P. miR-17-92 host gene, underexpressed in gastric cancer and its expression was negatively correlated with the metastasis. Indian J Cancer. 2015;52(1):22–25. doi:10.4103/0019-509X.175605
23. Du S, Hu W, Zhao Y, et al. Long non-coding RNA MAGI2-AS3 inhibits breast cancer cell migration and invasion via sponging microRNA-374a. Cancer Biomark. 2019;24(3):269–277. doi:10.3233/CBM-182216
24. Yin Z, Ma T, Yan J, et al. LncRNA MAGI2-AS3 inhibits hepatocellular carcinoma cell proliferation and migration by targeting the miR-374b-5p/SMG1 signaling pathway. J Cell Physiol. 2019;234(10):18825–18836. doi:10.1002/jcp.28521
25. Li T, Huang H, Shi G, et al. TGF-β1-SOX9 axis-inducible COL10A1 promotes invasion and metastasis in gastric cancer via epithelial-to-mesenchymal transition. Cell Death Dis. 2018;9(9):849–866. doi:10.1038/s41419-018-0877-2
 © 2020 The Author(s). This work is published and licensed by Dove Medical Press Limited. The full terms of this license are available at https://www.dovepress.com/terms.php and incorporate the Creative Commons Attribution - Non Commercial (unported, v3.0) License.
By accessing the work you hereby accept the Terms. Non-commercial uses of the work are permitted without any further permission from Dove Medical Press Limited, provided the work is properly attributed. For permission for commercial use of this work, please see paragraphs 4.2 and 5 of our Terms.
© 2020 The Author(s). This work is published and licensed by Dove Medical Press Limited. The full terms of this license are available at https://www.dovepress.com/terms.php and incorporate the Creative Commons Attribution - Non Commercial (unported, v3.0) License.
By accessing the work you hereby accept the Terms. Non-commercial uses of the work are permitted without any further permission from Dove Medical Press Limited, provided the work is properly attributed. For permission for commercial use of this work, please see paragraphs 4.2 and 5 of our Terms.