")
Back to Journals » Nature and Science of Sleep » Volume 13
The Role of the Thalamus in the Neurological Mechanism of Subjective Sleepiness: An fMRI Study
Authors Motomura Y, Kitamura S , Nakazaki K, Oba K , Katsunuma R , Terasawa Y, Hida A, Moriguchi Y, Mishima K
Received 16 December 2020
Accepted for publication 26 March 2021
Published 28 June 2021 Volume 2021:13 Pages 899—921
DOI https://doi.org/10.2147/NSS.S297309
Checked for plagiarism Yes
Review by Single anonymous peer review
Peer reviewer comments 2
Editor who approved publication: Dr Sarah L Appleton
Yuki Motomura,1– 3 Shingo Kitamura,1 Kyoko Nakazaki,1 Kentaro Oba,1,4 Ruri Katsunuma,1,3 Yuri Terasawa,1,5 Akiko Hida,1 Yoshiya Moriguchi,1,3 Kazuo Mishima1,6,7
1Department of Sleep-Wake Disorders, National Institute of Mental Health, National Center of Neurology and Psychiatry, Tokyo, 187-8553, Japan; 2Faculty of Design, Kyushu University, Fukuoka, 815-8540, Japan; 3Integrative Brain Imaging Center, National Center of Neurology and Psychiatry, Tokyo, 187-8553, Japan; 4Department of Human Brain Science, Institute of Development, Aging and Cancer, Tohoku University, Sendai, 980-8575, Japan; 5Department of Psychology, Keio University, Kanagawa, 223-8521, Japan; 6Department of Neuropsychiatry, Akita University Graduate School of Medicine, Akita, 010-8543, Japan; 7International Institute for Integrative Sleep Medicine, University of Tsukuba, Ibaraki, Japan
Correspondence: Kazuo Mishima
Department of Neuropsychiatry, Akita University Graduate School of Medicine, 1-1-1 Hondo, Akita, 010-8543, Japan
Tel +81 18 884 6122
Fax +81 18 884 6445
Email [email protected]
Yuki Motomura
Faculty of Design, Kyushu University, 4-9-1 Shiobaru, Minami-ku, Fukuoka, 815-8540, Japan
Tel +81 92 533 9493
Email [email protected]
Purpose: The thalamus, the region that forms the attentional network and transmits external sensory signals to the entire brain, is important for sleepiness. Herein, we examined the relationship between activity in the thalamus-seed brain network and subjective sleepiness.
Materials and Methods: Fifteen healthy male participants underwent an experiment comprising a baseline evaluation and two successive interventions, a 9-day sleep extension followed by 1-night total sleep deprivation. Pre- and post-intervention tests included the Karolinska sleepiness scale and neuroimaging for arterial spin labeling and functional connectivity. We examined the association between subjective sleepiness and the functional magnetic resonance imaging indices.
Results: The functional connectivity between the left or right thalamus and various brain regions displayed a significant negative association with subjective sleepiness, and the functional connectivity between the left and right thalamus displayed a significant positive association with subjective sleepiness. The graph theory analysis indicated that the number of positive functional connectivity related to the thalamus showed a strong negative association with subjective sleepiness, and conversely, the number of negative functional connectivity showed a positive association with subjective sleepiness. Arterial spin labeling analysis indicated that the blood flow in both the left and right thalami was significantly negatively associated with subjective sleepiness. Functional connectivity between the anterior cingulate cortex and salience network areas of the left insular cortex, and that between the anterior and posterior cingulate cortices showed a strong positive and negative association with subjective sleepiness, respectively.
Conclusion: Subjective sleepiness and the thalamic-cortical network dynamics are strongly related, indicating the application of graph theory to study sleepiness and consciousness. These results also demonstrate that resting functional connectivity largely reflects the “state” of the subject, suggesting that the control of sleep and conscious states is essential when using functional magnetic resonance imaging indices as biomarkers.
Keywords: sleep, subjective sleepiness, consciousness, functional connectivity, graph theory, rCBF, ASL
Introduction
Modern society is full of disruptive factors for sleep and biological rhythms including shift work, long flights, night-owl lifestyles, prolonged worktime, and psychosocial stress. Many people in modern societies suffer from sleep problems.1–6
Sleep duration is associated with various health indicators such as obesity,7 depression,8 cardiovascular disease,9,10 and mortality.11,12 The recommended average sleep duration for adults is 7–8 h of sleep; any deviation from this duration—either shorter or longer—could increase health risks. It should be noted that 7–8 h of sleep is the recommended sleep duration only for healthy adults; this duration refers to an average value and might not be true for each individual. Moreover, the recommended sleep duration is subject to change based on other factors such as individual differences, age, and the presence of disorders. Unfortunately, ≥30% of the population in developed countries sleeps <6 h.4,8,13
Excessive sleepiness, caused by sleep deprivation and the disturbance of biological rhythms, negatively affects almost all mental functions including cognitive functions, such as working memory and sustained attention. A previous systematic review14 and meta-analysis15 have reported the following functional changes caused by sleep deprivation: increased microsleep, increased errors in attention tasks, decreased psychomotor function, decreased learning ability, and difficulty concentrating for extended periods.
Previous research using functional magnetic resonance imaging (fMRI) has indicated that the performance deterioration induced by sleep loss is accompanied by activity changes in the corresponding brain areas. Activity changes in the attention network16 comprising the thalamus (alertness-related functions), parietal cortex (direction of attention), and frontal cortex (executive functions) have also been documented.17–20
Using fMRI, Dinges & Powell21 demonstrated that the activity of the frontal-parietal region declined during lapses in psychomotor vigilance. Alternatively, a compensatory increase in the activity in the parietal area occurred in participants resistant to sleep deprivation.18 Additionally, reduced attention function appears to mediate the decline in working memory.17,19
Even during sleep deprivation, sleepiness varies greatly over time, as it is influenced by the circadian rhythm and sleep homeostasis. Furthermore, there are significant differences among individuals. Sleepiness measured at a specific time may correlate with brain states better than the experimental sleep conditions, such as sleep duration the previous day,22 possibly due to biological clock processes and inter-individual differences in vulnerability to sleep deprivation.23 Currently, both subjective and objective methods exist to evaluate sleep-loss related sleepiness. Self-reported subjective sleepiness is easily affected by environmental factor24 and often regarded as unreliable; however, it is a sensitive and useful method when the environmental factors are well-controlled. Objective indicators include methods such as electroencephalography (EEG) measurements, multiple sleep latency tests,25 and psychomotor vigilance tasks.21 Although subjective and objective sleepiness are often closely related, each has its own unique elements; many studies have shown that objective and subjective sleepiness assessments are not necessarily consistent.26–29 An objective sleepiness indicator may not necessarily reflect the clarity of qualia of consciousness. For example, 42% of participants answered that they had been awake during sleep stage 1 on polysomnography.30 Subjective sleepiness is an important indicator that directly reflects the clarity of qualia in a manner accessible to only the individual. However, few studies22,31 have examined the relationship between subjective sleepiness and concurrent brain activity, and the brain state associated with the expression of subjective sleepiness has not yet been identified.
The thalamus, the region that forms the attentional network16 and transmits external sensory signals to the entire brain, is an important brain area for the neurological basis of sleepiness. The thalamus is important for maintaining various cognitive functions and consciousness levels, forming a thalamus-cortices-thalamus neural circuit called the corticothalamic system.20,32,33 Decreased functional connectivity between the thalamus and cortices is associated with decreased attention function20 as has been observed in situations where the level of consciousness is reduced, such as during non-rapid eye movement (NREM) sleep34 and total sleep deprivation.32 Chang et al35 evaluated the resting-state functional connectivity using EEG-fMRI and discovered that thalamic activity correlated with alpha wave activities, which is a representative index of alertness in EEG. These results suggest a functional link between reduced external attention (alertness) and thalamic activity.
Herein, we conducted a study consisting of sleep extension with extended bedtime for 12 h followed by total sleep deprivation (TSD) in young adults with normal sleep habits. Measurements of subjective sleepiness and simultaneous neuroimaging methods during the resting state that are appropriate for repeated measures (arterial spin labeling, functional connectivity analysis, and graphs using resting fMRI) were performed in each sleep condition to examine the relationship between the activity in the thalamus-seed brain network and subjective sleepiness index.
Materials and Methods
Ethics
All subjects provided written informed consent, and the study was conducted in accordance with the Declaration of Helsinki. The protocol was approved by the Ethics Committee of the National Center of Neurology and Psychiatry (approval number: A2011-071).
Participants
Prior to participation, 16 healthy right-handed adult men aged 23.4 ± 2.4 (mean ± SD) years underwent overnight polysomnography, structural MRI, and hematological examination and completed questionnaire surveys and a medical interview with a physician to assess their overall health.
The exclusion criteria were as follows: sleep disorder, mental disorder, visual impairment including color blindness, or severe physical complication; current use of medication or substances that might affect the study outcome (eg, sleep aids, antihistamines, other sleep-inducing drugs, and steroids); metallic implants such as a pacemaker; travel to a foreign country with a ≥6-h time difference within the last 3 months; shift work; and smoking. These participants were originally recruited in a study on individual potential sleep debt36 and mood regulation,37 and had completed the same interventional protocol. In the current study, however, we focused on completely different aspects of the data. Specifically, brain dynamics in various sleepiness states were examined following sleep extension and TSD experiments, which were employed to create variation in sleepiness. The analyses reported here do not overlap with those published previously.
Experimental Design
The experimental protocol used is shown in Figure 1. After a habitual sleep (HS) monitoring period at home (HS period, 2 weeks), the study period consisted of four sessions: a 2-day baseline (BL) period, 9-day extended sleep (ES) period, one TSD night, and one recovery sleep (RS) night. On day 1 of the BL period (BL1), on days 4 and 9 of the ES period (ES4 and ES9), and after the TSD, subjective sleepiness was evaluated, and MRI measurements were performed.
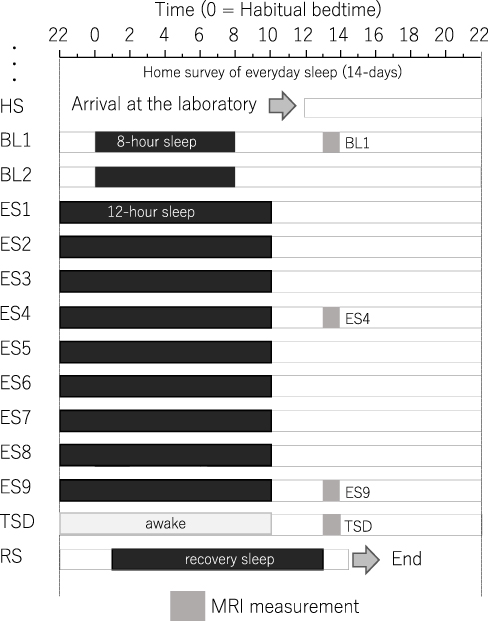 |
Figure 1 Experimental protocol. Participants were enrolled in a 14-day and 13-night study, with 8 h of sleep per day during the first two days, 12 h of sleep per day for the next nine days, a night of total sleep deprivation, and a night of recovery sleep. MRI was performed 9 h after the midpoint of sleep on day 1 (BL1), sleep on day 6 (ES4), sleep on day 11 (ES9), and the TSD period on day 12. Participants underwent overnight polysomnography measurements throughout the study period. Black bars, sleep time. Abbreviations: HS, habitual sleep at home; BL1, baseline day 1; ES4, extended sleep day 4; ES9, extended sleep day 9; TSD, total sleep deprivation; RS, recovery sleep. |
The participants recorded the bedtime and wake-up time during the HS period. Using the algorithms developed by Sadeh et al,38 HS duration was calculated from data obtained via a wrist actigraph (Micro-Mini Motionlogger Actigraph, Ambulatory Monitoring, Inc.) worn on the non-dominant hand.
The experiment was conducted in the sleep laboratory at the National Center of Neurology and Psychiatry. This facility includes six isolation units for sleep and a shared living room with electromagnetic shielding for electroencephalography and a homeostatic environment of stable illumination, humidity, and temperature.
Following the HS period, the participants were moved to the sleep laboratory and monitored for 14 days. The schedule for each participant was established based on the at-home records. The average bedtime calculated for each participant was set as 0 h. In the BL period, an 8-h time in bed (lights off) began at the mean bedtime observed in the HS period. In the 9-day ES period, the bedtime and wake-up time were advanced and delayed, respectively, by 2 h each to make the total time in bed correspond to 12-h. At the wake-up time on ES9, TSD began and lasted for 39 h. The participants then experienced RS for 12 h starting 1 h following their habitual bedtime.
During the scheduled wake period, the participants stayed in a living room (approximately 100 lx, 8.7 m × 7.8 m) inside the isolation unit and were allowed to read, write, enjoy music and videos, play videogames, and engage in conversation with the attendant staff. If a participant was at risk of falling asleep, they were verbally awakened by the attendant staff. During the scheduled sleep period, the participants were instructed to sleep in a sleeping room next to the living room with the lights off (approximately 0 lx) and were prohibited from getting out of bed except for going to the lavatory. The room temperature was changed to 23 °C during the experimental time-in-bed. The participants were provided three meals per day, and the amounts were controlled depending on their body mass index, whereas unplanned meals and drinks were prohibited. Caffeine and alcohol were not included in the planned meals. Apart from the planned meals, the participants were only allowed to drink water, which was allowed at any time. The ambient temperature and relative humidity in the laboratory were maintained at 25 ± 0.5°C and 50 ± 5%, respectively.
The participants underwent other fMRI measurements between 18:00 and 20:00 on the 1st, 12th, and 13th days. Additionally, the maintenance of wakefulness test39 was performed every day at 19:00, and the respiratory metabolism and blood sampling were carried out immediately upon waking up. These data have been reported in previous articles.36,37,40
fMRI and Subjective Sleepiness Measurements
Within the experimental protocol described above, the fMRI measurement was performed 9 h after the sleep midpoint on night 1 (BL), night 6 (ES4), night 11 (ES9), and night 12 (TSD): BL - 5 h after waking up, SE - 3 h after waking up, and TSD - 27 h after waking up. The participants had an identical breakfast (approximately 350 kcal) 1 h before being going to the MRI room. The participants underwent examination via a questionnaire followed by an fMRI session with a 10-min cognitive task (not reported here), a 6-min resting fMRI, and a 4-min arterial spin labeling (ASL) imaging. Each image was taken at rest with open eyes, but the gaze point, which is often mentioned in previous studies, was not displayed. This decision was taken because direct exposure to a light source may have had a significant effect on arousal. The participants were then instructed to remain awake during imaging and keep their eyes open while looking directly upwards without moving their gaze excessively. After each scan, the Karolinska Sleepiness Scale (KSS)41 Japanese version42 was completed. On this scale, participants were asked to rate their current level of sleepiness on a scale from 1 (extremely alert) to 9 (very sleepy, great effort to keep awake, fighting sleep). The participants were asked verbally about sleepiness during imaging (measured by the KSS) immediately after the completion of the resting MRI and ASL imaging.
fMRI Acquisition
MRI was performed using the Magnetom Verio 3T MRI System (Siemens AG. München, Germany). To obtain reference images for analysis, T1-weighted magnetic resonance rapid gradient-echo (T1-weighted MPRAGE) imaging was performed using the following parameters: repetition time/time to echo (TR/TE) = 1900 ms/2.52 ms, voxel size = 1 mm × 1 mm × 1 mm, flip angle = 9°, and field of view = 256×192.
To obtain resting-state fMRI images, single-shot echo-planar imaging was performed using the following parameters: TR/TE = 2500 ms/25 ms, 30 axial slices, voxel size = 6 mm × 6 mm × 4 mm, 1 mm inter-slice gap, flip angle 90°, matrix size = 64 × 64, field of view = 384 mm × 384 mm. After excluding the first five scans from each session, data from 145 scans were used for analysis.
Resting-State fMRI
Analysis was performed using the CONN17 toolbox (Alfonso Nieto-Castanon http://www.alfnie.com/software/conn) for Statistical Parametric Mapping 12 (SPM12) analysis software (Wellcome Department of Imaging Neuroscience, University College, London, United Kingdom; http://www.fil.ion.ucl.ac.uk/spm/software/spm12/). Following the correction for body movement using realignment parameters during each scan, slice timing correction, ART-based outlier scrubbing (to eliminate the effect of a scan volume with large motion above the 95 percentile of all scans),43 and co-registration to MPRAGE images, Montreal Neurological Institute templates were used to perform spatial normalization and Gaussian smoothing using a kernel of 8-mm full-width at half-maximum on each fMRI image. To generate beta images, the general linear model was used to analyze and extract the voxels showing activities correlated with blood oxygenation level-dependent signals. A component-based noise correction method in which the five largest principal factors of the activity of the white matter and the cerebrospinal fluid were set as regressors (aCOMPCOR),44 and a bandpass filter for the 0.008–0.09 Hz range was adopted to remove the noise generated by body movements or physiological processes other than brain activities.
To test our hypothesis that the thalamus-centered neural network is associated with subjective sleepiness, we analyzed the left or right thalamus-seed functional connectivity for the entire brain. The brain was divided into 116 regions along the aal template (http://www.gin.cnrs.fr/en/tools/aal/), and the right and left thalami were set as seed regions to calculate the functional connectivity with the other 115 regions, excluding the seed.
Since the data in this study included multiple repeated measurements per participant (15 subjects x 4 conditions = 60 measurements), a multi-level analysis was performed using a linear mixed model (random intercept model) with subject factors entered as random effects. We used the lmer and lmerTest packages in R3.4.4 software and created a model to predict the values of functional connections assuming a random effect on each subject’s intercept, with the KSS scores as a fixed effect. The t and p values were calculated for the fixed effects of the KSS scores using the Satterthwaite’s method to approximate the degrees of freedom. For the validation of the analysis, we performed normality tests on the obtained residuals using the Shapiro–Wilk test; “model validation failed” was indicated in the results if they differed significantly from the normal distribution. When the variance estimate of the random intercept was almost zero, the t and p values in the linear model for fixed effects were calculated (default settings for the lmerTest function). The significance level was set at p < 0.05, and multiple comparison correction was performed by adjusting the false discovery rate (FDR) (Benjamini & Hochberg45 method). All subsequent statistical analyses were performed using R 3.4.0 and Microsoft Excel 2016.
Although this was not the main purpose of this study, an exploratory analysis was performed among all regions of interest (ROIs) (116 region × 115 region/2 = 6670 connections) for informational purposes. The significance level was set at p < 0.05, and multiple comparison correction was performed by FDR and Bonferroni correction.
Graph Theory Analysis
We performed a graph theory analysis as described previously,46 with the brain region as a node and functional connectivity as an edge with a focus on the number of regions that have a connection with the thalamus for the positive and negative functional connectivity.
As described above, the brain was divided into 116 regions along the aal template, and two networks were created, one connected by positive and another by negative functional connectivity as edges.
An adjacency matrix was created with each brain region as a node and significant connectivity as edges, with the edge generation threshold set at 0.1637 in the positive network (significance of correlation coefficient was p = 0.0498 at 145 points: the number of functional image volumes). Alternatively, in the negative network, the edge generation threshold was set at −0.1637.
We investigated the relationship between subjective sleepiness and “degree” in the thalamus (number of edges connected to nodes) because it is the most representative index in graph theory analysis, and is easier to interpret than other indicators. Since the degree is a discrete value that is assumed to follow a Poisson distribution, a multi-level analysis was performed using a generalized linear mixed model (random intercept model) with subject factors as random effects. Using the glmer packages in R3.4.4, we created a model to predict the values of functional connectivity assuming a random effect of each subject, with the KSS scores as a fixed effect. The Wald-Z statistics and p values were calculated for the fixed effects of KSS. The significant α level was set at p < 0.05, and multiple comparison correction was performed by adjusting for FDR.
ASL
We used ASL to measure the regional cerebral blood flow (rCBF), setting the left and right thalami as ROIs. It is thought that the resting rCBF could reflect regional neural activities and correlate with local oxygen consumption, glucose use, and aerobic glycolysis.47 Compared with the conventional blood oxygen level-dependent signals, the ASL method robustly resists low-frequency noise and enables the comparison of data from multiple time points because the method is a quantitative measurement of resting-state activity.48
We obtained ASL imaging on BL1, ES4, ES9, and TSD using a Magnetom Verio 3T MRI System (Siemens). Whole-brain perfusion imaging was performed using a pulsed ASL technique, called quantitative imaging of perfusion, using a single subtraction, second version with thin-slice TI1 periodic saturation (Q2TIPS). In ASL, the arterial blood is magnetically labeled by radiofrequency inversion pulses just below the intracranial area, including the carotid artery. By measuring the difference between the labeled and unlabeled control images, we assessed arterial blood perfusion that is not affected by other brain areas and calculated rCBF/100 g/min based on the perfusion value. We obtained 45 time-series whole-brain images that were already contrasted (labeled minus unlabeled). The imaging parameters were as follows: TR = 2.8 s, TE = 13 ms, bolus duration (TI1) = 0.7 s, inversion time (TI2) = 2.0 s, number of slices = 12, slice thickness = 8 mm, total labeled scan volume = 45, total unlabeled scan volume = 45, total scan time = 4 min 13 s, and units = mL/100 g/min.
Pre-processing and statistical analysis of the ASL data were performed using the ASLtbx tool49 for SPM12 analysis software (Wellcome Department of Imaging Neuroscience, University College, London, UK1). Following the correction for body movement and slice timing, co-registration to the reference MPRAGE image, and Gaussian smoothing using a kernel of 8 mm full-width at half-maximum, rCBF maps were generated by measuring the difference between the control and labeled images. Next, the Montreal Neurological Institute template was used to perform spatial normalization. The resulting 45 rCBF maps were averaged to create a mean rCBF map for each imaging analysis.
Using SPM12, the signal of local cerebral blood flow was converted to a ratio of the whole-brain signal, and the average signals of each left and right thalamus on AAL masks were extracted using the MarsBaR ROI toolbox for SPM12.
A multi-level analysis was performed using a linear mixed model (random intercept model) with subject factors entered as random effects as in the abovementioned functional connectivity analysis. After four ASL data points from ES4 were lost for technical reasons, 56 data points were included in the final ASL analysis. The significance level was set at p < 0.05, and multiple comparison correction was performed by adjusting for FDR.
Results
One of the 16 subjects dropped out of the study for personal reasons and was therefore excluded from the analysis; all analyses were performed using data from the remaining 15 subjects (aged 23.3 ± 2.1 years).
Behavioral Data
Figure 2 shows the KSS histograms and strip plots for each sleep condition for RS and ASL imaging. The intervention of this experiment was effective in dispersing sleepiness from high alertness to high sleepiness.
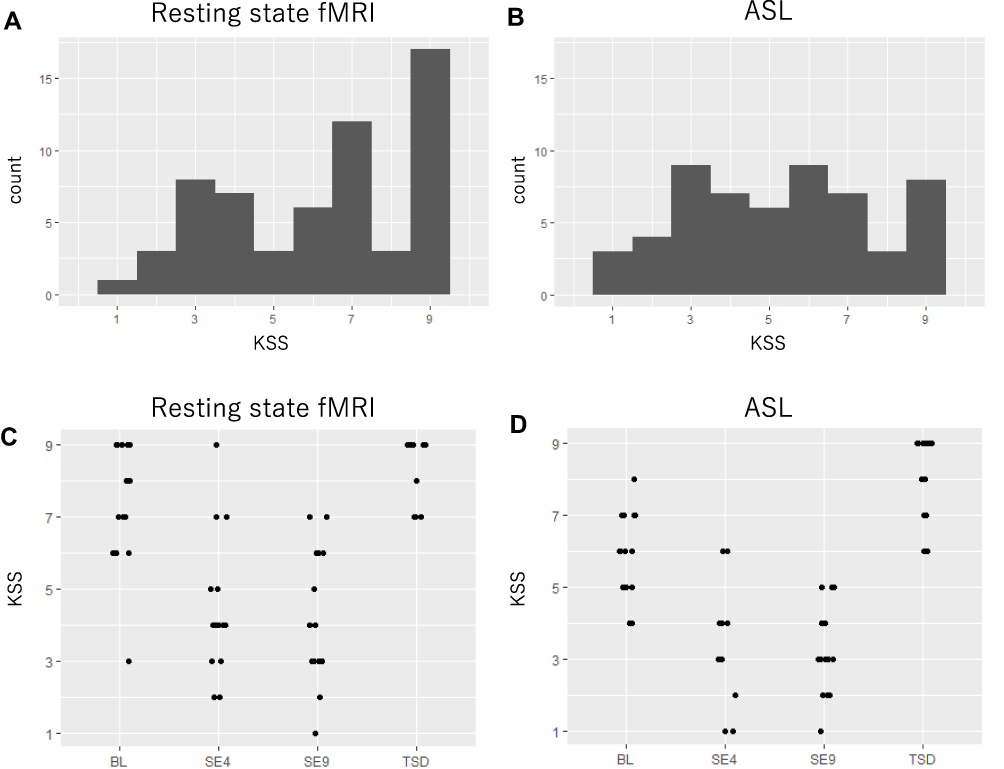 |
Figure 2 Karolinska sleepiness scale data distribution. (A) Data distribution of the KSS during resting state. (B) Data distribution of the KSS during arterial spin labeling. (C) Data distribution of the KSS during resting state for each condition by strip plot. (D) Data distribution of the KSS during arterial spin labeling for each condition by strip plot. Abbreviation: KSS, Karolinska sleepiness scale. |
Resting-State fMRI
The investigation of the association between the thalamus-seed functional connectivity and subjective sleepiness revealed that the functional connectivity in many areas was negatively associated with subjective sleepiness. The strongest association with subjective sleepiness was shown in the functional connectivity between the left thalamus and fusiform gyrus. Additionally, a strong association with subjective sleepiness was observed in the middle temporal gyrus and inferior frontal gyrus (Table 1).
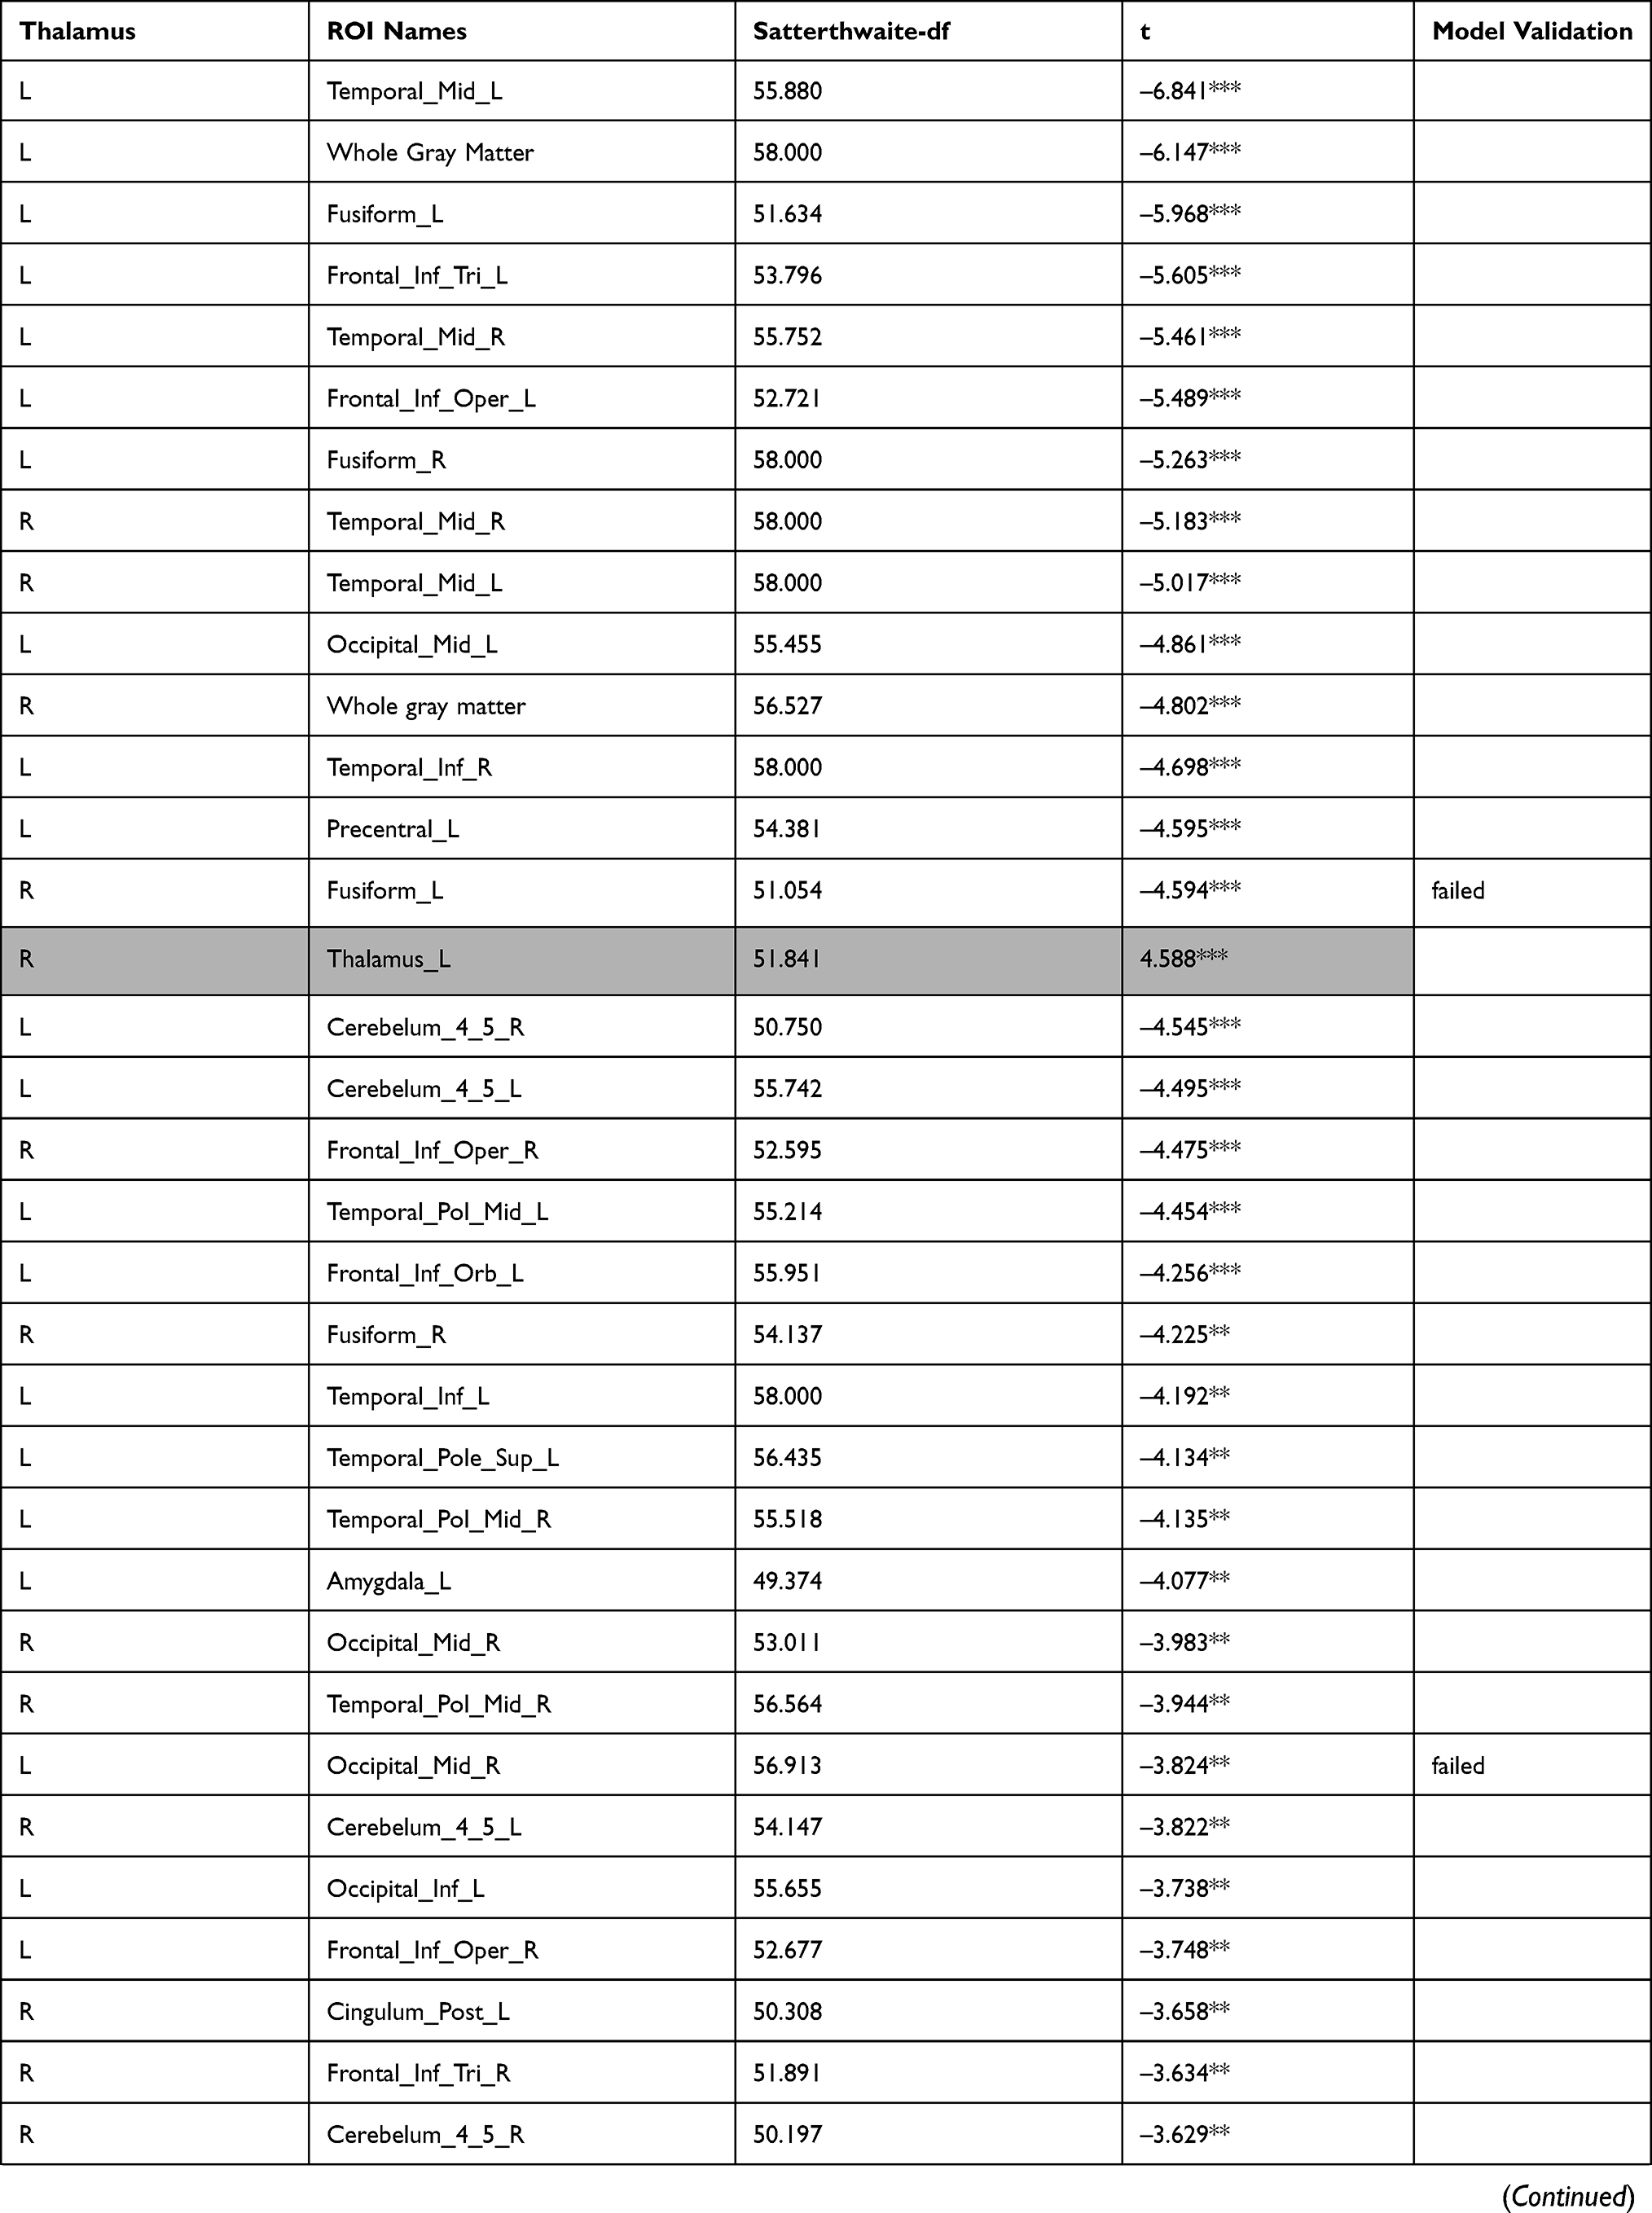 | 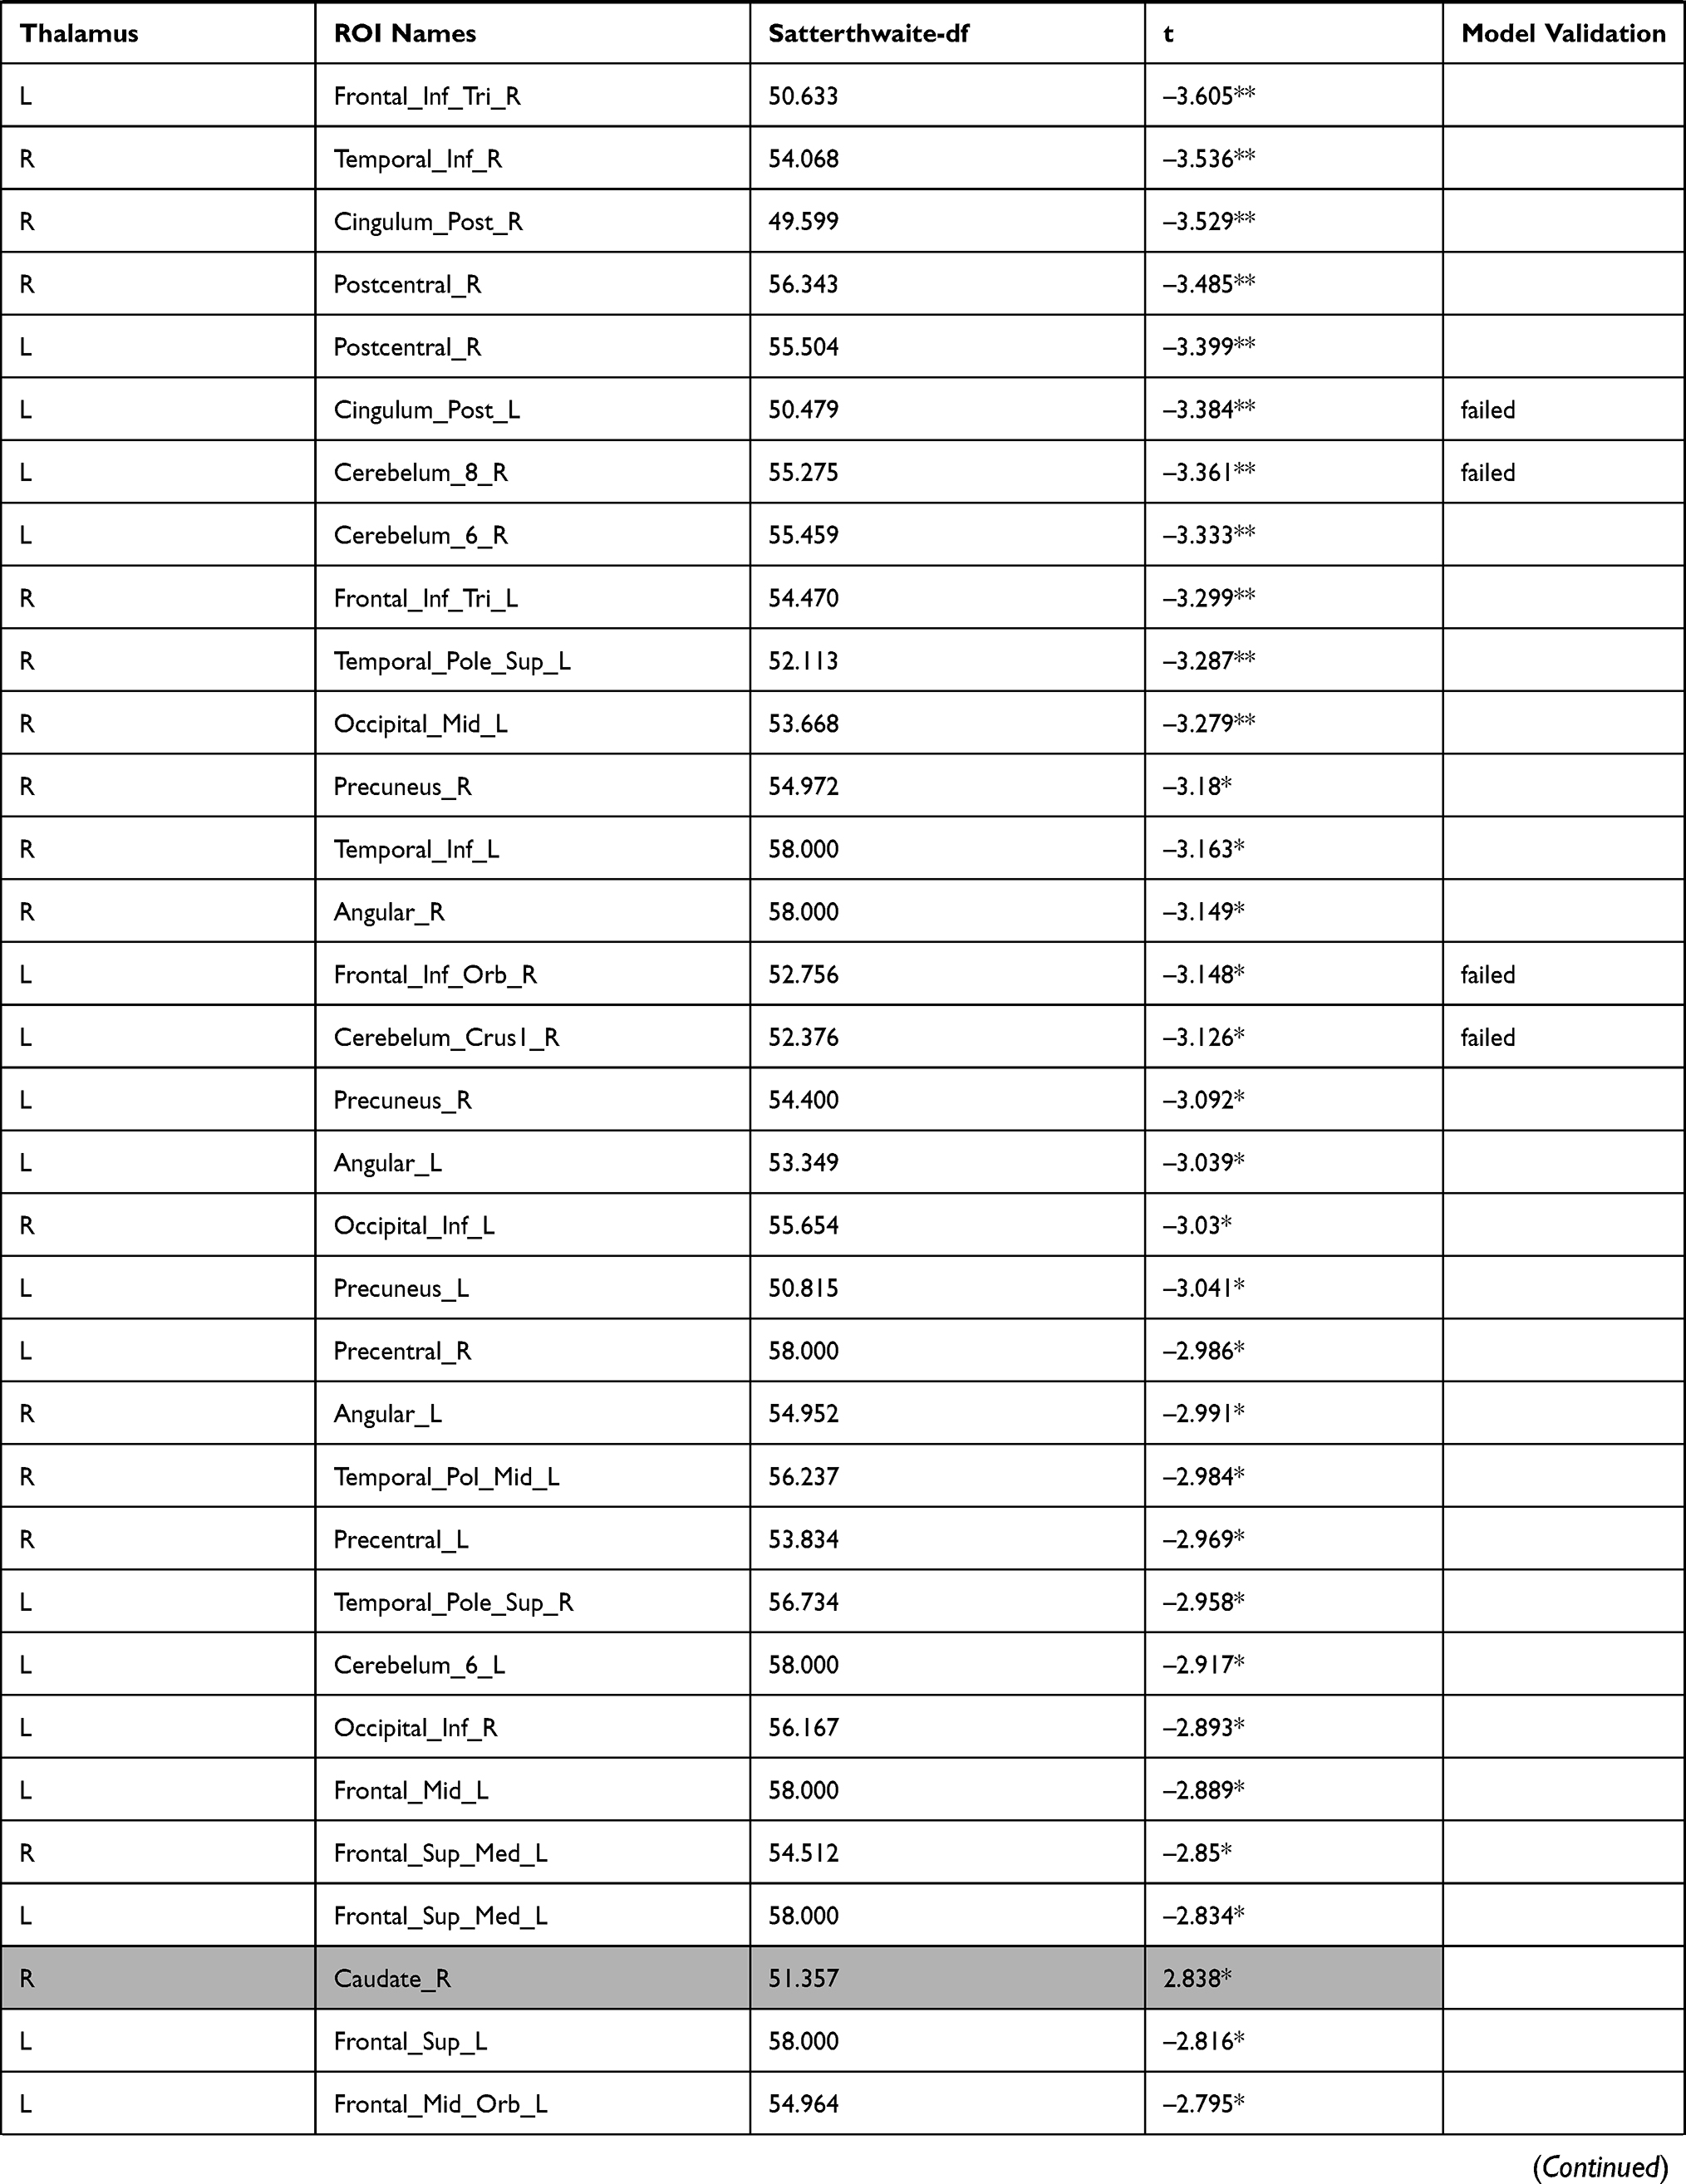 | 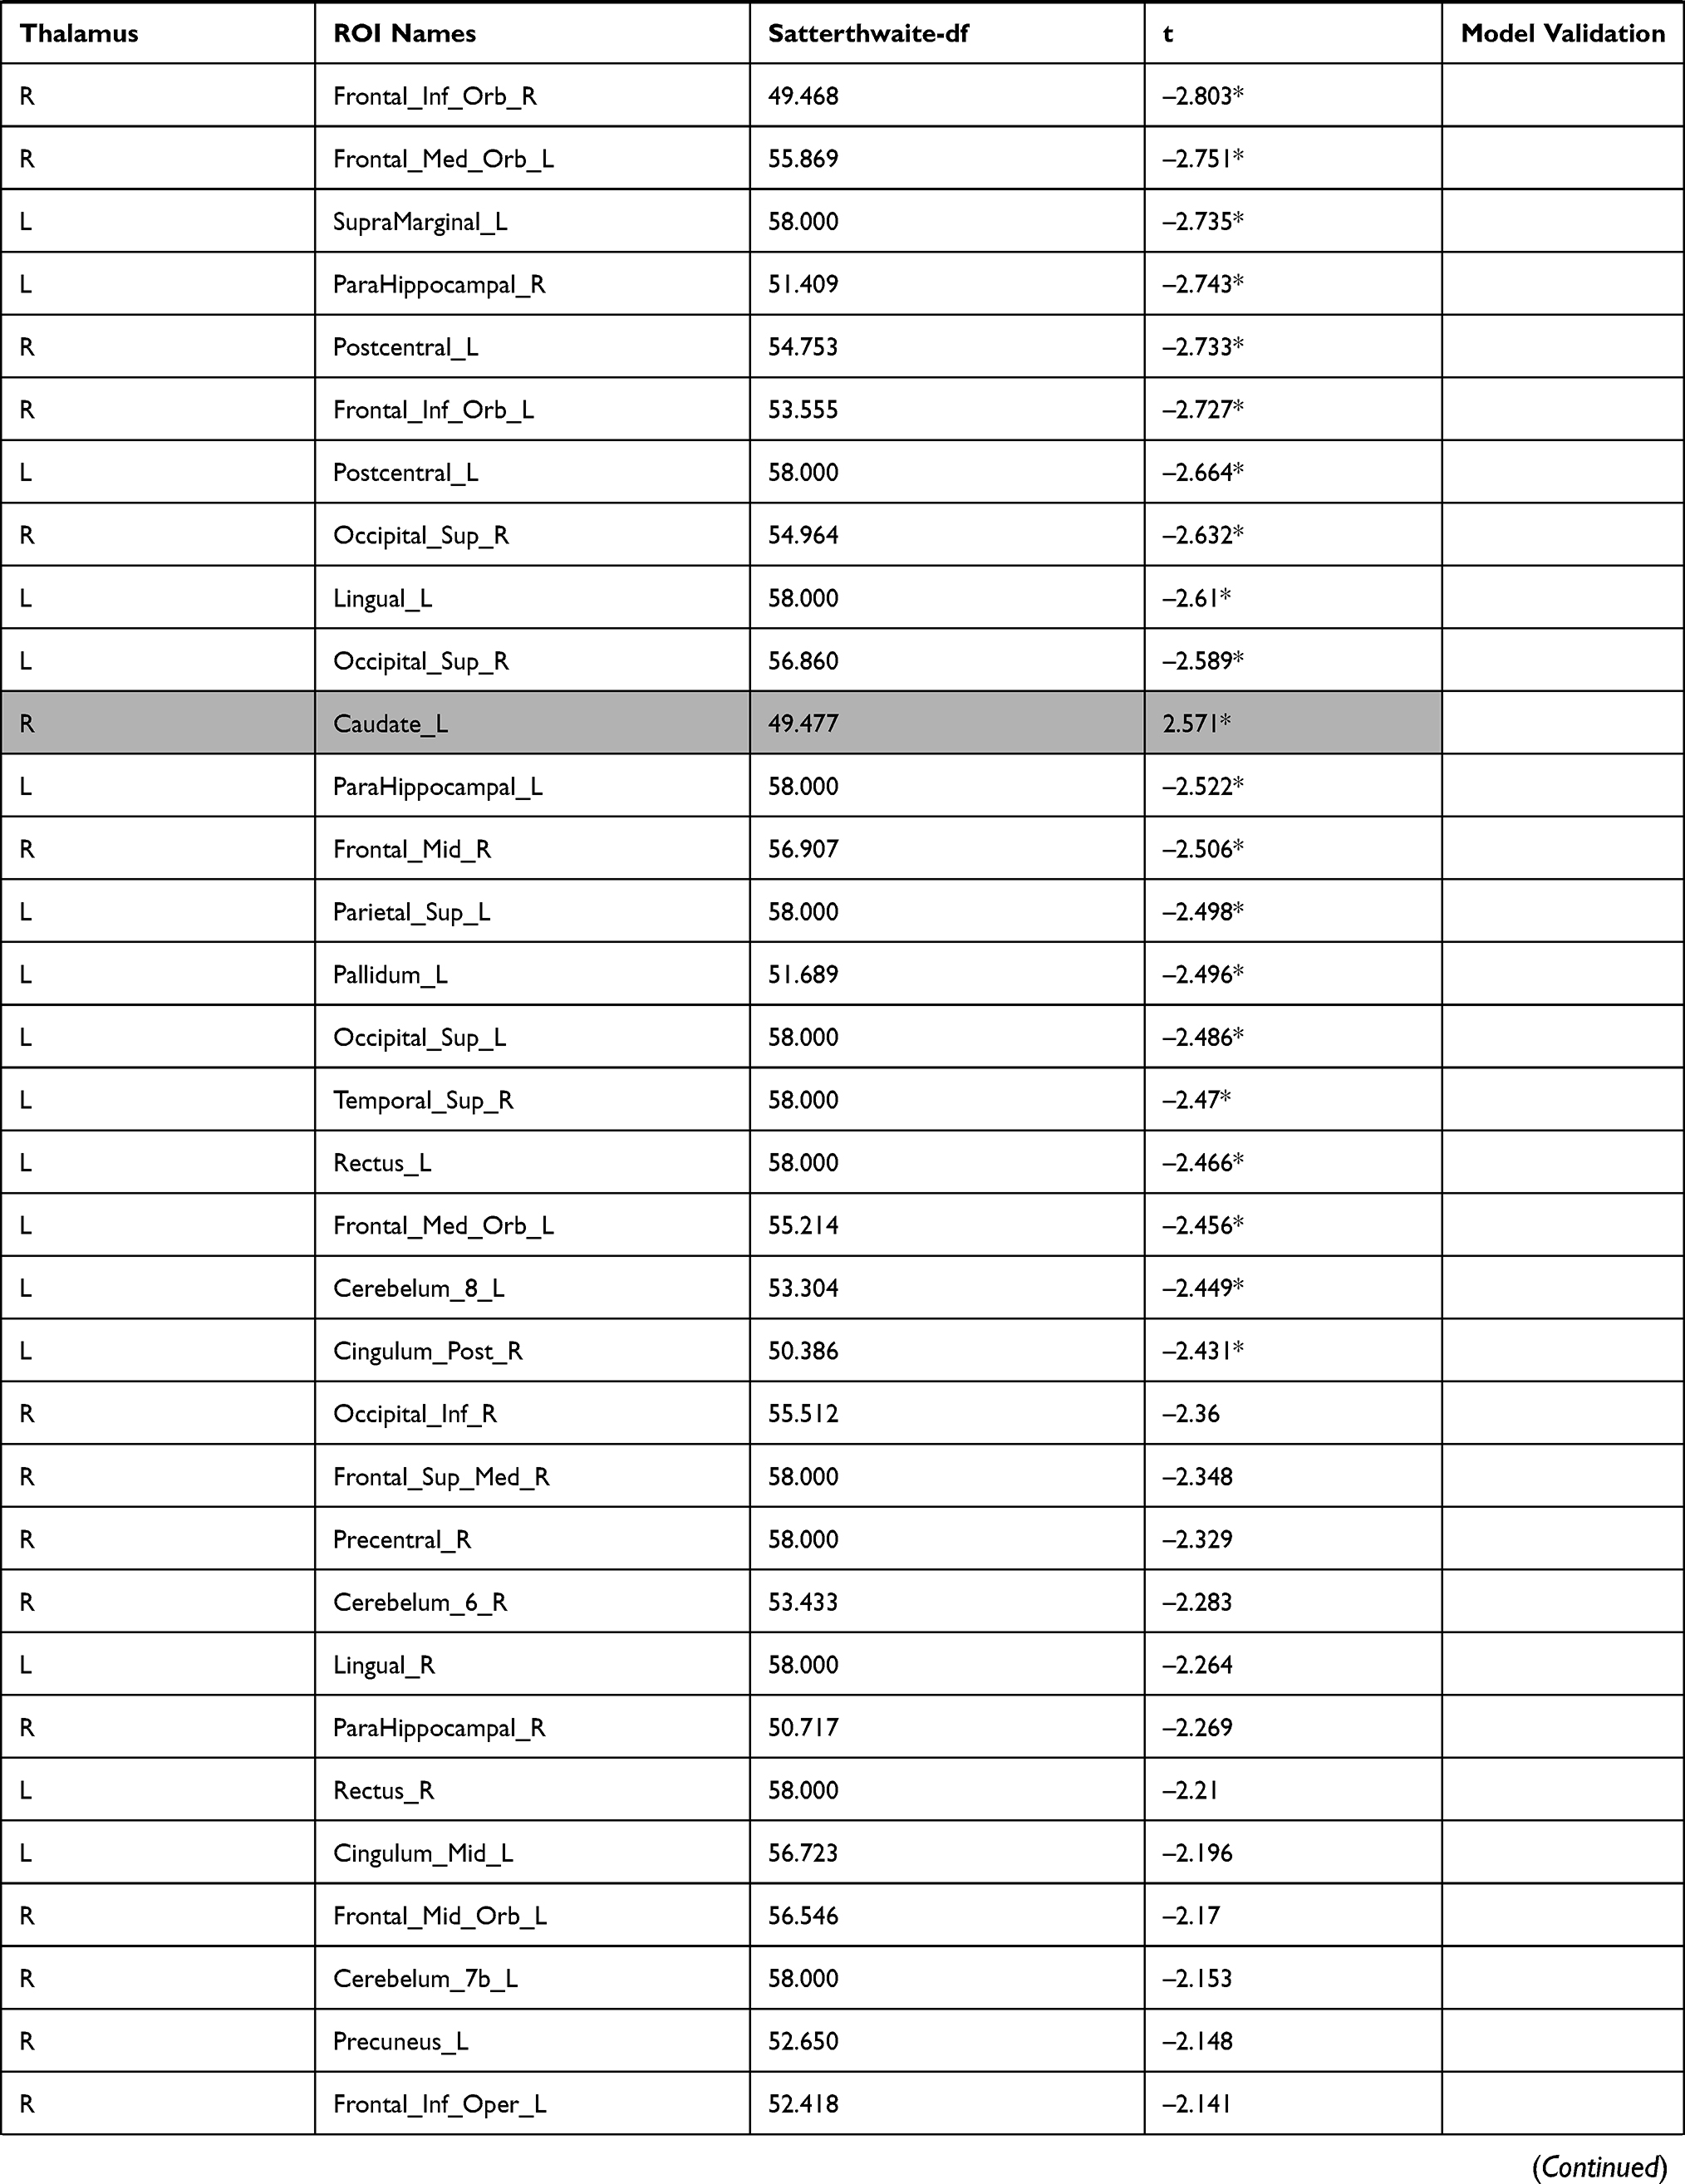 | 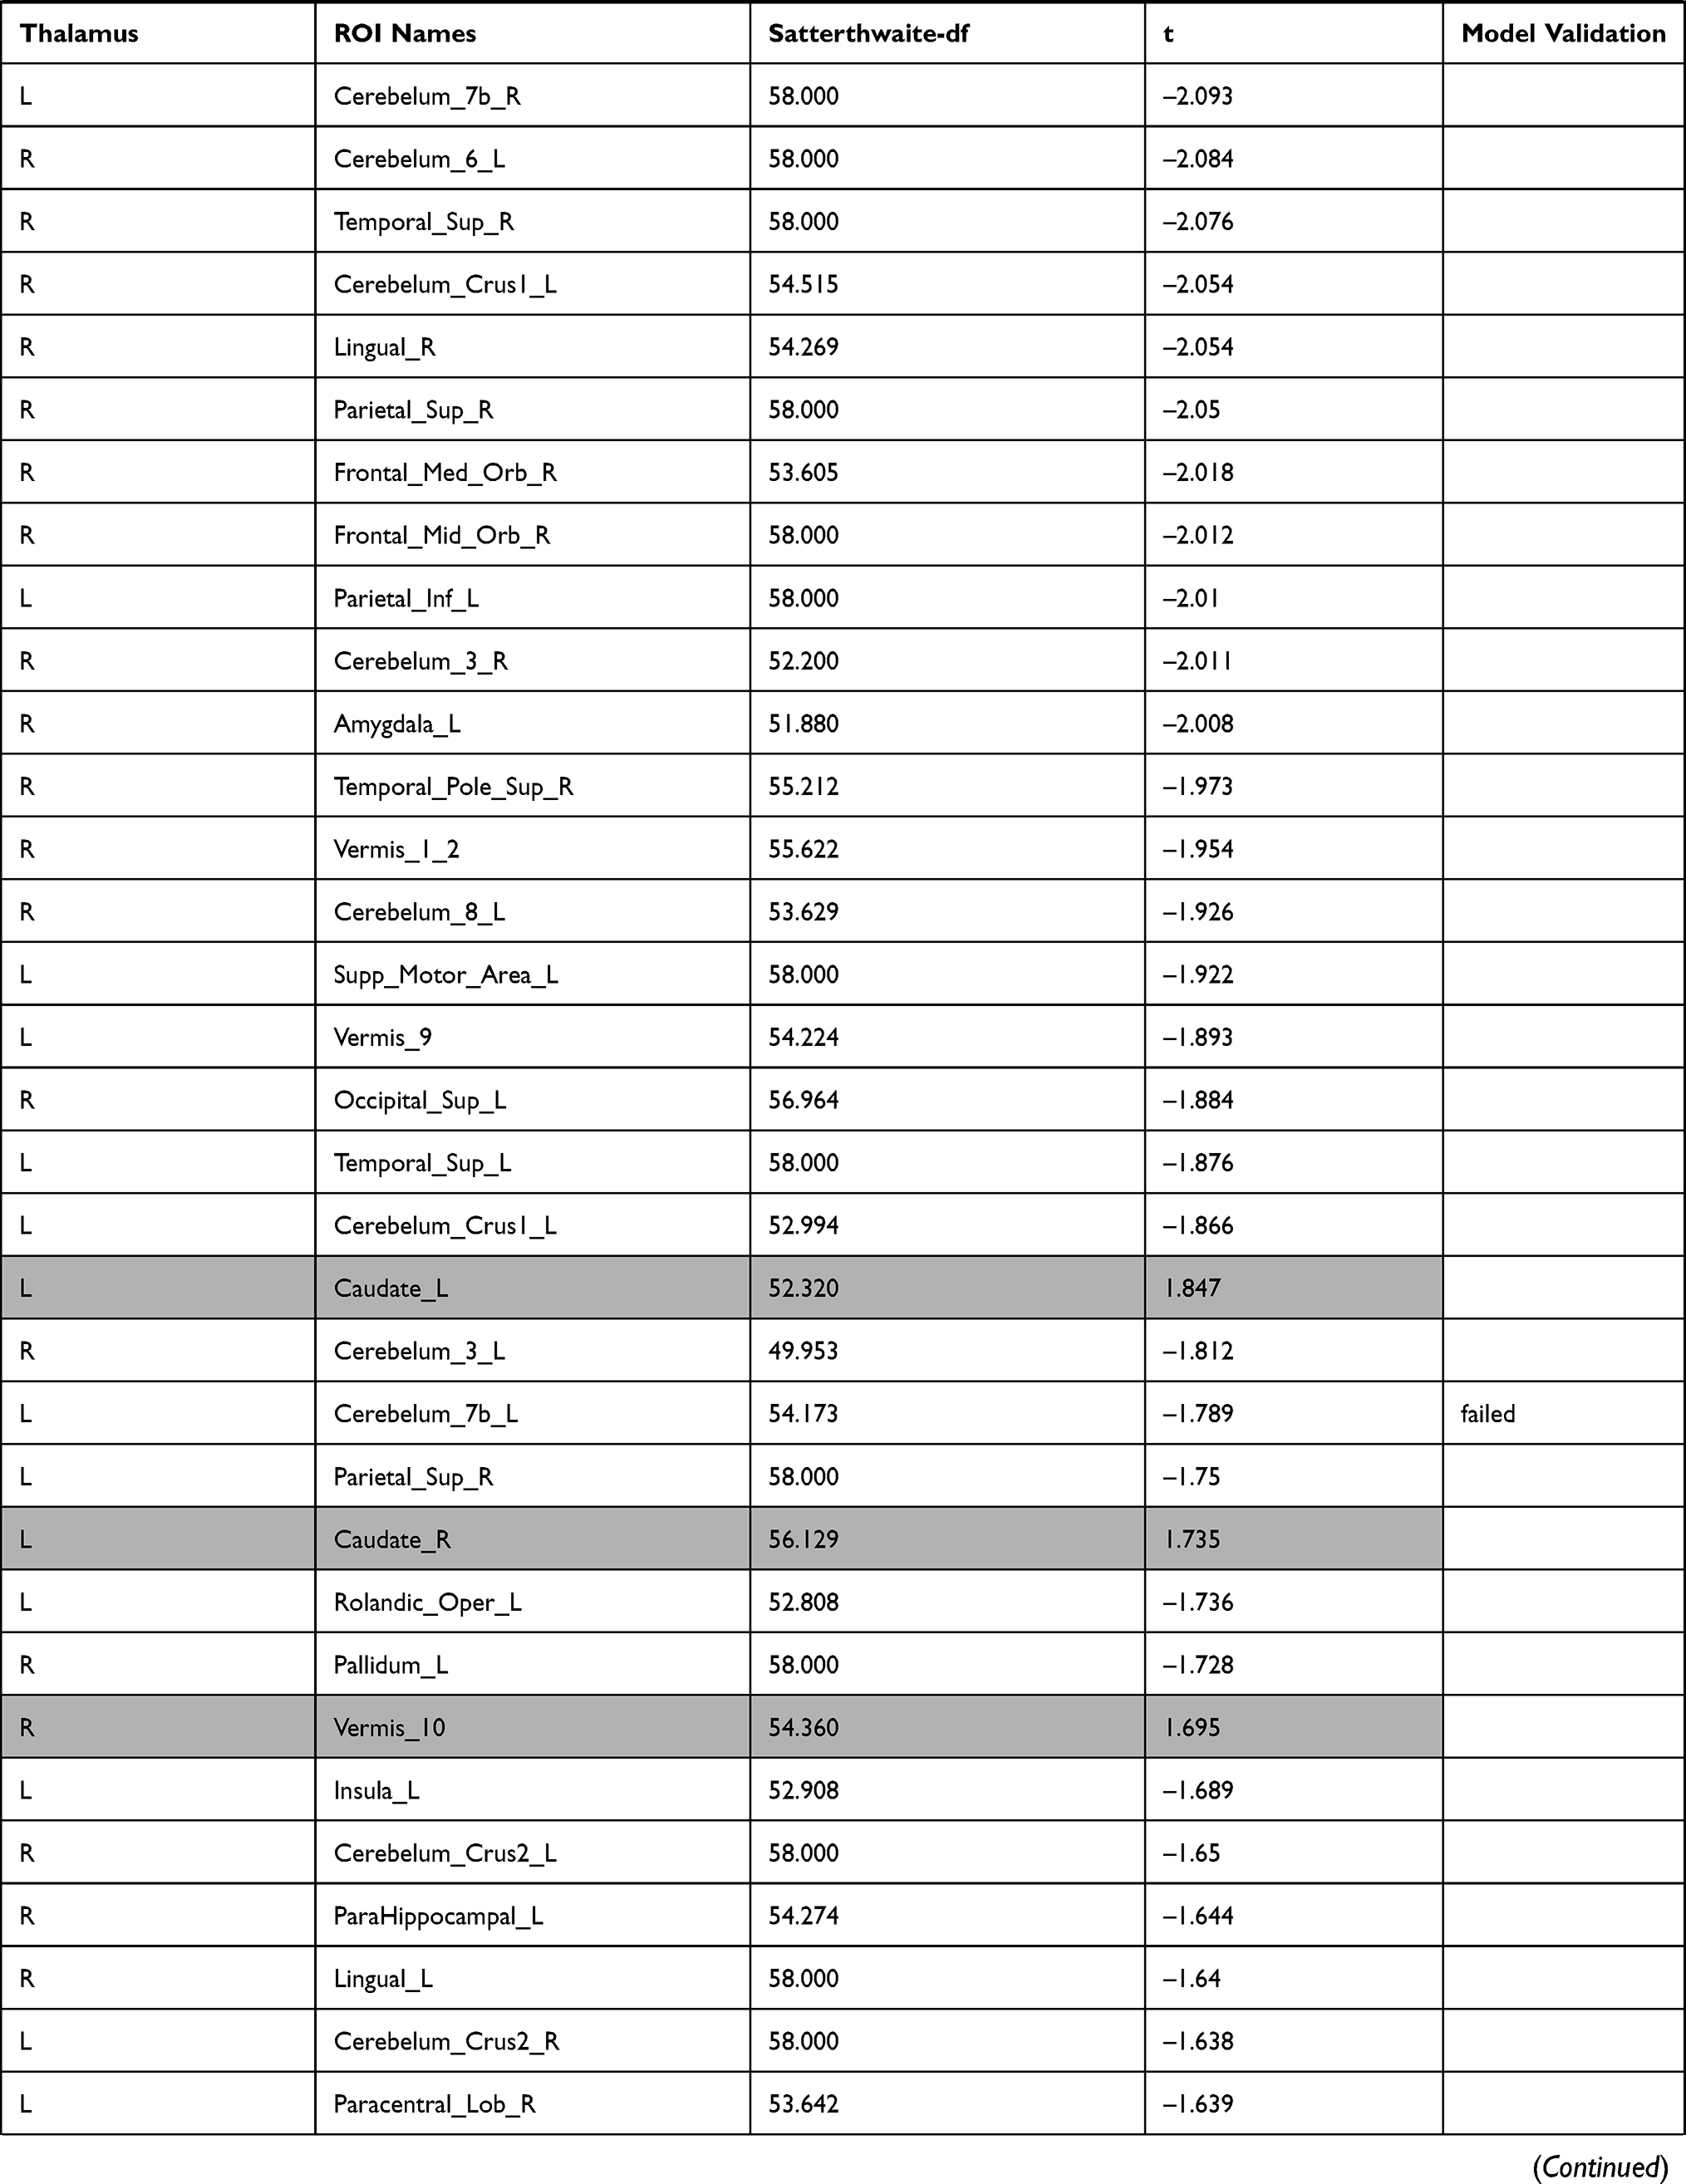 | 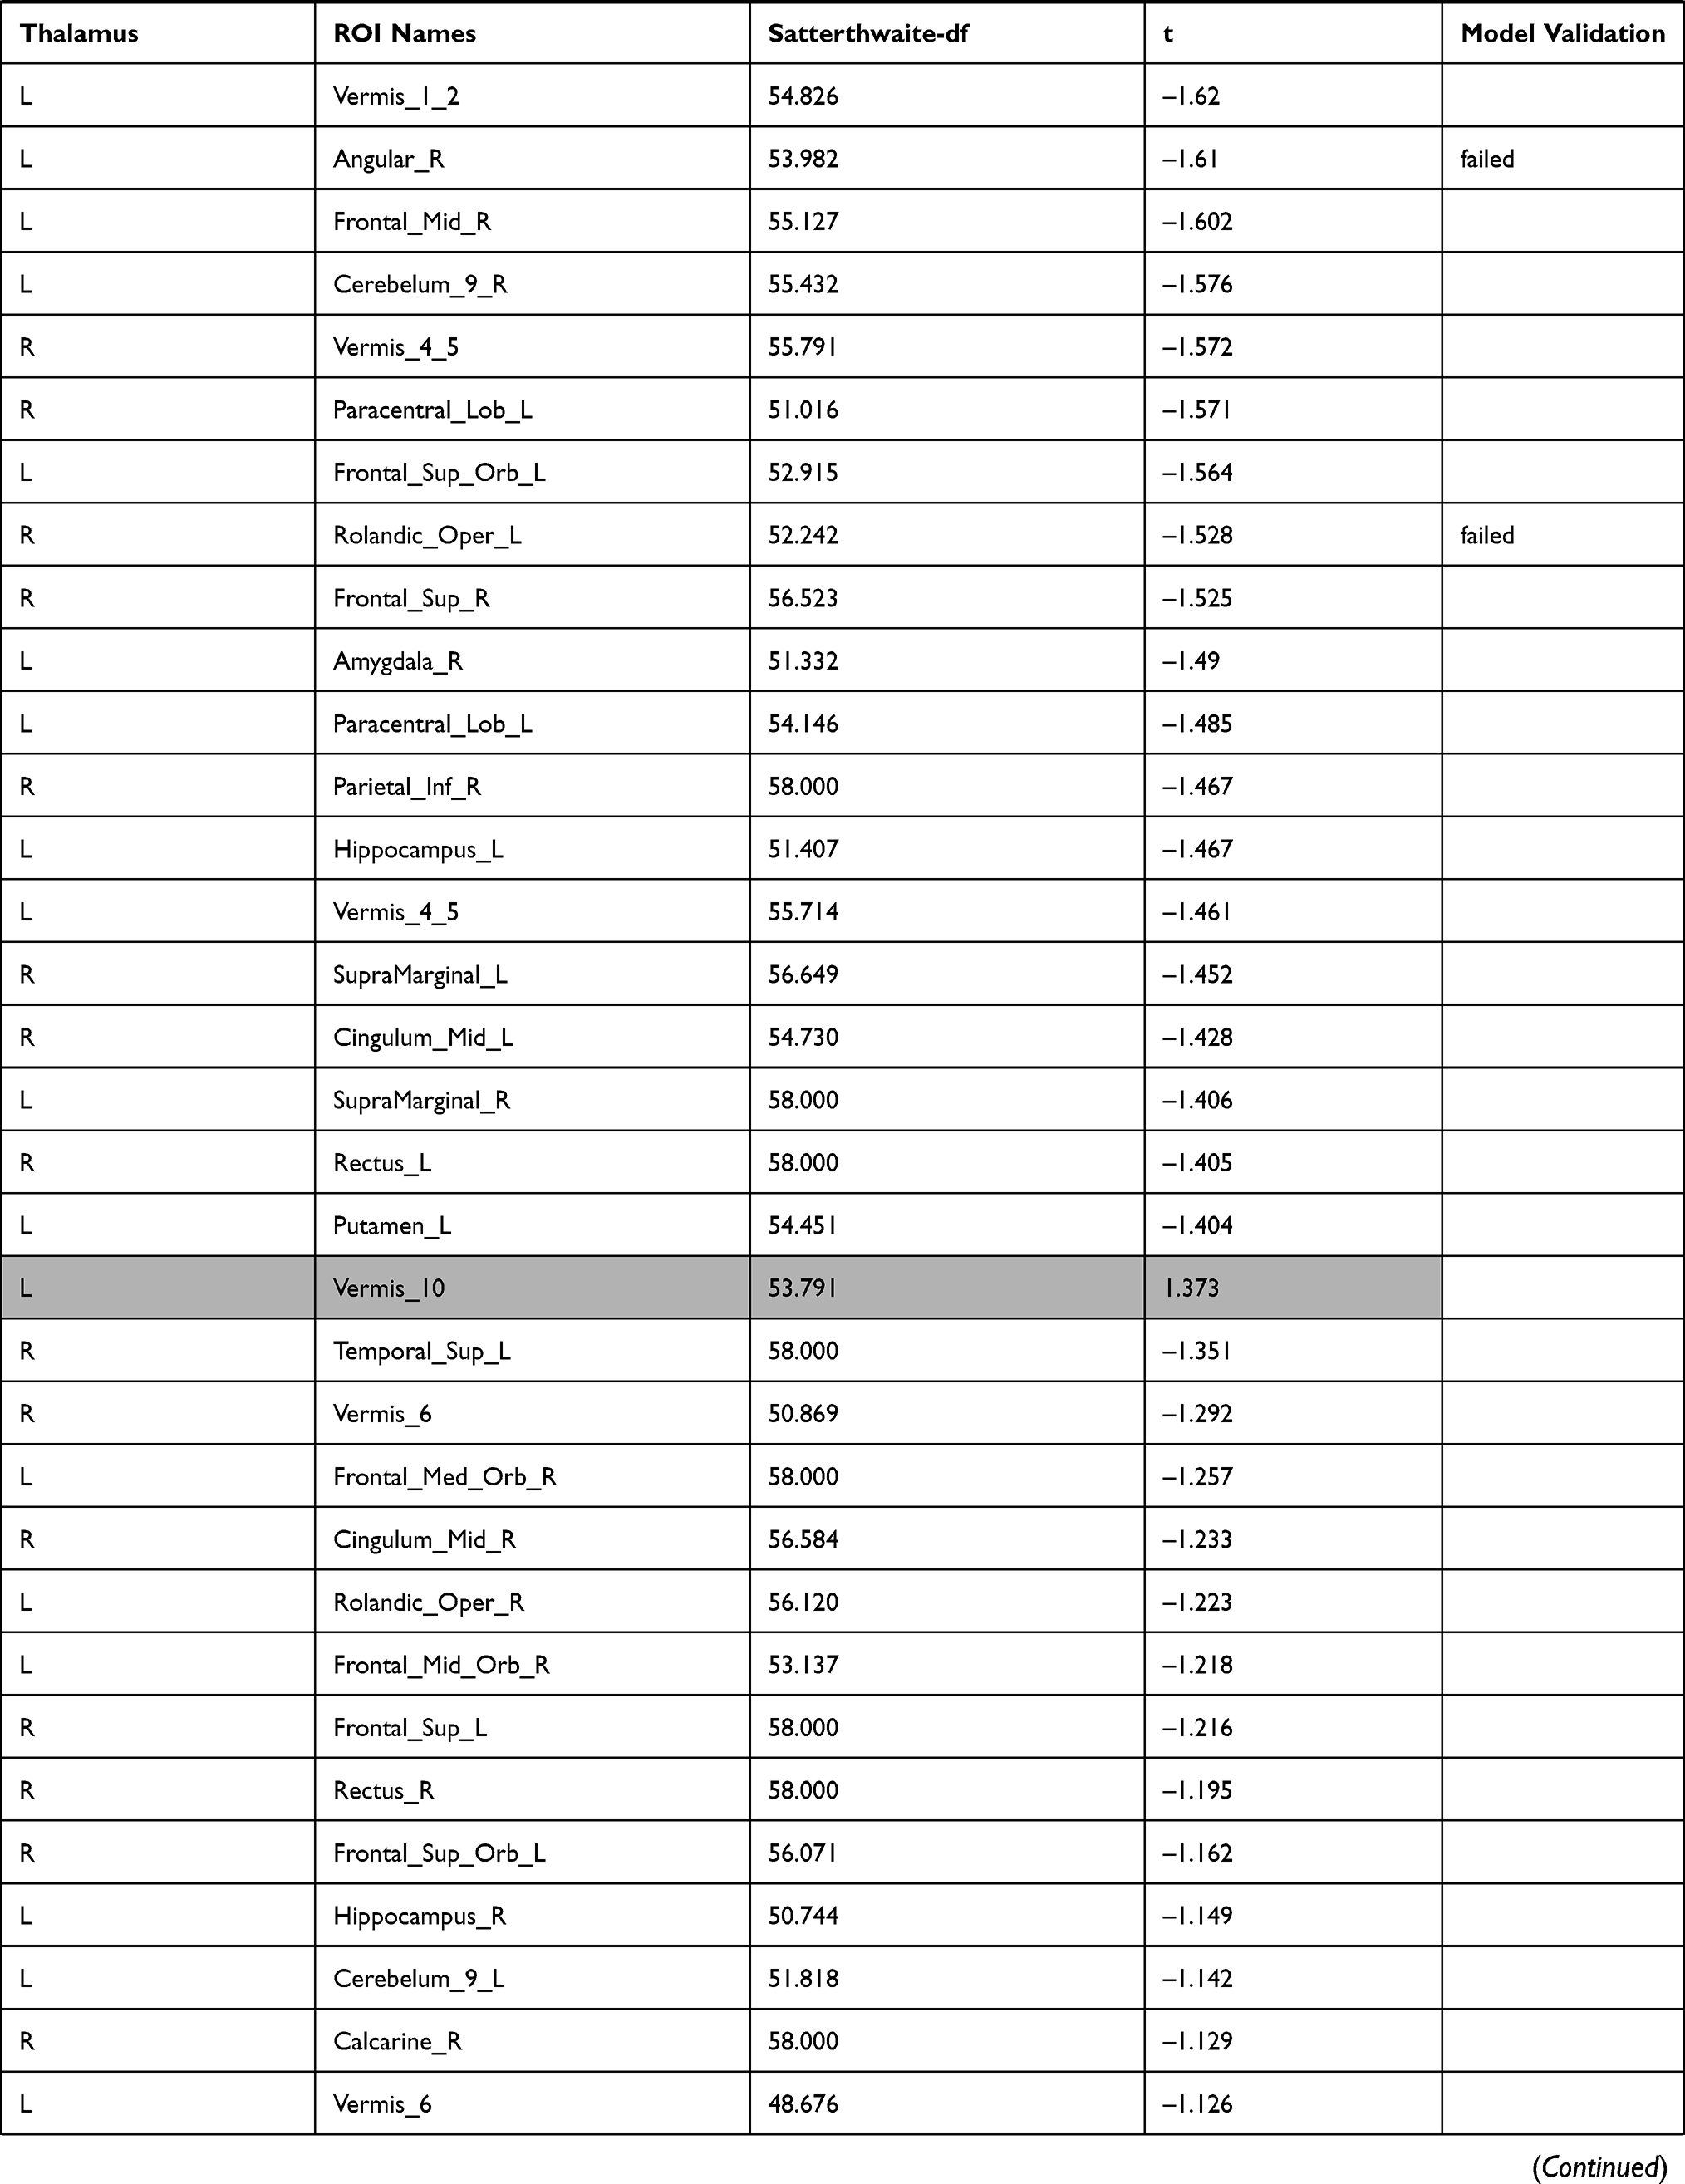 | 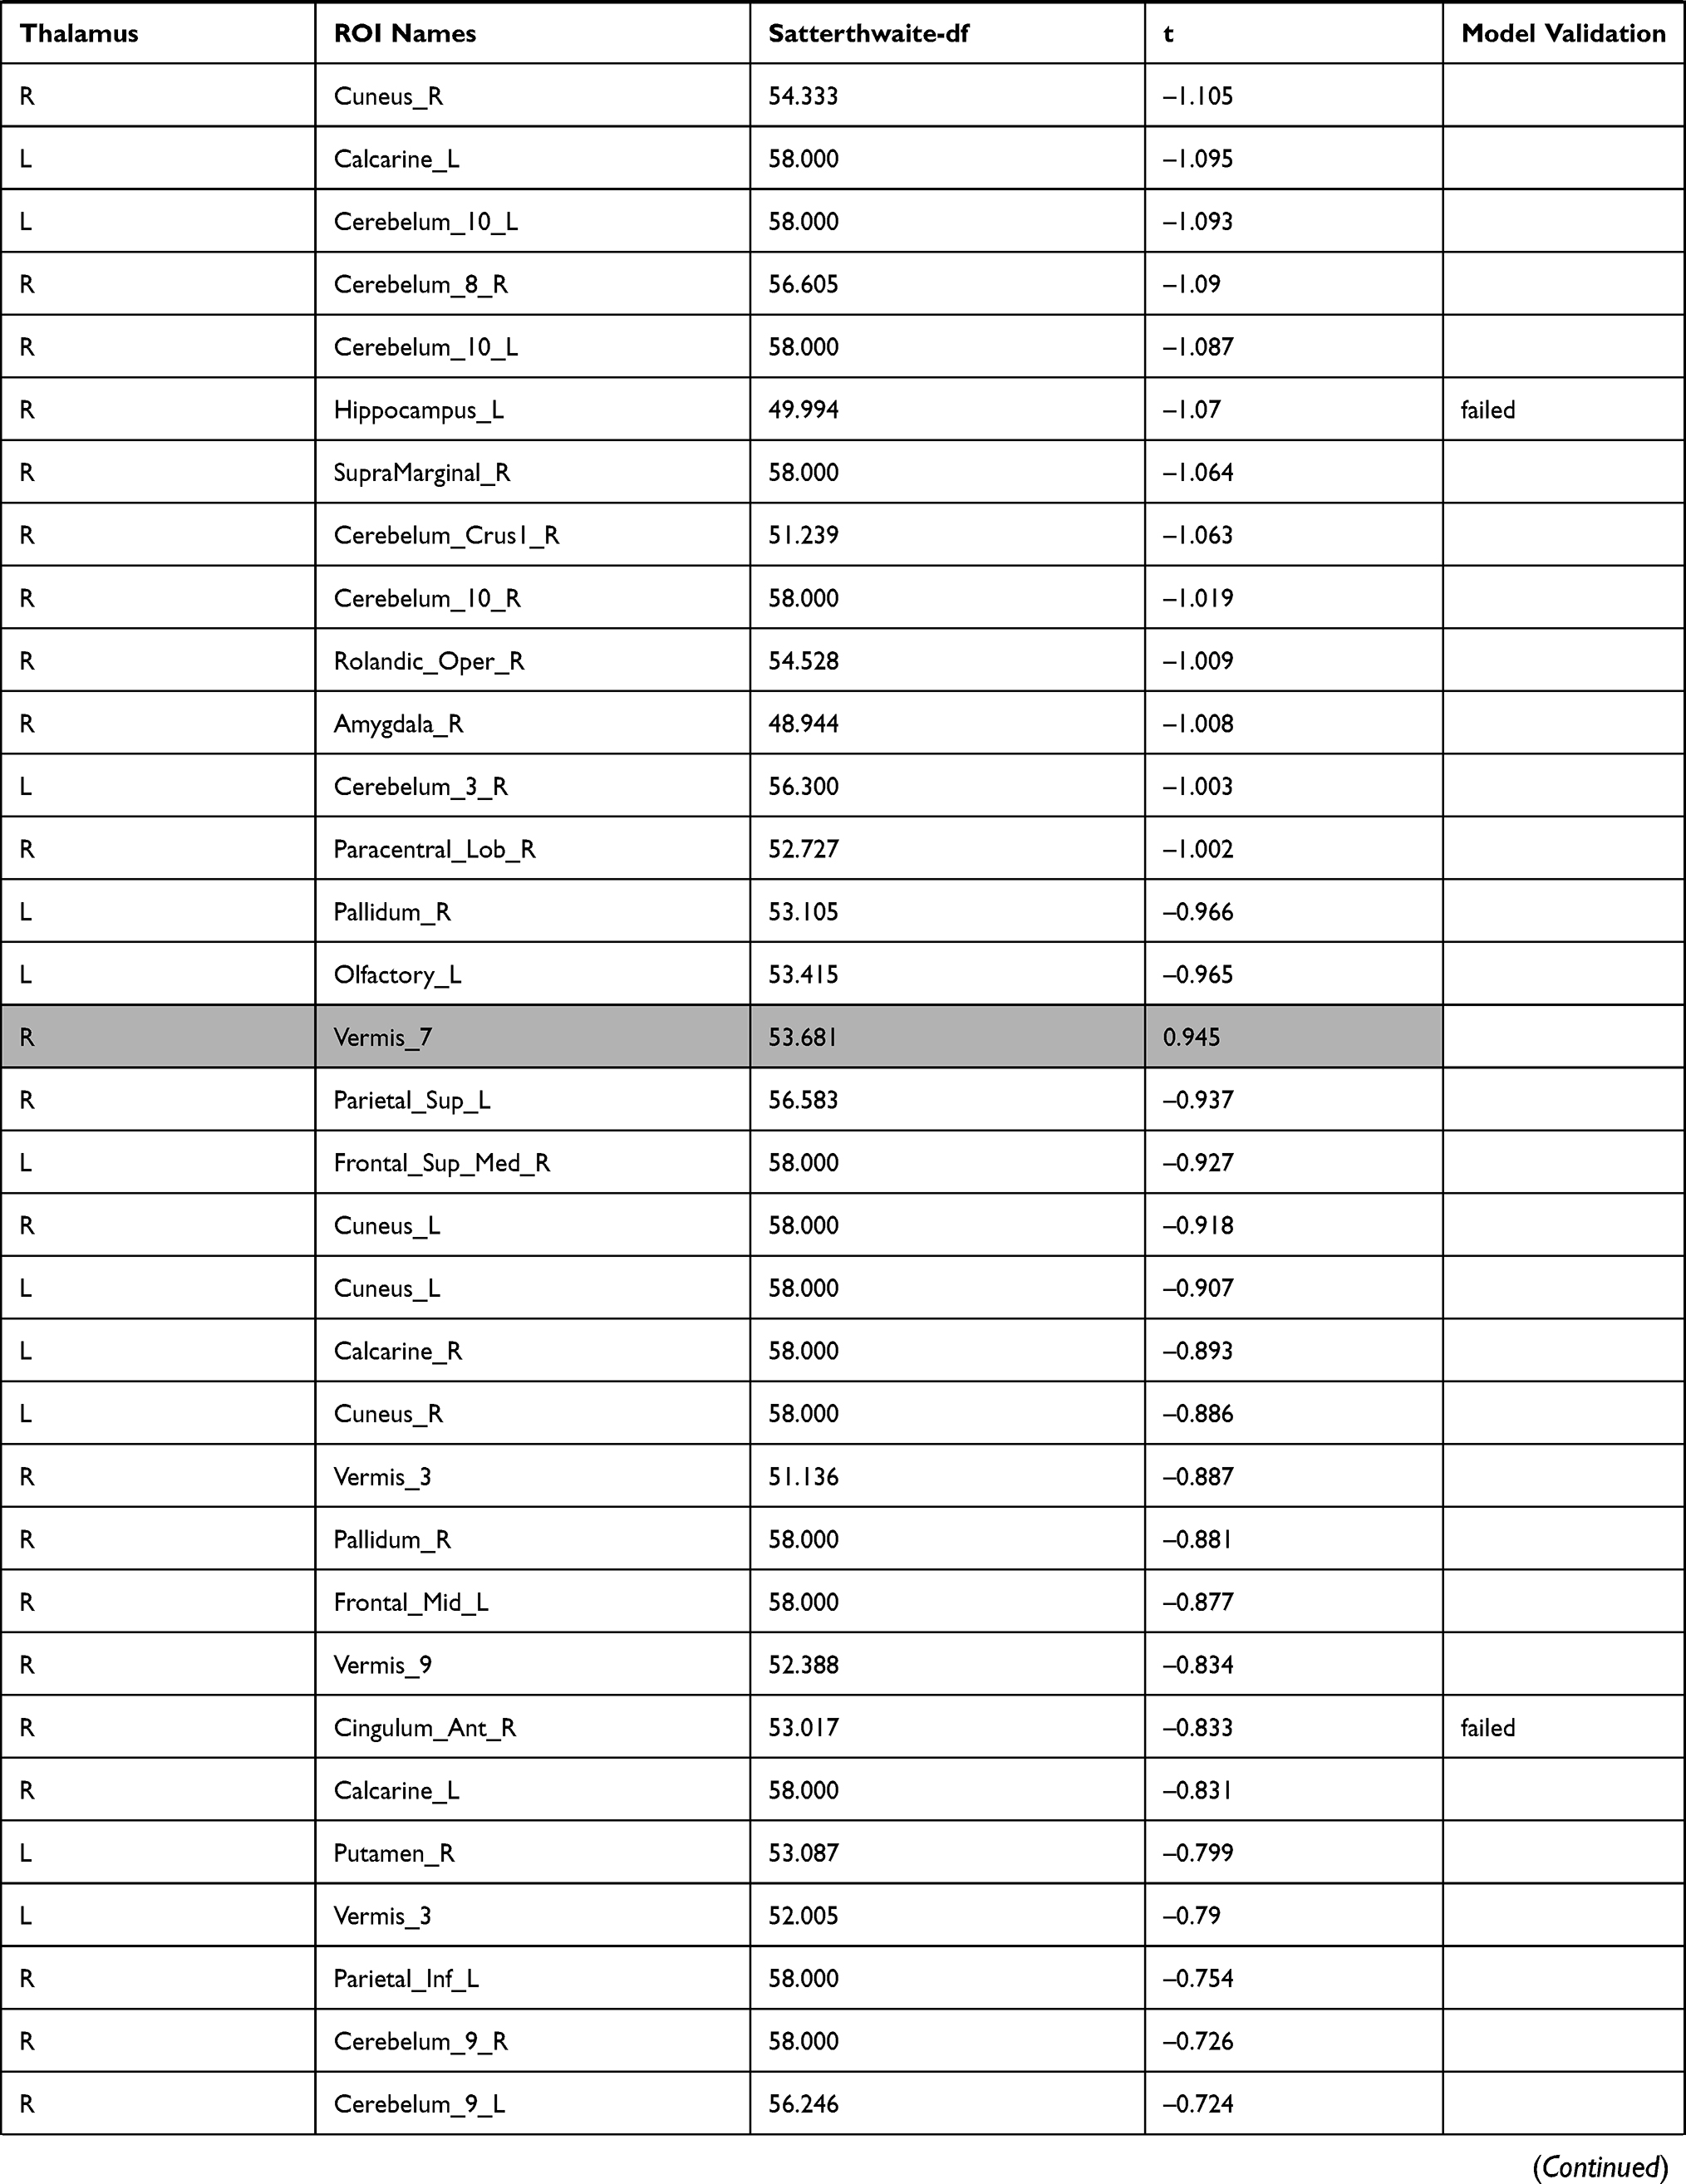 | 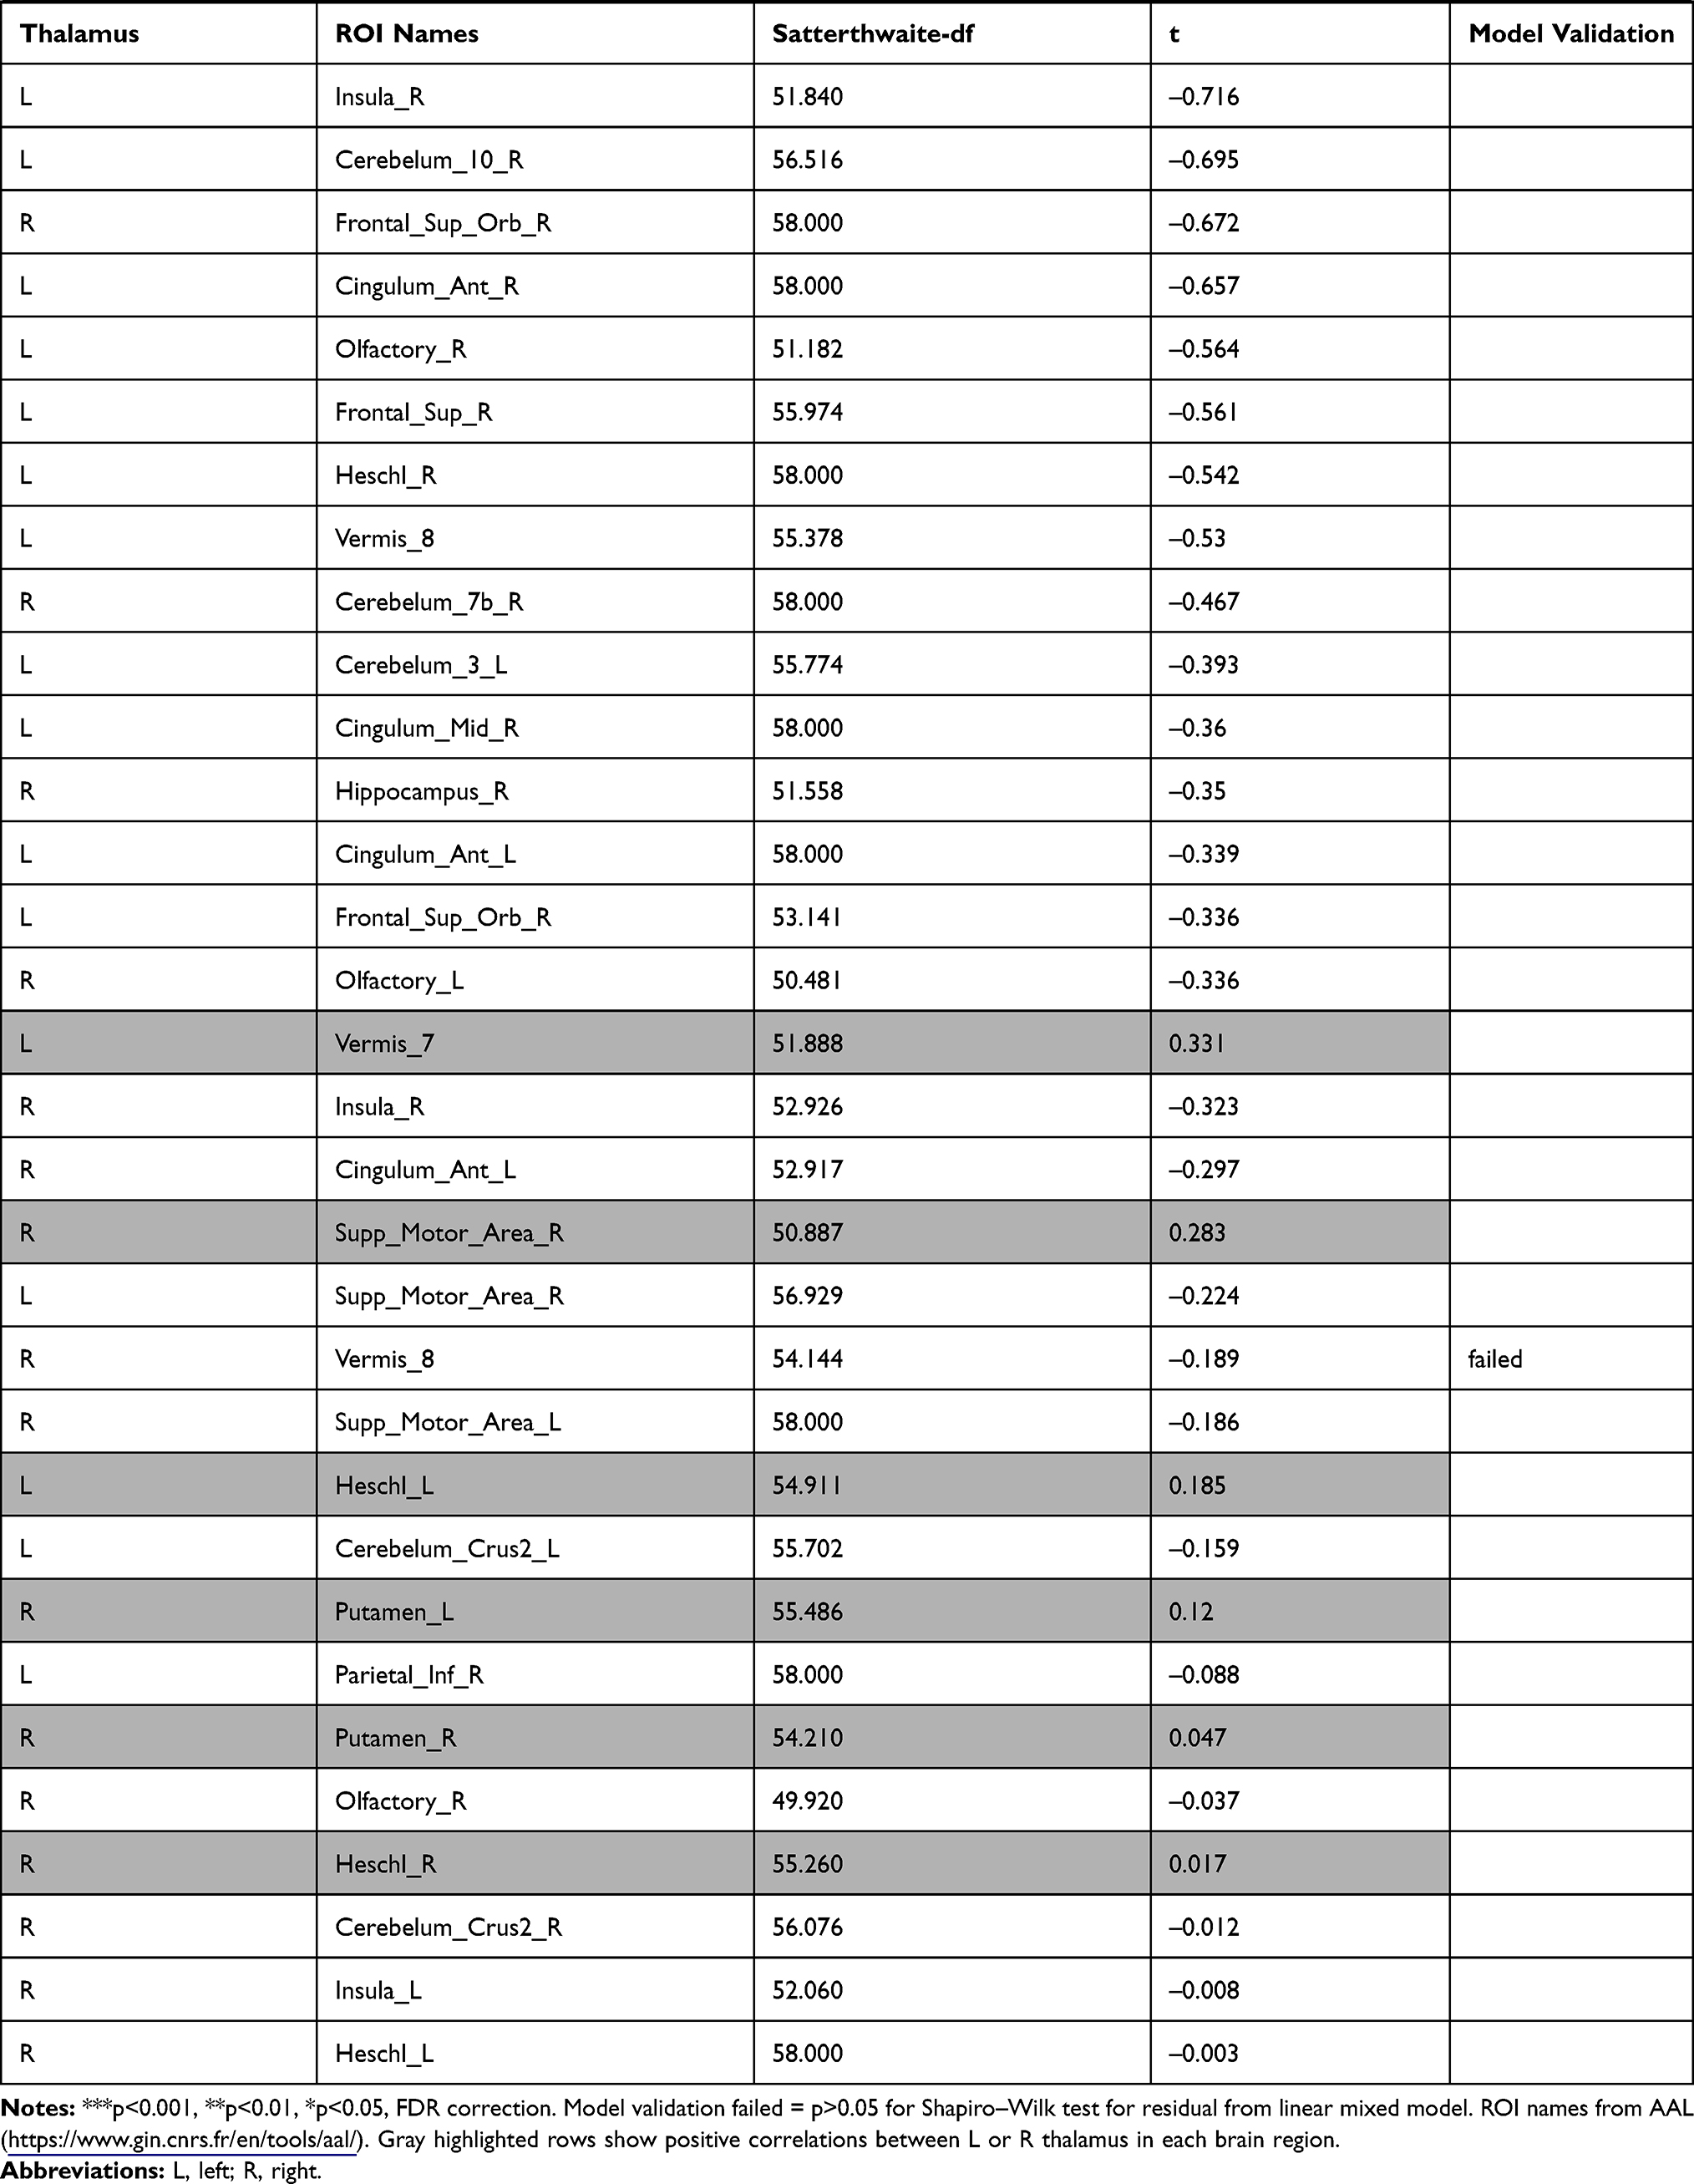 |
Table 1 Functional Connectivity Between the Left or Right Thalamus and Other Regions |
In the left thalamus-seed functional connectivity analysis, negative associations were revealed in 110/115 regions, including significant associations among 52 regions. In the right thalamus-seed functional connectivity analysis, negative associations were observed in 107/115 regions, including significant associations among 32 regions (Table 1). Therefore, it was expected that the functional connectivity with the thalamus was negatively associated with subjective sleepiness in most regions. Only the association between the left and right thalami, and between the right thalamus and right or left caudate showed a significant positive association with subjective sleepiness (right-left thalamus, t = 4.588, p < 0.001; right thalamus-right caudate, t = 2.838, p < 0.05; right thalamus-left caudate, t = 2.571, p < 0.05, FDR corrected, Table 1, Figure 3). Figure 4 shows the association between the left and right thalami and the entire gray matter region, excluding the thalamus. A significant negative association with subjective sleepiness was observed (left, t = −6.147, p < 0.001; right, t = −4.802, p < 0.001, FDR corrected, Table 1, Figure 4), showing a positive functional connectivity for low KSS scores (high arousal level) and negative functional connectivity for high KSS scores (low arousal level).
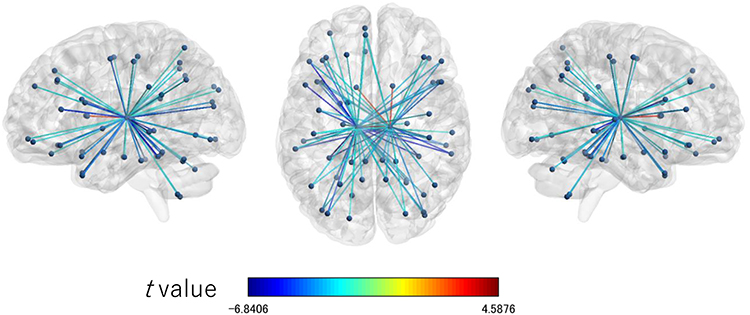 |
Figure 3 Connection map for functional connectivity connected with the left and right thalami associated with the Karolinska sleepiness scale. The figures show the connections significantly associated with the Karolinska sleepiness scale (p < 0.05) with FDR correction. The colors of the edge show the t values. Left: sagittal view from left to right; enter: axial view from top to bottom; right: sagittal view from right to left. Abbreviation: FDR, false discovery rate. |
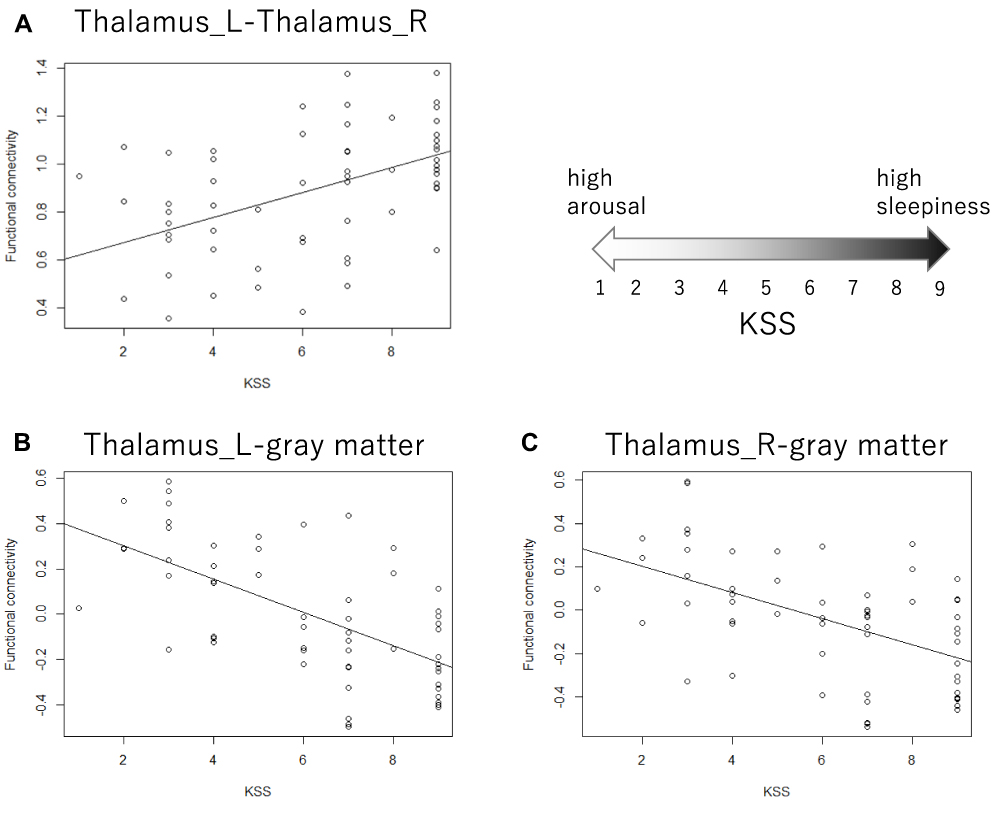 |
Figure 4 Scatterplot of the Karolinska sleepiness scale and functional connectivity. (A) The functional connectivity between the left and right thalami was positively associated with subjective sleepiness, accounting for the random effects of each participant. The gray line shows the regression line corresponding to the linear mixed model. t = 4.588, p < 0.001. (B and C) The functional connectivity between the thalamus and whole gray matter excluding the thalamus was negatively associated with subjective sleepiness, accounting for the random effects of each participant. The gray line shows the regression line corresponding to the linear mixed model. (B) Left thalamus, t = −6.147, p < 0.001. (C) Right thalamus, t = −4.802, p < 0.001. All p values are corrected based on the false discovery rate. Abbreviations: L, left; R, right. |
Degree in Graph Theory Analysis (Number of Functional Connections with the Thalamus)
The investigation of the association between the resting-state functional connectivity and subjective sleepiness revealed a strong negative association between the functional connectivity of various regions with the thalamus and subjective sleepiness (Table 1, Figure 4). A highly negative association was also observed when the whole gray matter was set as a ROI (combined with all other aal masks except for the thalamus).
This result indicates that it is appropriate to consider this process as a dynamic change across the entire brain rather than an interaction between specific regions. It should also be noted that the negative association between the functional connectivity of various regions with the thalamus and subjective sleepiness is distributed across the y = 0 line, with a greater negative functional connectivity when the sleepiness is high and greater positive functional connectivity when sleepiness is low.
The investigation of the association between the number of areas connected to the thalamus by positive or negative functional connectivity and subjective sleepiness indicated that both the degrees of the left and right thalami were negatively associated with subjective sleepiness in the positive functional connectivity network (left: Z = −9.584, p < 0.001, FDR corrected; right: Z = −7.095, p < 0.001, FDR corrected, Figure 5). Conversely, in the negative functional connectivity network, both the degrees of the left and right thalami were positively associated with subjective sleepiness (left: Z = 12.421, p < 0.001, FDR corrected; right: Z = 12.184, p < 0.001, FDR corrected, Figure 5). This result indicates that with increasing sleepiness, the area with positive functional connectivity with the thalamus decreases and the area with negative functional connectivity increases.
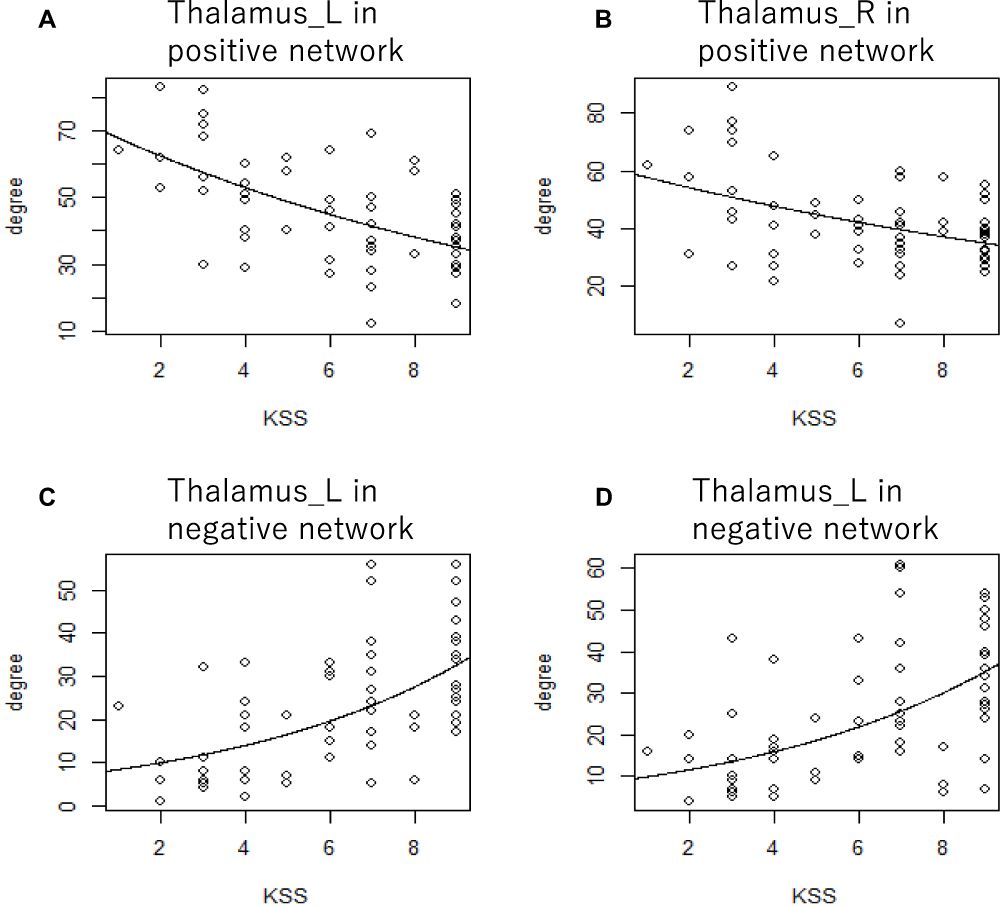 |
Figure 5 Scatterplot of the Karolinska sleepiness scale and the degree of positive and negative connectivity network. The degree of graph theory analysis of the thalamus was associated with subjective sleepiness, accounting for the random effects of each participant. The gray line shows the regression line corresponding to the generalized linear mixed model. (A) The left thalamus in the network consists of positive functional connectivity, Z = −9.584, p < 0.001. (B) The right thalamus in the network consists of positive functional connectivity, Z = −7.095, p < 0.001. (C) The left thalamus in the network consists of negative functional connectivity, Z = 12.421, p < 0.001. (D) The right thalamus in the network consists of negative functional connectivity, Z = 12.184, p < 0.001. All p values are corrected based on the false discovery rate. Abbreviations: L, left; R, right. |
Figure 6 shows the presence or absence of an edge, which is the functional connectivity between the left or right thalamus and other aal areas. The brain regions corresponding to the numbers are shown in Supplementary Table 2. Each participant is arranged vertically from the top in the order of arousal level, and the presence or absence of functional connectivity between the left or right thalamus and other areas is indicated by color (red: positive functional connectivity; blue, negative functional connectivity; gray, no functional connectivity).
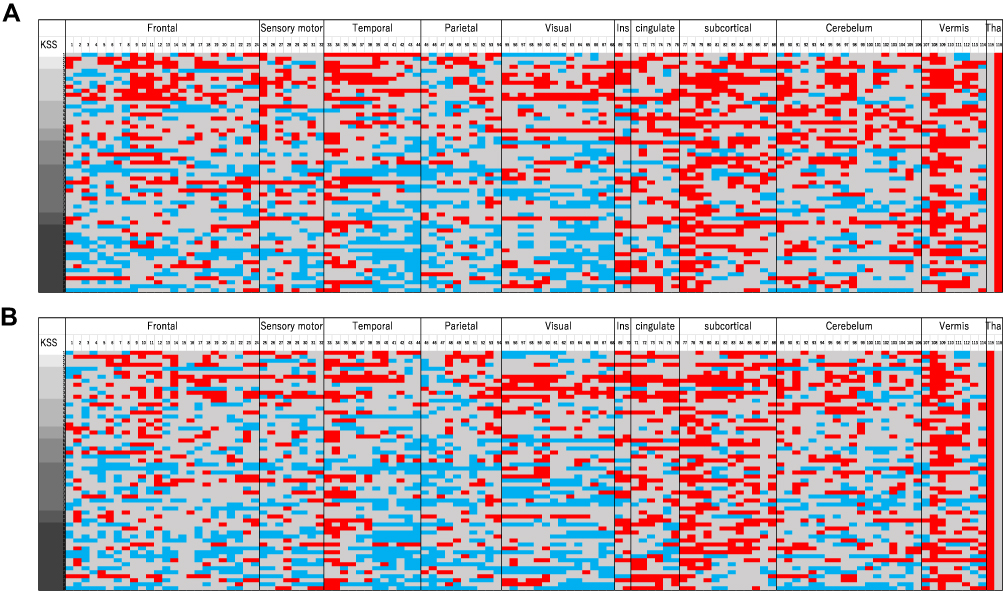 |
Figure 6 Combined adjacency matrix of the negative and positive connectivity network between the thalamus and other aal ROIs. Each participant is vertically arranged from the top in the order of arousal level, and the presence or absence of the functional connectivity threshold (p < 0.05) between the thalamus and other areas is indicated by color. Each aal area is sorted horizontally and numbered depending upon their anatomical region (see Supplementary Table 2). Red cells indicate positive functional connectivity, blue cells indicate negative functional connectivity, and gray cells indicate non-significant functional connectivity. (A) Left thalamus (B) right thalamus. Abbreviations: L, left; R, right. |
ASL
The investigation of the association between the rCBF and subjective sleepiness in the left and right thalami indicated that the rCBF and subjective sleepiness were negatively associated in the left and right thalami (left: t = −2.938, p < 0.05, FDR corrected; right: t = −2.166, p < 0.05, FDR corrected, Figure 7).
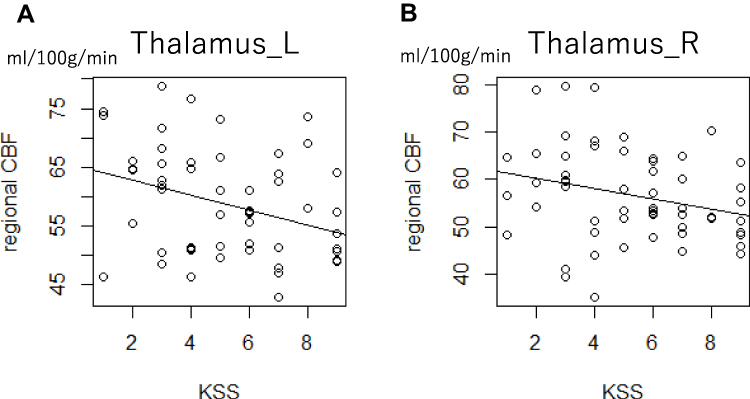 |
Figure 7 Scatterplot of the Karolinska sleepiness scale and the rCBF in the thalamus. The rCBF in the thalamus was associated with subjective sleepiness, accounting for the random effects of each participant. The gray line shows the regression line corresponding to the linear mixed model. (A) Left thalamus, t = −2.938, p < 0.05 (B) right thalamus t = –2.166, p < 0.05. All p values are corrected based on the false discovery rate. Abbreviations: L, left; R, right; rCBF, regional cerebral blood flow. |
Exploratory Functional Connectivity Analysis
The results on exploratory investigation of the association between all the ROIs are shown in Figure 8. Three hundred and fifty connections were significantly associated with sleepiness. The results are shown in detail in Supplementary Table 1.
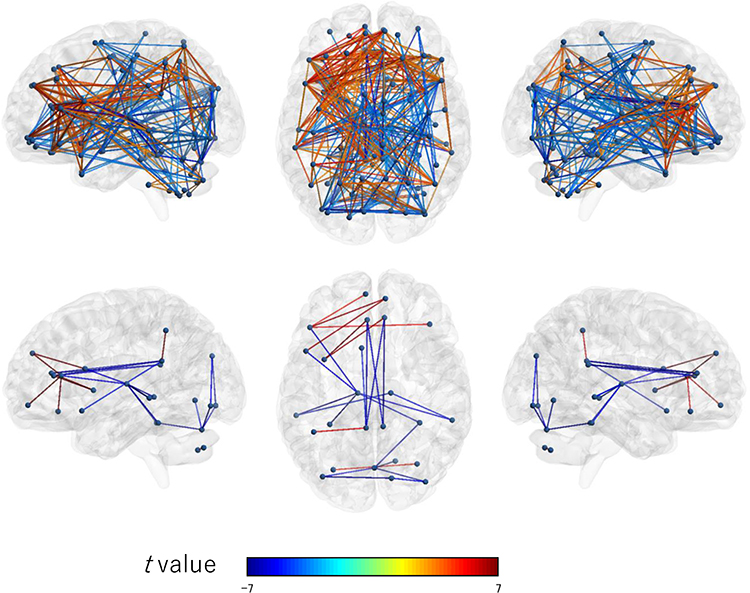 |
Figure 8 Connection map for exploratory ROI-to-ROI analysis. The top figure shows connections significantly associated with the Karolinska sleepiness scale under the threshold (p < 0.05) with FDR correction. The bottom figure shows connections significantly associated with the Karolinska sleepiness scale under the threshold (p < 0.05) with Bonferroni correction (more conservative). The colors of the edge show the t values. Left: sagittal view from left to right; enter: axial view from top to bottom; right: sagittal view from right to left. Abbreviation: FDR, false discovery rate. |
Discussion
In this study, we investigated the relationship between subjective sleepiness and the thalamus-centered neural network using functional connectivity by fMRI, graph theory analysis, and regional blood perfusion analysis by ASL. The functional connectivity between the left or right thalamus and various brain regions displayed a significant negative association with subjective sleepiness, whereas the functional connectivity between the left and right thalami was significantly positively associated with subjective sleepiness. The graph theory analysis indicated that the number of positive functional connections to the left or right thalamus showed a strong negative association with subjective sleepiness, and conversely, the number of negative functional connections showed a positive association with subjective sleepiness. The ASL analysis indicated that the blood flow in both the left and right thalami was significantly negatively associated with subjective sleepiness.
During the 9 days of sleep extension, the total sleep time decreased continuously, and decreased subjective sleepiness was observed following sleep extension. These findings demonstrate that the sleep debt accumulated in everyday life can be resolved by sleep extension.36,37 Beyond this, sleepiness increased due to TSD. The experimental protocol allowed for a wide variation in conditions, from intense sleepiness to high arousal.
The functional connectivity analysis revealed a negative association between the functional connectivity with the thalamus and sleepiness in numerous areas. Even if the result was not significant, functional connectivity with the thalamus was negatively associated with subjective sleepiness in most areas of the brain, and the functional connectivity between the entire gray matter and thalamus displayed a negative association with subjective sleepiness. The KSS is a 9-level scale that evaluates states from high awakening to high sleepiness, with values less than 5 indicating a high arousal state. The adjacency matrix of thalamus-seed functional connectivity demonstrated a positive functional connectivity with the cortical regions and cerebellum at high arousal levels and negative functional connectivity at low arousal levels. The functional connectivity between the thalamus and cortex has been found to decrease with NREM sleep34 and TSD,32 which is consistent with our results. However, previous studies have not mentioned the polarity (positive or negative) of functional connectivity. Daytime sleepiness is negatively associated with the functional connectivity between the thalamus and cortex, and Killgore et al31 provided a graph that displays a positive correlation at high arousal levels and a negative correlation at low arousal levels, similar to our results.
We used “degree” (the number of edges connected to a node) in graph theory, which is the most representative measure of centrality, to show that as sleepiness increased, the degree of thalamic activity in the network connected with positive functional connectivity decreased, suggesting that the centrality of thalamic activity decreased in the network. Conversely, the degree in the network connected by negative functional connectivity increased, and the centrality of the thalamus increased. Positive functional connectivity reflects an excitatory projection50 and may reflect the thalamocortical projection loop for the promotion of high arousal levels. The biological interpretation of negative functional coupling is still controversial. Murphy et al reported that it is only apparently negative due to global signal regression, a pre-processing of functional connectivity, and that the reality reflects the extremely low positive functional connectivity.51 Some reports have indicated that the negative functional connectivity between the default mode network and task-positive network is an artifact52 or derived from biological signals.53 While a consensus has not yet been reached, animal studies have confirmed that negative functional binding actually reflects an inhibitory projection.54 If the negative functional connectivity actually reflects the inhibitory projection, it may reflect the intervention of thalamic reticular nucleus (TRN) neurons that receive projections from both cortical and thalamic neurons and have inhibitory projections within the thalamus.55 TRN neurons are known to receive inhibitory projections from brainstem reticular neurons, and when the projections from reticular neurons decrease with decreasing arousal, TRN neurons begin inhibitory projection into the thalamic nucleus. These results suggest that these neurodynamic changes may occur with the accompaniment of changes in sleepiness. Conversely, if negative functional connectivity is an apparent artifact, the results of this study can be interpreted as a linear decrease in thalamocortical projections with increasing sleepiness. Since the thalamus forms part of the attention network and is a relay point connecting external inputs and the cerebral cortex,3,33 the decreased thalamic-cortical association or increased inhibitory association can explain the reduced external attention responsiveness caused by sleepiness.
Alternatively, the association between the left and right thalami increased with increased subjective sleepiness, suggesting that an enhanced synchronization of activity was observed in the thalamus with increased sleepiness. Increased connectivity between the left and right thalami may depend on decreased cortical activity with increased sleepiness. Many of the homologous brain regions of the left and right hemispheres are connected by the corpus callosum and have a high functional connectivity.56 The results of this study can be interpreted as an apparent increase in the functional connectivity between the left and right thalami: during high arousal, the connectivity with the cortex distracted functional connectivity between the left and right thalami, while during low arousal, the connectivity with the cortex decreased as sleepiness increased. An examination of the intra-thalamus connectivity in wakefulness, sleep stage 1, and sleep stage 2, indicated that the functional connectivity between the left and right thalami and intra-thalamic nucleus connectivity increased as sleep deepened from wakefulness.57 In this study, it was confirmed that similar functional connectivity changes according to decreasing arousal level during non-sleep states expand the contribution of neural activity in the thalamus during sleep-wake control.
The right and left thalamic rCBF displayed a significant negative association with subjective sleepiness. Resting rCBF is thought to associate with local oxygen consumption, glucose utilization, and glycolysis associated with neural activity.47 Therefore, the changes in thalamic CBF observed here may reflect changes in the neural activity within this region. Our results indicate that the polarity of the functional connectivity between the thalamus and cortex changes from positive to negative, but the activity of the thalamus itself decreases. This phenomenon may be associated with the projections between the thalamus and cortex forming projection loops. During high alertness, there is an excitatory projection from the thalamus to the cortex, which triggers a subsequent reverse (cortex → thalamus) excitatory projection, resulting in further increases in thalamic neural activity. Conversely, when sleepiness is strong and the thalamus and cortex have an inhibitory relationship, such an increase in activity does not occur and consequently, it is presumed that the neural activity in the thalamus decreases relative to the high arousal level.
The functional association between the anterior cingulate cortex (ACC) and insular cortex, a component of the salience network (SN),58 displayed a strong positive association with subjective sleepiness. This result indicates that the functional connectivity within the SN increased with increased sleepiness. It is suggested that the SN, composed of the thalamus, ACC, and insula, switches between the default mode network59–61 related to internal attention and the dorsal attentional network related to external attention. Additionally, the ACC and insular activities associate with the sympathetic nervous system activities.62–65 Our results are consistent with previous research demonstrating that a lack of sleep enhances sympathetic activity and activity in emotion-related brain regions in response to emotional stimuli.66,67 Also, the functional connectivity between the ACC and posterior cingulate cortex displayed a strong negative association with subjective sleepiness, supporting the results from previous studies that during sleep, the connectivity decreases in the anterior and posterior central regions,68 and that the connectivity between the default mode network and salience network also decreases.35 Resting-state functional connectivity at rest is considered as a biomarker for mental illness in clinical practice; however, internal consistency regarding this is controversial.69 In addition, functional connectivity changes associated with sleepiness were observed in many brain regions. These results demonstrate that resting-state functional connectivity largely reflects the “state” as well as the “trait” of the individual, suggesting that the control of sleep and conscious states is essential when using fMRI indices as biomarkers.
The neurological mechanism behind these results is presumed as follows. State transition from wakefulness to sleep may be associated with the increased rate of positive functional connectivity (related to excitatory projection) between the thalamus and the entire brain, the decreased rate of negative functional connectivity (related to inhibitory projection), and the increased functional connectivity between the left and right thalami observed during increased sleepiness. The thalamus is thought to send excitatory signals to the cortex and synchronize cortical activity to generate EEG rhythms. The frequency is thought to depend on the membrane potential level of the thalamic neurons. Fast waves in the depolarized state, sleep spindles in the middle state, and delta wave bands in the deep hyperpolarization state were found in a previous study using cats.55 Additionally, the thalamus is associated with many phenomena in sleep. For example, the sleep spindle generated in sleep stage 2 is considered to arise from the thalamus.55 The thalamus also plays a major role in controlling slow oscillations below 1 Hz during deep sleep.70 Thalamic inactivation causes the loss of cortical synchronization in vivo, including the phenomenon of slow oscillation and β-γ band EEG activities.71 Many of the participants who reported high sleepiness in this study were considered to be in a transitional condition from awakening to sleep for a few minutes after TSD. This may be related to changes in the dynamics of the entire brain network and centered thalamus accompanied by changes in subjective sleepiness.
This study has some limitations. First, our methods did not allow us to assess the activity dynamics of individual neurons, so we can only speculate on the underlying neurological mechanism. Second, the sample size was relatively small. To simplify the process of data collection in the experiment including daily life activities such as changing clothes and showering, all the recruited participants were men, and the participants’ age ranged from 20–30 years; this may have affected the generalizability of our results to women and participants of other age groups. Since we could not prepare or set up the experimental equipment, we were unable to confirm whether the subjects had their eyes open or not. Although the purpose of this study was to examine the relationship between subjective sleepiness and brain activity as an index reflecting the qualia of consciousness, if objective indicators such as EEG could be measured at the same time, further elucidation might be possible.
Conclusion
Traditionally, the thalamus has been thought to be the brain region that comprises the acetylcholinergic ascending reticular activation system, which is important for arousal maintenance.72 However, extensive thalamic lesions in rodents have little effect on EEG records in the cortex and behavioral measurement during wakefulness, casting doubt on previously elucidated theories.73 Alternatively, intralaminar nucleus lesions in the thalamus of humans can cause coma74 and electrical stimulation to the thalamus promotes the recovery of some patients with impaired consciousness.75 Whether thalamic activity is associated with consciousness levels remains controversial.76 Our findings suggest a relationship between changes in subjective sleepiness and the thalamic network. Our graph-theoretical analysis is the first evidence that subjective sleepiness and the thalamic-cortical network dynamics are strongly related, indicating the usefulness of applying graph theory to functional brain images for studying sleepiness and consciousness. In addition to elucidating the state of sleepiness, our findings also help further the understanding of the neural basis of consciousness.
Abbreviations
ACC, anterior cingulate cortex; ASL, arterial spin labeling; BL, baseline; EEG, electroencephalogram; SE, extended sleep; FDR, false discovery rate; fMRI, functional magnetic resonance imaging; HS, habitual sleep; KSS, Karolinska sleepiness scale; MPRAGE, magnetic resonance rapid gradient-echo; rCBF, regional cerebral blood flow; ROI, region of interest; RS, recovery sleep; SN, salience network; SPM12, Statistical Parametric Mapping 12; TE, time to echo; TR, repetition time; TRN, thalamic reticular nucleus; TSD, total sleep deprivation.
Data Sharing Statement
The data is unavailable for sharing, since the consent for sharing of the data was not obtained from the participants.
Funding
This study was supported by a Grant-in-Aid for the Strategic Research Program for Brain Sciences (Understanding of molecular and environmental bases for brain health) from the Ministry of Education, Culture, Sports, Science and Technology of Japan, an Intramural Research Grant for Neurological and Psychiatric Disorders from the National Center of Neurology and Psychiatry (23-3), a JSPS KAKENHI (No. 25293255, 16K21657, 19H03578), and a Grant-in-Aid for JSPS Fellows (15J12161) and AMED (No JP19ak0101059).
Disclosure
The authors report no conflicts of interest in this work.
References
1. Basner M, Fomberstein KM, Razavi FM, et al. American time use survey: sleep time and its relationship to waking activities. Sleep. 2007;30(9):1085–1095. doi:10.1093/sleep/30.9.1085
2. Bonnet MH, Arand DL. We are chronically sleep deprived. Sleep. 1995;18(10):908–911. doi:10.1093/sleep/18.10.908
3. Breslau N, Roth T, Rosenthal L, Andreski P. Daytime sleepiness: an epidemiological study of young adults. Am J Public Health. 1997;87(10):1649–1653. doi:10.2105/AJPH.87.10.1649
4. Hublin C, Kaprio J, Partinen M, Koskenvuo M. Insufficient sleep–a population-based study in adults. Sleep. 2001;24(4):392–400. doi:10.1093/sleep/24.4.392
5. Kaneita Y, Ohida T, Uchiyama M, et al. Excessive daytime sleepiness among the Japanese general population. J Epidemiol. 2005;15(1):1–8. doi:10.2188/jea.15.1
6. Rajaratnam SMW, Arendt J. Health in a 24-h society. Lancet. 2001;358(9286):999–1005. doi:10.1016/S0140-6736(01)06108-6
7. Wu J, Wu H, Wang J, Guo L, Deng X, Lu C. Associations between sleep duration and overweight/obesity: results from 66,817 Chinese adolescents. Sci Rep. 2015;5:16686. doi:10.1038/srep16686
8. Kaneita Y, Ohida T, Uchiyama M, et al. The relationship between depression and sleep disturbances: a Japanese nationwide general population survey. J Clin Psychiatry. 2006;67(2):196–203. doi:10.4088/JCP.v67n0204
9. Ayas NT, White DP, Manson JAE, et al. A prospective study of sleep duration and coronary heart disease in women. Arch Intern Med. 2003;163(2):205–209. doi:10.1001/archinte.163.2.205
10. Grandner MA, Buxton OM, Jackson N, Sands-Lincoln M, Pandey A, Jean-Louis G. Extreme sleep durations and increased C-reactive protein: effects of sex and ethnoracial group. Sleep. 2013;36(5):769–779E. doi:10.5665/sleep.2646
11. Gallicchio L, Kalesan B. Sleep duration and mortality: a systematic review and meta-analysis. J Sleep Res. 2009;18(2):148–158. doi:10.1111/j.1365-2869.2008.00732.x
12. Cappuccio FP, D’Elia L, Strazzullo P, Miller MA. Sleep duration and all-cause mortality: a systematic review and meta-analysis of prospective studies. Sleep. 2010;33(5):585–592. doi:10.1093/sleep/33.5.585
13. Krueger PM, Friedman EM. Sleep duration in the United States: a cross-sectional population-based study. Am J Epidemiol. 2009;169(9):1052–1063. doi:10.1093/aje/kwp023
14. Durmer JS, Dinges DF. Neurocognitive consequences of sleep deprivation. Semin Neurol. 2005;25(1):117–129. doi:10.1055/s-2005-867080
15. Lim J, Dinges DF. A meta-analysis of the impact of short-term sleep deprivation on cognitive variables. Psychol Bull. 2010;136(3):375–389. doi:10.1037/a0018883
16. Fan J, McCandliss BD, Fossella J, Flombaum JI, Posner MI. The activation of attentional networks. Neuroimage. 2005;26(2):471–479. doi:10.1016/j.neuroimage.2005.02.004
17. Basner M, Rao H, Goel N, Dinges DF. Sleep deprivation and neurobehavioral dynamics. Curr Opin Neurobiol. 2013;23(5):854–863. doi:10.1016/j.conb.2013.02.008
18. Chee MWL, Tan JC. Lapsing when sleep deprived: neural activation characteristics of resistant and vulnerable individuals. Neuroimage. 2010;51(2):835–843. doi:10.1016/j.neuroimage.2010.02.031
19. Chee MWL, Chuah YML. Functional neuroimaging and behavioral correlates of capacity decline in visual short-term memory after sleep deprivation. Proc Natl Acad Sci U S A. 2007;104(22):9487–9492. doi:10.1073/pnas.0610712104
20. Tomasi D, Wang RL, Telang F, et al. Impairment of attentional networks after 1 night of sleep deprivation. Cereb Cortex. 2009;19(1):233–240. doi:10.1093/cercor/bhn073
21. Dinges DF, Powell JW. Microcomputer analyses of performance on a portable, simple visual RT task during sustained operations. Behav Res Methods Instruments Comput. 1985;17:652–655. doi:10.3758/BF03200977
22. Motomura Y, Kitamura S, Oba K, et al. Sleepiness induced by sleep-debt enhanced amygdala activity for subliminal signals of fear. BMC Neurosci. 2014;15:97. doi:10.1186/1471-2202-15-97
23. Van Dongen HPA, Bender AM, Dinges DF. Systematic individual differences in sleep homeostatic and circadian rhythm contributions to neurobehavioral impairment during sleep deprivation. Accid Anal Prev. 2012;45:11–16. doi:10.1016/j.aap.2011.09.018
24. Ahlström C, Anund A, Fors C, Åkerstedt T. Effects of the road environment on the development of driver sleepiness in young male drivers. Accid Anal Prev. 2018;112:127–134. doi:10.1016/j.aap.2018.01.012
25. Carskadon MA. Guidelines for the Multiple Sleep Latency Test (MSLT): a standard measure of sleepiness. Sleep. 1986;9(4):519–524. doi:10.1093/sleep/9.4.519
26. Herbert V, Pratt D, Emsley R, Kyle SD. Predictors of nightly subjective-objective sleep discrepancy in poor sleepers over a seven-day period. Brain Sci. 2017;7(12):29. doi:10.3390/brainsci7030029
27. Kay DB, Karim HT, Soehner AM, et al. Subjective-objective sleep discrepancy is associated with alterations in regional glucose metabolism in patients with insomnia and good sleeper controls. Sleep. 2017;40(11). doi:10.1093/sleep/zsx155.
28. Dinapoli EA, Gebara MA, Kho T, et al. Subjective-objective sleep discrepancy in older adults with MCI and subsyndromal depression. J Geriatr Psychiatry Neurol. 2017;30(6):316–323. doi:10.1177/0891988717731827
29. Rezaie L, Fobian AD, McCall WV, Khazaie H. Paradoxical insomnia and subjective–objective sleep discrepancy: a review. Sleep Med Rev. 2018;40:196–202. doi:10.1016/j.smrv.2018.01.002
30. Webb WB. The natural onset of sleep. In: Sleep 1978, Fourth European Congress on Sleep Reseach. SAGE; 1980:19–23.
31. Killgore WDS, Vanuk JR, Knight SA, et al. Daytime sleepiness is associated with altered resting thalamocortical connectivity. Neuroreport. 2015;26(13):779–784. doi:10.1097/WNR.0000000000000418
32. Shao Y, Wang L, Ye E, et al. Decreased thalamocortical functional connectivity after 36 hours of total sleep deprivation: evidence from resting state fMRI. PLoS One. 2013;8(10):e78830. doi:10.1371/journal.pone.0078830
33. Jones EG. The anatomy of sensory relay functions in the thalamus. Prog Brain Res. 1991;87:29–52.
34. Picchioni D, Pixa ML, Fukunaga M, et al. Decreased connectivity between the thalamus and the neocortex during human nonrapid eye movement sleep. Sleep. 2014;37(2):387–397. doi:10.5665/sleep.3422
35. Chang C, Liu Z, Chen MC, Liu X, Duyn JH. EEG correlates of time-varying BOLD functional connectivity. Neuroimage. 2013;72:227–236. doi:10.1016/j.neuroimage.2013.01.049
36. Kitamura S, Katayose Y, Nakazaki K, et al. Estimating individual optimal sleep duration and potential sleep debt. Sci Rep. 2016;6:35812. doi:10.1038/srep35812
37. Motomura Y, Kitamura S, Nakazaki K, et al. Recovery from unrecognized sleep loss accumulated in daily life improved mood regulation via prefrontal suppression of amygdala activity. Front Neurol. 2017;8:306. doi:10.3389/fneur.2017.00306
38. Sadeh A, Sharkey KM, Carskadon MA. Activity-based sleep-wake identification: an empirical test of methodological issues. Sleep. 1994;17(3):201–207. doi:10.1093/sleep/17.3.201
39. Mitler MM, Gujavarty KS, Browman CP. Maintenance of wakefulness test: a polysomnographic technique for evaluating treatment efficacy in patients with excessive somnolence. Electroencephalogr Clin Neurophysiol. 1982;53(6):658–661. doi:10.1016/0013-4694(82)90142-0
40. Katsunuma R, Oba K, Kitamura S, et al. Unrecognized sleep loss accumulated in daily life can promote brain hyperreactivity to food cue. Sleep. 2017;40(10):zsx137. doi:10.1093/sleep/zsx137
41. Akerstedt T, Gillberg M. Subjective and objective sleepiness in the active individual. Int J Neurosci. 1990;52:29–37. doi:10.3109/00207459008994241
42. Kaida K, Takahashi M, Åkerstedt T, et al. Validation of the Karolinska sleepiness scale against performance and EEG variables. Clin Neurophysiol. 2006;117(7):1574–1581. doi:10.1016/j.clinph.2006.03.011
43. Power JD, Barnes KA, Snyder AZ, Schlaggar BL, Petersen SE. Spurious but systematic correlations in functional connectivity MRI networks arise from subject motion. Neuroimage. 2012;59(3):2142–2154. doi:10.1016/j.neuroimage.2011.10.018
44. Muschelli J, Nebel MB, Caffo BS, Barber AD, Pekar JJ, Mostofsky SH. Reduction of motion-related artifacts in resting state fMRI using aCompCor. Neuroimage. 2014;96:22–35. doi:10.1016/j.neuroimage.2014.03.028
45. Benjamini Y, Hochberg Y. Controlling the false discovery rate: a practical and powerful approach to multiple testing. J R Stat Soc Ser B. 1995;57(1):289–300.
46. Rubinov M, Sporns O. Complex network measures of brain connectivity: uses and interpretations. Neuroimage. 2010;52(3):1059–1069. doi:10.1016/j.neuroimage.2009.10.003
47. Vaishnavi SN, Vlassenko AG, Rundle MM, Snyder AZ, Mintun MA, Raichle ME. Regional aerobic glycolysis in the human brain. Proc Natl Acad Sci U S A. 2010;107(41):17757–17762. doi:10.1073/pnas.1010459107
48. Dai W, Varma G, Scheidegger R, Alsop DC. Quantifying fluctuations of resting state networks using arterial spin labeling perfusion MRI. J Cereb Blood Flow Metab. 2016;36(3):463–473. doi:10.1177/0271678X15615339
49. Wang Z, Aguirre GK, Rao H, et al. Empirical optimization of ASL data analysis using an ASL data processing toolbox: ASLtbx. Magn Reson Imaging. 2008;26(2):261–269. doi:10.1016/j.mri.2007.07.003
50. Ma Y, Shaik MA, Kozberg MG, et al. Resting-state hemodynamics are spatiotemporally coupled to synchronized and symmetric neural activity in excitatory neurons. Proc Natl Acad Sci U S A. 2016;113(52):E8463–8471. doi:10.1073/pnas.1525369113
51. Murphy K, Birn RM, Handwerker DA, Jones TB, Bandettini PA. The impact of global signal regression on resting state correlations: are anti-correlated networks introduced? Neuroimage. 2009;44(3):893–905. doi:10.1016/j.neuroimage.2008.09.036
52. Anderson JS, Druzgal TJ, Lopez-Larson M, Jeong EK, Desai K, Yurgelun-Todd D. Network anticorrelations, global regression, and phase-shifted soft tissue correction. Hum Brain Mapp. 2011;32(6):919–934. doi:10.1002/hbm.21079
53. Chang C, Glover GH. Effects of model-based physiological noise correction on default mode network anti-correlations and correlations. Neuroimage. 2009;47(4):1448–1459. doi:10.1016/j.neuroimage.2009.05.012
54. Liang Z, King J, Zhang N. Anticorrelated resting-state functional connectivity in awake rat brain. Neuroimage. 2012;59(2):1190–1199. doi:10.1016/j.neuroimage.2011.08.009
55. Steriade M. Corticothalamic resonance, states of vigilance and mentation. Neuroscience. 2000;101(2):243–276.
56. Stark DE, Margulies DS, Shehzad ZE, et al. Regional variation in interhemispheric coordination of intrinsic hemodynamic fluctuations. J Neurosci. 2008;28(51):13754–13764. doi:10.1523/JNEUROSCI.4544-08.2008
57. Hale JR, White TP, Mayhew SD, et al. Altered thalamocortical and intra-thalamic functional connectivity during light sleep compared with wake. Neuroimage. 2016;125:657–667. doi:10.1016/j.neuroimage.2015.10.041
58. Sridharan D, Levitin DJ, Menon V. A critical role for the right fronto-insular cortex in switching between central-executive and default-mode networks. Proc Natl Acad Sci U S A. 2008;105(34):12569–12574. doi:10.1073/pnas.0800005105
59. Raichle ME, MacLeod AM, Snyder AZ, Powers WJ, Gusnard DA, Shulman GL. A default mode of brain function. Proc Natl Acad Sci U S A. 2001;98(2):676–682. doi:10.1073/pnas.98.2.676
60. Esposito F, Aragri A, Pesaresi I, et al. Independent component model of the default-mode brain function: combining individual-level and population-level analyses in resting-state fMRI. Magn Reson Imaging. 2008;26(7):905–913. doi:10.1016/j.mri.2008.01.045
61. Thomason ME, Chang CE, Glover GH, Gabrieli JDE, Greicius MD, Gotlib IH. Default-mode function and task-induced deactivation have overlapping brain substrates in children. Neuroimage. 2008;41(4):1493–1503. doi:10.1016/j.neuroimage.2008.03.029
62. Yoshihara K, Tanabe HC, Kawamichi H, et al. Neural correlates of fear-induced sympathetic response associated with the peripheral temperature change rate. Neuroimage. 2016;134:522–531. doi:10.1016/j.neuroimage.2016.04.040
63. Patterson JC, Ungerleider LG, Bandettini PA. Task-independent functional brain activity correlation with skin conductance changes: an fMRI study. Neuroimage. 2002;17(4):1797–1806. doi:10.1006/nimg.2002.1306
64. Critchley HD, Corfield DR, Chandler MP, Mathias CJ, Dolan RJ. Cerebral correlates of autonomic cardiovascular arousal: a functional neuroimaging investigation in humans. J Physiol. 2000;523(1):259–270. doi:10.1111/j.1469-7793.2000.t01-1-00259.x
65. Critchley HD, Tang J, Glaser D, Butterworth B, Dolan RJ. Anterior cingulate activity during error and autonomic response. Neuroimage. 2005;27(4):885–895. doi:10.1016/j.neuroimage.2005.05.047
66. Zhong X, Hilton HJ, Gates GJ, et al. Increased sympathetic and decreased parasympathetic cardiovascular modulation in normal humans with acute sleep deprivation. J Appl Physiol. 2005;98(6):2024–2032. doi:10.1152/japplphysiol.00620.2004
67. Franzen PL, Buysse DJ, Dahl RE, Thompson W, Siegle GJ. Sleep deprivation alters pupillary reactivity to emotional stimuli in healthy young adults. Biol Psychol. 2009;80(3):300–305. doi:10.1016/j.biopsycho.2008.10.010
68. Horovitz SG, Braun AR, Carr WS, et al. Decoupling of the brain’s default mode network during deep sleep. Proc Natl Acad Sci U S A. 2009;106(27):11376–11381. doi:10.1073/pnas.0901435106
69. Noble S, Scheinost D, Constable RT. A decade of test-retest reliability of functional connectivity: a systematic review and meta-analysis. Neuroimage. 2019;203:116157. doi:10.1016/j.neuroimage.2019.116157
70. Neske GT. The slow oscillation in cortical and thalamic networks: mechanisms and functions. Front Neural Circuits. 2016;9:88. doi:10.3389/fncir.2015.00088
71. Lemieux M, Chen JY, Lonjers P, Bazhenov M, Timofeev I. The impact of cortical deafferentation on the neocortical slow oscillation. J Neurosci. 2014;34(16):5689–5703. doi:10.1523/JNEUROSCI.1156-13.2014
72. Moruzzi G, Magoun HW. Brain stem reticular formation and activation of the EEG. Electroencephalogr Clin Neurophysiol. 1949;1(1–4):455–473. doi:10.1016/0013-4694(49)90219-9
73. Fuller P, Sherman D, Pedersen NP, Saper CB, Lu J. Reassessment of the structural basis of the ascending arousal system. J Comp Neurol. 2011;519(5):933–956. doi:10.1002/cne.22559
74. Bogen JE. On the neurophysiology of consciousness: 1. an overview. Conscious Cogn. 1995;4(1):52–62. doi:10.1006/ccog.1995.1003
75. Schiff ND, Giacino JT, Kalmar K, et al. Behavioural improvements with thalamic stimulation after severe traumatic brain injury. Nature. 2007;448:600–603. doi:10.1038/nature06041
76. Koch C, Massimini M, Boly M, Tononi G. Neural correlates of consciousness: progress and problems. Nat Rev Neurosci. 2016;17(5):307–321. doi:10.1038/nrn.2016.22
 © 2021 The Author(s). This work is published and licensed by Dove Medical Press Limited. The full terms of this license are available at https://www.dovepress.com/terms.php and incorporate the Creative Commons Attribution - Non Commercial (unported, v3.0) License.
By accessing the work you hereby accept the Terms. Non-commercial uses of the work are permitted without any further permission from Dove Medical Press Limited, provided the work is properly attributed. For permission for commercial use of this work, please see paragraphs 4.2 and 5 of our Terms.
© 2021 The Author(s). This work is published and licensed by Dove Medical Press Limited. The full terms of this license are available at https://www.dovepress.com/terms.php and incorporate the Creative Commons Attribution - Non Commercial (unported, v3.0) License.
By accessing the work you hereby accept the Terms. Non-commercial uses of the work are permitted without any further permission from Dove Medical Press Limited, provided the work is properly attributed. For permission for commercial use of this work, please see paragraphs 4.2 and 5 of our Terms.