")
Back to Journals » Clinical Ophthalmology » Volume 15
The Role of Multimodal Approach in the Assessment of Glaucomatous Damage in High Myopes
Authors Baptista PM , Vieira R , Ferreira A , Figueiredo A, Sampaio I, Reis R, Menéres MJ
Received 13 January 2021
Accepted for publication 25 February 2021
Published 8 March 2021 Volume 2021:15 Pages 1061—1071
DOI https://doi.org/10.2147/OPTH.S301781
Checked for plagiarism Yes
Review by Single anonymous peer review
Peer reviewer comments 3
Editor who approved publication: Dr Scott Fraser
Pedro Manuel Baptista,1,2 Rita Vieira,1 André Ferreira,1,3 Ana Figueiredo,1 Isabel Sampaio,1 Rita Reis,1 Maria João Menéres1,2
1Ophthalmology Department, Centro Hospitalar Universitário do Porto, Porto, Portugal; 2Instituto de CIências Biomédicas Abel Salazar, Universidade do Porto, Porto, Portugal; 3Department of Biomedicine – Unit of Anatomy, Faculty of Medicine, Universidade do Porto, Porto, Portugal
Correspondence: Pedro Manuel Baptista
Centro Hospitalar Universitário do Porto, Largo Prof. Abel Salazar, Porto, 4099-001, Portugal
Tel +35 1917868372
Email [email protected]
Purpose: To compare the optic disc structure and peripapillary retinal function between high myopes with and without glaucoma and to address the differential role of papillary optical coherence tomography angiography (OCT-A) and circumpapillary microperimetry (cpMP) on the diagnosis and prognosis of this patients.
Patients and Methods: It is a cross-sectional study including 30 high myopic patients (60 eyes), divided into 15 with (GG) and 15 without glaucoma (NGG). Demographic and clinical data were collected from patient records. Papillary structure (peripapillary retinal nerve fiber layer thickness, ppRNFLTs) and vascularization (small vessel densities, SVD´s) were assessed with SD-OCT (RTVue XR Avanti, with AngioVue system, Optovue®). cpMP was carried out with the MP-3 microperimeter (Nidek®).
Results: The GG were older, had lower best-corrected visual acuities and higher intraocular pressures and axial lengths (p< 0.001). The GG showed lower values in all ppRNFLTs (p< 0.05), lower values in all SVDs (p< 0.001), except the SVD-inside disc (p=0.638) and lower retinal sensitivities within all cpMPs (p< 0.001). The adjusted analysis computing the best two parameters per exam revealed that the anatomical model including the ppRNFLT-inferior and ppRNFLT-temporal and the vascular model including SVD-inferior and SVD-superior had the best discrimination power between groups, with cross-validated AUROCs of 0.9599 and 0.9921, respectively.
Conclusion: Despite the apparent superiority of the papillary vascular study, a multimodal approach including the papillary anatomic and circumpapillary microperimetric assessments can be the new way on the diagnosis and prognosis of glaucoma in high myopia.
Keywords: glaucoma, high myopia, peripapillary retinal nerve fiber layer thickness, optic disc dysgenesis, papillary optical coherence tomography angiography, circumpapillary microperimetry
Introduction
Myopia affects more than 1.4 billion people worldwide and its prevalence is increasing.1 In 2050, half of the population worldwide is estimated to have myopia, with 9.8% presenting a severe form, high myopia (HM).1 These facts highlight the importance of preventive care against the progression of myopia and its associated ocular complications, possibly leading to vision loss.
Biomechanical properties of the sclera and scleral lamina cribrosa determine the biomechanical changes of the optic nerve head, and these changes are known to play an important role in the pathologic process of retinal ganglion cells (RGC) loss and optic nerve damage.2 Since both HM eyes and open-angle glaucoma (OAG) eyes may present pathological lamina cribosa,3 it is not well established whether this might be the main factor linking these two entities. Although the pathophysiologic mechanisms underlying the association between HM and OAG remain unclear, a 2- to 3-fold increased risk of glaucoma has been reported in eyes with HM.4
Evidence of abnormal peripapillary microvasculature has been observed in HM individuals,5 and axial length has been shown to negatively correlate with the peripapillary microvasculature, but not with the parafoveal retinal flow index,6 suggesting ocular elongation may lead to decreased blood circulation and microvascular attenuation in the optic nerve head. Previous investigations have implicated vascular factors in the pathogenesis of OAG7 and have even demonstrated peripapillary microvascular attenuation to a greater extent in OAG, when compared to myopia.8
Despite the frequent alterations in peripapillary retinal nerve fiber layer thickness (ppRNFLT) measurement, due to the particular anatomy of the myopic optic disk,6,9,10 a positive correlation between ppRNFLT and the peripapillary retinal perfusion parameters has been reported.6
HM negatively influences macular retinal sensitivities, which holds an important limitation to static automated perimetry (SAP) measurements. Therefore, the assessment of the functional evaluation of glaucoma and structure-function correlation by means of a method capable of avoiding the macular area would be of great clinical interest. In this sense, circumpapillary microperimetry (cpMP) is the latest focus regarding MP, and recent studies11,12 have shown favourable diagnostic performance in OAG; however, there is a lack of evidence concerning the role of cpMP in HM.
This study aims to address the differential role from a multimodal assessment, including Spectral-Domain Optical Coherence Tomography (SD-OCT), OCT angiography (OCT-A) and MP, on the diagnosis and prognosis of these patients.
Patients and Methods
Design
The observational cross-sectional study set in the Ophthalmology Department, Centro Hospitalar Universitário do Porto, Porto, Portugal, a tertiary center. The study adhered to the tenets of the Declaration of Helsinki and its latest amendment (Brazil, 2013). Approval was obtained from the ‘Departamento de Ensino, Formação e Investigação’ (DEFI), nr: 130-DEFI-132-CE. The informed consent from the patients was waived by the DEFI due to total anonymization and confidentiality of the data and the absence of detailed individual data.
Population
Two groups of high myopic eyes were created, one with glaucoma diagnosis (GG) and another without glaucoma (NGG). The GG eyes were selected from the database of the glaucoma section outpatient clinic. The OAG diagnosis was defined by an open anterior chamber angle on gonioscopy associated with a glaucomatous appearing optic nerve (ie, neuroretinal rim thinning or notching) and the need for intraocular pressure (IOP) lowering medication or average ppRNFLT decrease on OCT greater than the 95% CI of the mean. The NGG eyes were selected from the database of the refractive surgery section outpatient clinic. Inclusion criteria for the NGG were normal-appearing optic discs, IOP of 21 mmHg or less, absence of IOP lowering medication history, an open anterior chamber angle on gonioscopy and no chronic ocular or systemic corticosteroid use. Exclusion criteria for both groups were: axial length (AL) <25.00 mm; concurrent optic nerve diseases; myopic maculopathy according to the ATN classification13 (Atrophy component ≥2; tractional component ≥1; neovascular component ≥1); diabetes mellitus and cardiovascular disease other than treated systemic hypertension; previous ocular surgeries; impaired ability to perform tests due to media opacities, ocular motricity problems or neurological and psychiatric status.
Data Gathering
Data were collected including age, gender, topical anti-ocular hypertensive (anti-OHT) medications, and ophthalmic and systemic history. Comprehensive ophthalmic examination data were analysed, including measurements of best-corrected visual acuity (BCVA, Snellen), anterior segment slit lamp biomicroscopy, IOP measurement using Goldmann applanation tonometer (GAT-IOP) and adjusted for the central corneal thickness (CCT) and dilated fundus examination using a 90-diopter noncontact slit-lamp lens. Pachymetry was obtained through the TRK-2P (TOPCON®). AL was obtained by an optical biometer with swept-source optical coherence tomography (SS-OCT) technology (IOL Master 700, Zeiss®).
OCT Imaging Protocols
Papillary structure and vascularization were assessed with SD-OCT (RTVue XR Avanti, with AngioVue system, Optovue®). Optic disc structural parameters were evaluated using the traditional optic nerve head (ONH) scan. It consists of 12 radial scans 3.4 mm in length and 6 concentric ring scans ranging from 2.5 to 4.0 mm in diameter, all centred on the optic disc. The retinal pigment epithelium (RPE) tips are automatically detected by the software and are joined to delineate the optic disc margin. After automated detection of the interior boundary of the neural rim, the vertical cup-to-disc ratio (CDR) and the Neurorretinal Rim Area (NRRA) are calculated. The ppRNFLT measurements were automatically calculated using the retinal map protocol in the Avanti software (full RNFL thickness defined by the algorithm as the distance between the ILM and the middle of the RPE). The total mean (ppRNFLT-TOTAL) values and information by sectors (inferior, ppRNFLT-I; superior, ppRNFLT-S; nasal, ppRNFLT-N; temporal, ppRNFLT-T) were presented after an adjustment for the effect of ocular magnification related to the axial length, made by Kang’s method.14 The en-face papillary retinal small vessel densities (SVDs, %), defined as the total length of perfused vasculature per unit area in a region of measurement, were obtained through the AngioAnalytics™ technology for the entire 4.5 × 4.5 mm image centred in the optic disc (whole image, SVD-W), for the region inside the optic disc boundary (inside disc, SVD-IN) and for the region of 750 µm-wide elliptical annulus extending from the optic disc boundary (peripapillary, SVD-PP). The SVD was further analysed by sectors: inferior (SVD-I), superior (SVD-S), nasal (SVD-N) and temporal (SVD-T). An example of the print-out analysed is in Figure 1.
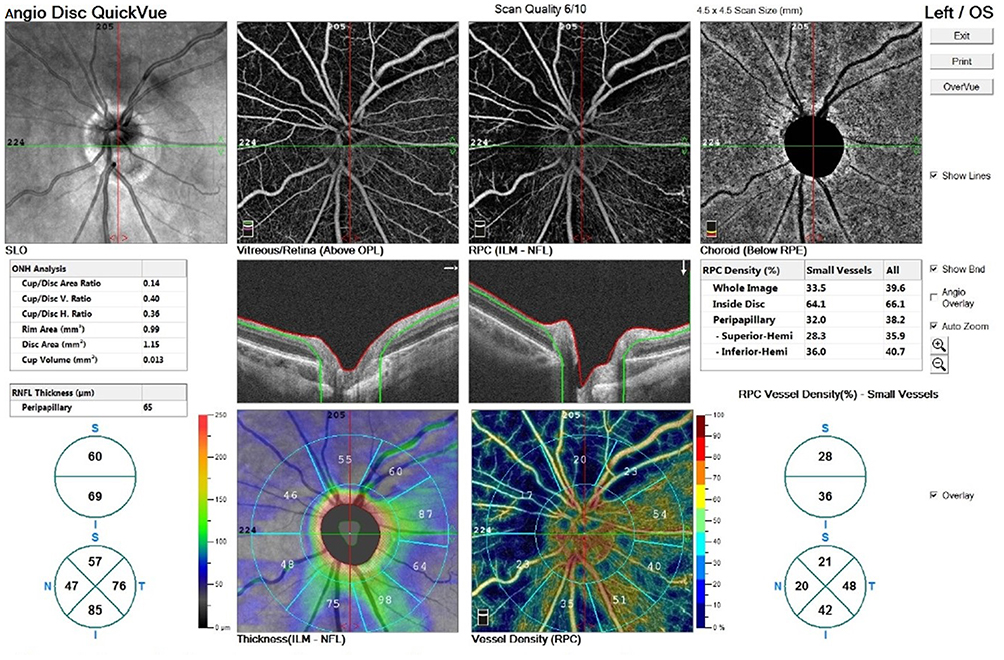 |
Figure 1 Example of a print-out from the papillary anatomic and vascular assessments (RTVue XR Avanti, with AngioVue system, Optovue®). |
Static Automated Perimetry (SAP)
Visual field (VF) function was assessed in the GG through the Humphrey Visual Field Analyser 3 (Zeiss®). Values from visual field index (VFI), mean deviation (MD) and pattern standard deviation (PSD) measured using the 30.2 Swedish Interactive Threshold Algorithm (SITA) standard protocol were evaluated. Only reliable scans were included.
Circumpapillary Microperimetric Assessment
cpMP was carried out with the MP-3 microperimeter (Nidek®). The diameter of the measurement circle, which was manually centred on the middle of the optic disk, was 3.45 mm, and 12 measurement sites were distributed evenly around the circle (3.0° apart). The eye-tracking function was used during the examinations, which were performed in a dimly light room, after subjects’ pupils had been dilated with eyedrops containing a combination of 0.5% phenylephrine hydrochloride and 0.5% tropicamide. The stimulus was equal in size to a Goldmann III stimulus. Background luminance was set at 31.4 apostilbs, maximum luminance was 10.000 apostilbs, the dynamic range of the stimulus was set at 34 dB, and a single red cross at 1° was employed as a fixation target. A 4–2 staircase-threshold strategy was used to estimate visual sensitivity. Only stable-fixation test results (ie, those for which the subject exhibited fixation control within 1° of the centre of the fixation target in ≥75% of tests) were included. Results are presented as the mean values of retinal sensitivities (dB) from all the 12 measurement sites (cpMP-TOTAL) and for each quadrant after the division of the 12 sites by 4 equal sectors (inferior (cpMP-I), superior (cpMP-S), nasal (cpMP-N) and temporal (cpMP-T). An example of the print-out analysed is in Figure 2.
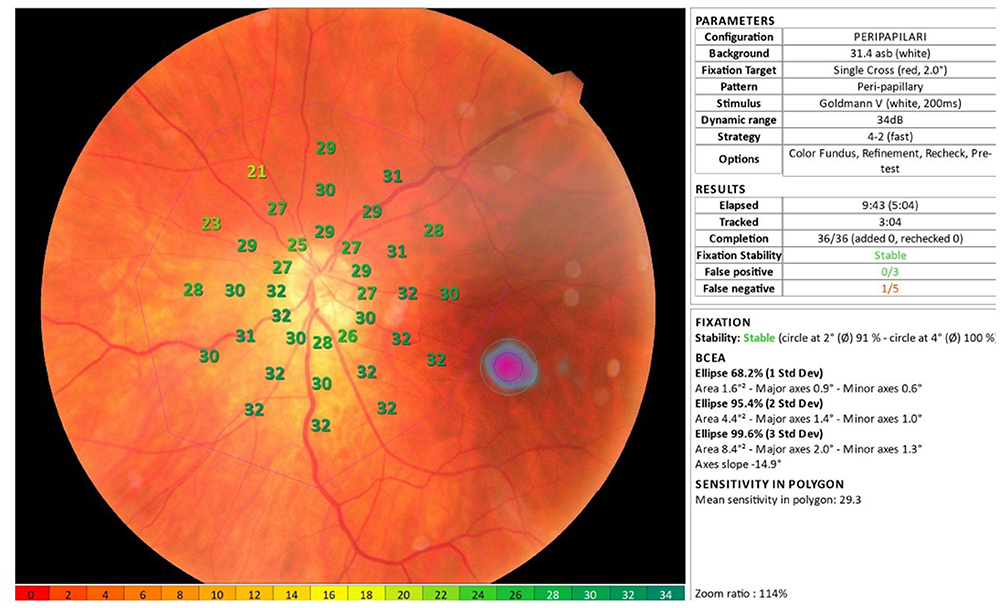 |
Figure 2 Example of a print-out from the circumpapillary microperimetric assessment (MP-3 microperimeter, Nidek®). |
Statistical Analysis
All analysis was performed using the SPSS® and Stata® software. Normality of the data was tested with the Shapiro-Wilk and Kolmogorov–Smirnov tests. When parametric analysis could be applied, the Student’s t-test for independent samples was used to compare groups. When nonparametric tests were needed, the Wilcoxon rank-sum test was applied. Logistic regression (LR) was performed in three steps to find the best glaucoma predictors and the best model per exam, namely: 1) unadjusted simple LR; 2) adjusted LR for pachymetry and axial length including a single predictor; 3) the best model per exam, adjusted for pachymetry and axial length, considering the sample size. The areas under receiving operating characteristic (ROC) curves (AUROCs) were used to test the predictive value of each analysis. Internal validation of the models was performed using the cvauroc package for Stata.15 A 6-fold cross-validation was performed to calculate the mean cross-validation AUROC (cvAUROC), with 1994 as the random seed. The 95% confidence interval (CI) of cvAUROC was computed by the Bootstrap method. All values are shown as mean ± standard deviation unless otherwise specified. All p-values (p) were 2-sided, and p-values <0.05 were considered significant.
Results
A stepwise analysis through three steps was carried out in the present study.
First Step
The first step was a direct comparison between the GG (VFI 68.9 ± 24.4%; MD 13.3 ± 7.7 dB; PSD 7.8 ± 3.4 dB) and NGG. Regarding clinical and demographic data, the GG were older, had lower BCVA and higher mean values of GAT-IOP and AL (p<0.001 in all). However, no differences were found in the CCT between groups (p=0.890). Analysing the optic disc anatomical data, the GG showed lower values in all ppRNFLT’s (p<0.05 in all) but no differences in the CDR (p=0.077) and the NRRA (p=0.524). Regarding the papillary small vessel density analysis, the GG showed lower values in all SVDs (p<0.001), except the SVD-IN (p=0.638). The cpMP assessment showed lower retinal sensitivities within all cpMP parameters in the GG (p<0.001 in all). All results are described in Table 1.
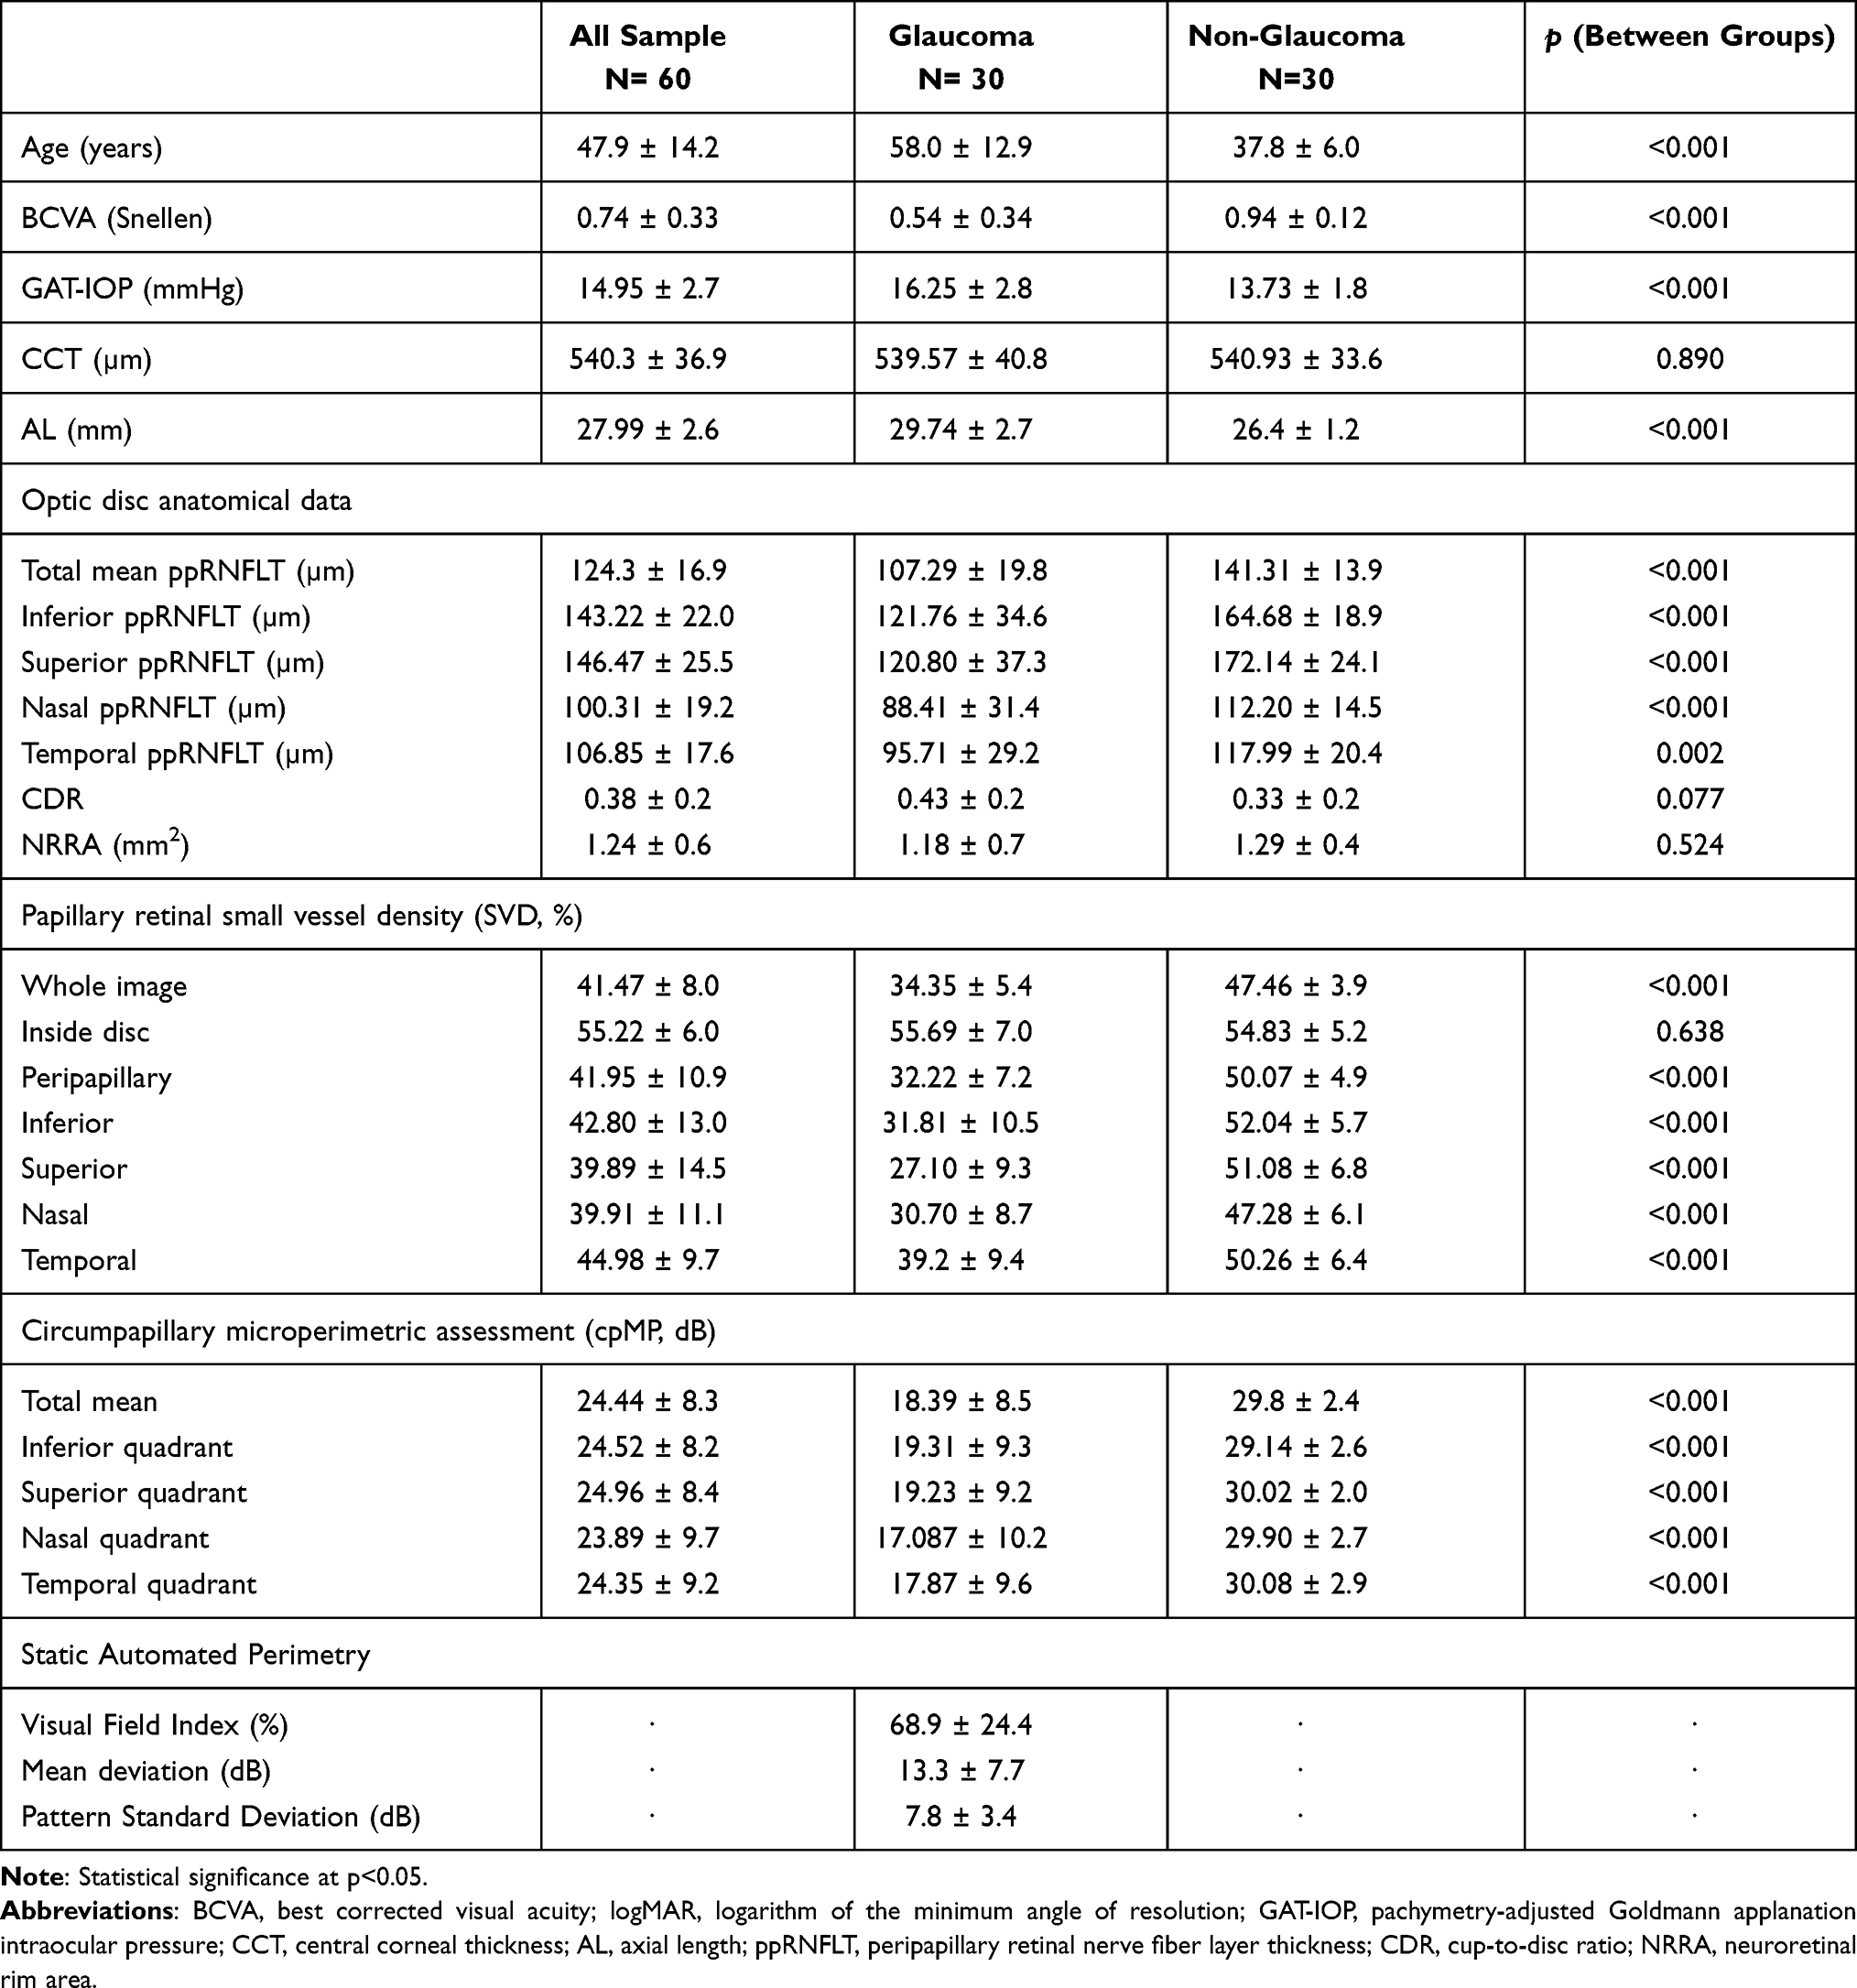 |
Table 1 Overall and per Group Analysis |
Second Step
The second step included the calculation of ROC curves and the respective AUROCs in order to address the discriminatory power of each variable between the GG and the NGG. Table 2 presents the univariable (unadjusted) and multivariable (adjusted for CCT and AL) logistic regression models, including cvAUROCs.
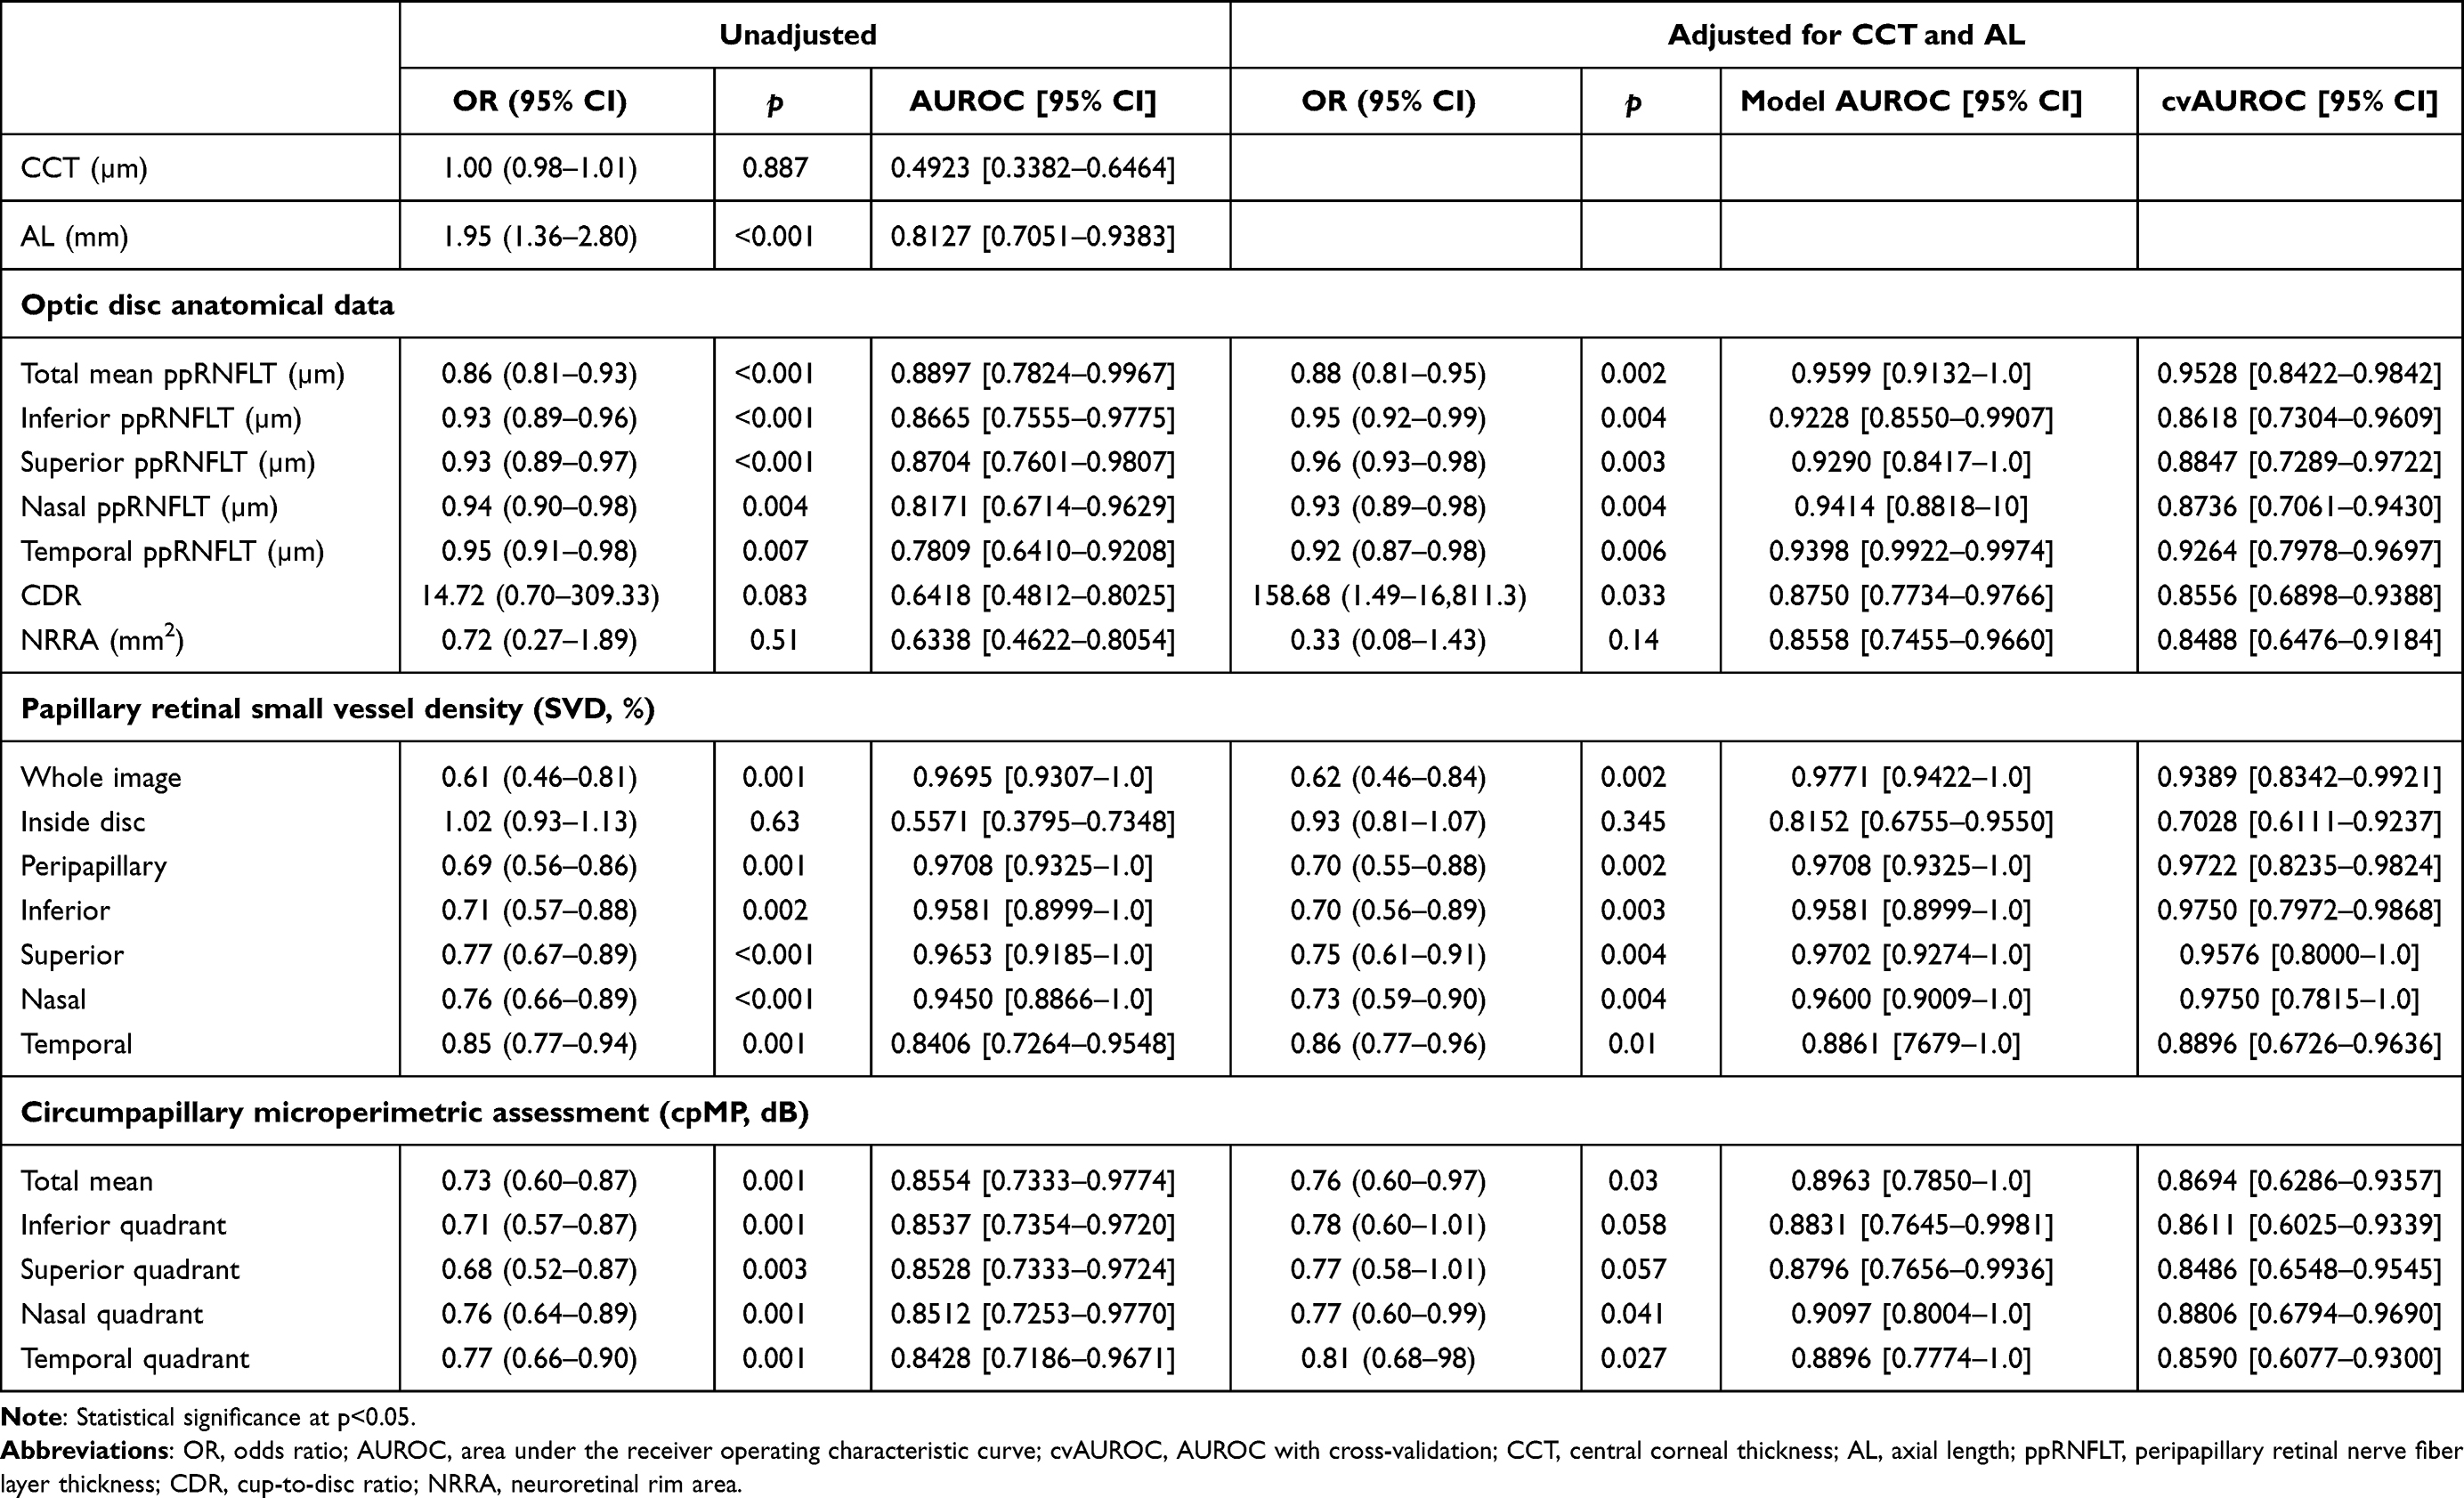 |
Table 2 Discriminative Power of Each Variable |
Regarding the univariable analysis, all factors (p<0.05 in all) but CCT (p=0.887), CDR (p=0.083), NRRA (p=0.51) and SVD-IN (p=0.63) were significantly different between groups, displaying AUROCs for discrimination above 0.75. After adjusting for CCT and AL, only NRRA (p=0.14), SVD-in (p=0.345), cpMP-I (p=0.058) and cpMP-S (p=0.057) were not different between groups, with all other variables (p<0.05 in all) displaying cvAUROCs for discrimination above 0.85. Unadjusted AUROCs higher than 0.9 were found only within papillary small vessel density analysis, for the SVD-W, SVD-PP, SVD-I, SVD-S and SVD-N. On the other hand, adjusted cvAUROCs higher than 0.9 were found in the same SVDs plus ppRNFLT-TOTAL and ppRNFLT-T.
Third Step
The third step included the construction of the best multivariable regression models to discriminate both groups by each approach: the anatomical, the vascular and the microperimetric. The adjusted analysis computing the best two parameters per exam revealed that the models including the ppRNFLT-I (0.008) and ppRNFLT-T (p=0.012) – for the anatomical model – and the SVD-I (p=0.049) and SVD-S (p=0.048) – for the vascular model – had the best discrimination power between groups, with AUROCs of 0.9599 (Figure 3) and 0.9921 (Figure 4), respectively. The cvAUROCs with 95% CI were 0.9472 (0.8609–1.0) for the anatomical model and 0.9896 (0.8889–1.0) for the vascular model. For the microperimetry analysis, no model was made due to high collinearity.
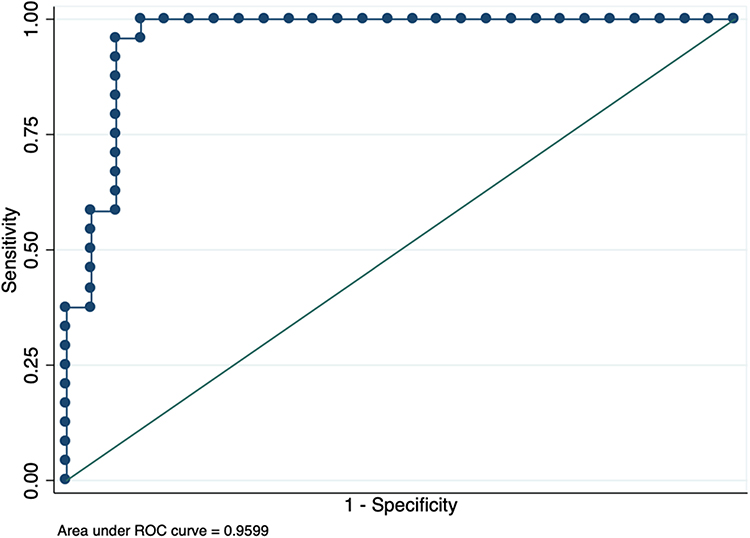 |
Figure 3 Best 2-variable papillary anatomic model to predict the presence of glaucoma in eyes with high myopia, including the peripapillary retinal nerve fiber layer thickness of the temporal and inferior sectors. |
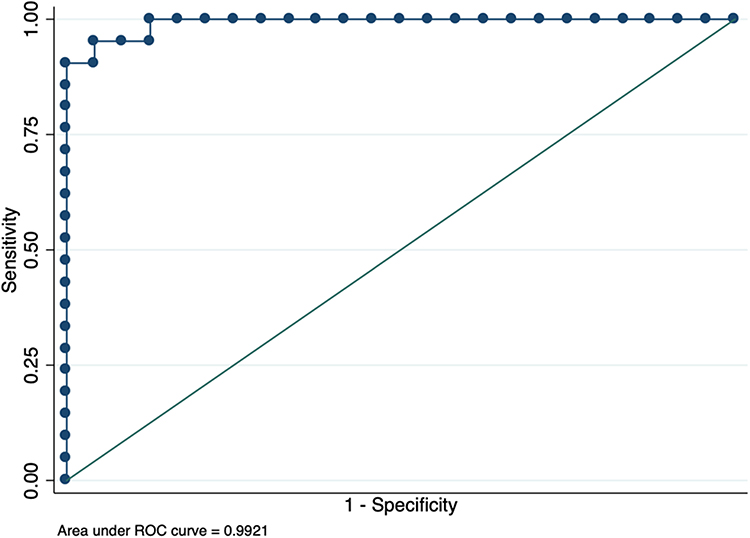 |
Figure 4 Best 2-variable papillary vessel density model to predict the presence of glaucoma in eyes with high myopia, including the en-face papillary retinal small vessel densities of the inferior and superior sectors. |
Discussion
Papillary Anatomic Assessment
The idea of a loss in ppRNFLT with age is not consensual, since the steadiness of this structure was studied in a report of 298 eyes with Fourier domain Optovue OCT.16 The same report showed significant thinning in both the average and in superior and inferior sectors, along with increasing AL.16 This is in line with the results of the present study, as the ppRNFLT-S and ppRNFLT-I were the anatomic parameters presenting the greatest absolute differences between GG and NGG, minimizing the impact of potential bias resulting from the older ages in the GG group.
Differences found in the ppRNFLT between normal and HM eyes, measured by OCT, should be considered. First, due to the described ocular magnification effect,17 in longer eyes, the scan circle of ppRNFLT measurements can be larger, given values from a zone further away from the optic disc and, thus, erroneously lower. To overcome this bias, all the presented RNFLT values are adjusted by Kang´s method.14 Additionally, the tilted disc configuration and peripapillary atrophy – which are highly prevalent optic disc findings in eyes with HM – often obscure reliable assessments of the neuroretinal rim configuration and optic disc excavation. Although OCT may afford reproducible measurements of the ppRNFLT,18 detection of abnormalities in these eyes is complicated by high rates of false-positive errors. This is possibly due to the lack of individuals with high myopia being included in the normative databases of many OCT instruments,19,20 and it can, therefore, be less useful than ONH analysis.21
Previous studies have shown that myopic eyes present lower mean ppRNFLT measurements in OCT, when compared to emmetropic eyes.9,19,22,23 Additionally, myopia has also been shown to affect the distribution pattern of ppRNFLT around the optic disc,22 with superotemporal and inferotemporal RNFL bundles tending to converge temporally with increasing severity of myopia.24,25 In fact, a different pattern presenting thicker measurements in the temporal sector in non-glaucomatous high myopic eyes was reported with three different OCT software’s, in comparison with non-glaucomatous non-myopic eyes;23 however, in the same study, glaucomatous high-myopic eyes showed the lowest values in all sectors, with all three software, including the RTVue-100®. The present study showed significant differences between GG and NGG in all sectors. In GG, the values found on both the average and nasal sector were greater, whereas the values from inferior, superior and temporal quadrants were lower than those reported by Akashi et al,23 who studied 52 early glaucomatous high myopic eyes that were younger (47.9 yo) and had lower AL (26.8 mm), in comparison with our population (58yo and 29.7 mm, respectively). After adjustment for CCT and AL, the ppRNFLT-TOTAL and ppRNFLT-T showed a cvAUROC higher than 0.9 for the discrimination between GG and NGG; however, the best 2-variable anatomic model to predict the presence of glaucoma in the high myopic population of the present study was the one including ppRNFLT-I and ppRNFLT-T, displaying a cvAUROC of 0.9472. This is consistent with the higher AUROC showed in these same parameters measured with RTVue-100® and the Topcon 3D OCT®, reported by Akashi et al.23 In a previous study, no association was found between CDR and the degree of myopia,26 whereas in this study, both CDR and NRRA showed a lower value in the prediction of glaucoma risk in HM.
Papillary Vascular Assessment
Regarding papillary vessel density analysis, first, one should bear in mind that image artefacts are not uncommon in OCT angiography, and must be taken into account for suitable interpretation.27 Additionally, analyses in HM eyes are more prone to present artefacts due to higher rates of fixation problems, chorioretinal anatomic alterations and vitreous opacities, when compared to normal eyes. In a previous study, the Optovue® software has shown to produce the highest proportion of eligible scans, in comparison to other OCT-A devices.28 Within the myopia subset, the deep papillary vascular microvascular density was shown to be more affected by myopic optic disc morphology, such as ovality index and optic disc rotation, than by the degree of myopia. On the other hand, the superficial papillary vascular microvascular density was more associated with myopia degree, whereas its reduction was related to higher IOP, longer AL and lower ppRNFLT, but not with age.26 These data are congruent with the results obtained in the present study, since GG had significantly higher AL and GAT-IOP, and lower ppRNFLT, neglecting the potential bias caused by older ages in the same group.
There is consistent evidence of the association between papillary SVD loss and ppRNFLT changes in glaucoma.29,30 Lower values in all vessel density parameters were reported with the RTVue XR®, both in eyes with myopia with the spherical equivalent of more than -3D8 and pathologic myopia (spherical equivalent of more than -6D and AL ≥26.5 mm),31 in comparison with emmetropic eyes. Lower values in all parameters were reported in eyes with primary OAG in association with disease severity, and the superior quadrant was described as the most accurate to diagnose mild glaucoma.32 A recent study including 248 patients showed lower SVD values measured with the RTVue XR®, in both non-myopic glaucomatous eyes and non-glaucomatous myopic eyes, when compared to controls, with a similar pattern of greater differences in the superior and nasal sectors. Additionally, the lowest values in all the SVD were found in the group with HM and glaucoma, which presented the same pattern of differences.8
In the present study, the only parameter that did not differ significantly between GG and NGG was the SVD-IN, which is in line with the thought that the complex composition of the vessels inside the disc may render it less sensitive in detecting differences among groups.31 Additionally, the measurement of SVD-IN contains prelaminar tissue and lamina cribrosa which are supplied by the choroidal circulation, meaning that this parameter not only measures the superficial retinal vasculature on the optic disc but also the microvascular component at the peripapillary choroid.26 Despite the fact that only the cvAUROC from SVD-IN and SVD-T were under 0.9, the best 2-variable papillary vessel density model to predict the presence of glaucoma in the high myopic population of the present study was the model including SVD-I and SVD-S, displaying a cvAUROC of 0.9896, higher than the one achieved with the anatomic model.
Circumpapillary Microperimetric Assessment
In glaucoma research, cpMP offers a useful new way to study retinal function, particularly when the macular function is negatively influenced by other diseases, such as in most of the HM eyes. Data available are still scarce, but an encouraging diagnostic performance was reported in primary OAG with a strong structure–function relationship with ppRNFLT, particularly for the superotemporal and inferotemporal areas,11 and with other peripapillary thickness measures, including the ganglion-cell-complex or the total retina, predominantly for the inferotemporal area.12 On the other hand, despite the theoretical benefit of overcoming the limitations found in macular SAP assessment in HM eyes, there are no previous reports in this subset. In the present study, besides the lower values found in the GG in all cpMP measurements, none of the cvAUROCs were above 0.9 for the discrimination between groups. Due to high collinearity, it was not possible to elaborate a model combining the best two parameters.
Limitations
This study presents a comprehensive approach for a particular group of patients. One limitation concerns the age disparity between groups as most of the high myopic subjects develop glaucoma during the course of the disease at a later age. Therefore, it is very difficult to find age-matched non-glaucomatous HM controls. However, as discussed, most of the findings in this study may be attributed to myopia severity, instead of age. Another limitation is related to the sample size which hinders the elaboration of more complex models; however, given the nature of the disease and the exploratory aim of this study, our sample is considered adequate for the purpose.
Conclusion
The glaucomatous damage is prevalent in high myopic patients but is difficult to distinguish from the myopic-associated optic disc dysgenesis and the standard structural and functional analysis with commonly fail in this differentiation. Despite the apparent superiority of the papillary vascular study, a multimodal approach including the papillary anatomic and circumpapillary microperimetric assessments can be the new way on the diagnosis and prognosis of glaucoma in HM.
Acknowledgments
The authors want to acknowledge all the support granted by the head of the Ophthalmology department of Centro Hospitalar e Universitário do Porto, Prof. Dr. Pedro Menéres.
Disclosure
The authors report no conflicts of interest in this work.
References
1. Holden BA, Fricke TR, Wilson DA, et al. global prevalence of myopia and high myopia and temporal trends from 2000 through 2050. Ophthalmology. 2016;123(5):1036–1042. doi:10.1016/j.ophtha.2016.01.006
2. Jia X, Yu J, Liao SH, Duan XC. Biomechanics of the sclera and effects on intraocular pressure. Int J Ophthalmol. 2016;9(12):1824–1831. doi:10.18240/ijo.2016.12.21
3. Miki A, Ikuno Y, Asai T, Usui S, Nishida K. Defects of the lamina cribrosa in high myopia and glaucoma. PLoS One. 2015;10(9):e0137909. doi:10.1371/journal.pone.0137909
4. Marcus MW, de Vries MM, Junoy Montolio FG, Jansonius NM. Myopia as a risk factor for open-angle glaucoma: a systematic review and meta-analysis. Ophthalmology. 2011;118(10):1989–1994.e1982. doi:10.1016/j.ophtha.2011.03.012
5. Li M, Yang Y, Jiang H, et al. Retinal microvascular network and microcirculation assessments in high myopia. Am J Ophthalmol. 2017;174:56–67. doi:10.1016/j.ajo.2016.10.018
6. Wang X, Kong X, Jiang C, Li M, Yu J, Sun X. Is the peripapillary retinal perfusion related to myopia in healthy eyes? A prospective comparative study. BMJ Open. 2016;6(3):e010791. doi:10.1136/bmjopen-2015-010791
7. Scripsema NK, Garcia PM, Bavier RD, et al. Optical coherence tomography angiography analysis of perfused peripapillary capillaries in primary open-angle glaucoma and normal-tension glaucoma. Invest Ophthalmol Vis Sci. 2016;57(9):Oct611oct620. doi:10.1167/iovs.15-18945
8. Suwan Y, Fard MA, Geyman LS, et al. Association of myopia with peripapillary perfused capillary density in patients with glaucoma: an optical coherence tomography angiography study. JAMA Ophthalmol. 2018;136(5):507–513. doi:10.1001/jamaophthalmol.2018.0776
9. Vernon SA, Rotchford AP, Negi A, Ryatt S, Tattersal C. Peripapillary retinal nerve fibre layer thickness in highly myopic Caucasians as measured by Stratus optical coherence tomography. Br J Ophthalmol. 2008;92(8):1076–1080. doi:10.1136/bjo.2007.127571
10. Zha Y, Zhuang J, Lin D, Feng W, Zheng H, Cai J. Evaluation of myopia on retinal nerve fiber layer thickness measured by Spectralis optical coherence tomography. Exp Ther Med. 2017;14(3):2716–2720. doi:10.3892/etm.2017.4820
11. Kita Y, Hollό G, Saito T, Murai A, Kita R, Hirakata A. Circumpapillary microperimetry to detect glaucoma: a pilot study for sector-based comparison to circumpapillary retinal nerve fiber layer measurement. Int Ophthalmol. 2019;39(1):127–136. doi:10.1007/s10792-017-0796-8
12. Kita Y, Holló G, Murai A, Kita R, Saito T, Hirakata A. Circumpapillary structure-function relationships with microperimetry and spectral domain optical coherence tomography in glaucoma: a pilot study. Clin Ophthalmol. 2018;12:2535–2544. doi:10.2147/OPTH.S186739
13. Ruiz-Medrano J, Montero JA, Flores-Moreno I, Arias L, García-Layana A, Ruiz-Moreno JM. Myopic maculopathy: current status and proposal for a new classification and grading system (ATN). Prog Retin Eye Res. 2019;69:80–115.
14. Hirasawa K, Shoji N, Yoshii Y, Haraguchi S. Comparison of Kang’s and Littmann’s methods of correction for ocular magnification in circumpapillary retinal nerve fiber layer measurement. Invest Ophthalmol Vis Sci. 2014;55(12):8353–8358. doi:10.1167/iovs.14-15720
15. Luque-Fernandez MA, Redondo-Sánchez D, Maringe C. cvauroc: command to compute cross-validated area under the curve for ROC analysis after predictive modeling for binary outcomes. Stata J. 2019;19(3):615–625.
16. Dhami A, Dhasmana R, Nagpal RC. Correlation of retinal nerve fiber layer thickness and axial length on fourier domain optical coherence tomography. JCDR. 2016;10(4):Nc15–17. doi:10.7860/JCDR/2016/15038.7672
17. Wang M, Elze T, Li D, et al. Age, ocular magnification, and circumpapillary retinal nerve fiber layer thickness. J Biomed Opt. 2017;22(12):1–19.
18. Leung CK, Cheung CY, Weinreb RN, et al. Retinal nerve fiber layer imaging with spectral-domain optical coherence tomography: a variability and diagnostic performance study. Ophthalmology. 2009;116(7):
19. Leung CK, Mohamed S, Leung KS, et al. Retinal nerve fiber layer measurements in myopia: an optical coherence tomography study. Invest Ophthalmol Vis Sci. 2006;47(12):5171–5176. doi:10.1167/iovs.06-0545
20. Leal-Fonseca M, Rebolleda G, Oblanca N, Moreno-Montañes J, Muñoz-Negrete FJ. A comparison of false positives in retinal nerve fiber layer, optic nerve head and macular ganglion cell-inner plexiform layer from two spectral-domain optical coherence tomography devices. Graefe’s Arch Clin Exp Ophthalmol. 2014;252(2):321–330. doi:10.1007/s00417-013-2529-7
21. Aref AA, Sayyad FE, Mwanza JC, Feuer WJ, Budenz DL. Diagnostic specificities of retinal nerve fiber layer, optic nerve head, and macular ganglion cell-inner plexiform layer measurements in myopic eyes. J Glaucoma. 2014;23(8):487–493. doi:10.1097/IJG.0b013e31827b155b
22. Kang SH, Hong SW, Im SK, Lee SH, Ahn MD. Effect of myopia on the thickness of the retinal nerve fiber layer measured by cirrus HD optical coherence tomography. Invest Ophthalmol Vis Sci. 2010;51(8):4075–4083. doi:10.1167/iovs.09-4737
23. Akashi A, Kanamori A, Ueda K, Inoue Y, Yamada Y, Nakamura M. The ability of SD-OCT to differentiate early glaucoma with high myopia from highly myopic controls and nonhighly myopic controls. Invest Ophthalmol Vis Sci. 2015;56(11):6573–6580. doi:10.1167/iovs.15-17635
24. Yamashita T, Asaoka R, Tanaka M, et al. Relationship between position of peak retinal nerve fiber layer thickness and retinal arteries on sectoral retinal nerve fiber layer thickness. Invest Ophthalmol Vis Sci. 2013;54(8):5481–5488. doi:10.1167/iovs.12-11008
25. Leung CK, Yu M, Weinreb RN, et al. Retinal nerve fiber layer imaging with spectral-domain optical coherence tomography: interpreting the RNFL maps in healthy myopic eyes. Invest Ophthalmol Vis Sci. 2012;53(11):7194–7200. doi:10.1167/iovs.12-9726
26. Sung MS, Lee TH, Heo H, Park SW. Clinical features of superficial and deep peripapillary microvascular density in healthy myopic eyes. PLoS One. 2017;12(10):e0187160. doi:10.1371/journal.pone.0187160
27. Spaide RF, Fujimoto JG, Waheed NK. Image artifacts in optical coherence tomography angiography. Retina. 2015;35(11):2163–2180. doi:10.1097/IAE.0000000000000765
28. Lei J, Pei C, Wen C, Abdelfattah NS. Repeatability and reproducibility of quantification of superficial peri-papillary capillaries by four different optical coherence tomography angiography devices. Sci Rep. 2018;8(1):17866. doi:10.1038/s41598-018-36279-2
29. Lee EJ, Lee KM, Lee SH, Kim T-W. OCT angiography of the peripapillary retina in primary open-angle glaucoma. Invest Ophthalmol Vis Sci. 2016;57(14):6265–6270. doi:10.1167/iovs.16-20287
30. Yarmohammadi A, Zangwill LM, Diniz-Filho A, et al. Relationship between optical coherence tomography angiography vessel density and severity of visual field loss in glaucoma. Ophthalmology. 2016;123(12):2498–2508. doi:10.1016/j.ophtha.2016.08.041
31. Mo J, Duan A, Chan S, Wang X, Wei W. Vascular flow density in pathological myopia: an optical coherence tomography angiography study. BMJ Open. 2017;7(2):e013571.
32. Geyman LS, Garg RA, Suwan Y, et al. Peripapillary perfused capillary density in primary open-angle glaucoma across disease stage: an optical coherence tomography angiography study. Br J ophthalmol. 2017;101(9):1261–1268. doi:10.1136/bjophthalmol-2016-309642
 © 2021 The Author(s). This work is published and licensed by Dove Medical Press Limited. The full terms of this license are available at https://www.dovepress.com/terms.php and incorporate the Creative Commons Attribution - Non Commercial (unported, v3.0) License.
By accessing the work you hereby accept the Terms. Non-commercial uses of the work are permitted without any further permission from Dove Medical Press Limited, provided the work is properly attributed. For permission for commercial use of this work, please see paragraphs 4.2 and 5 of our Terms.
© 2021 The Author(s). This work is published and licensed by Dove Medical Press Limited. The full terms of this license are available at https://www.dovepress.com/terms.php and incorporate the Creative Commons Attribution - Non Commercial (unported, v3.0) License.
By accessing the work you hereby accept the Terms. Non-commercial uses of the work are permitted without any further permission from Dove Medical Press Limited, provided the work is properly attributed. For permission for commercial use of this work, please see paragraphs 4.2 and 5 of our Terms.