")
Back to Journals » OncoTargets and Therapy » Volume 10
The role of microRNA-21 in predicting brain metastases from non-small cell lung cancer
Authors Dong J, Zhang Z, Gu T, Xu SF, Dong LX, Li X, Fu BH, Fu ZZ
Received 6 July 2016
Accepted for publication 14 September 2016
Published 29 December 2016 Volume 2017:10 Pages 185—194
DOI https://doi.org/10.2147/OTT.S116619
Checked for plagiarism Yes
Review by Single anonymous peer review
Peer reviewer comments 3
Editor who approved publication: Dr Yao Dai
Jing Dong,1 Zhi Zhang,2 Tao Gu,3 Shu-Feng Xu,4 Li-Xin Dong,3 Xin Li,5 Bao-Hong Fu,3 Zhan-Zhao Fu3
1Basic Research for Oncology, North China University of Science and Technology, 2Department of Oncology, Workers’ Hospital of Tangshan City, Tangshan, 3Department of Oncology, 4Department of Respiratory Medicine, The First Hospital of Qinhuangdao City, Qinhuangdao, 5Department of Oncology, Chengde Medical College, Chengde, People’s Republic of China
Objective: This study aimed at exploring the role of microRNA-21 (miR-21) in predicting brain metastases (BM) from non-small cell lung cancer (NSCLC).
Methods: A total of 132 NSCLC patients, including 68 patients with BM and 64 patients without BM, were included in the study. NSCLC cells were collected and assigned to the inhibitor (IN) group, the mock group, and the negative control (NC) group. The quantitative real-time polymerase chain reaction assay was used to detect the miR-21 expression. Cell proliferation, migration, invasion, and apoptosis were detected by colony-forming assay, MTT assay, transwell assay, and flow cytometry, respectively. Angiogenesis was measured by endothelial cell tube formation assay.
Results: The miR-21 expression was higher in NSCLC patients with BM than in those without BM. The miR-21 expression in the IN group was lower than that in the NC and mock groups. Compared with the NC and mock groups, the values of optical density (OD) and the colony-forming number decreased in the IN group. Compared with the NC and mock groups, cell invasion and migration abilities significantly reduced in the IN group. The IN group had higher apoptosis rate than the NC and mock groups. The tube length was shorter and the number of junction points was less in the IN group in comparison to the NC and mock groups.
Conclusion: miR-21 might be a potential biomarker for the development of BM in NSCLC patients and could promote the proliferation, migration, invasion, and angiogenesis of NSCLC cells.
Keywords: non-small cell lung cancer, microRNA-21, brain metastases, angiogenesis
Introduction
Non-small cell lung cancer (NSCLC) is a type of epithelial lung cancer other than small cell lung carcinoma and accounts for approximately 85%–90% of all lung cancers.1,2 The incidence rates of NSCLC vary from 22 to 63 per 100,000 men and from 5 to 33 per 100,000 women per year.3 It has been reported that the 5-year survival rate of NSCLC patients ranges from 25% to 73% on the basis of different pathological stages.4 Despite advances in NSCLC treatments, the prognosis for NSCLC patients remains poor, with the majority of NSCLC patients dying of pulmonary infection, respiratory failure, brain metastases (BM), and so on.5,6 BM is the most common neurologic complication related to systemic cancer, which is up to 10 times more common than primary malignant brain tumors and is a significant burden in the management of patients with advanced cancer.7 In addition, among patients with NSCLC, approximately 20%–40% suffer from BM, a major concern in the NSCLC treatment, during the course of the disease, which may significantly influence the survival and quality of life of patients.8,9 The prognosis of BM in NSCLC patients has been reported to be very poor, and the median survival of BM patients from lung cancer was less than 1 year.9,10 In this regard, it is necessary to explore better prognostic markers to predict 1) the occurrence of BM in NSCLC patients and 2) the outcomes to improve the clinical management of NSCLC patients.
MicroRNA-21 (miR-21) is implicated in multiple malignancy-related processes, and overexpressed miR-21 is frequently found in various malignancies, such as breast cancer, liver cancer, esophageal cancer, gastric cancer, brain cancer, colorectal cancer, and NSCLC.11–13 Previous studies have also shown that miR-21 is an oncogenic miR and the inhibition of miR-21 expression reduced proliferation, migration, and invasion of cancer cells, including the cells of pancreatic, colorectal, gastric, lung, and NSCLC cancers.14–18 However, whether miR-21 leads to the development of BM in NSCLC patients remains unknown. In the present study, we sought to investigate the expression levels of miR-21 in NSCLC patients with or without BM. We also conducted in vitro experiments with the A549 cell line to explore the role of miR-21 in the development of BM in NSCLC patients.
Patients and methods
Study subjects
Between January 2013 and June 2014, a total of 132 NSCLC patients at the First Hospital of Qinhuangdao City were enrolled in this study. Sixty-eight cases were diagnosed with BM (BM+) and 64 cases were diagnosed without BM (BM−). Among the 68 NSCLC patients with BM, 55 (80.9%) had adenocarcinoma, 10 (14.7%) had squamous carcinoma, 2 (2.94%) had sarcoma, and 1 (1.47%) had large cell carcinoma. Among the 64 NSCLC patients without BM, 43 (67.2%) had adenocarcinoma, 10 (15.6%) had squamous carcinoma, 2 (3.13%) had sarcoma, 1 (1.56%) had large cell carcinoma, and 8 (12.5%) had neuroendocrine carcinoma. There were no differences in the clinicopathological features between NSCLC patients with and without BM (Table 1). The diagnosis of NSCLC was confirmed by pathological examination, and the occurrence of BM in NSCLC patients was diagnosed by clinicians and experienced radiologists based on the imaging examination results (cerebral computerized tomography [CT] or magnetic resonance imaging [MRI]) and clinical symptoms. This study was approved by the Ethics Committee of the First Hospital of Qinhuangdao City, and written informed consent was obtained from all subjects.
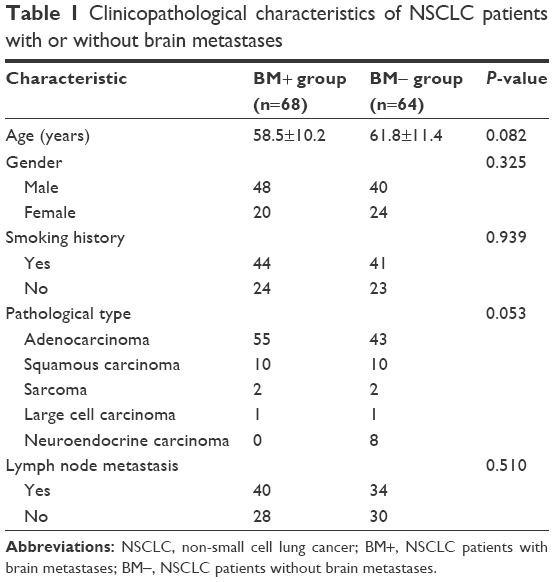 | Table 1 Clinicopathological characteristics of NSCLC patients with or without brain metastases |
Sample collection
Blood samples were collected from NSCLC patients and centrifuged at 3,000 rpm at 4°C for 15 min to separate hemocytes and serum. The supernatants were transferred into sterile 2.0 mL Eppendorf (EP) tubes and numbered, and then stored in an ultra-low temperature freezer at −80°C.
Follow-up
All patients were regularly reviewed with timely follow-up. The follow-up was from the time of the first visit to the death or the last follow-up on September 30, 2015. The patients who lost to follow-up in this study were recorded and analyzed with the clinical information of patients on the last contact date. The occurrence time (month) of newly diagnosed BM for the patients without BM at the first visit was carefully recorded during the follow-up.
Cell culture
Human NSCLC cell lines (A549, NCI-H157, NCI-H460, YTMLC-90, and XWLC-05), purchased from the Cell Culture Center of the Institute of Basic Medical Sciences of Chinese Academy of Medical School (Beijing, People’s Republic of China), were cultured in Roswell Park Memorial Institute (RPMI)-1640 containing 10% fetal bovine serum (FBS), at 37°C with 5% CO2. The cultured cells displayed monolayer growth, and the cell adherent rate of passage cells was up to 90.0%. Culture medium was poured out routinely when passaged. After washing twice with phosphate buffer solution (PBS), the cells were digested with 0.25% trypsin, and when the intercellular gaps were enlarged, the trypsin was poured out. The cells were to be blown and beaten into single-cell suspension with RPMI-1640 culture medium containing 10% FBS and passaged routinely.
Quantitative real-time polymerase chain reaction (qRT-PCR)
Total RNA was extracted by a miRNeasy Mini Kit (Qiagen, NV, Venlo, the Netherlands) from the cytolymph or serum. RNA samples (5 μL) were diluted 20 times in RNase-free ultrapure water. The concentration and purity of RNA were determined by ultraviolet (UV) absorbance at 260 and 280 nm (optical density, OD260/OD280 ratio) using an UV spectrophotometer. The OD260/OD280 ratio between 1.7 and 2.1 indicated that the RNA was highly pure, which could satisfy the requirements of further research process. The cDNA template was generated by reverse transcription with a PCR amplifier. qRT-PCR was conducted by ABI 7500 quantitative PCR System (Thermo Fisher Scientific, Waltham, MA, USA), and ABI 7300 System (Thermo Fisher Scientific) was used for the quantitative detection of miR-21. The reaction conditions were as follows: initial denaturation at 95°C for 10 min and 40 cycles of denaturation at 95°C for 10 s, annealing at 60°C for 20 s, and extension at 72°C for 34 s. U6 snRNA was used as an internal control. The primer sequences of miR-21 and U6 were illustrated in Table 2. The cycle number at threshold (Ct value) was used to calculate the relative expressions of miR-21. The results were presented as fold change, calculated using the 2−ΔΔCt method,19 using the formula:
ΔΔCt = [Cttarget gene − Ctinternal gene]experiment group − [Cttarget gene − Ctinternal gene]control group, |
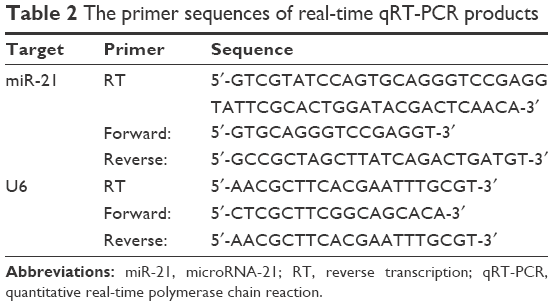 | Table 2 The primer sequences of real-time qRT-PCR products |
where 2−ΔΔCt is the multiple proportions of gene expression between the experiment and control groups and Ct represents the cycle number at which fluorescence reached the fixed threshold. The experiments were repeated for a total of three times.
Cell transfection and grouping
Human NSCLC cell lines in the logarithmic growth phase were collected and assigned to three groups: 1) miR-21 inhibitor group (IN group): cells were transfected with synthesized specific miR-21 inhibitor; 2) negative control (NC) group: cells were transfected with miR-21 inhibitor negative control; and 3) mock group: cells without transfection. The miR-21 inhibitor and miR-21 inhibitor negative control were purchased from Shanghai GenePharma Company (Shanghai, People’s Republic of China). A549 cells were inoculated in 50 mL culture flask and cultured in RPMI-1640 complete medium to 30%–50% density. Lipofectamine™ 2000 (Thermo Fisher Scientific) and miR-21 inhibitor or negative control were configured in sterile EP tubes: 1 μL Lipofectamine™ 2000 transferred into 50 μL serum-free medium at room temperature for 5 min; 20 pM miR-21 inhibitor or negative control transferred into 50 μL serum-free medium at room temperature for 5 min. The diluted miR-21 inhibitor or negative control was mixed with Lipofectamine™ 2000 by gentle swirling, with a total volume of 100 μL, at room temperature for 20 min. Each well was added with 100 μL transfection solutions by gentle swirling, and then placed in a 5% CO2 incubator at 37°C for 6-8 h. Then the solutions were replaced with complete medium and cultured for 48-72 h, and the cells were collected.
MTT assay
After the density of cultured A549 cells reached up to about 80%, the cells were washed twice by PBS, digested with trypsin, and blown and beaten into single-cell suspension. The cells were counted by a cell counter. Cells (3×10³−6×10³/well) were cultured in 96-well plates with a volume of 200 μL in each well and repeated for six wells. The cells were cultured at 37°C in a 5% CO2 incubator for 24-72 h, then each well was treated with 20 μL of MTT (5 mg/mL; Sigma-Aldrich Co., St Louis, MO, USA) reagent and incubated for an additional 4 h. After the medium was removed, 150 μL of dimethyl sulfoxide (DMSO) was added to the wells and the solutions were shaken for 10 min to solubilize the MTT crystals. The OD at 490 nm for each well was measured by an enzyme-linked immunometric meter at the time points of 12, 24, 48, and 72 h. The OD value was set as ordinate and the time point was set as abscissa to graph the MTT curve. Three independent experiment processes were conducted.
Colony formation assay
The A549 cells were inoculated in a 24-well culture plate, with 500 cells in a well, and with three wells for each group. The plate was shaken to make the cells distributed uniformly and then cells were placed in a 5% CO2 incubator at 37°C. The cell clones were washed twice with PBS, and then fixed with 4% paraformaldehyde (5 mL) at room temperature for 15 min. After the medium was removed, the cells were stained with crystal violet solution for 10 min, and then rinsed slowly with running water and dried at room temperature. The number of cells was then counted under an inverted microscope. Individual clones with more than 50 cells were counted and the colony-forming efficiency was calculated with the formula: colony-forming efficiency = the number of clones/the number of inoculated cells ×100%. This experiment was repeated three times.
Flow cytometry (FCM)
The cells were inoculated in a six-well culture plate with 1×10⁶ cells in each well and cultured with serum-free medium for 12 h to synchronize the cells. Then the cells were centrifuged at 1,000 rpm for 5 min and the original medium was removed. The cells were digested and collected after centrifugation. The cells were washed twice with PBS and were resuspended in precooled 75% ethanol and fixed at −20°C overnight. After centrifugation, the supernatant was discarded and was then washed twice with PBS. The cells (with a final concentration of 1×10⁶/mL) were mixed with 50 μL propidium iodide (PI, 0.5 mg/mL), stained away from light at 4°C for 30 min, and filtered with a screen mesh. A FACSCalibur flow cytometer (BD Biosciences, San Jose, CA, USA) was used to determine and analyze the cell cycle distributions. Argon ion laser was applied to observe the fluorescence of PI at 450 nm.
The A549 cells were collected at 48 h after transfection, washed with PBS for three times, and were then added into a precooled 1× binding buffer (500 μL). Annexin-V-FITC (fluorescein isothiocyanate) (5 μL) and PI (2.5 μL) were mixed into the cell suspension and analyzed by a BD FACSArial I cell sorter (BD Biosciences). The cell populations were detected in a dot-matrix plot: viable cells (FITC−/PI−) were presented in the left lower quadrant (Q4), early apoptotic cells (FITC+/PI−) were presented in the right lower quadrant (Q3), and necrotic and late apoptotic cells (FITC+/PI+) were presented in the right upper quadrant (Q2). The apoptosis rate = the percentage of FITC+/PI− (Q3) + the percentage of FITC+/PI+ (Q2).
Transwell migration and invasion assays
At 48 h after transfection, the cells were digested with 2.5% trypsin and suspended in serum-free Dulbecco’s Modified Eagle’s Medium (DMEM). Two-hundred μL of a single-cell suspension of cells (with a final concentration of 1×10⁶/mL) was placed in the upper chamber, whereas the lower chamber of the 24-well culture plate was loaded with 600 μL RPMI-1640 containing 10% FBS, and cultured at 37°C for 24 h. The experiment was repeated three times with three parallel wells in each group. After incubation, the matrix and noninvading cells in the upper chamber were carefully removed, stained with 0.1% crystal violet solution for 5 min, and the redundant stain was removed with clean water. The cells that penetrated through the Matrigel to the lower surface of the filter were calculated and photographed under a light microscope at ×200. Five optional visual fields of the cell invasion, including up, down, middle, left, and right, were chosen for counting, and the average value was calculated. Transwell migration assay was performed using transwell without a layer of Matrigel on the upper surface. The rest of the experimental procedure was the same as the invasion assay.
Endothelial cell tube formation assay
After the extracellular matrix gels were fully solubilized, the cells were placed into a 96-well culture plate and incubated at 37°C with 5% CO2 for 60 min. The cells were collected by centrifugation at 1,500 rpm for 5 min after removal of dead cells in the culture supernatants. A549 cells were suspended in the supernatants with a final concentration of 2×10⁵/mL. A volume of 150 μL of supernatant was added into each well of the 96-well culture plate and incubated at 37°C with 5% CO2 for 18 h. The cell tube formation in each group was observed and imaged under a light microscope at ×20. Five optional visual fields were chosen randomly for counting.
Statistical analysis
SPSS 21.0 statistical software (SPSS Inc., Chicago, IL, USA) was applied for statistical analysis. The measurement data were expressed by mean and standard deviation. One-way analysis of variance (ANOVA) was used for multiple group comparisons after the variance homogeneity test. Least significant difference (LSD) unpaired t-test was used in pairwise comparison of multiple groups or averages. Receiver operating characteristic (ROC) curve was used to measure the value of apparent diffusion coefficient (ADC), with BM+ or BM− as state variables and miR-21 expression of 64 NSCLC patients without BM as test variables. The sensitivity, specificity, accuracy rate, and the area under the curve (AUC) were calculated. Kaplan-Meier survival curve was used to analyze the influence of miR-21 expression on the occurrence time of BM. P<0.05 was considered statistically significant.
Results
The expression of miR-21 in NSCLC patients
The qRT-PCR assay was used to detect the expression of miR-21 in the BM+ and BM− groups. As presented in Figure 1, the results showed that the expression of miR-21 in the BM+ group was significantly higher than that in the BM− group (P<0.001).
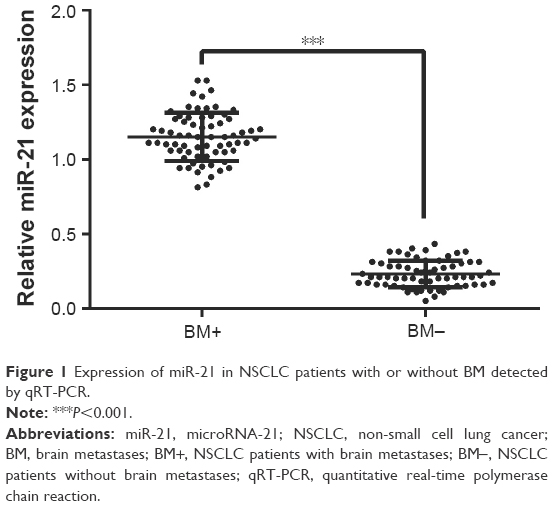 | Figure 1 Expression of miR-21 in NSCLC patients with or without BM detected by qRT-PCR. |
Correlation between miR-21 expression and the risk of BM in NSCLC patients
Among 64 NSCLC patients without BM, 26 cases were newly diagnosed with BM during the substantial follow-ups. True positive rate (sensitivity) was defined as the percentage of NSCLC patients with BM whose miR-21 expression was higher than the threshold of ROC curve, while true negative rate (specificity) was defined as the percentage of NSCLC patients without BM whose miR-21 expression was lower than the threshold. The ROC curve showed that the AUC was 0.873 (95% confidence interval [CI]: 0791-0.956), and the sensitivity and specificity were 92.3% and 60.7%, respectively, with a best cutoff point of 0.205 (Figure 2A). Kaplan-Meier survival curve was used to analyze the correlation between the miR-21 expression and the occurrence time (month) of BM. The results indicated that the expression more than 0.205 indicated enhanced expression of miR-21 and the expression less than or equal to 0.205 indicated decreased expression of miR-21. Furthermore, the average time of BM occurrence with high expression of miR-21 was 17.4 months, and that with low expression of miR-21 was 26.1 months (Figure 2B).
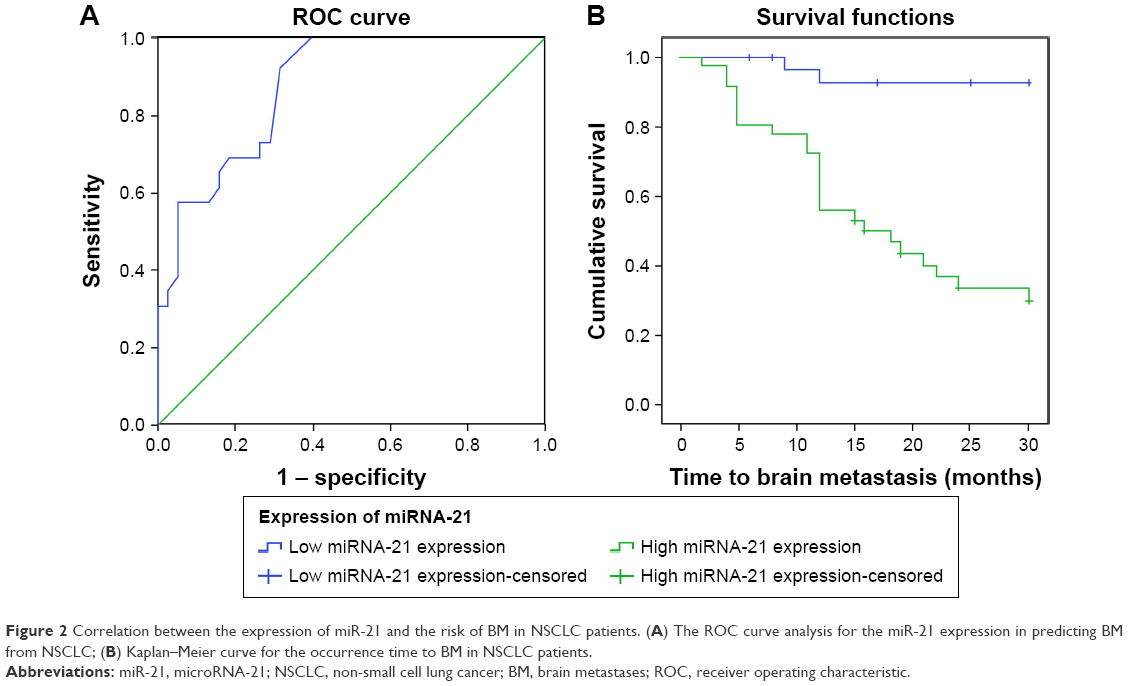 | Figure 2 Correlation between the expression of miR-21 and the risk of BM in NSCLC patients. (A) The ROC curve analysis for the miR-21 expression in predicting BM from NSCLC; (B) Kaplan–Meier curve for the occurrence time to BM in NSCLC patients. |
Expression of miR-21 in five NSCLC cell lines
As shown in Figure 3, qRT-PCR was used to detect the expression of miR-21 in human NSCLC cell lines A549, NCI-H157, NCI-H460, YTMLC-90, and XWLC-05. The results suggested that miR-21 expression was the highest in A549 cells. Therefore, A549 cell line was chosen for further studies.
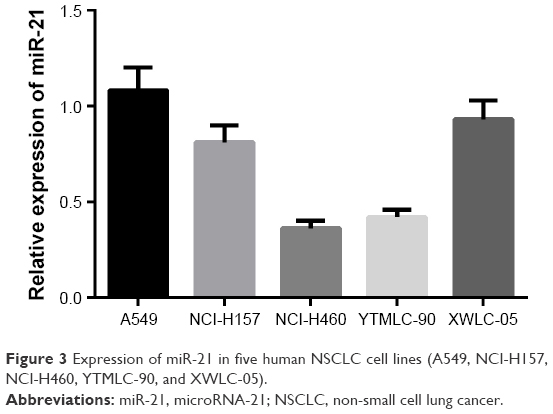 | Figure 3 Expression of miR-21 in five human NSCLC cell lines (A549, NCI-H157, NCI-H460, YTMLC-90, and XWLC-05). |
Expression of miR-21 in A549 cells after transfection
At 48 h after transfection, the expression of miR-21 in the IN group was significantly lower than that in the NC and mock groups (both P<0.05; Figure 4). However, no significant difference in miR-21 expression was observed between the NC and mock groups (P>0.05).
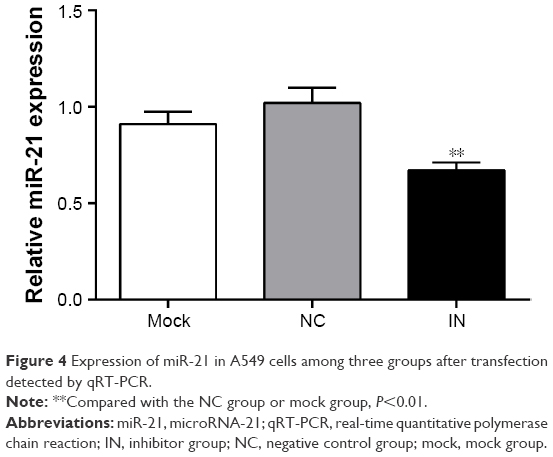 | Figure 4 Expression of miR-21 in A549 cells among three groups after transfection detected by qRT-PCR. |
Effects of miR-21 inhibitors on the proliferation and clone formation of A549 cells
Compared with the NC and mock groups, the OD values at 24, 48, and 72 h significantly decreased in the IN group after transfection (all P<0.05), whereas no significant difference was observed between the NC and mock groups (P>0.05; Figure 5A). The results showed that the down-regulated expression of miR-21 might inhibit the proliferation of A549 cells. The number of clones in the IN group significantly decreased at 48 h after transfection (P<0.05), whereas no significant differences were observed between the NC and mock groups (P>0.05; Figure 5B).
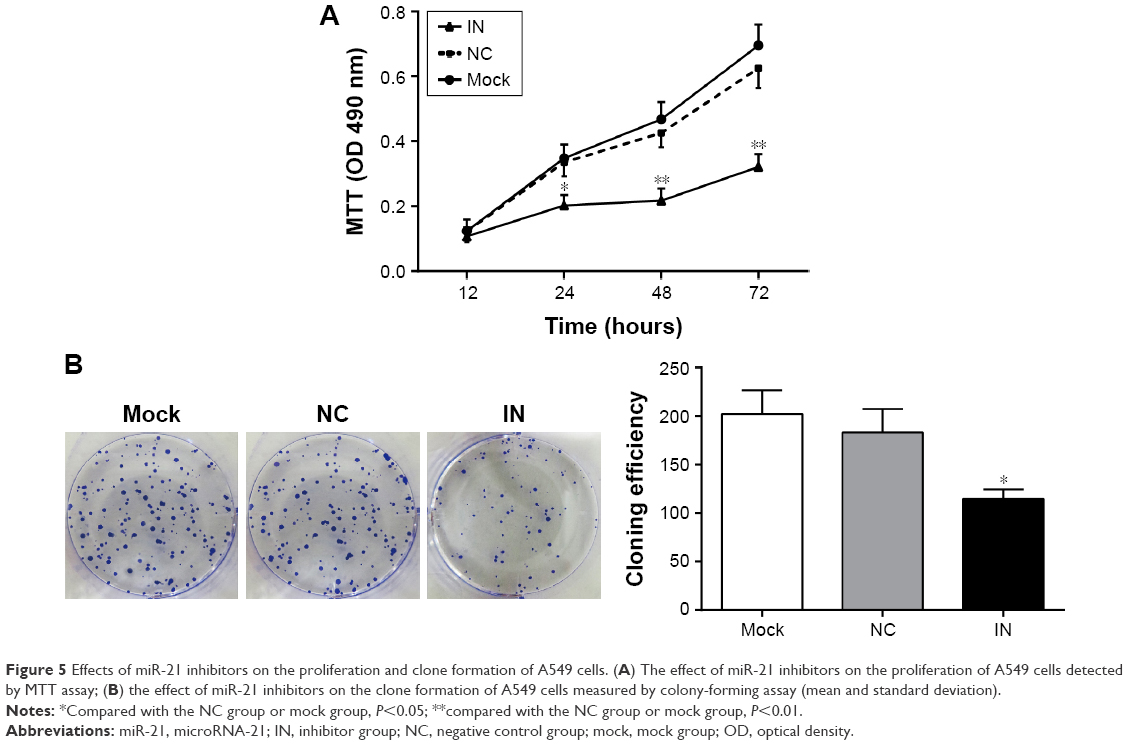 | Figure 5 Effects of miR-21 inhibitors on the proliferation and clone formation of A549 cells. (A) The effect of miR-21 inhibitors on the proliferation of A549 cells detected by MTT assay; (B) the effect of miR-21 inhibitors on the clone formation of A549 cells measured by colony-forming assay (mean and standard deviation). |
Effects of miR-21 inhibitors on cell cycle and apoptosis of A549 cells
As shown in Figure 6A, the proportions of cells at G0/G1 phase in the NC and mock groups were 42.87%±3.48% and 40.39%±4.23%, respectively, at 48 h after transfection. There were no significant differences between the NC and mock groups (P>0.05). As compared to the NC and mock groups, the proportions of cells at G0/G1 phase in the IN group significantly increased (62.25%±3.00%; P<0.05). Furthermore, the proportions of cells at S phase in the NC and mock groups were 50.79%±7.17% and 54.48%±3.53%, respectively, with no significant differences between the groups (P>0.05). As compared to the NC and mock groups, the proportions of cells at S phase in the IN group significantly decreased (34.35%±3.14%; P<0.05). The proportions of cells at G2/M phase in the NC, mock, and IN groups were 6.33%±3.88%, 5.13%±1.54%, and 3.30%±0.25%, respectively. No significant differences were observed among the three groups (P>0.05). These results indicated that miR-21 inhibitors might reduce the proliferation of A549 cells.
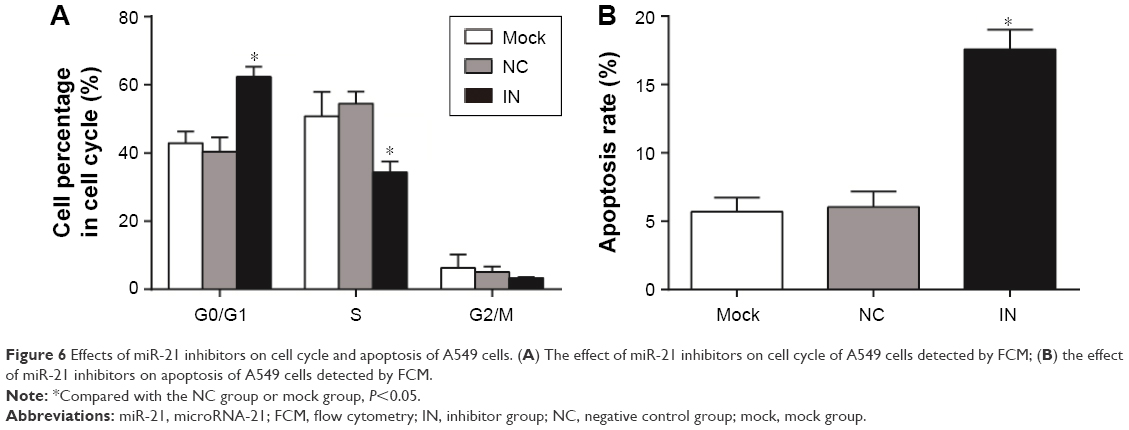 | Figure 6 Effects of miR-21 inhibitors on cell cycle and apoptosis of A549 cells. (A) The effect of miR-21 inhibitors on cell cycle of A549 cells detected by FCM; (B) the effect of miR-21 inhibitors on apoptosis of A549 cells detected by FCM. |
The apoptosis rate of A549 cells in the IN group was 17.58%±1.42% at 48 h after transfection, while the apoptosis rates of A549 cells in the NC and mock groups were 5.69%±1.03% and 6.02%±1.15%, respectively. The apoptosis rate in the IN group was significantly higher than in the NC and mock groups (P<0.05), while there was no significant difference in the rate between the NC and mock groups (P>0.05; Figure 6B). These results indicated that miR-21 inhibitors might promote the apoptosis of A549 cells.
Effects of miR-21 inhibitors on the migration and invasion of A549 cells
The results of transwell migration and invasion assays showed that the number of invading cells in the IN group significantly decreased (25.67±6.21 [mean ± SD]) compared to the NC group (58.55±7.48) and the mock group (58.74±8.57) (P<0.05; Figure 7A). The results demonstrated that miR-21 inhibitors might reduce the invasion of cells significantly. Moreover, the number of migrating cells in the IN group significantly decreased (52.34±8.74) compared to the NC group (98.74±11.24) and the mock group (95.67±10.25) (P<0.05; Figure 7B).
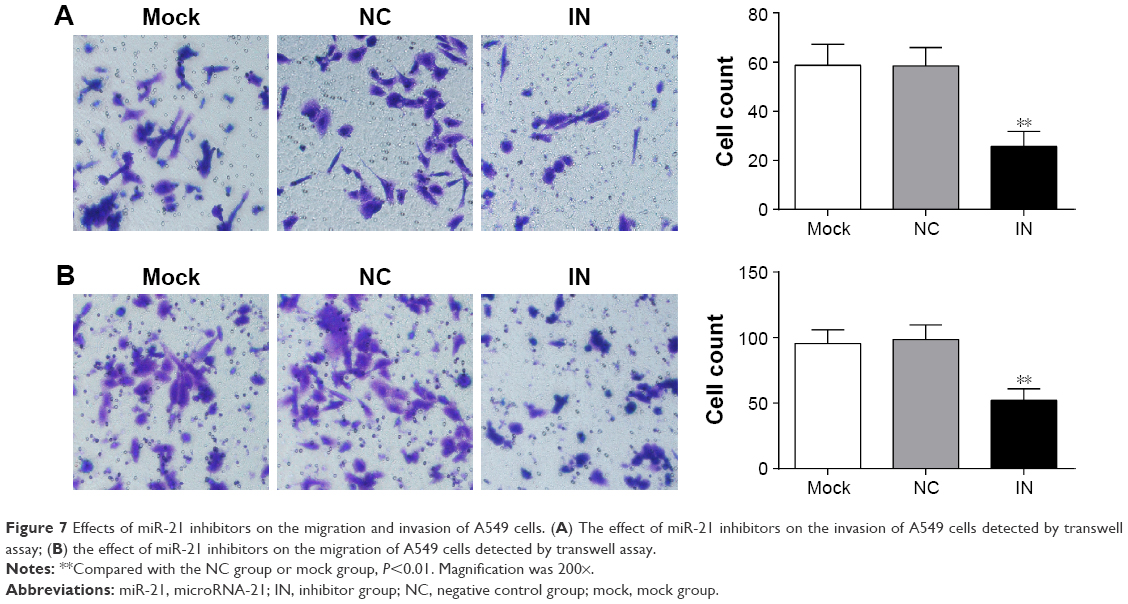 | Figure 7 Effects of miR-21 inhibitors on the migration and invasion of A549 cells. (A) The effect of miR-21 inhibitors on the invasion of A549 cells detected by transwell assay; (B) the effect of miR-21 inhibitors on the migration of A549 cells detected by transwell assay. |
Effect of miR-21 inhibitors on angiogenesis of A549 cells
The A549 cells in the IN group rarely showed tube formation, whereas the A549 cells in the NC and mock groups had dense and homogeneous lumens (Figure 8). The differences in tube length were analyzed by ImageJ software, and the results showed that the tube length of A549 cells in the IN group was significantly shorter and the number of junction points was less compared to those in the NC group (P<0.05).
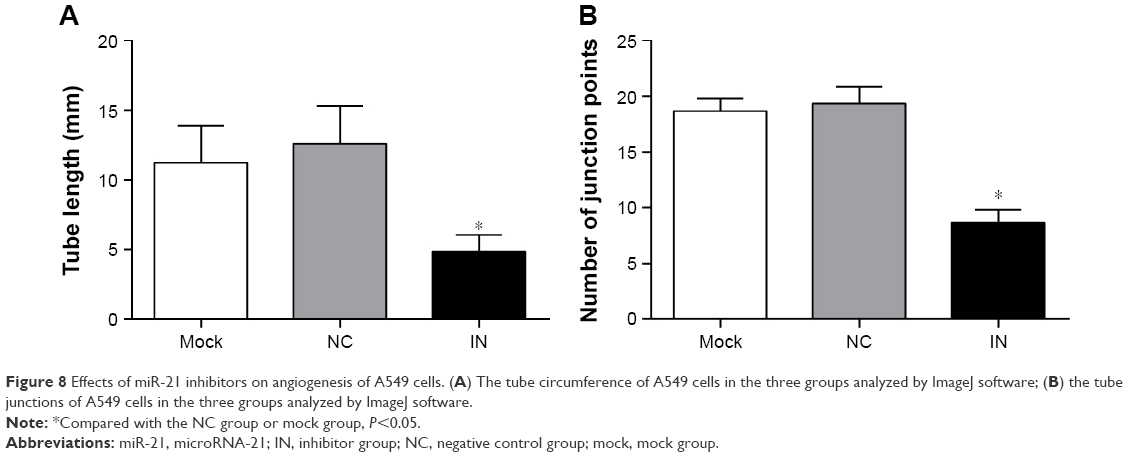 | Figure 8 Effects of miR-21 inhibitors on angiogenesis of A549 cells. (A) The tube circumference of A549 cells in the three groups analyzed by ImageJ software; (B) the tube junctions of A549 cells in the three groups analyzed by ImageJ software. |
Discussion
Nowadays, NSCLC patients show a higher incidence of BM, which may cause central nervous system dysfunction and may seriously affect the quality of life of patients.6 BM causes significant neurologic, cognitive, and emotional difficulties and negatively impacts survival,20 which is one of the leading causes of death in NSCLC patients. Therefore, early diagnosis and timely treatment of BM are essential to the prognosis of NSCLC patients with BM.5,21 In this study, we investigated the expression of miR-21 in NSCLC patients with or without BM to explore the correlation between the miR-21 expression and the development of BM in NSCLC patients. The results showed that the NSCLC patients with BM showed higher expression of miR-21 compared to those without BM, indicating that enhanced expression of miR-21 might be correlated with the development of BM. Similarly, Yang et al have demonstrated that overexpression of miR-21 was found in NSCLC tissues, and overexpression of miR-21 was significantly correlated with tumor size and tumor-node-metastasis (TNM) stage of NSCLC patients.22 Furthermore, Oh et al have revealed that NSCLC patients with distal metastasis had higher miR-21 expression than those without distal metastasis.20
Furthermore, the ROC curve showed that the sensitivity and specificity for the miR-21 in predicting the occurrence of BM were 92.3% and 60.7%, respectively, and the Kaplan-Meier curve showed that miR-21 was a potential risk factor for the development of BM. These results demonstrated that the overexpression of miR-21 might be closely implicated in the development and progression of BM in NSCLC patients, which could act as a potential biological marker in predicting the development of BM in NSCLC patients. A variety of miRs were observed in brain-metastatic carcinomas, which can act as potential diagnostic markers and therapeutic targets for various cancers with BM.23,24 Nadiya et al have found that the miR-21 expression was significantly increased in the cerebrospinal fluid of patients with glioblastoma and BM of breast and lung cancers, indicating that miR-21 may be a potential biomarker for both glioblastoma and BM.25 Singh et al have demonstrated that miR-21 is overexpressed in lung cancer patients and is associated with a poor prognosis; meanwhile, Singh et al suggested that miR-21 might regulate the metastatic behavior of BM initiating cells by targeting STAT3, and hence blocking the STAT3-miR-21 pathway could be a novel therapeutic treatment in patients with lung-to-brain metastasis.26 A previous study performed by Zhang et al has demonstrated that NSCLC patients with distal metastasis had higher miR-21 expression than those without distal metastasis, and the overexpression of miR-21 may be involved in the metastasis and invasion of tumor cells.18
For a better understanding of the underlying mechanisms of miR-21 in the development of BM in NSCLC patients, we conducted a cell experiment with the A549 cell line. The results of in vitro experiment showed that miR-21 inhibitors might reduce cell proliferation, clone, migration, invasion, and tumor angiogenesis. Furthermore, miR-21 inhibitors might promote the apoptosis of A549 cells. These results indicated that miR-21 might be implicated in the development of BM in NSCLC patients, and the inhibition of miR-21 expression might be a novel therapeutic approach for the NSCLC patients with BM. It is well known that miR-21 is overexpressed in various human tumors and has been linked to various cellular processes that are altered in cancer cells. Recently, studies have showed that knockdown of miR-21 expression inhibited tumor cell proliferation, migration, and invasion, as well as induced apoptosis in vitro and suppressed tumor cell growth in vivo.27,28 Yang et al have found that knockdown of miR-21 expression can inhibit the cell proliferation and migration in vitro, and that miR-21 may regulate the metastatic behavior by promoting cell proliferation, survival, migration, and invasion.29 In addition, down-regulation of miR-21 expression following transfection of miR-21-inhibitor may restrain the cell proliferation and migration of A549 cells through up-regulation of PDCD4.30 Bornachea et al have found that the expression of miR-21 increased in human metastatic lung cancer, and the elevated miR-21 expression may be closely correlated with distant metastasis.31
Conclusion
In conclusion, our analysis suggested that miR-21 was overexpressed in NSCLC patients with BM, and knockdown of miR-21 expression might restrain cell proliferation, migration, invasion, and angiogenesis, and might induce tumor cell apoptosis, indicating that miR-21 might be a potential biomarker for the development of BM in NSCLC patients and knockdown of miR-21 might be a novel therapeutic approach for NSCLC patients with BM. We found that the specificity was 66.7%, 67.8%, and 61.5% in the ROC curve analysis of other relative references,32,33 while the specificity was only 60.7% in our experiment. Because the number of NSCLC patients visiting our hospital every year was small, there was separation in the data of miR-21 expression. Therefore, more samples shall be used in the future investigations. In addition, further studies on the targets of miR-21 will be conducted for better understanding of correlation between the underlying mechanism of miR-21 and BM.
Acknowledgment
The authors are grateful to all the reviewers for their contributions and useful suggestions on our article.
Disclosure
The authors report no conflicts of interest in this work.
References
Ettinger DS, Akerley W, Bepler G, et al. Non-small cell lung cancer. J Natl Compr Canc Netw. 2010;8(7):740-801. | ||
Jemal A, Bray F, Center MM, et al. Global cancer statistics. CA Cancer J Clin. 2011;61(2):69-90. | ||
D’Addario G, Fruh M, Reck M, et al. Metastatic non-small-cell lung cancer: ESMO Clinical Practice Guidelines for diagnosis, treatment and follow-up. Ann Oncol. 2010;21(Suppl 5):v116-v119. | ||
Goldstraw P, Ball D, Jett JR, et al. Non-small-cell lung cancer. Lancet. 2011;378(9804):1727-1740. | ||
Reck M, Popat S, Reinmuth N, et al. Metastatic non-small-cell lung cancer (NSCLC): ESMO Clinical Practice Guidelines for diagnosis, treatment and follow-up. Ann Oncol. 2014;25(Suppl 3):iii27-iii39. | ||
Peters S, Adjei AA, Gridelli C, et al. Metastatic non-small-cell lung cancer (NSCLC): ESMO Clinical Practice Guidelines for diagnosis, treatment and follow-up. Ann Oncol. 2012;23(Suppl 7):vii56-vii64. | ||
Lu-Emerson C, Eichler AF. Brain metastases. Continuum (Minneap Minn). 2012;18(2):295-311. | ||
Welsh JW, Komaki R, Amini A, et al. Phase II trial of erlotinib plus concurrent whole-brain radiation therapy for patients with brain metastases from non-small-cell lung cancer. J Clin Oncol. 2013;31(7):895-902. | ||
Kawabe T, Phi JH, Yamamoto M, et al. Treatment of brain metastasis from lung cancer. Prog Neurol Surg. 2012;25:148-155. | ||
Smedby KE, Brandt L, Backlund ML, et al. Brain metastases admissions in Sweden between 1987 and 2006. Br J Cancer. 2009;101(11):1919-1924. | ||
Wang B, Zhang Q. The expression and clinical significance of circulating microRNA-21 in serum of five solid tumors. J Cancer Res Clin Oncol. 2012;138(10):1659-1666. | ||
Asaga S, Kuo C, Nguyen T, et al. Direct serum assay for microRNA-21 concentrations in early and advanced breast cancer. Clin Chem. 2011;57(1):84-91. | ||
Pan X, Wang ZX, Wang R. MicroRNA-21: a novel therapeutic target in human cancer. Cancer Biol Ther. 2010;10(12):1224-1232. | ||
Giovannetti E, Funel N, Peters GJ, et al. MicroRNA-21 in pancreatic cancer: correlation with clinical outcome and pharmacologic aspects underlying its role in the modulation of gemcitabine activity. Cancer Res. 2010;70(11):4528-4538. | ||
Toiyama Y, Takahashi M, Hur K, et al. Serum miR-21 as a diagnostic and prognostic biomarker in colorectal cancer. J Natl Cancer Inst. 2013;105(12):849-859. | ||
Zhang BG, Li JF, Yu BQ, et al. MicroRNA-21 promotes tumor proliferation and invasion in gastric cancer by targeting PTEN. Oncol Rep. 2012;27(4):1019-1026. | ||
Liu XG, Zhu WY, Huang YY, et al. High expression of serum miR-21 and tumor miR-200c associated with poor prognosis in patients with lung cancer. Med Oncol. 2012;29(2):618-626. | ||
Zhang JG, Wang JJ, Zhao F, et al. MicroRNA-21 (miR-21) represses tumor suppressor PTEN and promotes growth and invasion in non-small cell lung cancer (NSCLC). Clin Chim Acta. 2010;411(11-12):846-852. | ||
Livak KJ, Schmittgen TD. Analysis of relative gene expression data using real-time quantitative PCR and the 2(-Delta Delta C(T)) method. Methods. 2001;25(4):402-408. | ||
Oh Y, Taylor S, Bekele BN, et al. Number of metastatic sites is a strong predictor of survival in patients with nonsmall cell lung cancer with or without brain metastases. Cancer. 2009;115(13):2930-2938. | ||
Bearz A, Garassino I, Tiseo M, et al. Activity of pemetrexed on brain metastases from non-small cell lung cancer. Lung Cancer. 2010;68(2):264-268. | ||
Yang JS, Li BJ, Lu HW, et al. Serum mir-152, mir-148a, mir-148b, and mir-21 as novel biomarkers in non-small cell lung cancer screening. Tumour Biol. 2015;36(4):3035-3042. | ||
Li Z, Gu X, Fang Y, et al. MicroRNA expression profiles in human colorectal cancers with brain metastases. Oncol Lett. 2012;3(2):346-350. | ||
Zhang L, Sullivan PS, Goodman JC, et al. MicroRNA-1258 suppresses breast cancer brain metastasis by targeting heparanase. Cancer Res. 2011;71(3):645-654. | ||
Teplyuk NM, Mollenhauer B, Gabriely G, et al. MicroRNAs in cerebrospinal fluid identify glioblastoma and metastatic brain cancers and reflect disease activity. Neuro Oncol. 2012;14(6):689-700. | ||
Singh M, Garg N, Venugopal C, et al. STAT3 pathway regulates lung-derived brain metastasis initiating cell capacity through miR-21 activation. Oncotarget. 2015;6(29):27461-27477. | ||
Li B, Ren S, Li X, et al. MiR-21 overexpression is associated with acquired resistance of EGFR-TKI in non-small cell lung cancer. Lung Cancer. 2014;83(2):146-153. | ||
Ma Y, Xia H, Liu Y, et al. Silencing miR-21 sensitizes non-small cell lung cancer A549 cells to ionizing radiation through inhibition of PI3K/Akt. Biomed Res Int. 2014;2014:617868. | ||
Yang CH, Yue J, Pfeffer SR, et al. MicroRNA miR-21 regulates the metastatic behavior of B16 melanoma cells. J Biol Chem. 2011;286(45):39172-39178. | ||
Yang Y, Meng H, Peng Q, et al. Downregulation of microRNA-21 expression restrains non-small cell lung cancer cell proliferation and migration through upregulation of programmed cell death 4. Cancer Gene Ther. 2015;22(1):23-29. | ||
Bornachea O, Santos M, Martinez-Cruz AB, et al. EMT and induction of miR-21 mediate metastasis development in Trp53-deficient tumours. Sci Rep. 2012;2:434. | ||
Yoshida A, Derchain SF, Pitta DR, et al. Preoperative measurement of serum c-reactive protein: is it useful in the differential diagnosis of adnexal masses? Int J Biol Markers. Epub 2016 Dec 5. | ||
Freitas AA, Hungria EM, Costa MB, et al. Application of mycobacterium leprae-specific cellular and serological tests for the differential diagnosis of leprosy from confounding dermatoses. Diagn Microbiol Infect Dis. 2016;86(2):163-168. |
 © 2016 The Author(s). This work is published and licensed by Dove Medical Press Limited. The full terms of this license are available at https://www.dovepress.com/terms.php and incorporate the Creative Commons Attribution - Non Commercial (unported, v3.0) License.
By accessing the work you hereby accept the Terms. Non-commercial uses of the work are permitted without any further permission from Dove Medical Press Limited, provided the work is properly attributed. For permission for commercial use of this work, please see paragraphs 4.2 and 5 of our Terms.
© 2016 The Author(s). This work is published and licensed by Dove Medical Press Limited. The full terms of this license are available at https://www.dovepress.com/terms.php and incorporate the Creative Commons Attribution - Non Commercial (unported, v3.0) License.
By accessing the work you hereby accept the Terms. Non-commercial uses of the work are permitted without any further permission from Dove Medical Press Limited, provided the work is properly attributed. For permission for commercial use of this work, please see paragraphs 4.2 and 5 of our Terms.