")
Back to Journals » Journal of Pain Research » Volume 16
The Role of IL-6 and TMEM100 in Lumbar Discogenic Pain and the Mechanism of the Glycine-Serine-Threonine Metabolic Axis: A Metabolomic and Molecular Biology Study
Authors Guo Z , Ma Y, Wang Y, Xiang H, Yang SY , Guo Z, Wang R, Chen W, Xing D, Chen B, Tao H, Wu X
Received 9 December 2022
Accepted for publication 5 February 2023
Published 15 February 2023 Volume 2023:16 Pages 437—461
DOI https://doi.org/10.2147/JPR.S400871
Checked for plagiarism Yes
Review by Single anonymous peer review
Peer reviewer comments 2
Editor who approved publication: Dr Qi Fang
Zhaoyang Guo,1,* Yuanye Ma,1,* Yaqing Wang,2 Hongfei Xiang,1 Shang-You Yang,3 Zhu Guo,1 Ronghuan Wang,1 Wujun Chen,4 Dongming Xing,4,5 Bohua Chen,1 Hao Tao,1 Xiaolin Wu1,4
1Department of Orthopedics, The Affiliated Hospital of Qingdao University, Qingdao, People’s Republic of China; 2Department of Nephrology, The First Affiliated Hospital of China Medical University, Shenyang, People’s Republic of China; 3School of Medicine-Wichita, University of Kansas, Wichita, KS, USA; 4Cancer Institute, The Affiliated Hospital of Qingdao University, Qingdao University, Qingdao Cancer Institute, Qingdao, People’s Republic of China; 5School of Life Sciences, Tsinghua University, Beijing, People’s Republic of China
*These authors contributed equally to this work
Correspondence: Xiaolin Wu; Hao Tao, Department of Orthopedics, The Affiliated Hospital of Qingdao University, Qingdao, People’s Republic of China, Email [email protected]; [email protected]
Background: It is well established that discogenic low back pain (DLBP) is often caused by the inflammatory response during intervertebral disc degeneration (IDD). However, it remains unclear how inflammatory mediators such as Interleukin-6 (IL-6) are involved in discogenic pain caused by degeneration and intervertebral disc (IVD) metabolism. The purpose of this study is to study the relationship between IL-6 and Transmembrane protein 100 (TMEM100), and to analyze the different metabolites and metabolic pathways in various rat intervertebral discs by metabonomics.
Methods: We established a rat model of IDD-DLBP by disc punctures and PBS infusion to examine the rat pain behaviors. Intervertebral disc tissues were harvested for molecular biology experiments to explore the relationship between IL-6 and TMEM100. High-resolution mass spectrometry (HRMS) was performed for untargeted metabolomics, and nuclear magnetic resonance spectroscopy metabolomics (MRS) for differential metabolites and metabolic pathways.
Results: The results showed a significant decrease in vonFrey test, hot plate test and acetone test (P < 0.05). The expression of IL-6 and TMEM100 in DLBP model was significantly higher than that in sham control group and IDD discs without PBS infusion group (P < 0.05). There were 15 major contributing metabolites identified in the DLBP intervertebral discs through metabolomic studies, involving 6 major metabolic pathways. The main differential metabolites included nitric oxide (NO), ammonia, and lactic acid as the metabolic endpoints; and the differential metabolic pathways included the glycine-serine-threonine (Gly-Ser-Thr), which is gradually weakened with the progression of inflammation.
Conclusion: The change of TMEM100 expression mediated by il-6 is related to the Gly-Ser-Thr metabolic axis and plays an important role in the relief of discogenic pain.
Keywords: metabolomics, DLBP, IDD, IL-6, TMEM100, inflammatory mediators
Introduction
Discogenic low back pain (DLBP) is a chronic intractable pain caused by intradiscal rupture.1 Current evidence suggests that more than 600 million people worldwide will suffer from DLBP at some time in their lives, and the treatment of low back pain has become a significant economic burden for this patient population.2 Various factors have been established to cause DLBP, among which intervertebral disc degeneration (IDD) is one of the common causes of low back pain.3 It has been reported that up to 42% of low back pain is related to intervertebral disc disease.4
It is well established that the causes of DLBP are endplate injury, radial rupture of inner annulus fibrosus, degradation of intervertebral disc matrix, inflammatory reaction of intervertebral disc stroma, and persistent production of inflammatory mediators during pain.5 IDD is caused by chemical stimulation of nerve endings of the outer annulus fibrosus. IL-6 is an important inflammatory mediator that participates in immune and inflammatory responses. An ample body of evidence suggests that IL-6 is highly expressed in degenerative intervertebral discs and adjacent dorsal root ganglion (DRG).6 TMEM 100 is a pain signal modulator expressed in DRG discovered in recent years that mainly localized to calcitonin gene-related peptide (CGRP)-positive peptide neurons in DRG and trigeminal ganglia, and its expression is reportedly increased in inflammatory pain.7,8 Little is currently known about the relationship between IL-6 and TMEM100, nor is the relationship and expression of the two in discogenic pain caused by IDD.
Clinically, DLBP is mainly diagnosed by magnetic resonance imaging (MRI).9 Nonetheless, the metabolism and interaction mechanism of related substances in the intervertebral disc of DLBP patients remain largely understudied. Therefore, metabolomic studies are crucial for diagnosing DLBP caused by degeneration.
In this study, we established a DLBP–IDD rat model to explore the expression differences of IL-6 and TMEM100 in DLBP. Mass spectrometry and nuclear magnetic resonance (NMR) metabolomics methods were used to explore the metabolic characteristics and differences between DLBP and IDD and then analyze the causes and mechanisms of pain degeneration.
Materials and Methods
Experimental Animals and Ethics Statement
Thirty-six healthy male SD rats (Animal body weight 561 ± 30.1 g) were purchased from the Animal Experimental Breeding Center of Jinan City, Shandong Province. Animals were housed under appropriate temperature and light-controlled conditions (22±2℃, 12 h light-dark cycle), and rodent food and water were provided ad libitum. All experimental procedures were carried out in accordance with the National Institutes of Health Guide for the Care and Use of Laboratory Animals (NIH Publications No. 8023, revised 1978), and the procedures were all approved by the Ethics Committee of Qingdao University (approval number: QDU-AEC-2022098 and QDU-HEC-2022056) and the Ethics Committee of the Affiliated Hospital of Qingdao University (approval number: QDFY-19-012-03) and ensure that it is carried out in accordance with relevant guidelines and regulations.
Treatment and Grouping of Experimental Animals
SD rats were divided into 3 groups, with 12 rats per group. Group A rats underwent sham procedure to only puncture the paraspinal muscles at the L4-S1 level, but did not puncture the IVD. Groups B and C rats were slowly inserted into the intervertebral disc of L4-S1 from the back under the guidance of ultrasound using Hamilton syringe (27g). The puncture point was between the transverse process and the superior articular process, with a 45° angle between the needle and the horizontal plane. X-ray examination of anterior and posterior lumbar vertebrae confirmed that the needle was located in the central area of IVD. For animals in Group B, 2.5μL of sterile saline (PBS) was infused into the nucleus pulposus (NP) area after the NP multiple ruptured by the needle. Group C rats only underwent multiple needle punctures of the intervertebral disc without saline injection. After the procedure, the rats were placed under a warm lamp and returned to their cage to recover. Four weeks later, the successful establishment of the model was confirmed by the 3.0T magnetic resonance imaging (MRI) T2WI sequence. Three segments of the experimental intervertebral disc tissues were extracted from groups A to C (12 rats per group and 3 intervertebral disc tissues from each rat, leading to a total of 108 intervertebral disc tissues). In the harvested samples, nucleus pulposus (NP) and annulus fibrosus (AF) were dissected and stored at −80 in a freezer. At the same time, the dorsal root ganglia (DRG) of the L4-S1 segments of the three groups were dissected, extracted, and stored in-80℃.
Animal Pain Behavior Test
Mechanical hyperalgesia (von Frey test) was tested using a method described by Chaplan et al10 after the rat was adapt on a metal net for 30 minutes, a set of calibrated von Frey filaments with a bending force of 0.02g to 6.0g were applied to the hind paw of the foot, and rapid lifting of the foot was recorded as a positive reaction. If no response was observed, a second filament was applied. The mechanical retraction threshold of the left and right rear claws was measured, and the average value of the left and right sides was calculated.
A hot plate was used to test the pain threshold of thermal stimulation of rats in each group (hot plate test). After setting a hot plate temperature to stabilize at 55℃, the rat was placed on the hot plate. The timer was started until licking of the back paw and jumping was observed. Each rat was tested twice to average the nociceptive threshold.
The cold pain response was evaluated by acetone test as previously described by Yoon et al.11 A syringe was used to expose the skin of the rat’s hind paw to acetone (20 µL), and the timer was started. We recorded the total time spent from touching the skin with acetone to observing the behavior induced by cold stimulation within one minute. The reaction time of left and right claws of the animal was tested and recorded.
Western Blot (WB) Analysis
The tissue was lysed, and protein was extracted by radioimmunoprecipitation (RIPA) cleavage buffer (Solarbio, Beijing, China). The concentration of proteins was determined by a BCA kit (Elabscience). The separation gel and concentrated gel were prepared and sampled according to the determined concentration, then transferred to the polyvinylidene fluoride (PVDF) membrane after electrophoresis and sealed with 5% skimmed milk powder for 1 hour. Primary antibody was added to the PVDF membrane and incubated overnight at 4℃ (Table 1). The antibodies used were IL-6 (AffinityBiosciences), TMEM100 (Origene) and ß-actin (Elabscience). After overnight incubation, the PVDF membrane was incubated with horseradish peroxidase (HRP) labeled secondary antibody (Elabscience) for 1 hour, and then the luminescence was visualized by ECL kit (Elabscience). The obtained image was analyzed using a development device (Odyssey ® XF).
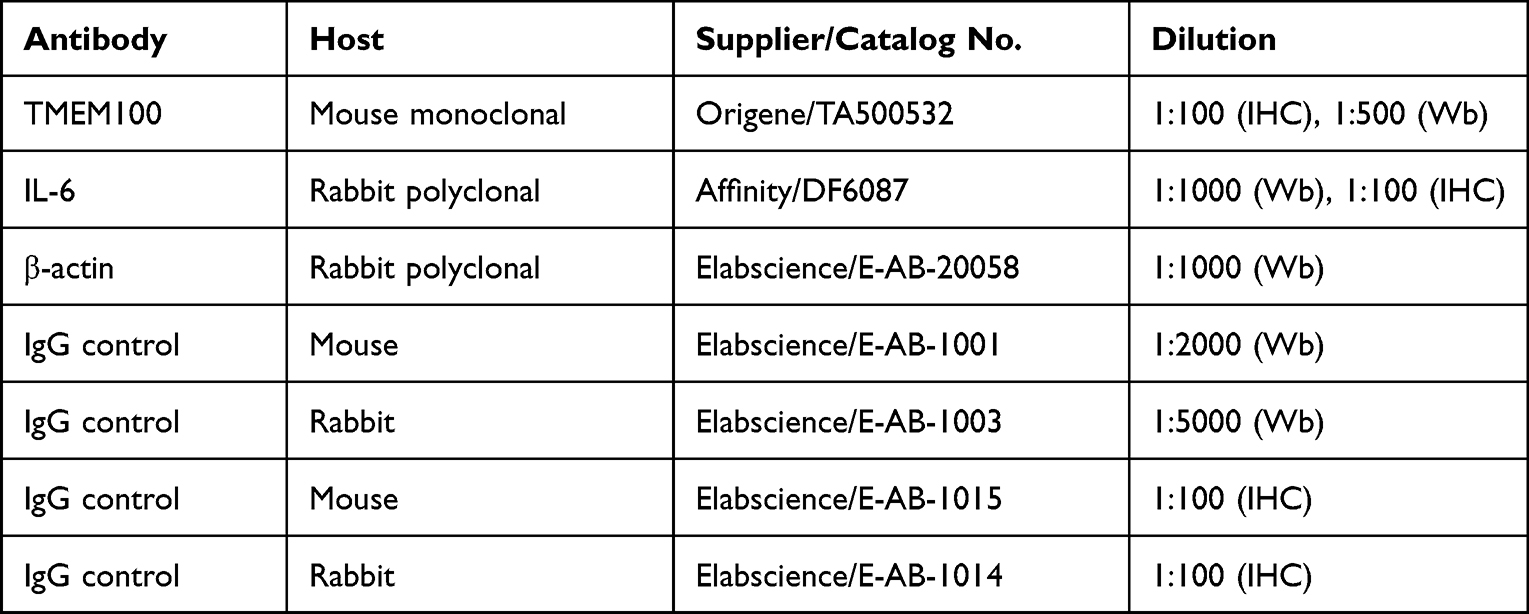 |
Table 1 Primary Antibodies and IgG Controls Used in This Study |
Quantitative Real-Time PCR Analysis (qPCR)
After harvesting the specimen, it was put into a 1.5mL Eppendorf tube, and 1mL Trizol (Elabscience) and steel beads were added, followed by grinding in an oscillator 20s at 60rpm for eight times. The mixture was allowed to rest at room temperature for 5 min; then, chloroform was added to extract the total mRNA derived from the DRG. It was then reverse transcribed to cDNA using Evo M-MLV RT Kit for qPCR (Accurate Biology). The qRT-PCR assay was performed on a PCR instrument using SYBR ® Green Premix Pro Taq HS qPCR Kit (Accurate Biology) with denaturation at 95℃ for 10 min, 40 cycles at 95℃ for 5s and amplification at 60℃ for 30s. The primer sequences used in this study are displayed in Table 2. The obtained data were analyzed using the 2 (-ΔΔCt) algorithm to acquire the results.
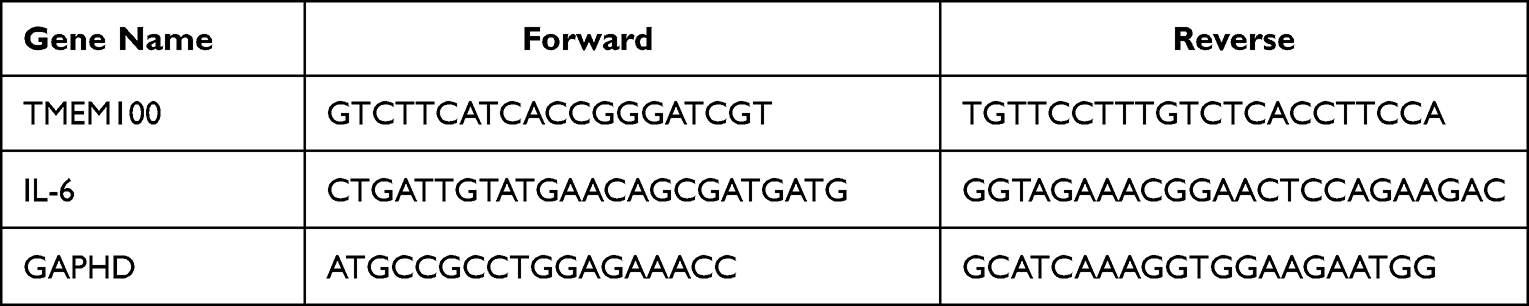 |
Table 2 The Primers Used for qPCR Detection |
Histopathology and Immunofluorescence Experiments
The tissue was fixed with 4% paraformaldehyde (Elabscience) for 72 hours, and the decalcification solution (pH 7.3–7.4) was made of EDTA (Solarbio), NaOH (macklin) and HCL (macklin). The decalcification solution was replaced every week for 4 weeks. The decalcified tissue was embedded in paraffin, and 4 µm-thick slices were sectioned. The sections were stained with a hematoxylin-eosin staining kit (Solarbio) and observed under a light microscope.
For Masson’s staining: paraffin sections were dewaxed with xylene and stained with iron-hematoxylin. Then, the sections were dyed with Masson’s Trichrome stain kit (Solarbio), rinsed with a weakly acidic working solution, and dehydrated with 95% ethanol (National Pharmaceutical Group Chemical Reagent Co., Ltd.).
For safranin O-Fast green staining, paraffin sections were dewaxed with xylene, stained with hematoxylin dye and differentiated with an acid differentiation solution. The tissue was dyed with a fast green dye solution and washed with a weak acid working solution. Then, the tissue was stained with safranin O-solid green kit (Solarbio) and dehydrated with gradient ethanol.
For immunofluorescence assay, the slices were incubated overnight with selected primary antibody at 4℃. The next day, after washing with TBST, the selected fluorescent second antibody was incubated at room temperature for 1 h. After washing with TBST solution, the nucleus was counter-stained with fluorescent dye DAPI (blue). At the same time, the tablets were sealed with an anti-fluorescence quenching agent and observed by a confocal microscope.
For glyoxylic acid staining, the L4-S1 intervertebral discs of anesthetized rats were dissected. After the specimens were fixed and dehydrated, the slices were affixed to glass slides. Glyoxalic acid reagent (Solarbio) was added continuously for 2 minutes each time. After drying, they were heated in an 80-degree oven with paraffin oil for 2 minutes. The results were observed, and photographs were taken with a fluorescence microscope.
Magnetic Resonance Scanning and Anallysis
Bruker BioSpin MRI GmbH 7.0T solid-state magnetic resonance imager (7.0T MRI Bruker®, Germany) was used to detect T1WI, T2WI and other sequences. Parameter settings: ①Sagittal RM FSE T2WI: Repetition Time (TR) 4311ms, Echo Time (TE) 33ms, Field of Vision (FOV)=0.1×0.1mm, Average = 4. Slice thickness 0.3mm, pitch 0.6mm, imaging matrix 256×256, imaging time 5:23; ②T1WI/SAG: RT 100 ms, ET 3.1ms, FOV = 0.1×0.1mm, Average = 1, slice thickness 0.1mm, spacing 0.3mm, imaging matrix 256×256, imaging time 4:03. Moreover, Diffusion Tensor Image (DTI) examination was conducted. The data were processed by DTI Studio V2.3 (Johns Hopkins University, USA) post-processing platform, and the apparent dispersion coefficient (Apparent Diffusion Coefficient, ADC) and anisotropy index (fractional anisotropy, FA) were calculated by setting and detecting the region of interest (ROI).
Measurement and Analysis of 1H NMR and Tocsy Two-Dimensional NMR of Isolated Rat Intervertebral Disc
The intervertebral disc tissue was ground and cracked in dichloromethane and methanol (V dichloromethane: V methanol = 3:1) and homogenized at high speed and low temperature (4℃, 15000g). The parameters for BrukerAVANCE600MHz nuclear magnetic resonance (Bruker ®Corporation, Germany) were as follows: sensitivity: 400s pound N1HNMRM 0.1EBmittmr 0.1EBmitt300S direction N13CNMRM ASTM, resolution: 0.45HZ1HZ1HPM 0.1CHCl3scape 0.2HZ13CASTMscape 1HRAMN SN > 340mm 1x 90°pulse <10, linear <0.6pm 5pm 9 (rotation). The pretreated rat samples were tested, and the original data were obtained after using the parameters 13CS/N: >270 position 1°pulse <10. The original data were preprocessed by TopSpin4.0.9 (Bruker ®Corporation, Germany) for baseline correction, phase correction, calibration of reagent peak and lactic acid peak (Lac), window function and zero function adjustment, and Fourier Transform to make the curve smooth and visible. After identifying the coupling of each peak, a material integration quantitative analysis was carried out, and the compound prediction table was obtained. To further identify and speculate the types of polymer compounds, the “Tocsy two-dimensional nuclear magnetic resonance spectroscopy” experiment was used to label landmark compounds in the intervertebral disc. The original data were processed by Mestrenova14.0.0 (MestrelabResearch ®Corporation, Spain). The spectral baseline correction, F1 and f2 phase correction, Fourier transform, window function and zero function setting, and suppression signal processing were used to calibrate the lactic acid (Lac) peak. The TOCSY map was made, and the newly identified compounds represented by each peak were identified and assigned after the peak was marked.
Detection of High-Resolution Mass Spectrometry (HRMS) of Isolated Rat Intervertebral Disc by Non-Targeted Metabolomics
The rat samples were pretreated and mixed with a HulaMixer oscillator to obtain a homogeneous tissue solution. Samples were collected after centrifugation with a high-speed centrifuge. The samples were detected by liquid chromatography instrument ThermoScientific “Vanquish” UHPLC, and high-resolution mass spectrometer ThermoScientific “QExactiveHF-X” and the original data were obtained. The ThermoXcalibur software (Thermoco. Ltd, USA) was used to view the spectrum, quantitative analysis, spectrum library retrieval, qualitative analysis, extract the mass spectrum peak and identify the effective peak, optimize the parameters of peak matching, normalize the spectrum parameters, and obtain the total ion flow diagram (Total ion chromatogram, TIC) of the final mass spectrum peak.
Metabolite difference analysis: unsupervised principal component analysis (Principal Component Analysis, PCA) and orthogonal-partial least square discriminant analysis (Orthogonal Partial Least Squares Discriminant Analysis, OPLS-DA) were used for multivariate statistical analysis. The corresponding multivariate statistics of each group and the Variable Influence on Projection (VIP) were calculated. The significant substances with VIP value >1 were selected to analyze and separate the principal and differential components. The risk of over-fitting and data availability was evaluated by replacement test (Permutation test), and the displacement test diagram (Permutation Plot) was drawn by metabonomics analysis software Simca 14.1 (Umetrics Co, ltd, Sweden) to describe the over-fitting of OPLS-DA. The scatter plot (S-plot) was drawn by using the covariance (Abscissa) and correlation coefficient (ordinate) of each variable to study the contribution of metabolites and grouping variables to the metabolic spectrum of each sample.
Metabolic pathway analysis was used to determine the relevant metabolic pathways by a heatmap, determine the different metabolic pathways among groups through analysis, draw a Venn plot, and compare and analyze the representative metabolites among each group.
Detection and Analysis of 7.0T Nuclear Magnetic Resonance MRS-1H Spectrum of Intervertebral Discs in vivo
Solid State Nuclear Magnetic Resonance (NMR) (7.0T MRIBruker ®, Germany) was used to detect the intervertebral discs in each group, and the corresponding raw data were obtained. The obtained MRS-1H spectra underwent Fourier Transform curve fitting and were used to qualitatively analyze the intervertebral discs of three groups. And the compounds that recognized the intervertebral disc spectra were calibrated. Substances in intervertebral discs with a single peak with good repeatability were quantitatively analyzed.
Statistical Analysis
The data were collected, tested and sorted out for statistical analysis. The quantitative data were expressed by X ±S; the significance of differences between two groups was assessed by t-test, one-way analysis of variance (ANOVA) was used to compare the statistical differences for more than two groups, and the Kruskal–Wallis test was performed for nonparametric data. The parameters of paired groups were compared by t-test. Nonparametric data were represented as a range of median and quartile. Correlation analysis was carried out. A P-value <0:05 was statistically significant.
Results
Establishment of a Rat Model of DLBP
Four weeks after needle puncture, the rats were anesthetized and underwent MRI imaging. MRI T2WI imaging showed that the intervertebral disc was complete with homogeneous high signal intensity in group A. In group B, the intervertebral disc space was narrowed or unchanged, and the intervertebral disc signal was heterogeneous with low signal intensity. In group C, the intervertebral disc space was significantly narrowed, and the intervertebral space exhibited low signal intensity. In addition, DTI imaging results showed that the ADC value exhibited a significant decreasing trend with intervertebral disc degeneration (P < 0.05) (Figure 1B (i)), while the FA value showed an increasing trend (P < 0.05) (Figure 1B (ii)). These two indicators suggested that the aggravation of intervertebral disc degeneration causes the loss of water molecules and the gradual restriction of movement until “solidification” and the nucleus pulposus matrix changes from good compliance to fibrosis, consistent with the pathological changes of the intervertebral disc. The above findings reflect water metabolism and structural changes during the degeneration of the intervertebral disc (Figure 1A).
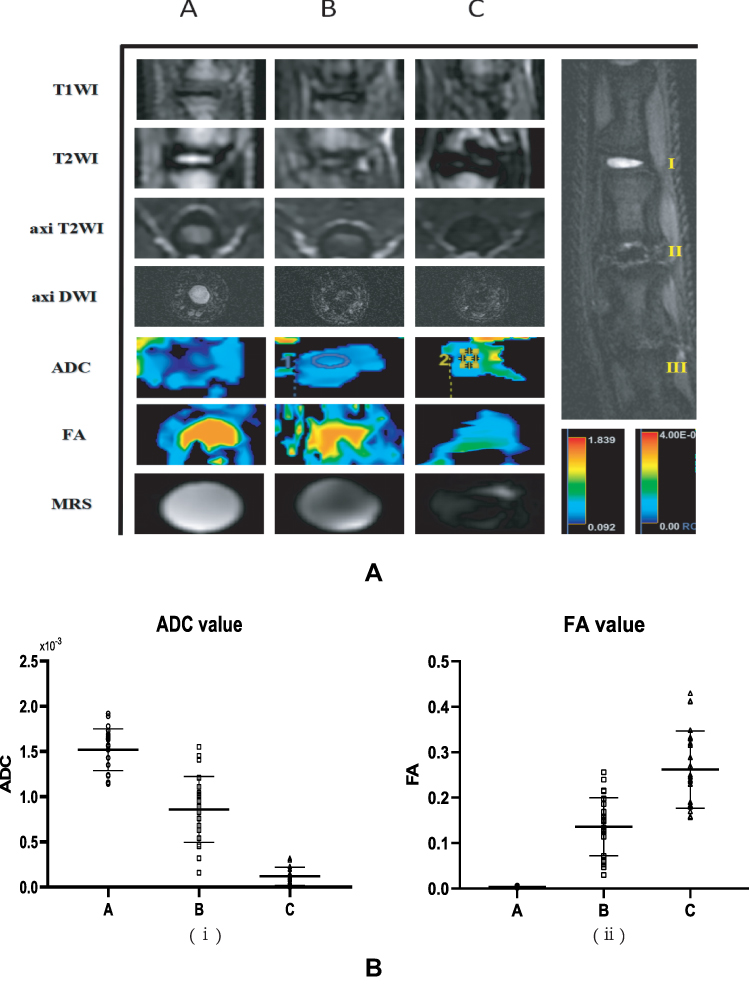 |
Figure 1 (A) The results of imaging gradient changes of the three groups of rat intervertebral discs (7.0T MRI) (B) Statistics of DTI measurement values of three groups of rat intervertebral discs, (A) ADC value statistics, (B) FA value statistics. |
Histopathological analysis revealed that the macroscopic structure of NP and AF and the relative microscopic morphology, staining and distribution of NP cells significantly differed among the three groups of degenerated discs. In addition, differences in the morphology and distribution of collagen fibers and cartilage tissue were observed for the three segments of IVDs (Figure 2).
 |
Figure 2 Histopathology of panels A-C. HE staining image of the sagittal section (A–C). Masson staining image of sagittal section (D–F) and Safranin O-fast green staining of sagittal section (G–I) both showed that compared with group A, the IVD of group B and group C was less Order and looser, containing a large number of inflammatory cells and scarring. |
Analysis of Pain Behavior in DLBP Rats
Pain behavioral assessment. Mechanical hyperalgesia was measured using the von Frey test. The paw withdrawal threshold in group B (n = 12) decreased 1 week after surgery and was consistently lower than in groups A and C (Figure 3A). Thermal hyperalgesia was measured using the hot plate test. Compared with group A, the paw threshold latencies of groups B and C significantly decreased at 3 and 4 weeks after surgery (Figure 3B). Cold hyperalgesia was measured using the acetone test. 2 to 4 weeks after the operation, the effect of acetone on the rats in groups B and C was significantly longer than in group A (Figure 3C).
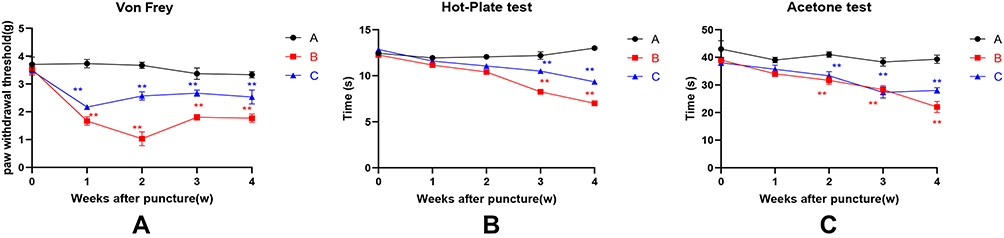 |
Figure 3 Pain behavioral assessment. (A) Mechanical hyperalgesia was measured using the von Frey test. (B) Measurement of thermal hyperalgesia using the hot plate test. (C) Cold hyperalgesia was measured using the acetone test.**P < 0.01. |
Expression of IL-6 and TMEM100 in the Disc Tissues
Rats that underwent intervertebral disc puncture were dissected, and DRG tissue and the corresponding segment of the intervertebral disc were harvested. IL-6 and TMEM100 expressions in the intervertebral disc tissue and the corresponding segment DRG tissue of each group were examined by WesternBlot, immunofluorescence assays (Figure 4) and qRT-PCR (Figure 5). We found that compared with the intervertebral disc degeneration pain model group in groups A and C, IL-6 expression in intervertebral disc tissue in group B intervertebral disc pain model group was significantly higher. After detecting the expression of IL-6 and TMEM100 in the dorsal root ganglion of the three groups, we found that the expression of IL-6 in DRG and the intervertebral disc was similar. The expression of TMEM100 in DRG was relatively low in groups A and C but significantly increased in group B.
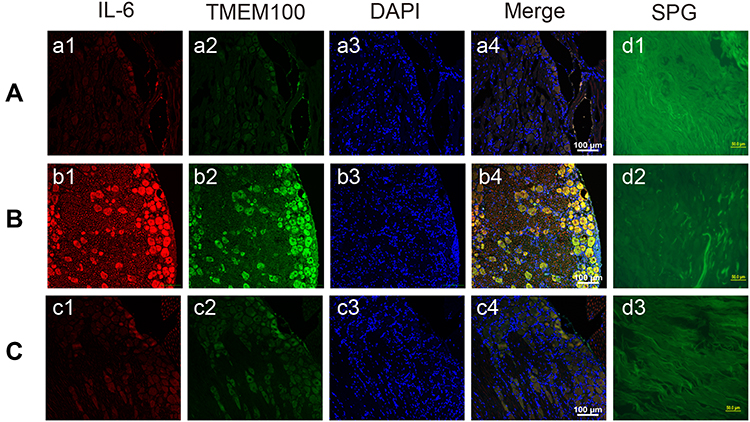 |
Figure 4 Immunofluorescence images (A–C) and glyoxylate staining images (D) of DRG in rats in groups A-C. Compared with the intervertebral disc degenerative pain model group A (a1) and C group (c1), the expression of IL-6 in the intervertebral disc tissue of group B (b1) intervertebral disc pain model group was significantly increased. And the expression of TMEM100 in intervertebral disc tissue of group B (b2) was also significantly higher than that of group A (a2) and group c (c2). The nucleus was stained with DAPI (a3, b3, c3). In group A (d1), group B (d2) and group C (d3) glyoxylate staining images can clearly see the nerves in the intervertebral disc. |
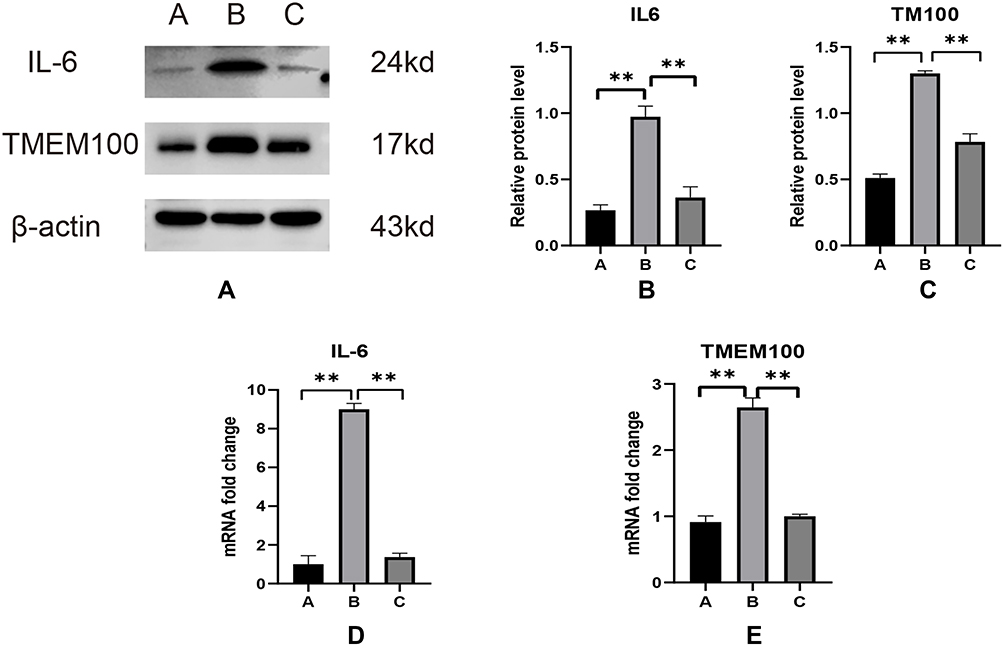 |
Figure 5 Western blot analysis was used to detect the expression levels of IL-6 and TMEM100 in the DRG of group A, group B and group C (A), and their relative quantities (B and C) were calculated using β-actin as an internal reference. The differences in the expression of IL-6 (D) and TMEM100 (e) in the DRG of the models of group A, group B and group C were detected by qPCR. **P < 0.01. |
NMR Analysis of the Experimental Rat Intervertebral Discs in vitro
The distribution of the compounds represented by each peak was determined based on mass spectrometry. The representative peak of the 1H spectrum was determined according to data in the database of NMR spectra of assigned and standard compounds. The potential metabolites of each peak were identified from low field to high field: group 1A: branched chain amino acid (BCAA) residues (0.85–0.95ppm), lactic acid (1.35, 4.1ppm), alanine residues (1.47–1.49ppm), lysine residues (1.74ppm), N acetyl compounds resonance peak N-Acetyl (2.21ppm), proline residues (2.53ppm), glutamine residues (3.78ppm). Alanine residue (3.81ppm), ethanolamine EthNH3 (3.87ppm), tyrosine (6.73, 6.9ppm), phenylalanine (7.09ppm), histidine (7.52ppm). (Figure 6A) Group 2B: lipid (Lipid) (1.28ppm), branched chain amino acid (BCAA) residue (0.85–0.95ppm), lactic acid (1.35, 4.1ppm), alanine residue (1.47–1.49ppm), lysine residue (1.74ppm), N acetyl compound formant N-Acetyl (2.21ppm), proline residue (2.53ppm), glutamine residue (3.78ppm). Alanine residue (3.81ppm), ethanolamine EthNH (33.87ppm), tyrosine (6.73, 6.9ppm), phenylalanine (7.09ppm). (Figure 6B) 3C group: lipid (Lipid) (0.6–0.85ppm, 1.28ppm), branched-chain amino acid (BCAA) residue (0.85–0.95ppm), lactic acid (1.35, 4.1ppm), alanine residue (1.47–1.49ppm), proline residue (2.53ppm), glycine residue (3.42ppm) glutamine residue (3.78ppm), alanine residue (3.81ppm), ethanolamine EthNH3 (3.87ppm). Tyrosine (6.73, 6.9ppm), phenylalanine (7.09ppm). (Figure 6C).
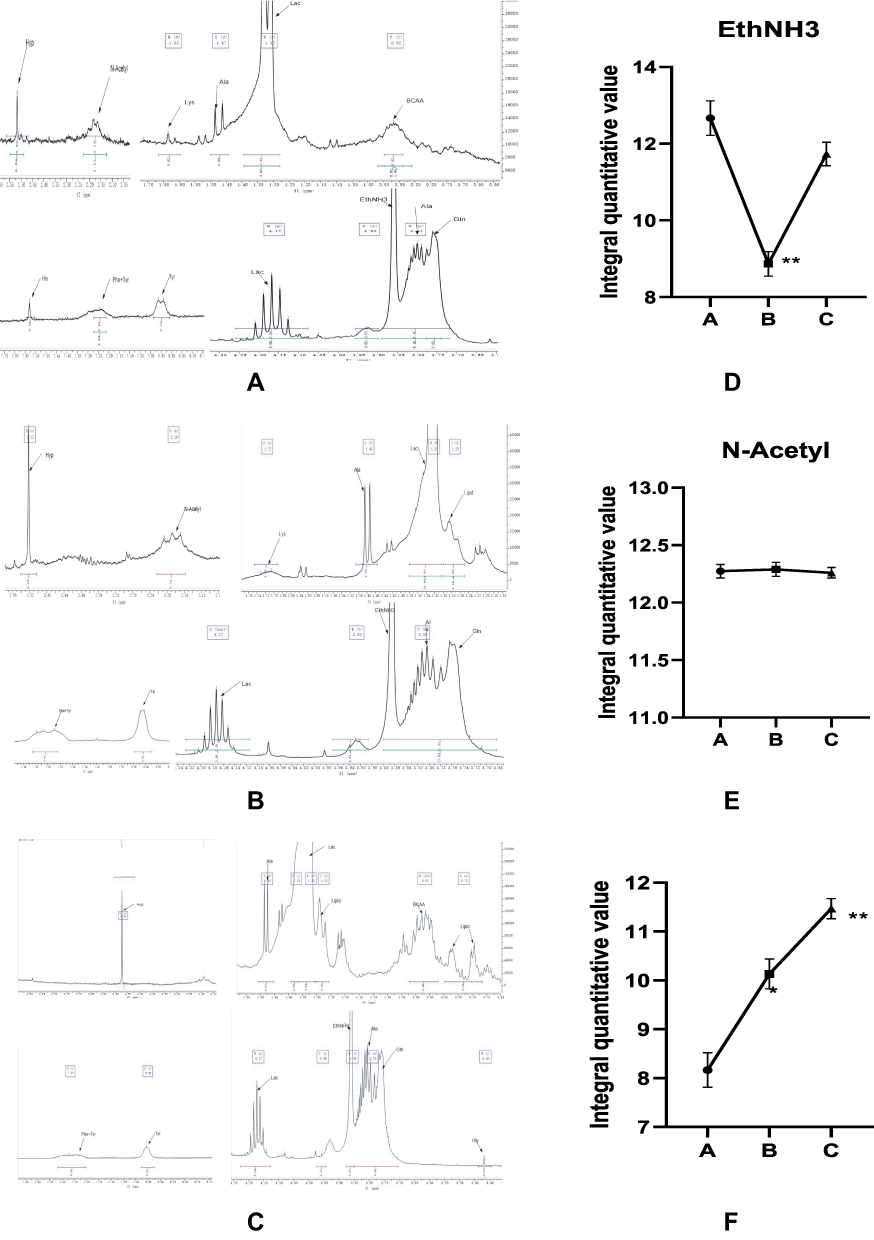 |
Figure 6 (A) Assignment of NMR 1H spectra of intervertebral discs in group A (B) NMR 1H spectra of intervertebral discs of rats in group B (C) NMR 1H spectra of intervertebral discs of rats in group C. (D) Integral quantitative value of EthNH3. (E) Integral quantitative value of N-Acetyl. (F) Integral quantitative value of Lactic acid.*P < 0.05,**P < 0.01. |
To sum up, the lipid peak (Lipid) in groups A to C increased at a low field with the degree of intervertebral disc degeneration, and the peak cleavage of BCAA increased. Moreover, EthNH3 was the lowest in group B (Figure 6D). The lysine residue (Lys) and the resonance peak of N acetyl compound N-Acetyl gradually disappeared (Figure 6E). Moreover, lactic acid gradually increased (Figure 6F). The glycine residue at 3.42–3.52ppm was visible during the late stage of intervertebral disc degeneration, and the scores of other peaks decreased in varying degrees with an increase in grade. The MS metabonomics and 1H NMR spectra of rat intervertebral discs indicated the limited difference in intervertebral disc metabolism between groups B and C. To identify significant metabolic differences, the “two-dimensional TOCSY spectrum” experiment was used to determine the types of polymer compounds (Figures 7 and 8).
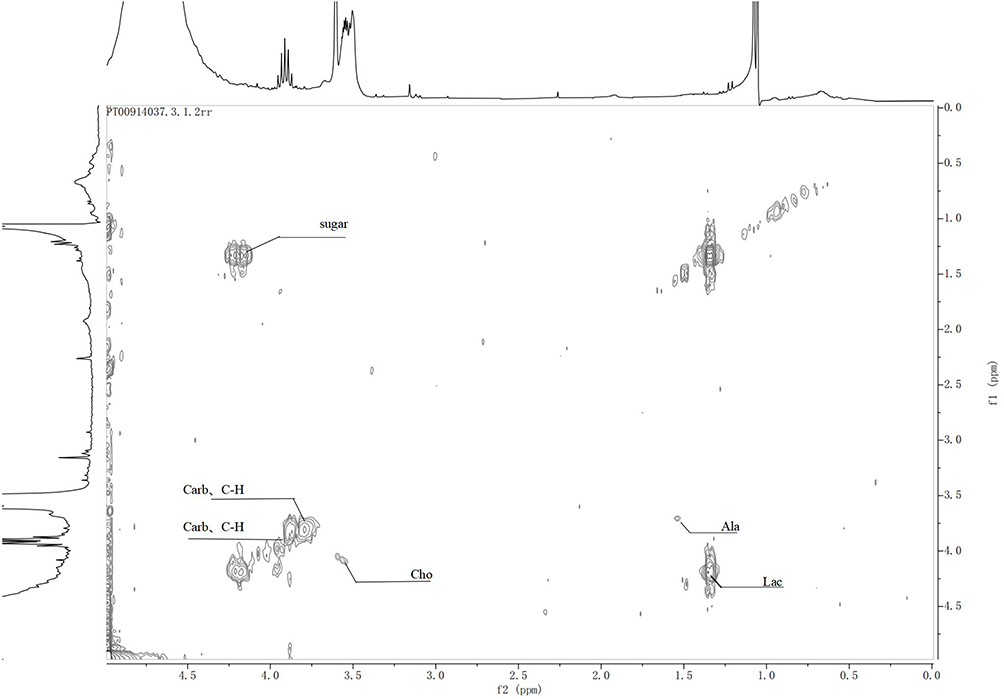 |
Figure 7 Two-dimensional TOCSY spectrum of the intervertebral disc in group A rats. |
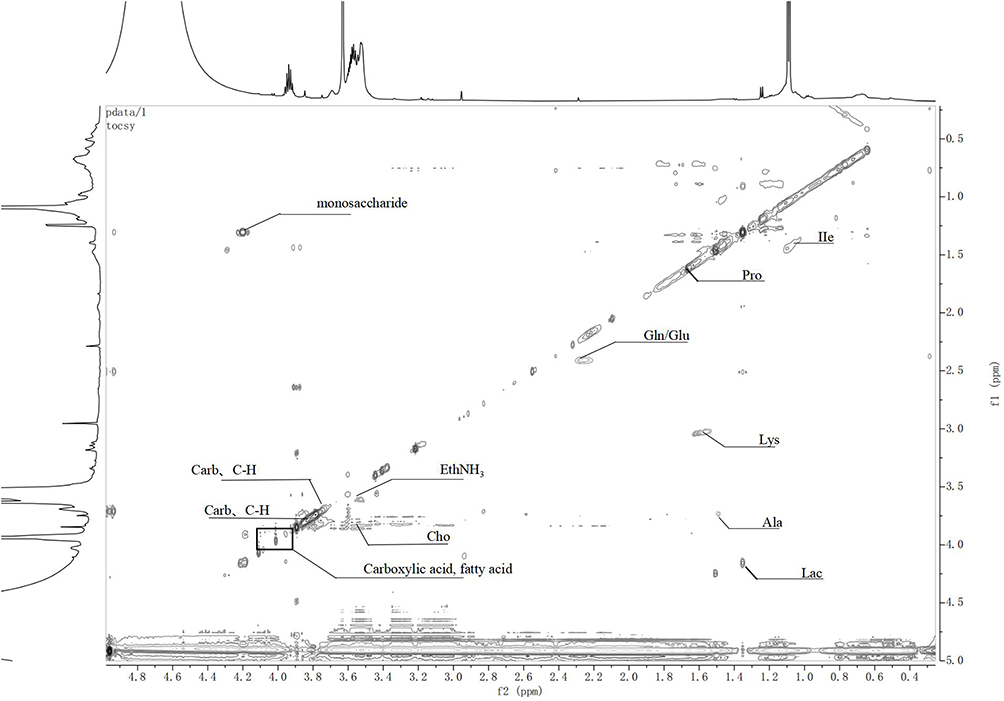 |
Figure 8 Two-dimensional TOCSY spectra of intervertebral discs in groups B and C. |
Non-Targeted Metabonomic Analysis of Intervertebral Disc Degeneration in UHPLC-Q-HFXHRMS Rats
We divided the endogenous metabolites using anion and cation modes for qualitative and quantitative determination by high-resolution mass spectrometry. The total number of peaks in the positive mode was 4505, and 313 effective metabolites were identified; the total number of peaks in the anion mode was 4430, and 226 effective metabolites were identified. The total ion current (TIC) distribution of the intervertebral discs in the three groups was as follows: from group A to group C, the metabolites with short cation time gradually decreased, the peak line was split and fixed at 0.5min, and the peak line was multiple at 6.2–6.5min peak splitting; significant peak fixation was observed at 8.2 min, and peak height increased with increasing disc grade (Figure 9A). When the anions were polarized, the ion peaks were split and fixed at 0.5–1.2min. The metabolites with shorter anion time from group A to group C also showed a gradually decreasing trend, and the peak line is split and fixed at 6.0–8.5min. Moreover, a clear consistent peak line was observed (Figure 9B).
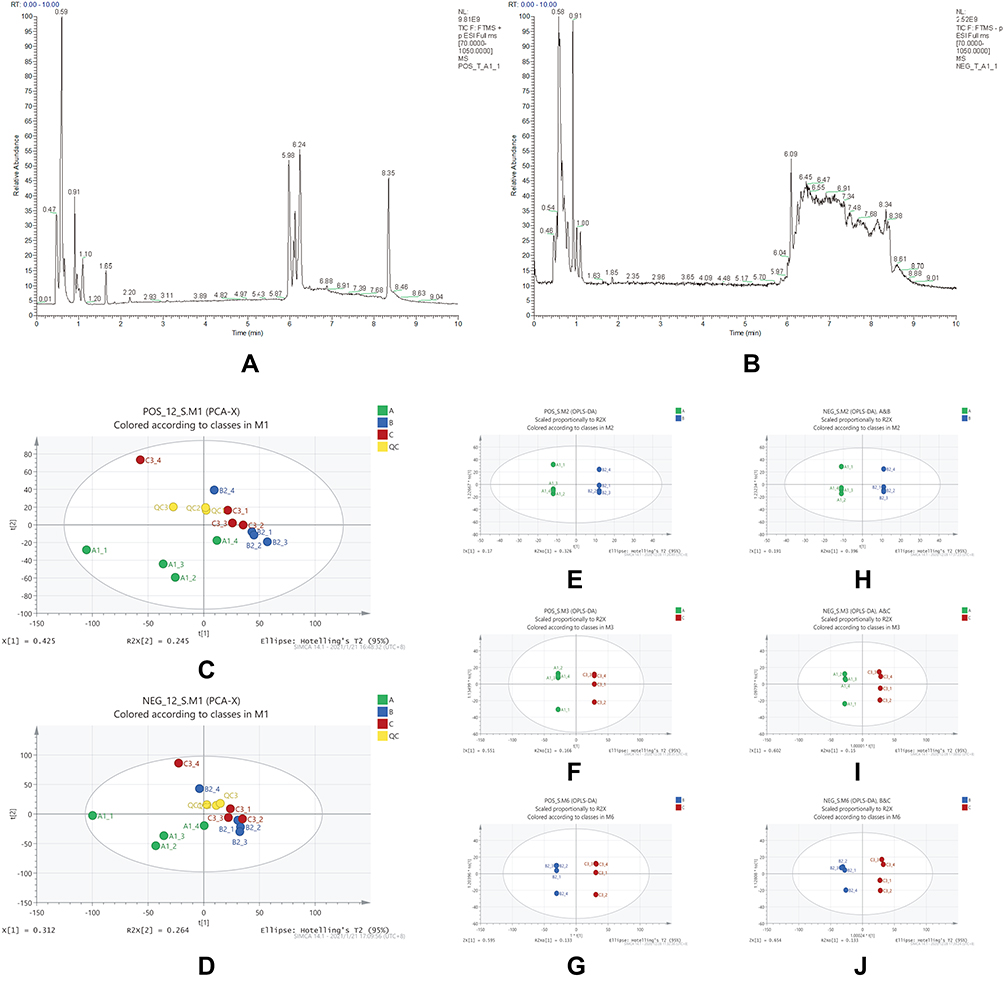 |
Figure 9 (A) Cation flow TIC plot. (B) Anion flow TIC plot. (C) Cation PCA plots of the three groups of samples. (D) Anion PCA plots of three groups of samples. (E–G) OPLS-DA plots of each group in positive mode, (E) comparison of groups A/B, (F) comparison of groups A/C, and (G) comparison of groups B/C. (H–J) OPLS-DA plots of each group in anion mode, (H) comparison of groups A/B, (i) comparison of groups A/C, (J) comparison of groups B/C. |
Then, Principal Component Analysis was used to reduce the dimensionality of the data features. In the three groups of samples, degeneration of the intervertebral disc was exacerbated from groups A to C. In the positive mode, the QC samples exhibited a high degree of aggregation and experimental reliability. C3–4 samples in group C exhibited larger dispersion and were regarded as samples with poor repeatability and excluded. Groups B and C samples were close and completely different from group A samples. Overall, the distribution of samples in the three groups was significantly different, indicating that the three groups of intervertebral discs had different metabolisms (Figure 9C). Similar to the positive mode, the metabolite characteristics of the three metabolic sample groups differed in the anion mode (Figure 9D).
The Orthogonal Partial Least-Squares Discrimination Analysis (OPLS-DA) was used to establish the relationship between intervertebral disc groups and metabolite expression, distinguish the differences between groups, and determine the category of the samples. The following results were observed during the pairwise comparison in the cation mode: AB (R2 = 0.8, Q2 = 0.3), AC (R2 = 1, Q2 = 0.6), BC (R2 = 1, Q2 = 0.7); in summary, R2 >0.5, Q2 >0.3. Accordingly, significant differences among groups were observed in the positive ion mode. The samples were well represented and had a high degree of prediction (Figure 9H–J). Similarly, in the anion mode, there were significant differences among the groups, and the attribution of each sample was clear. The comparison was based on the group distribution, and there were significant statistical differences between the two groups (Figure 9E–G).
Permutation tests were performed for pairwise comparison by OPLS-DA to confirm the validity of the comparison: the cation analysis test results for AB, AC, and BC pairwise comparisons were: AB (R2 = 0.8, Q2 = 0.3), AC (R2 = 1, Q2 = 0.6), BC (R2 = 1, Q2 = 0.7), in conclusion, R2 >0.5, Q2 >0.3. Consistently, there were significant differences in each group in the positive mode, the sample representation was good, and the degree of prediction was high (Figure 10A). Anion analysis tests for AB, AC, and BC pairwise comparison were: AB (R2 = 1, Q2 = 0.7), AC (R2 = 1, Q2 = 0.5), BC (R2 = 0.9, Q2 = 0.2), for the three groups R2 >0.5, AB group and AC group Q2 >0.3, BC group Q <0.3. In the anion mode, the samples with significant differences in each group were well represented, and the AB and AC groups had a large degree of discrimination and a high degree of prediction, while the BC group was not completely reliable, indicating that the endogenous metabolites of the BC groups were close (Figure 10B). The covariance (abscissa) and correlation coefficient (ordinate) of each variable were drawn on an S-plot scatter plot to study the differential contribution of metabolites and grouping variables to the metabolic profiles of each group. The S-plot distribution of cations was as follows: the metabolic load in B&C groups was close to the origin, and the contribution of metabolic differences was small, indicating that the metabolic profiles were similar. However, the metabolite load in groups A&B and A&C exhibited an S-shaped distribution, indicating that there were significant differences in metabolism between groups A and B and C in the cation mode (Figure 10C). The anion S-plot distribution was the same as in the cation mode; in the anion mode-plot scatter diagram, the metabolic load in groups B&C was close to the origin and did not account for the difference, indicating that the metabolic profiles of groups B and C were similar. Meanwhile, the metabolite load in groups A&B and A&C exhibited an obvious S-shaped distribution, indicating significant differences in metabolic profiles (Figure 10D).
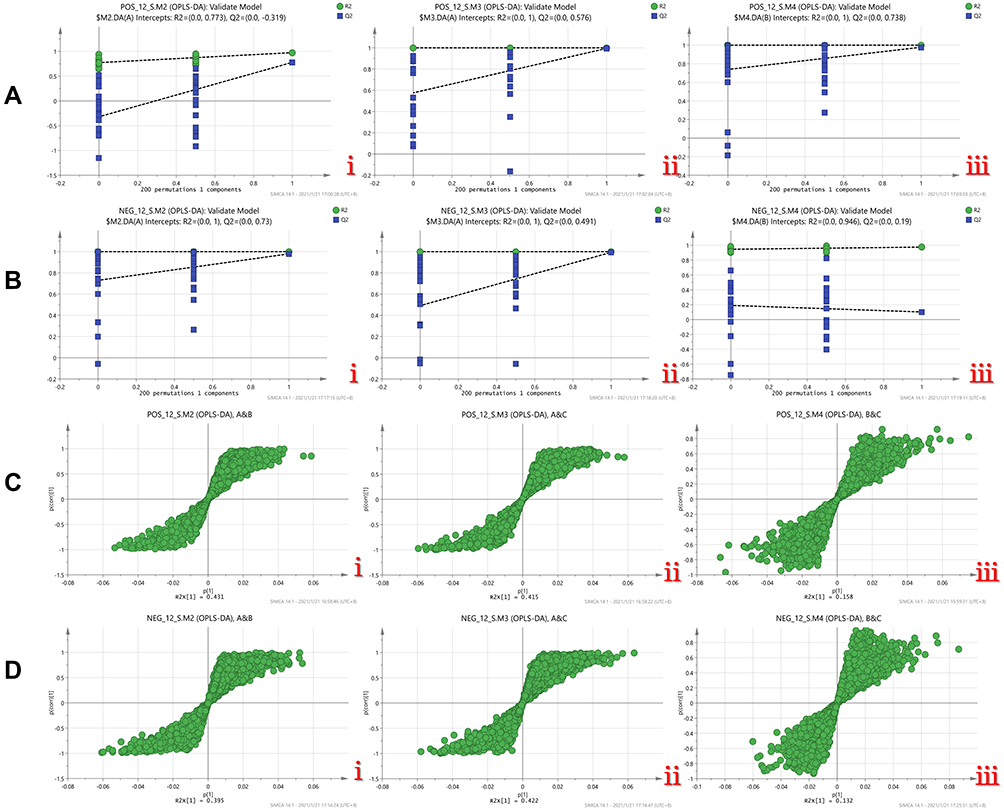 |
Figure 10 (A) Permutation test diagram of three groups of OPLS-DA models in positive mode, i.A/B group, ii.A/C group, ii.B/C group. (B) Permutation test of three groups of OPLS-DA models in anion mode Figure, i.A/B group, ii.A/C group, ii.B/C group. (C) S-plot of metabolites in positive mode, i.A&B group, ii.A&C group, iii. B&C group. (D) Anion mode Lower metabolite S-plot, i.A&B group, ii.A&C group, iii.B&C group. |
Analysis of Metabolic Pathways and Metabolites in Rat Intervertebral Disc
R software was used to generate a heatmap of the metabolic pathway characteristics and conduct pairwise comparisons among the degenerative disc groups (Figure 11). Several metabolic pathways with significant differences were identified: differential metabolic pathways among groups A, B and C included: ① Glutathione metabolism ② Glycine, serine, threonine metabolism ③ Inositol phosphate metabolism ④Purine metabolism ⑤Amino sugar and nucleotide sugar metabolism ⑥Glycolysis/gluconeogenesis ⑦Cysteine and methionine metabolism ⑧Pentose phosphate pathway ⑨Alanine, aspartate, glutamine Acid metabolism. In homogeneous groups B and C, the difference in metabolic pathways caused structural changes: ① arginine and proline metabolism ② alanine, aspartic acid, and glutamate metabolism.
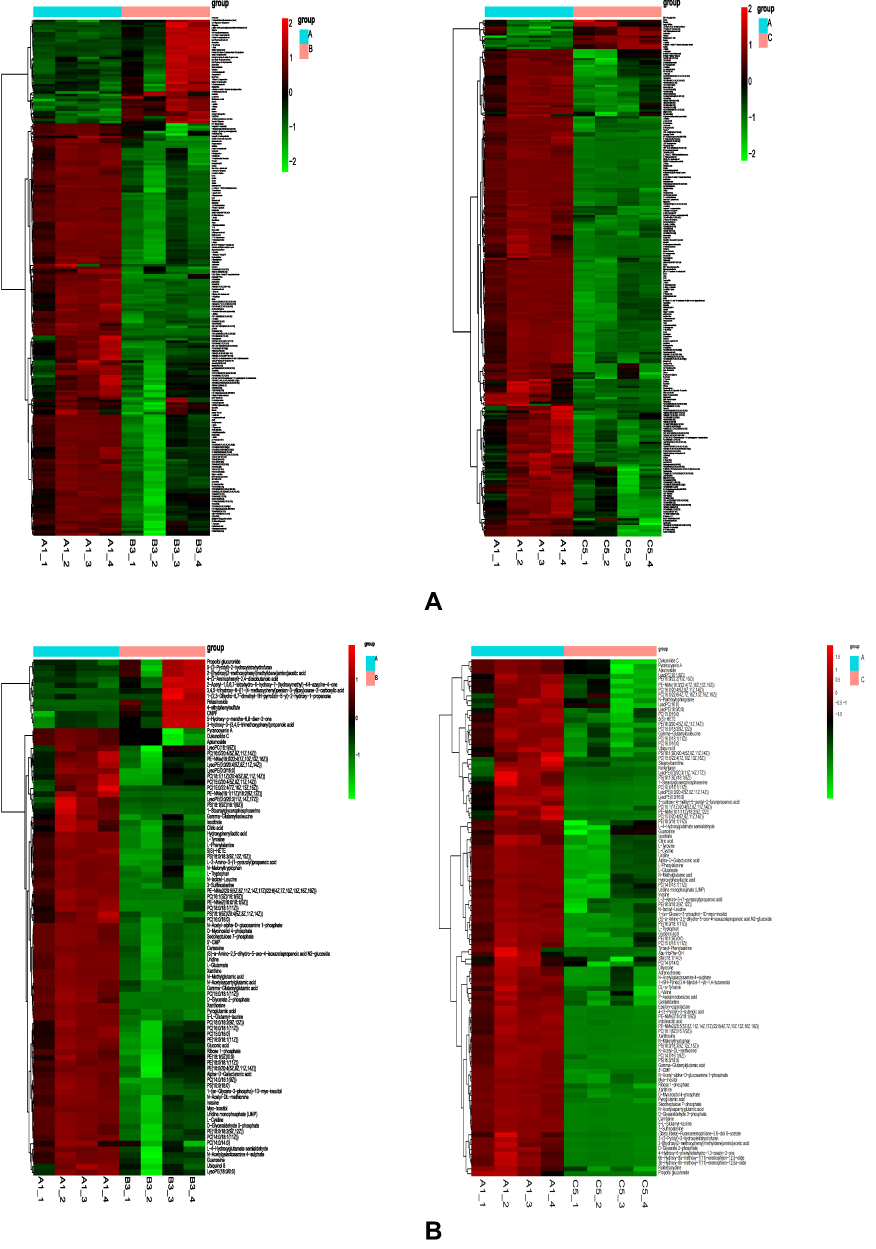 |
Figure 11 Heatmap showing metabolic pathways of the three groups of intervertebral disc (A) cations. (B) Anions. |
To understand the metabolic pathways at the core and the shared and unique metabolic pathway analysis in each group comparison, we generated a Venn plot for the pairwise comparison of the differential pathways between each group for their respective datasets (Figure 12). We found that the metabolites significantly differed between the AB and AC groups, while relatively fewer metabolites were found in the BC group. We summarized the landmark metabolites of groups A and B and groups A and C in Table 3 and Table 4. Groups A and B intersection yielded 15 differentially contributing metabolites, involving 6 major metabolic pathways. Moreover, the intersection of groups A and C yielded 19 differentially contributing metabolites, involving 6 major metabolic pathways.
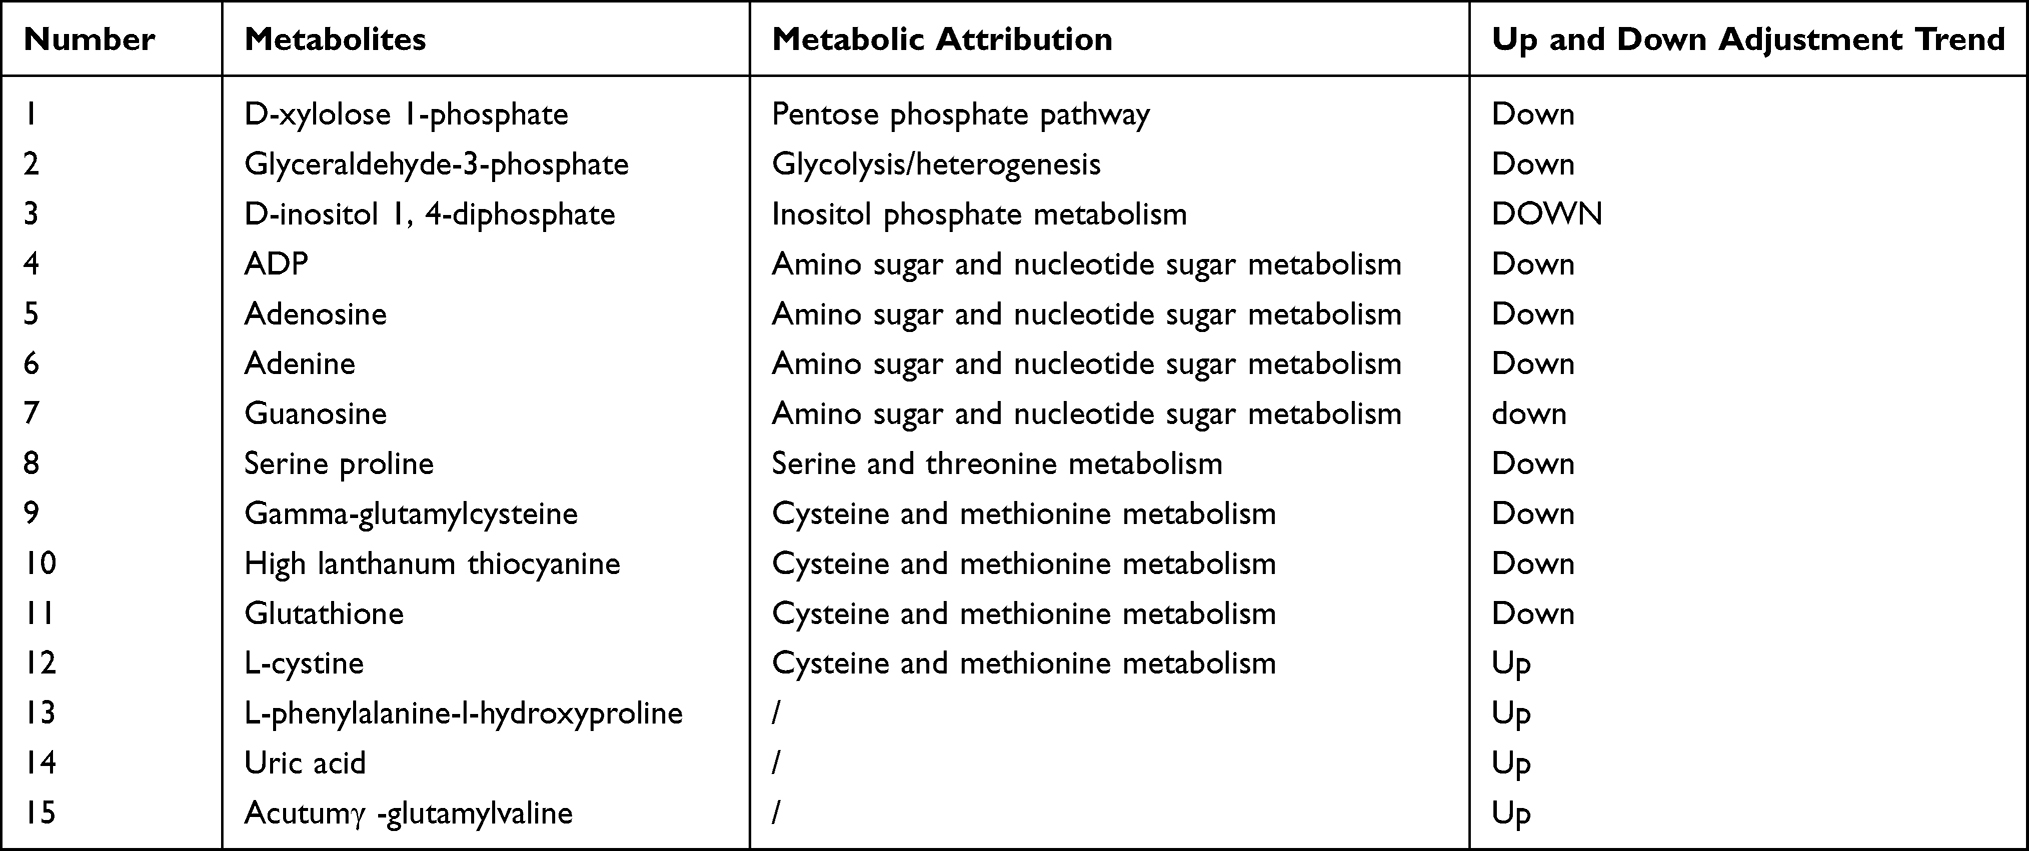 |
Table 3 Comparison of Differential Metabolites Between Groups A and B |
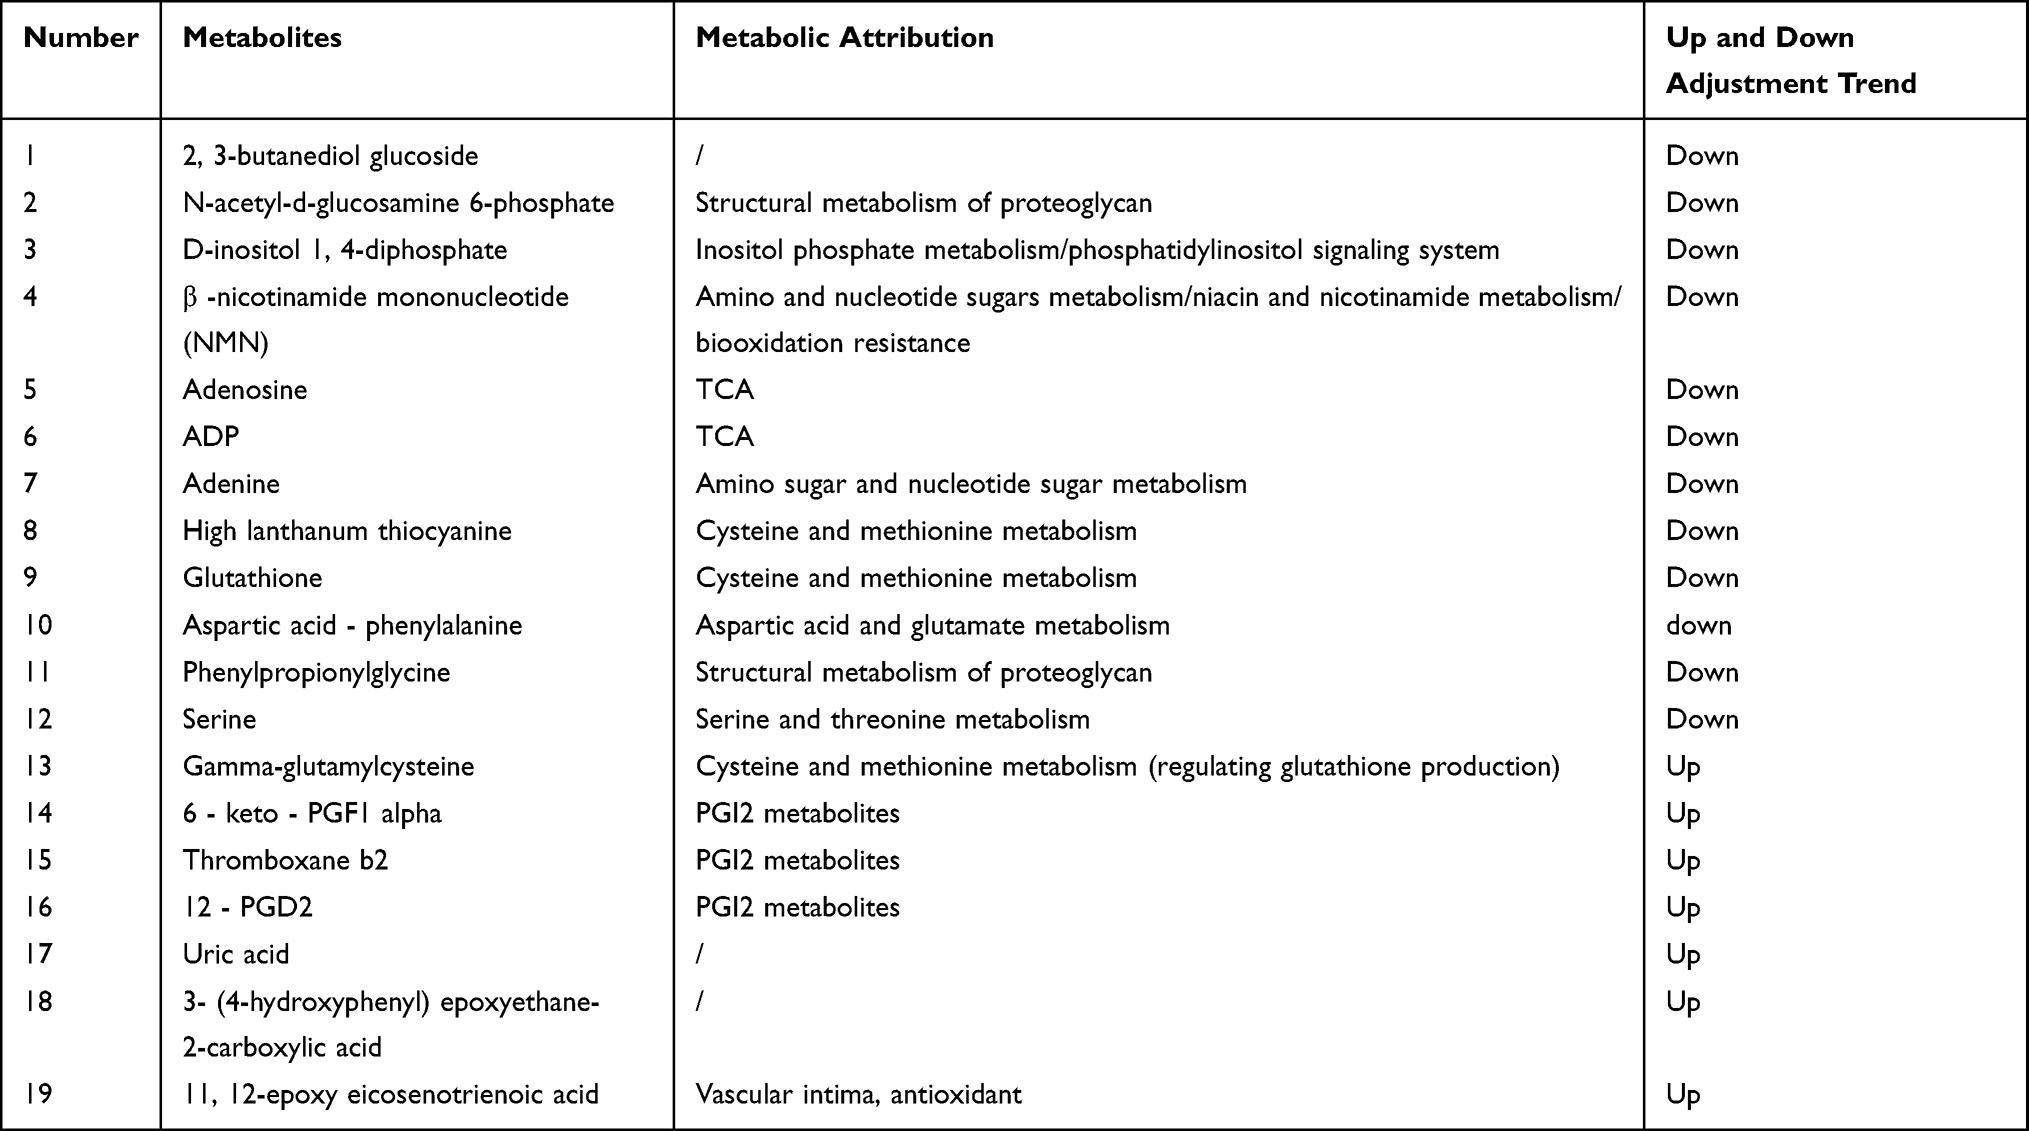 |
Table 4 Distribution of Major Differential Metabolites in Groups A and C |
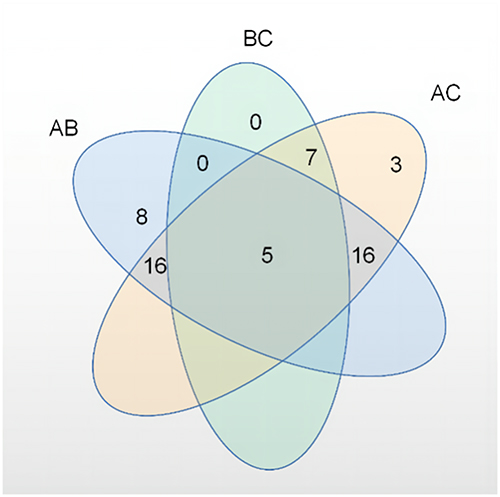 |
Figure 12 Venn plot of differential metabolic pathways among the three groups. |
Based on the pathways of the differential metabolites in the intervertebral discs of each group and the quantitative changes in the degeneration process, we screened out differences in the expression of the differential metabolites and determined whether the metabolites were upregulated and downregulated. Downregulated metabolites included ①Cationic compounds: acetylcholine, β-nicotinamide mononucleotide, phosphorylcholine, homolanthionine, L-serine, N-acetyl-D-glucosamine 6-phosphate, glutathione Peptides; ②Anionic compounds: 5-L-glutamyl-L-alanine, adenine, ADP, cysteine glutathione disulfide, D-inositol 1,4-bisphosphate, isoleucine amino acid, phenylpropionylglycine, serine, serine-proline, UDP glucose, valine (Figure 13). Upregulated metabolites included deoxynucleosides, tyrosine-serine, alpha-D-galacturonic acid, isoleucine-hydroxyproline, L-cystine, L-glutamic acid, and inositol (Figure 14).
 |
Figure 13 Comparison statistics between groups of hallmark metabolites downregulated in rats. *P < 0.05,**P < 0.01, ***P < 0.001. |
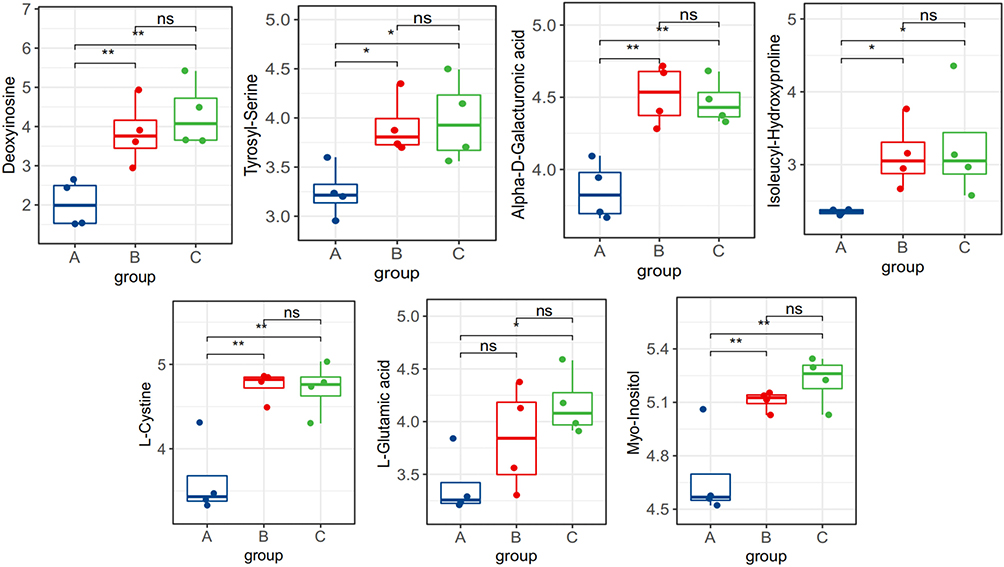 |
Figure 14 Between-group comparison statistics of upregulated landmark metabolites in rats. *P < 0.05,**P < 0.01. |
Magnetic Resonance Spectroscopy Characteristics of Rat Intervertebral Discs in vivo (7.0T)
3.7.1 7.0T Nuclear Magnetic Resonance MRS- 1H Spectrum Qualitative Analysis
MRS-1H spectra of three groups of rat intervertebral discs were qualitatively analyzed using a Bruker BioSpin MRI GmbH 7.0T solid-state MRI instrument (7.0T MRI Bruker®, Germany), and curve fitting was performed after Fourier analysis. The spectral characteristics of the 1H spectra were similar, except that the peaks increase and decrease and the integral changes. Taking the L3 intervertebral disc as an example (Figure 15A), the chemical shift ranges were as follows: Lipid 0.1–0.6ppm, branched-chain amino acid representative area (BCAA) 0.8–1.2ppm, lactic acid (Lac) 1.33ppm, creatine (Cr) 3.5–3.8ppm, N-acetyl formant N-Acetyl<PG>2.02ppm, Choline resonance peak (Cho) 2.50–3.20ppm, and carbohydrate, hydrocarbon peak (Carb) 3.8–4.7ppm. Since the curve fitting method and signal filtering process inevitably lead to bias, an error of ±0.3ppm was observed in the spectrum peak calibration, within the acceptable error range of macroscopic analysis.
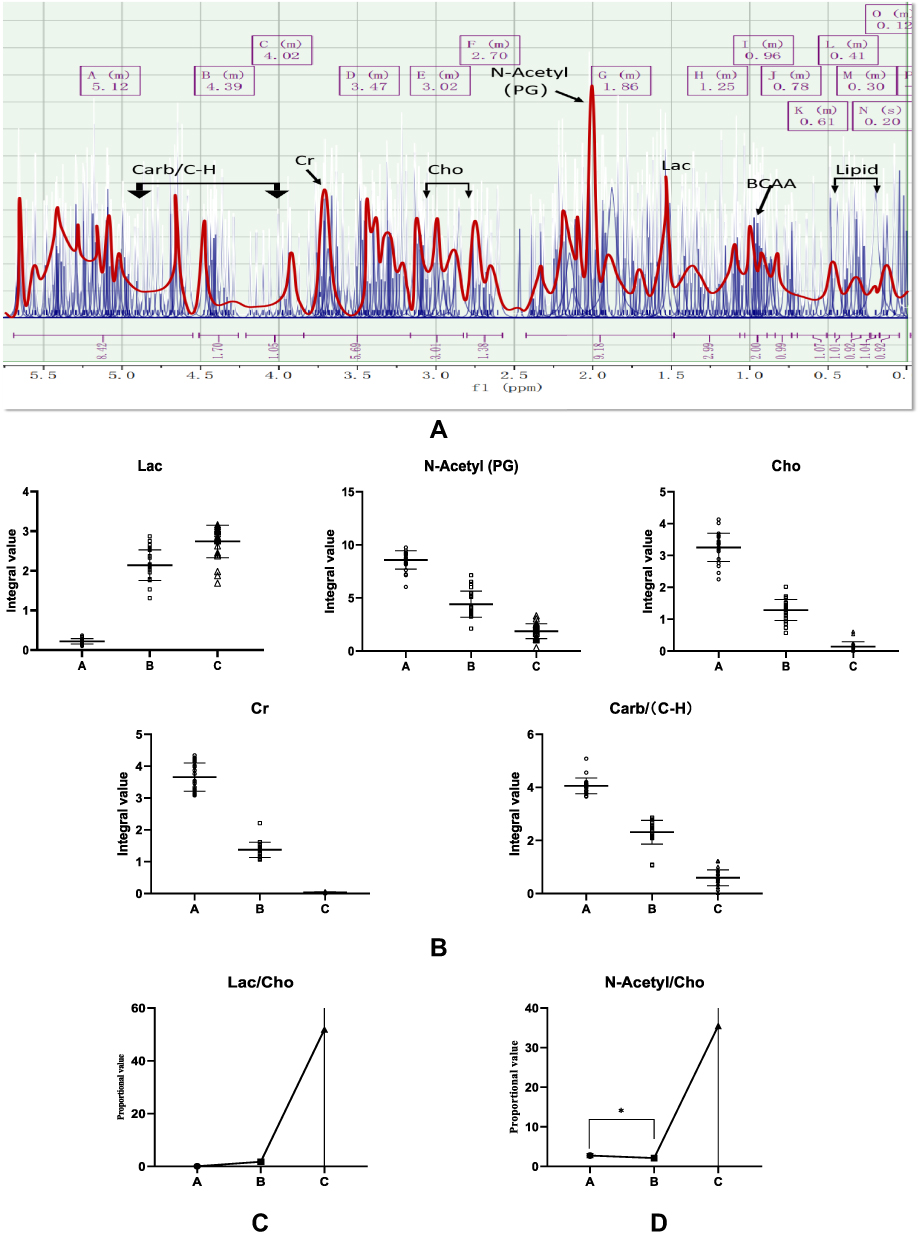 |
Figure 15 (A) 7.0T nuclear magnetic resonance MRS 1H spectrum fitting diagram and peak assignment of rat intervertebral disc in group IIA. (B) Statistical diagram of representative peak distribution of MRS in rat tertiary intervertebral disc; (C) Lac compound peak ratio Statistical graph; (D) Statistical graph of peak ratio of N-Acetyl (PG) compounds. |
Quantitative Analysis of 7.0T NMR MRS 1H Spectrum
Quantitative analysis of single substance peaks in intervertebral discs exhibited good repeatability, while those with an unstable distribution of lipids (Lipid) and branched-chain amino acids (BCAAs) with unclear split peak lines were screened out. Moreover, Lac, N -Acetyl, Cho, Cr, Carb/(C-H) 5 significant peaks were integrated into the sample, and the peak concentration was calculated. Moreover, the mass distribution characteristics of the substance in the same FOV area of the intervertebral disc were quantitatively calculated (Figure 15B). For lactic acid (Lac), the expression increased sharply with the aggravation of intervertebral disc degeneration (P < 0.05), among which the disc distinction in groups B and C was not significant, but it was statistically significant. N-acetyl formant/collagen (N-Acetyl/collagen) PG), which exhibited the first largest peak of total substance distribution, was stable at 2.02ppm, exhibiting a single peak, and the distribution of this substance tended to decrease with the aggravation of intervertebral disc degeneration (P < 0.05). Moreover, Choline compounds are reportedly associated with cell membrane properties, participating in metabolism and material transport. With the degeneration of intervertebral discs aggravating, the peak fragmentation increased and the integral value decreased (P < 0.05); Besides, Creatine (Cr) is an important energy storage substance that determines the flow direction and distribution of ATP, exhibiting a decreasing trend with the exacerbation of intervertebral disc degeneration (P < 0.05). The gender component is easily affected by multiple factors, but the concentration levels of this compound are often characteristic. With the aggravation of intervertebral disc degeneration, the concentration of this compound tended to decrease (P < 0.05).
In addition, since many factors interfere with the peak measurement of a single substance, the individual characteristics cannot be displayed.
Some biases and systematic errors between groups were analyzed, and the ratios of the respective peak compositions were further investigated. The ratios of several types of substances are as follows:
Discussion
Intervertebral disc degeneration (IDD) is well established as one of the main causes of discogenic pain.12,13 Although the specific cause of this pain remains unclear, it is widely believed that abnormal increase or decrease of inflammation and certain metabolites are related to the pathogenesis of discogenic pain.14 Studies have shown that the pathology of lumbar intervertebral disc low back pain is endplate injury, radial rupture of the inner annulus fibrosus, degradation of the intervertebral disc matrix, inflammatory reaction of the intervertebral disc matrix, and chemical substances that stimulate the nerve endings of the outer annulus fibrosus.15 Hampton et al15 believed that a fissure in the annulus fibrosus after the degeneration of the intervertebral disc caused disc-derived low back pain, through which the nucleus pulposus fluid leaked out and acted on the dural sac or nerve root sheath to cause low back pain and leg pain. An increasing body of evidence suggests that the inflammatory response is the underlying pathogenesis of discogenic low back pain. Inflammation, either due to direct chemical stimulation of the nucleus pulposus of an immune response secondary to the nucleus pulposus, has been implicated in the development of low back pain.6 Inflammation or direct chemical stimulation of the nucleus pulposus or an immune response secondary to the nucleus pulposus has been implicated in the development of low back pain.
The innervation of the lumbar intervertebral disc is derived from the sinus vertebral and sympathetic nerves. In 1990, Goren et al16 applied highly specific acetylcholine to stain the sinuvertebral nerve and found that the sinuvertebral nerve innervating the intervertebral disc originated from the DRG, which explained the anatomical basis of discogenic pain (Figure 16). Disc herniation releases inflammatory mediators leading to perineural inflammation, which results in radicular discogenic pain.17 DRG assumes and transmits this pain, which is clinically called “chemical radiculitis”,18 which further elucidated the pathological mechanism of discogenic pain. However, these anatomical-dependent pathological changes mostly appear in MRI examinations. The High-Intensity Zone (HIZ) findings explain that changes in certain metabolites in the intervertebral disc are the direct cause of discogenic pain.19 Nonetheless, this finding has not been effectively validated in metabolite validation and molecular level studies. This study established a rat discogenic pain model by injection of PBS to disc-puncture IDD model to induce pain. At the same time, molecular biology experiments found that the pain caused by intervertebral disc degeneration was consistent with the increased inflammatory mediator IL-6 and TMEM100 expression.
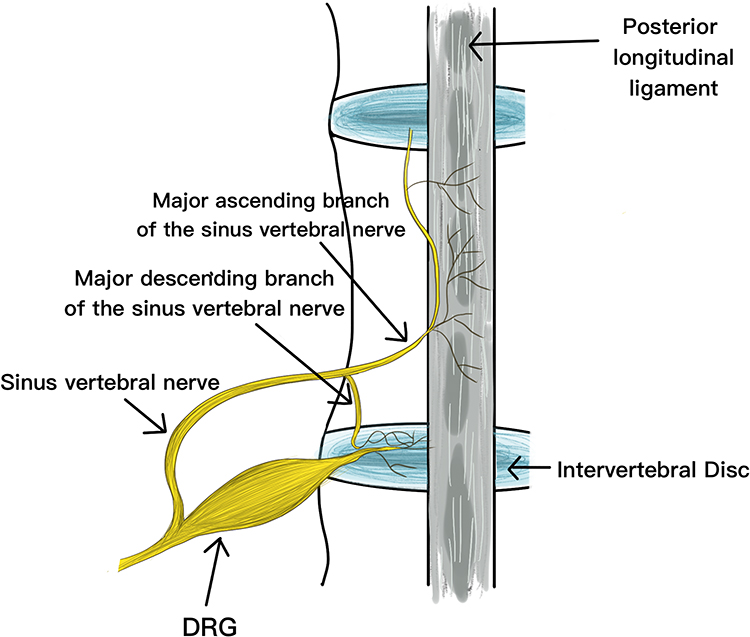 |
Figure 16 The sinuvertebral nerves branched from the DRG are distributed to the posterior aspect of the lumbar disc and the posterior longitudinal ligament. |
There is a rich literature available suggesting that inflammatory factor infiltration after intervertebral disc degeneration may be one of the causes of discogenic pain, but the relationship between the degree of inflammatory infiltration in intervertebral discs and the degree of degeneration remains unclear. Weng et al8 quantified inflammatory markers in the intervertebral disc of a rat model of intervertebral disc degeneration and pain and found that transmembrane junction protein TMEM100 is also expressed in DRG and has functional and physical effects on TRPA1 and TRPV1. Interestingly, it forms a complex with TRPA1 and TRPV1 in DRG neurons and heterologous systems, selectively enhancing TRPA1-related activity by increasing the probability of channel opening. Moreover, studies have found that a reduction in inflammatory mechanical hyperalgesia and TRPA1 in TMEM100-deficient mice.8 Studies found that TMEM100 is mainly localized to calcitonin gene-related peptide (CGRP)-positive peptide neurons in the DRG and trigeminal ganglia, and its expression is increased in inflammatory pain,7 which is similar to our results in the intervertebral disc. IL-6, as an important inflammatory factor, has been established to cause discogenic pain by mediating the expression of TMEM100. The production of inflammation is mostly related to the decomposition of carbohydrates and proteins. In this complex metabolic process, the accumulation of metabolic end products such as NO, ammonia, and lactic acid has been documented to be an important chemical substance for discogenic pain. Ethanolamine often appears as an antigenic substance in the metabolic process, and the content of this substance is also closely related to the mechanism of intervertebral disc degeneration. Therefore, the differences in gene expression and metabolite changes in this experiment were compared with those in intervertebral disc degeneration. In the discogenic pain model, the expressions of TMEM100 and IL-6 were significantly increased compared with normal intervertebral discs, and there were significant metabolic differences between discogenic pain intervertebral discs and degenerative discs. The metabolic pathways and metabolites of painful intervertebral discs are mainly glycerol-serine-threonine metabolism, glutathione metabolism, etc., and 15 major contributing metabolites were found, involving 6 major metabolic pathways: sugar metabolism: pentose phosphate pathway, glycolysis/neogenesis, amino sugar and nucleotide sugar metabolism; protein metabolism: serine and threonine metabolism, cysteine and methionine metabolism; small molecule metabolism: inositol phosphate metabolism. These metabolic pathways suggest that metabolites such as NO, ammonia, and lactic acid are metabolic endpoints. Importantly, the metabolomic analysis found glycerol-serine-threonine metabolism in the intervertebral discs. KEGG pathway analysis found that ammonia and nitrogen-containing substances are regulated by this pathway. Another important metabolite, ethanolamine, is closely related to this pathway in the structural metabolism of intervertebral discs. In addition, in vitro magnetic resonance spectroscopy (MRS) was used for qualitative and quantitative analysis of discogenic pain intervertebral discs. It was found that Lac content increased while N-Acetyl/PG, Cho, Cr, and Carb decreased, indicating that the metabolic features of discogenic pain are characterized by an increase of acidic substances, the degradation of amino acids into ammonia substances, the regulation of inflammatory metabolites by ethanolamine, and the changes in the molecular structure of energy supply and energy with the progress of inflammation. At the anatomy level, we found that sympathetic nerves are widely distributed on the surface of the annulus fibrosus, which is consistent with findings reported by Goren et al.16 The immunofluorescence assay confirmed increased expression of TMEM100 and IL-6 in DRGs on painful discs, leading to increased pain, consistent with the literature.20 Peritore et al21 found that ethanolamine reduced the release of cytokines such as IL-6, IL-1β, TNF-α, and IL-18. Moreover, Klain et al22 found that urea, glycine, serine, choline and uric acid are urinary metabolites of ethanolamine. These reports are in agreement with our findings that ethanolamine is associated with glycan-serine-threonine metabolism and modulates inflammatory metabolites.
Herein, untargeted metabolomics was used to validate the unique role of the Gly-Ser-Thr pathway in the overall metabolic process. A study by Miguel A et al found that the most enriched pathways in rats on different diets were aminoacyl t-RNA biosynthesis, Gly-Ser-Thr, glutathione, taurine-veal taurine, cysteine.23 The amino acid-methionine metabolic pathway is the most enriched central catabolism and redox-related pathway. In the present experiment, the conclusions of the non-targeted metabolomic analysis of intervertebral discs reached similar conclusions: topologically, the “centrality” and “intercentrality” indicators of the pathway network associated with Gly- and Ser-Thr metabolism indicate the importance of this pathway in the “core” metabolic network (Figure 17). Indeed, the interaction between Gly-Ser-Thr represents an important metabolic crossroad linked to several highly important biological pathways (Figure 17). It is well established that Gly-Ser-Thr can be interconverted by the action of two enzymes, serine hydroxymethyltransferase (SHMT) and threonine aldolase;24,25 the final result is a key pathway providing many energy precursors and NADPH. In this experiment, the upstream metabolite of this pathway, ethanolamine, was observed in all stages of the intervertebral disc and was inversely related to the progression of inflammatory disc degeneration. This finding also suggests that the metabolic pathway of Gly-Ser-Thr gradually weakened with the progression of inflammation, which substantiates that this mechanism, as a hub of energy transport and reduction reaction, plays a key role in inhibiting the energy supply and inflammatory response of intervertebral disc, and is of great significance in delaying inflammatory degeneration of intervertebral disc and relieving discogenic pain.26
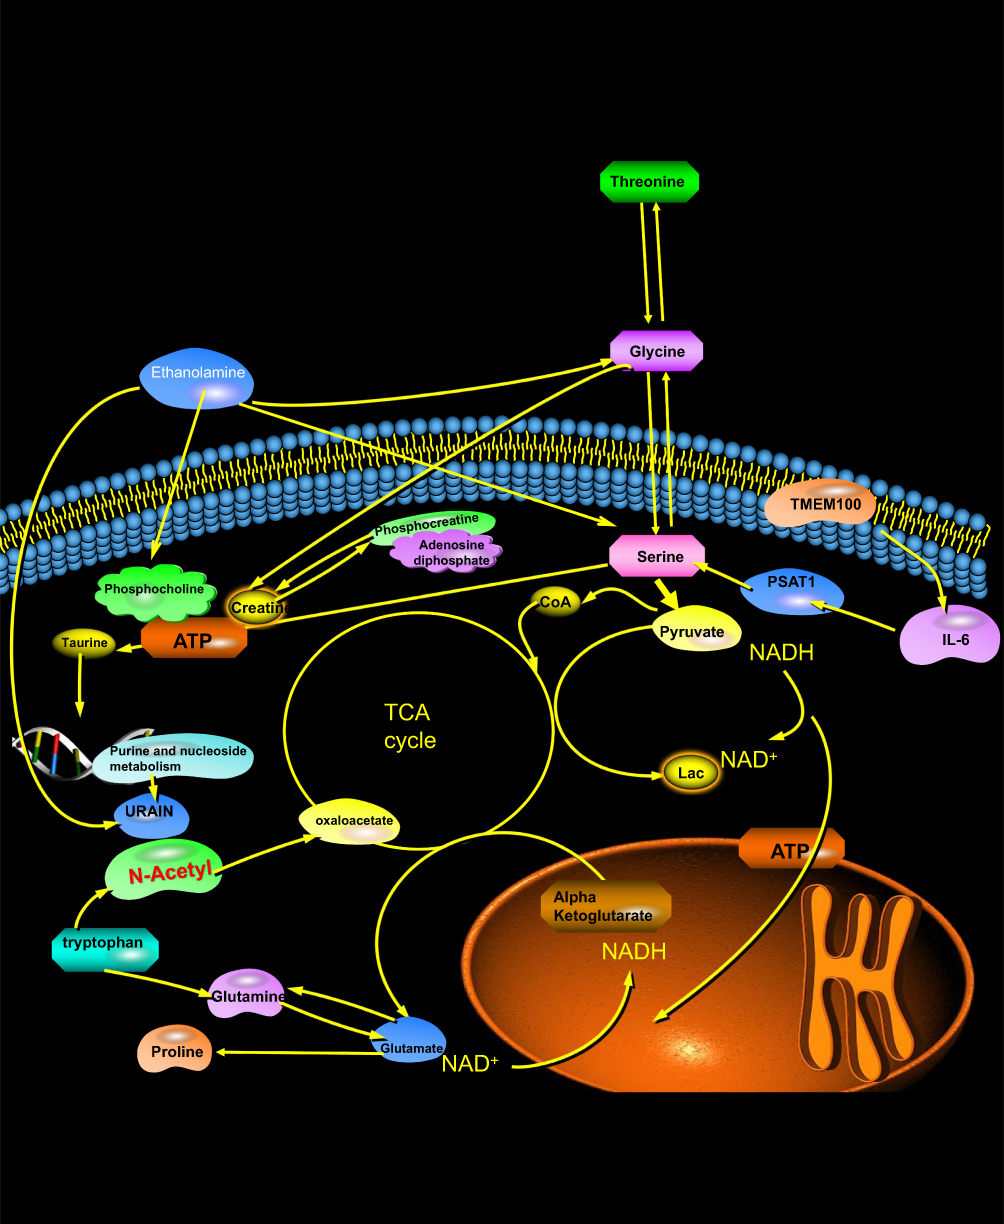 |
Figure 17 Energy metabolism pathways of nucleus pulposus cells and matrix and the background principle of MRS metabolism. |
Magnetic Resonance Imaging (MRI) technology provides a visual approach for the study of intervertebral disc degenerative diseases. Discogenic pain can be shown by routine scanning, and although the changes in its collagen and proteoglycan can be roughly understood, this detailed metabolic process cannot be comprehensively examined. Importantly, MRS can show the metabolic changes of internal tissue.27 In this study, five significant peaks of Lac, N-Acetyl, Cho, Cr and Carb/(Cmerh) were used as metabolic markers, and quantitative and qualitative analysis of Lac/Cho and N-Acetyl/Cho spectra was further carried out. Our results confirm the above conclusions of in vitro NMR spectroscopy metabolomics, showing that Lac/Cho, N-Acetyl/Cho increased with the aggravation of intervertebral disc degeneration, especially in the late stages of degeneration, and the sharp increase was characteristic of this group. This finding suggests that lactic acid balance is dysregulated, leading to lactic acid accumulation.
The ratio of choline compounds, for instance, Lac/Cho, can indicate changes in the metabolic environment of the acid environment and ethanolamine degradation metabolites in the intervertebral disc. Although this ratio increases during discogenic pain, it is often slower than normal degeneration. It is widely thought that this situation may be due to the active inhibition of the accumulation of acidic substances by the glycan-serine-threonine pathway; however, choline compounds are reduced due to the anti-inflammatory effect of ethanolamine. Importantly, mass spectrometry metabolomics and NMR studies confirmed that the amount of N-Acetyl and Cho is decreased. Accordingly, it is highly likely that both indicators sustain similar decreases in the discogenic pain model. In common cases of intervertebral disc degeneration, the abnormal proportions result from the rapid progress of inflammation that inhibits the Gly-Ser-Thr pathway, weakening the anti-inflammatory effect of ethanolamine, leading to substantial reductions in Cho, suggesting that activation of the Gly-Ser-Thr pathway in the discogenic pain model leads to a reduction in the rate of direct consumption and decomposition of carbon-based compounds, and the reduced compounds and precursors of various functional compounds provided by this pathway can alleviate the progression of inflammation.28,29
The increased expression of IL-6 in discogenic pain caused by intervertebral disc degeneration is well established.30 Cui et al31 found that the expression of IL-6 in NP cells is affected by the JNK/ERK/p38-MAPK signal pathway. Pan et al7 have shown that the expression of TMEM100 is also related to the MAPK signaling pathway and regulates the phosphorylation level of ERK and JNK proteins. This finding suggests that TMEM100 may participate in the activation and expression of IL-6 through JNK/ERK/p38-MAPK signal pathway. Some studies have confirmed that20 IL-6 can increase the excitability of pain receptors by inducing the hyperexcitability of DRG neurons, increasing the amplitude of voltage-gated channels, and activating the JAK/PI3K signal pathway to upregulate the TRPV1 function of the DRG neurons, thus causing inflammatory pain.32–35 TMEM100 is reportedly co-expressed with TRPA1 and TRPV1 in DRG and forms a complex with TRPA1 and TRPV1. Current evidence suggests that TMEM100 can enhance the activity of TRPA1 in a TRPV1-dependent manner in the dorsal root ganglion; TRPA1 is involved in inflammatory mechanical hyperalgesia, while the expression of TMEM100 is significantly increased in pain caused by inflammation. TMEM100 knockout can significantly reduce inflammatory pain. These findings substantiate the relationship between IL-6 and TMEM100, and its expression is increased in inflammatory pain, which is consistent with our results.8,36,37
In addition, Xu et al38 found that the expression of IL-6 in atherosclerotic inflammation is inhibited by ethanolamine. Our study found that IL-6 was significantly increased, and ethanolamine decreased in discogenic pain caused by inflammation, which was consistent with decreased expression of ethanolamine found during metabonomics analysis.
Clinical evidence indicates a significant difference in the speed of intervertebral disc degeneration between patients with discogenic low back pain and patients with intervertebral disc degeneration. The disc degeneration process in patients with discogenic pain is often long, while the duration for imaging in the middle stage of degeneration is often short in patients with natural degeneration, which may be attributed to the findings of the above studies. This experiment also has certain limitations, mainly attributed to the lack of human intervertebral discs as samples for metabolomic analysis due to ethical constraints, and the robustness of the conclusions needs to be further verified.
Data Sharing Statement
The datasets used and/or analyzed during the current study are available from the authors Zhaoyang Guo and Xiaolin Wu on reasonable request.
Acknowledgments
We thank Zuoran Fan, Youfu Zhu, Master Huifei Cui (Qingdao University Affiliated Hospital) for generously sharing their experiences.
Funding
This work was supported by Shandong Provincial Natural Science Foundation (ZR2022MH218); Youth Research Fund of Affiliated Hospital of Qingdao University in 2021 (QDFYQN202101012). The National Natural Science Foundation of China (82172478); National Key Research and Development Project (2019YFC0121404); Shandong Higher Education Young Science and Technology Support Program (2021KJ048); Innovation Fund of National Orthopedics and Sports Rehabilitation Clinical Medicine Research Center (2021-NCRC-CXJJ-ZH-02); The Young Taishan Scholars Program (tsqn201909190); Postdoctoral Science Foundation of China (2021M701813); Qingdao Postdoctoral Applied Research Project (2020).
Disclosure
The authors declare no potential conflicts of interest.
References
1. Schwarzer AC, Aprill CN, Derby R, Fortin J, Kine G, Bogduk N. The prevalence and clinical features of internal disc disruption in patients with chronic low back pain. Spine. 1995;20(17):1878–1883. doi:10.1097/00007632-199509000-00007
2. Pai S, Sundaram LJ. Low back pain: an economic assessment in the United States. Orthop Clin North Am. 2004;35(1):1–5. doi:10.1016/S0030-5898(03)00101-9
3. Yoo YH, Yoon CS, Eun NL, et al. Interobserver and test-retest reproducibility of T1ρ and T2 measurements of lumbar intervertebral discs by 3T magnetic resonance imaging. Korean J Radiol. 2016;17(6):903–911. doi:10.3348/kjr.2016.17.6.903
4. DePalma MJ, Ketchum JM, Saullo T. What is the source of chronic low back pain and does age play a role? Pain Med. 2011;12(2):224–233. doi:10.1111/j.1526-4637.2010.01045.x
5. Pope MH. Biomechanics of the lumbar spine. Ann Med. 1989;21(5):347–351. doi:10.3109/07853898909149219
6. Suzuki S, Fujita N, Fujii T, et al. Potential involvement of the IL-6/JAK/STAT3 pathway in the pathogenesis of intervertebral disc degeneration. Spine. 2017;42(14):E817–e24. doi:10.1097/BRS.0000000000001982
7. Pan LX, Li LY, Zhou H, et al. TMEM100 mediates inflammatory cytokines secretion in hepatic stellate cells and its mechanism research. Toxicol Lett. 2019;317:82–91. doi:10.1016/j.toxlet.2018.12.010
8. Weng HJ, Patel KN, Jeske NA, et al. Tmem100 is a regulator of TRPA1-TRPV1 complex and contributes to persistent pain. Neuron. 2015;85(4):833–846. doi:10.1016/j.neuron.2014.12.065
9. Liang X, Xie R, Hou B, et al. Feasibility study for evaluating lumbar intervertebral disc degeneration using histogram analysis of T2* values. Eur Spine J. 2020;29(10):2600–2608. doi:10.1007/s00586-020-06476-7
10. Chaplan SR, Bach FW, Pogrel JW, Chung JM, Yaksh TL. Quantitative assessment of tactile allodynia in the rat paw. J Neurosci Methods. 1994;53(1):55–63. doi:10.1016/0165-0270(94)90144-9
11. Yoon C, Wook YY, Sik NH, Ho KS, Mo CJ. Behavioral signs of ongoing pain and cold allodynia in a rat model of neuropathic pain. Pain. 1994;59(3):369–376. doi:10.1016/0304-3959(94)90023-X
12. Gigante A, Liberatori M, Gasperini ML, et al. Prevalence and clinical features of patients with the cardiorenal syndrome admitted to an internal medicine ward. Cardiorenal Med. 2014;4(2):88–94.
13. Saal JS. The role of inflammation in lumbar pain. Spine. 1995;20(16):1821–1827. doi:10.1097/00007632-199508150-00013
14. Zwart JA, Iversen OJ, Sand T, Dale LG, Unsgård G. Higher levels of antibodies against the psoriasis-associated antigen pso p27 in cerebrospinal fluid from patients with low back pain and sciatica. Spine. 1999;24(4):373–377. doi:10.1097/00007632-199902150-00016
15. Saal JS, Franson RC, Dobrow R, Saal JA, White AH, Goldthwaite N. High levels of inflammatory phospholipase A2 activity in lumbar disc herniations. Spine. 1990;15(7):674–678. doi:10.1097/00007632-199007000-00011
16. Avivi C, Cui S, Goren S, Goldstein RS. Differences in neuronal differentiation between the transient cranial (Frorieps’) and normal dorsal root ganglia. Dev Brain Res. 2002;135(1–2):19–28. doi:10.1016/S0165-3806(02)00272-9
17. Nygaard OP, Mellgren SI, Osterud B. The inflammatory properties of contained and noncontained lumbar disc herniation. Spine. 1997;22(21):2484–2488. doi:10.1097/00007632-199711010-00004
18. Harrington JF, Messier AA, Bereiter D, Barnes B, Epstein MH. Herniated lumbar disc material as a source of free glutamate available to affect pain signals through the dorsal root ganglion. Spine. 2000;25(8):929–936. doi:10.1097/00007632-200004150-00006
19. Wang ZX, Hu YG. Imaging analysis of the high-intensity zone on lumbar spine magnetic resonance images: classification, features and correlation with low back pain. J Pain Res. 2021;14:2981–2989. doi:10.2147/JPR.S332509
20. Fang D, Kong LY, Cai J, et al. Interleukin-6-mediated functional upregulation of TRPV1 receptors in dorsal root ganglion neurons through the activation of JAK/PI3K signaling pathway: roles in the development of bone cancer pain in a rat model. Pain. 2015;156(6):1124–1144. doi:10.1097/j.pain.0000000000000158
21. Peritore AF, D’Amico R, Siracusa R, et al. Management of acute lung injury: palmitoylethanolamide as a new approach. Int J Mol Sci. 2021;22:11. doi:10.3390/ijms22115533
22. Klain GJ, Reifenrath WG, Black KE. Distribution and metabolism of topically applied ethanolamine. Fundam Appl Toxicol. 1985;5(6 Pt 2):S127–33. doi:10.1016/0272-0590(85)90122-8
23. Aon MA, Bernier M, Mitchell SJ, et al. Untangling determinants of enhanced health and lifespan through a multi-omics approach in mice. Cell Metab. 2020;32(1):100–16.e4. doi:10.1016/j.cmet.2020.04.018
24. Ogawa H, Gomi T, Fujioka M. Serine hydroxymethyltransferase and threonine aldolase: are they identical? Int J Biochem Cell Biol. 2000;32(3):289–301. doi:10.1016/S1357-2725(99)00113-2
25. Ogawa H, Gomi T, Fujioka, M. Serine hydroxymethyltransferase and threonine aldolase: are they identical?. Int J Biochem Cell Biol. 2000;32(3):289–301. doi:10.1016/s1357-2725(99)00113-2.
26. Tyshkovskiy A, Bozaykut P, Borodinova AA, et al. Identification and application of gene expression signatures associated with lifespan extension. Cell Metab. 2019;30(3):573–93.e8. doi:10.1016/j.cmet.2019.06.018
27. Rodríguez-Coira J, Delgado-Dolset MI, Obeso D, et al. Troubleshooting in large-scale LC-ToF-MS metabolomics analysis: solving complex issues in big cohorts. Metabolites. 2019;9:11. doi:10.3390/metabo9110247
28. Brown SA, Gaspar L. Circadian metabolomics: insights for biology and medicine. In: Sassone-Corsi P, Christen Y, editors. A Time for Metabolism and Hormones. Cham (CH): Springer; 2016.
29. Jordan SD, Lamia KA. AMPK at the crossroads of circadian clocks and metabolism. Mol Cell Endocrinol. 2013;366(2):163–169. doi:10.1016/j.mce.2012.06.017
30. Kepler CK, Markova DZ, Dibra F, et al. Expression and relationship of proinflammatory chemokine RANTES/CCL5 and cytokine IL-1β in painful human intervertebral discs. Spine. 2013;38(11):873–880. doi:10.1097/BRS.0b013e318285ae08
31. Cui H, Du X, Liu C, et al. Visfatin promotes intervertebral disc degeneration by inducing IL-6 expression through the ERK/JNK/p38 signalling pathways. Adipocyte. 2021;10(1):201–215. doi:10.1080/21623945.2021.1910155
32. Jeevakumar V, Al Sardar AK, Mohamed F, Smithhart CM, Price T, Dussor G. IL-6 induced upregulation of T-type Ca(2+) currents and sensitization of DRG nociceptors is attenuated by MNK inhibition. J Neurophysiol. 2020;124(1):274–283. doi:10.1152/jn.00188.2020
33. Dib-Hajj SD, Binshtok AM, Cummins TR, Jarvis MF, Samad T, Zimmermann K. Voltage-gated sodium channels in pain states: role in pathophysiology and targets for treatment. Brain Res Rev. 2009;60(1):65–83. doi:10.1016/j.brainresrev.2008.12.005
34. Duzhyy DE, Viatchenko-Karpinski VY, Khomula EV, Voitenko NV, Belan PV. Upregulation of T-type Ca2+ channels in long-term diabetes determines increased excitability of a specific type of capsaicin-insensitive DRG neurons. Mol Pain. 2015;11:29. doi:10.1186/s12990-015-0028-z
35. Joksimovic SL, Joksimovic SM, Tesic V, et al. Selective inhibition of Ca(V)3.2 channels reverses hyperexcitability of peripheral nociceptors and alleviates postsurgical pain. Sci Signal. 2018;11:545. doi:10.1126/scisignal.aao4425
36. Yu H, Shin SM, Wang F, et al. Transmembrane protein 100 is expressed in neurons and glia of dorsal root ganglia and is reduced after painful nerve injury. Pain Rep. 2019;4(1):e703. doi:10.1097/PR9.0000000000000703
37. Petrus M, Peier AM, Bandell M, et al. A role of TRPA1 in mechanical hyperalgesia is revealed by pharmacological inhibition. Mol Pain. 2007;3:40. doi:10.1186/1744-8069-3-40
38. Xu X, Guo H, Jing Z, et al. N-oleoylethanolamine reduces inflammatory cytokines and adhesion molecules in TNF-α-induced human umbilical vein endothelial cells by activating CB2 and PPAR-α. J Cardiovasc Pharmacol. 2016;68(4):280–291. doi:10.1097/FJC.0000000000000413
 © 2023 The Author(s). This work is published and licensed by Dove Medical Press Limited. The full terms of this license are available at https://www.dovepress.com/terms.php and incorporate the Creative Commons Attribution - Non Commercial (unported, v3.0) License.
By accessing the work you hereby accept the Terms. Non-commercial uses of the work are permitted without any further permission from Dove Medical Press Limited, provided the work is properly attributed. For permission for commercial use of this work, please see paragraphs 4.2 and 5 of our Terms.
© 2023 The Author(s). This work is published and licensed by Dove Medical Press Limited. The full terms of this license are available at https://www.dovepress.com/terms.php and incorporate the Creative Commons Attribution - Non Commercial (unported, v3.0) License.
By accessing the work you hereby accept the Terms. Non-commercial uses of the work are permitted without any further permission from Dove Medical Press Limited, provided the work is properly attributed. For permission for commercial use of this work, please see paragraphs 4.2 and 5 of our Terms.