")
Back to Journals » International Journal of Nephrology and Renovascular Disease » Volume 14
The Role of Diffusion-Weighted MRI and Apparent Diffusion Coefficient in Assessment of Diabetic Kidney Disease: Preliminary Experience Study
Authors Mohamed Osman NM, Abdel Kader M , Aziz Nasr TAEL , Sharawy MA, Keryakos HKH
Received 27 March 2020
Accepted for publication 23 September 2020
Published 11 January 2021 Volume 2021:14 Pages 1—10
DOI https://doi.org/10.2147/IJNRD.S254022
Checked for plagiarism Yes
Review by Single anonymous peer review
Peer reviewer comments 2
Editor who approved publication: Professor Pravin Singhal
Nasr Mohamed Mohamed Osman,1 Moustafa Abdel Kader,1 Taghreed A EL Aziz Nasr,1 Mohamed Ahmed Sharawy,2 Hesham Kamal Habeeb Keryakos2
1Radiology Department, Faculty of Medicine, Minia University, El Minia, Egypt; 2Internal Medicine Department, Faculty of Medicine, Minia University, El Minia, Egypt
Correspondence: Moustafa Abdel Kader
Radiology Department, Minia University Hospital, Minia Faculty of Medicine, Aswan-Cairo Agricultural Road, El-Minia 61111, Egypt
Tel +20-1027307617
Email [email protected]
Background: Diabetic kidney disease is the most common cause of ESRD. There is poor correlation between the degree of renal fibrosis and current screening markers. A noninvasive imaging technique is needed to assess the degree of structural changes in the kidney. The aim of this study was to assess the role of apparent diffusion coefficient (ADC) in the diagnosis of diabetic kidney disease. Forty adult diabetic patients with chronic kidney disease as well as 20 age- and sex-matched adult healthy controls were recruited from Nephrology Department of our University Hospital. All patients underwent renal MR-DWI and ADC mapping on a 1.5-T scanner (Philips Achieva) using phased array body coil.
Results: Among the studied 40 diabetic patients, five groups of patients were resulted 8 patients for each and the ADC values were inversely correlated with advancement in renal parenchymal affection, ie, in late stages of the disease the ADC values were lower than in early stages. The mean ADC values of renal parenchyma in patients with diabetic kidney disease were considerably lower than that of healthy controls with normal renal function (2.1± 0.3x10− 3 mm2/s vs 2.4± 0.1x10− 3 mm2/s with p< 0.001).
Conclusion: ADC value is a possible noninvasive technique in evaluating the stage of renal dysfunction with assessment of disease progression.
Keywords: diabetic kidney disease, DW-MRI, ADC value
Background
Chronic kidney disease (CKD) due to diabetes, referred to as diabetic kidney disease or diabetic nephropathy, is a microvascular complication of diabetes mellitus and the most common cause of end-stage renal disease (ESRD) and may reach up to 50% in selected populations.1 The clinical diagnosis of DKD is based on measurement of albuminuria and eGFR along with clinical features such as duration of diabetes and presence of diabetic nephropathy. DKD is associated with increased cardiovascular mortality.2 The earliest manifestation of DKD is microalbuminuria which progresses to macroalbuminuria in about 50% of patients who have a tenfold higher risk of development ESRD.3
Accurate assessment of kidney function is a difficult challenge. In an interesting analysis of the CRIC study, iothalamate GFR (iGFR), which is considered the gold standard measurement of kidney function. It was found not to be superior to estimated GFR equations in explaining four of the CKD comorbidities, namely anemia, hyperkalemia, metabolic acidosis and hyperphosphatemia.4 The only recognized imaging modality for the assessment of renal function is radioisotope scintigraphy. Even though renal scintigraphy allows assessing glomerular filtration rate (GFR) of both kidneys separately, it provides rough approximation to the degree of anatomical tissue damage that is present in DKD.5
Functional renal diffusion-weighted magnetic resonance imaging (DW-MRI), used to show the Brownian motion of the spins in biological tissues and to differentiate between normal and abnormal structures of tissues, has been shown to be a promising technique in the evaluation of renal function. The apparent diffusion coefficient (ADC) is a quantitative parameter calculated from DW-MRI images and represents the water diffusion in the extracellular and extra vascular space as well as capillary perfusion.6–8
This study aimed to assess the role of diffusion-weighted magnetic resonance imaging in evaluating kidney fibrosis in DKD.
Methods
Study Participants
The study was reviewed and approved by the local institutional ethics and review committee of Minia University Hospital and was conducted in accordance with the Helsinki Declaration. Informed written consent was obtained from all participants. This study was an observational study to evaluate whether diffusion-weighted MRI has a role in the diagnosis of DKD with the participants recruited from nephrology unit of the internal medicine department of University Hospital during the period March 2016 to January 2017. All patients and control group underwent DW-MRI of kidneys at the radiology department of University Hospital.
- Inclusion criteria were all diabetic patients with CKD defined clinically by persistent increased albumin-to-creatinine ratio ≥30 mg/g and/or sustained reduction in GFR < 60 mL/min/1.73 m2.
- Exclusion criteria were patients with renal diseases other than diabetes mellitus such as glomerular or tubulointerstitial diseases, patients with obstructive uropathy, patients with unilateral or bilateral atrophic kidneys on ultrasonography, patients with urinary tract infection, patients having one kidney (either congenitally absent kidney or surgically removed), patients with pacemakers or those with MRI claustrophobia.
All subjects enrolled in the study were subjected to clinical and laboratory evaluation. Full history taking, clinical examination including type and duration of diabetes, treatment and the presence of any microvascular or macrovascular complications. Serum creatinine (SCr), blood urea (BU), and estimated glomerular filtration rate (eGFR) were recorded. In this study eGFR was calculated by CKD-EPI (Chronic Kidney Disease Epidemiology Collaboration) equation based on serum creatinine level and other readily available clinical parameters. GFR (mL/min per 1.73 m2) = 141 x min (Scr/κ, 1)α x max (Scr/κ, 1)1.209 x 0.993Age x 1.018 [if female] x 1.157 [if black]
Where κ is 0.7 for females and 0.9 for males, α is −0.329 for females and −0.411 for males, min indicates the minimum of Scr/κ or 1, and max indicates the maximum of Scr/κ or 1.
Patients were classified into five categories based on the level of GFR (mL/min/1.73 m2) and three categories according to the level of albuminuria, according to the K/DOQI CKD (kidney disease outcomes quality initiative) classification. Categories of CKD according to the level of GFR are; G1: eGFR; ≥90 mL/min/1.73 m2, G2: eGFR; 60–89 mL/min/1.73 m2, G3a: eGFR; 45–59 mL/min/1.73 m2, G3b: eGFR; 30–44 mL/min/1.73m2, G4; eGFR; 15–29 mL/min/1.73 m2 and stage 5: eGFR; < 15 mL/min/1.73 m2. GFR stages G1 and G2 without markers of kidney damage do not fulfill the criteria of CKD. Categories of CKD according to the level of albuminuria are; A1: <30 mg/day; A2: 30–299 mg/day; A3: >300 mg/day.
Ultrasonographic assessment of the kidneys was done with the patient in supine and lateral decubitus position. A coupling agent gel was used to make good contact between the transducer and the skin. Examination was performed using Toshiba Nemio XG, Toshiba Medical system, Japan. These scanners’ convex probes produce a frequency of 3.75 MHz. Ultrasonographic examinations of both kidneys were performed by the same radiologist regarding renal size, cortical thickening, cortical echogenicity and corticomedullary differentiation. Renal parenchymal echogenicity was graded using the normal liver or spleen as a reference. Normally the echogenicity of the cortex of the right kidney is hypoechoic to the liver. Grade I nephropathy; the renal parenchyma is isoechoic to the liver. Grade II nephropathy; the renal parenchyma is hyperechoic to the liver with preservation of corticomedullary differentiation. Grade III nephropathy; kidney appears hyperechoic with no corticomedullary differentiation.
MRI examination was performed using a 1.5 MRI scanner (Achieva, Philips Medical Systems, Best, the Netherlands) with a 32-channel phased-array coil. DWI was performed using single-shot echo planar imaging with three orthogonal diffusion sensitization directions, and three b-values (0, 500, 1000 s/mm2). DWI was done in the transverse plane to cover the entire kidneys bilaterally, with free breathing acquisition. Other parameters were as follows: repetition time (TR)/echo time (TE), 7500/73 ms; scan time, 787.5 s; 5 mm slice thickness with a 0.5 mm gap; motion probing gradient, 3 axes; field of view (FOV), 380 mm × 380 mm; matrix size, 256 × 256; and sensitivity encoding (SENSE). To obtain anatomical information, MR images were done using axial and coronal T2-weighted single-shot fast spin-echo (SSFSE) images, T1WI in and out of phase were done in some cases. Imaging analysis was done by experienced radiologist. Regions of interest (ROIs) for quantitative measurement of ADC value were placed on a commercial workstation (Baxera, USA) by a single well-trained radiologist, blinded to clinical and renal function of the patients. ADC value of the kidneys was calculated with diffusion gradient at b-values of 1000 s/mm2. In the axial ADC map, region of interest (ROI) was placed for measurement of ADC values on the renal parenchyma of both kidneys (within the cortex). Three circular ROIs of size 1 cm2 were placed - one each at the upper pole, interpolar region, and lower pole of both kidneys (Figure 1). ADC values were represented as mean ± standard deviation in the form of A × 10−3 mm2/s.
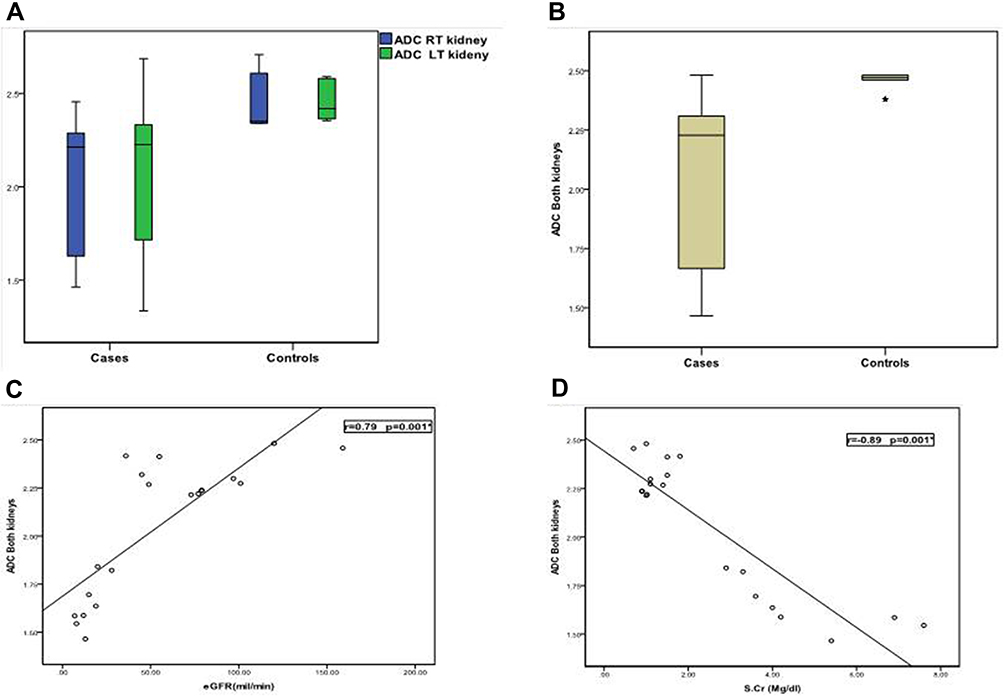 |
Figure 1 (A) Boxplot showed mean ADC value of each kidney in diabetic kidney disease patients and control normal volunteers with normal renal function (low ADC values associated with renal dysfunction). (B) Boxplot showed mean ADC values of both kidneys in cases with diabetic kidney disease and normal renal function, showing higher ADC value of healthy controls than DKD patients (*). (C) Scatter plot with polar line showing correlation between diabetic kidney disease patient ADC values and eGFR among cases. (D) Scatter plot with interpolation line showing converse correlation between mean ADC values and serum creatinine among cases. |
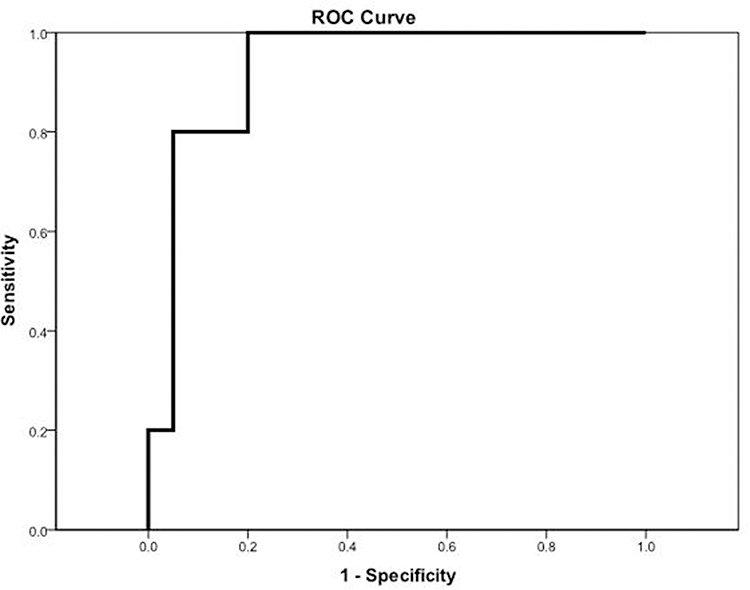 |
Figure 2 Receiver operating characteristics (ROC) curve of mean ADC values in detection of eGFR < 60 mL/min/1.73 m2 in patients with diabetic kidney disease. |
Statistical Analysis
Statistical presentation and analysis of this study were conducted using Chi-squared tests by SPSS V 17; Mann–Whitney and Kruskal–Wallis tests were used to assess the difference between ADC values of renal dysfunction groups. Receiver operating characteristic (ROC) curves were designed to include area under the curve (AUC), differentiation between groups of diabetic kidney dysfunction and cut-off ADC values were used to obtain sensitivity and specificity. The relationship between ADC values and SCr/BU/eGFR was also assessed.
Results
This study enrolled 40 adult diabetic patients (18 males, 22 females with mean age 51.2 years and age range 19–70 years) as well as 20 age- and sex-matched adult normal volunteers (10 males, 10 females with mean age 40.05 years, age range 22–50 years) of both sexes as a control group.
In the healthy adult control group; serum creatinine ranged from 0.6–0.9 mg/dl, blood urea ranged from 30–40 mg/dl and eGFR (estimated glomerular filtration rate) ranged from 136–143 mL/min/1.73 m2) (Table 1). Meanwhile in the diabetic patients, serum creatinine ranged from 0.7–7.6 mg/dl, blood urea ranged from 15.4–186 mg/dl and eGFR ranged from 15–60 mL/min/1.73 m2). Mean serum creatinine was 2.5 mg/dl (range 0.7–7.6 mg/dl) among diabetic patients compared to 0.7 mg/dl (range 0.6–0.9 mg/dl) in healthy controls (p<0.001). Mean blood urea was 80.2 mg/dl (range 15.4–186 mg/dl) among diabetic patients compared to 34 mg/dl (range 30–40 mg/dl) in healthy controls (p<0.001). Mean eGFR was 54.6 mL/min/1.73 m2 (range 7–159 mL/min/1.73 m2) among diabetic patients compared to 139.4 mL/min/1.73 m2 (range 136–143 mL/min/1.73 m2) in healthy controls (p<0.001) (Tables 1 and 3).
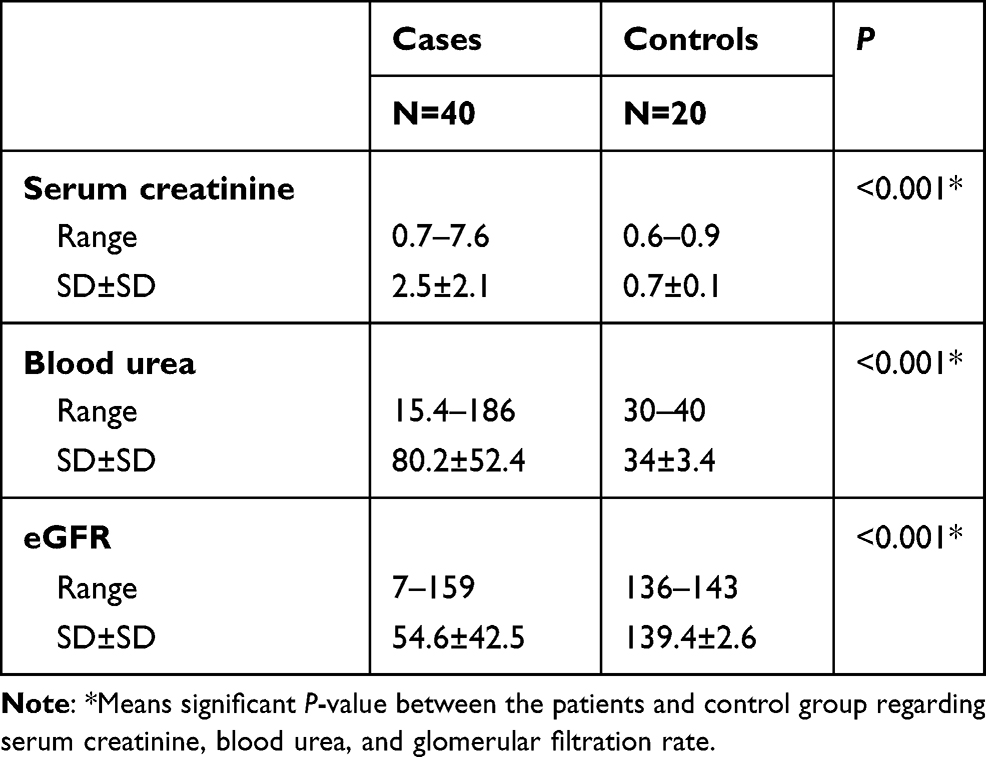 |
Table 1 Comparison Between CKD Cases and Controls Regarding Laboratory Data |
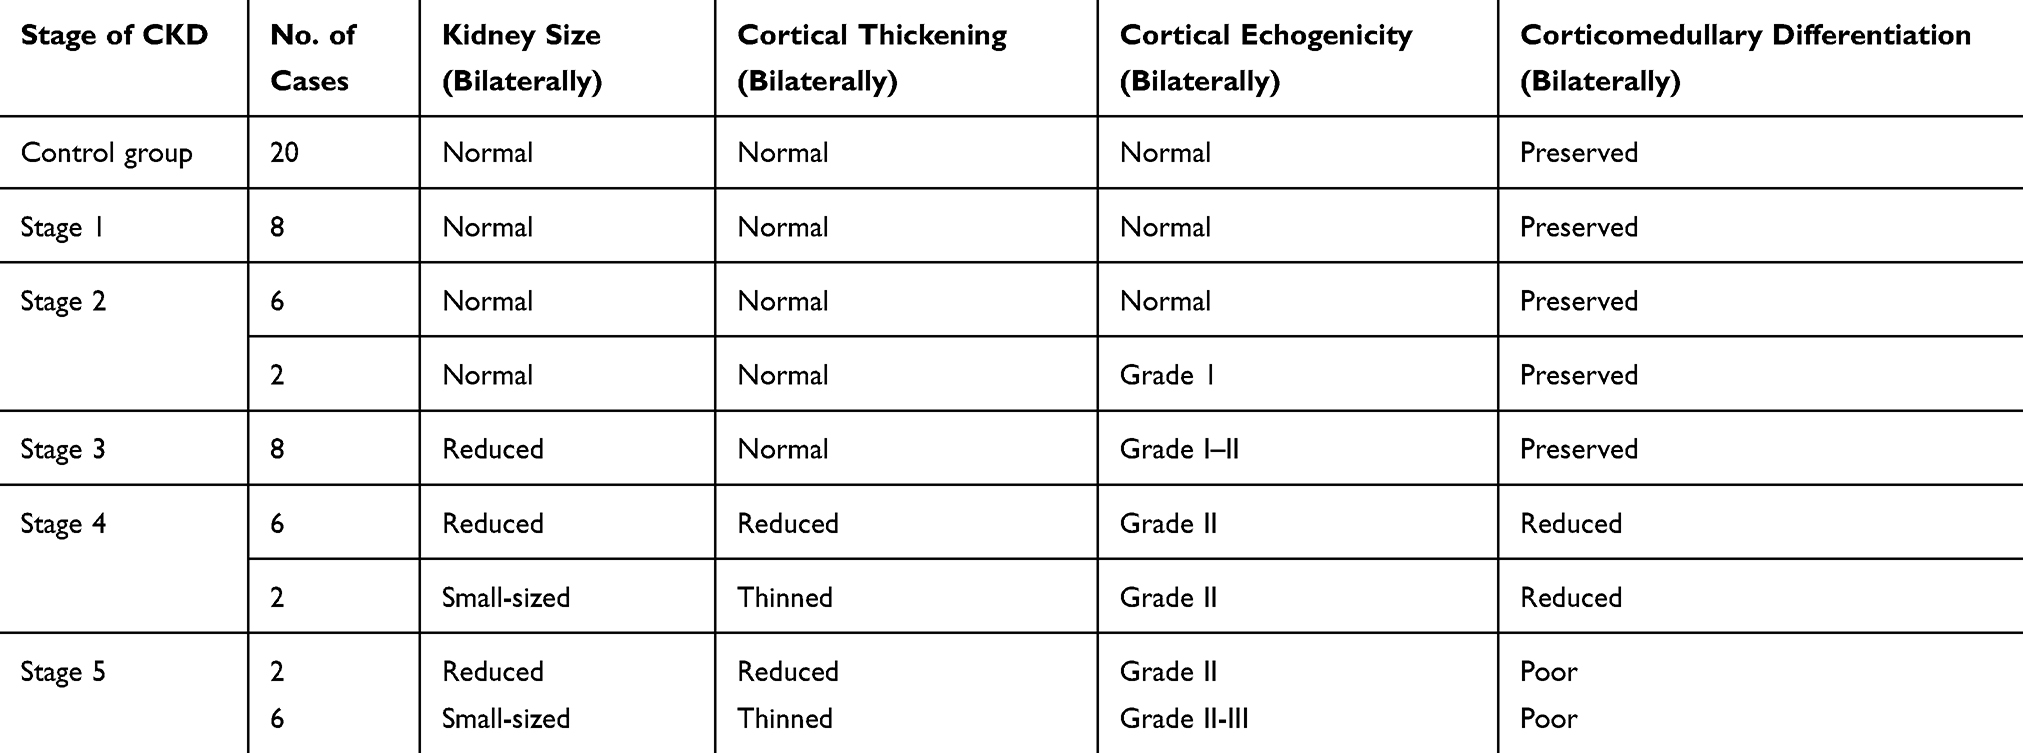 |
Table 2 Ultrasonographic Results of Controls and Cases |
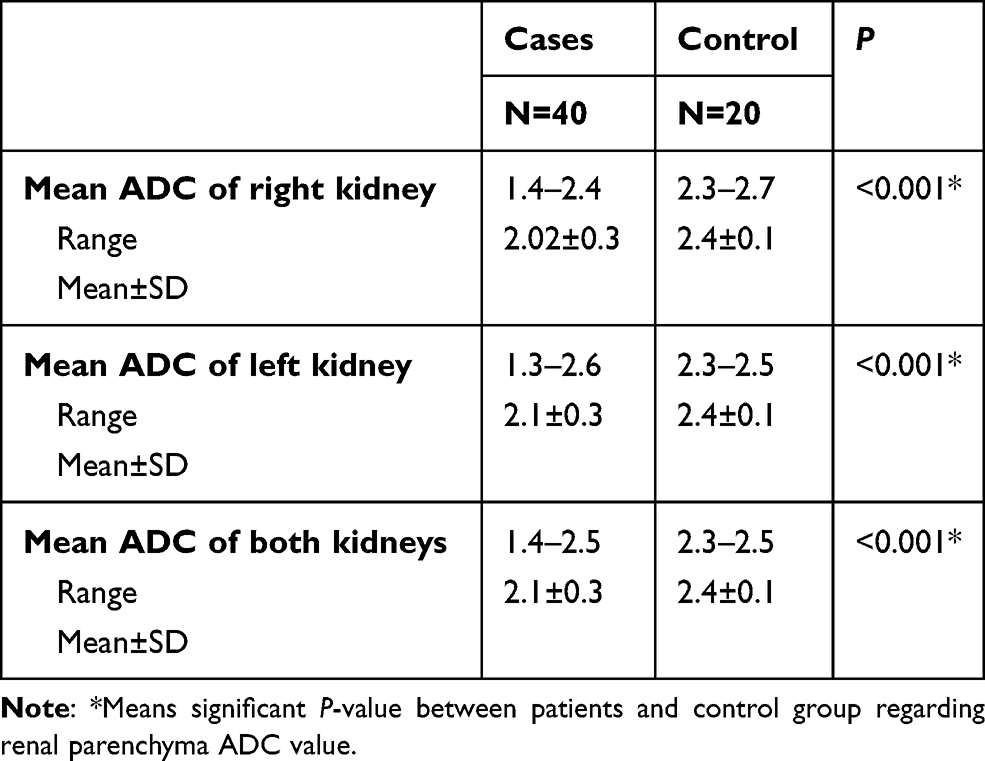 |
Table 3 Comparison Between Cases and Controls Regarding Mean ADC Values |
In all stage 1 and 2 patients (16/40), the renal size was normal as well as the cortical thickness and echogenicity with preserved cortico-medullary differentiation. In stage 3 patients (8/40), the renal size was reduced (< 9 cm length) but had average cortical thickness and increased echogenicity grade I–II with relatively preserved cortico-medullary differentiation. In stage 4, six patients had reduced renal size and in 2 patients the renal size was small (<7 cm length). In stage 5, the renal size was reduced in 2 patients and in 6 patients was small sized with thinned cortex, increased cortical echogenicity grade II–III and poor cortical medullary differentiation (Table 2).
Our study revealed that mean ADC values of renal parenchyma in patients with diabetic kidney disease were lower than that of normal healthy volunteers with normal renal function (2.1±0.3x10⁻³ mm2/s vs 2.4±0.1x10⁻³ mm2/s with p<0.001) (Table 4).
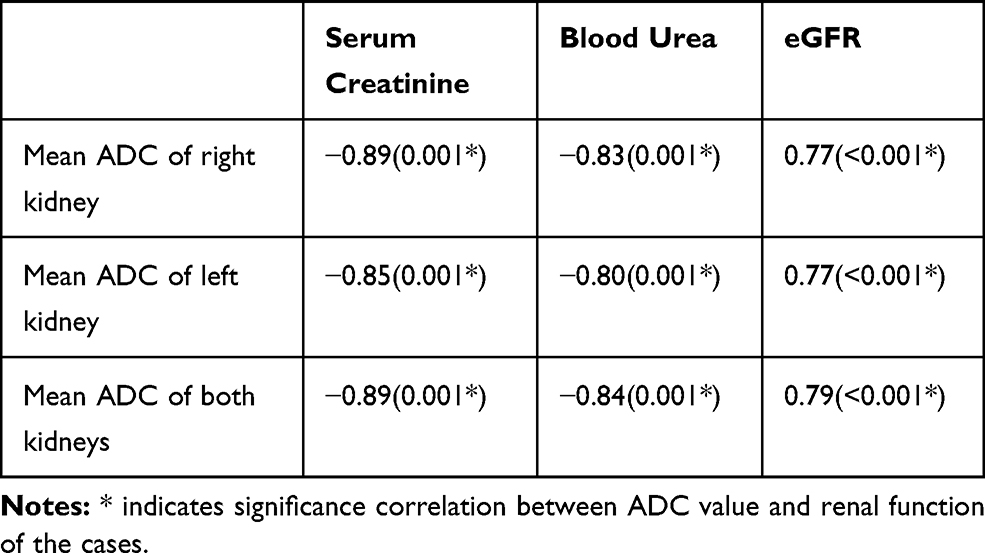 |
Table 4 Correlation Between Mean ADC Values and Renal Function Tests Among Cases |
Also, the ADC values were inversely correlated with the advancement in renal parenchymal affection, ie, in late stages of the disease the ADC values were lower than in early stages (Table 5).
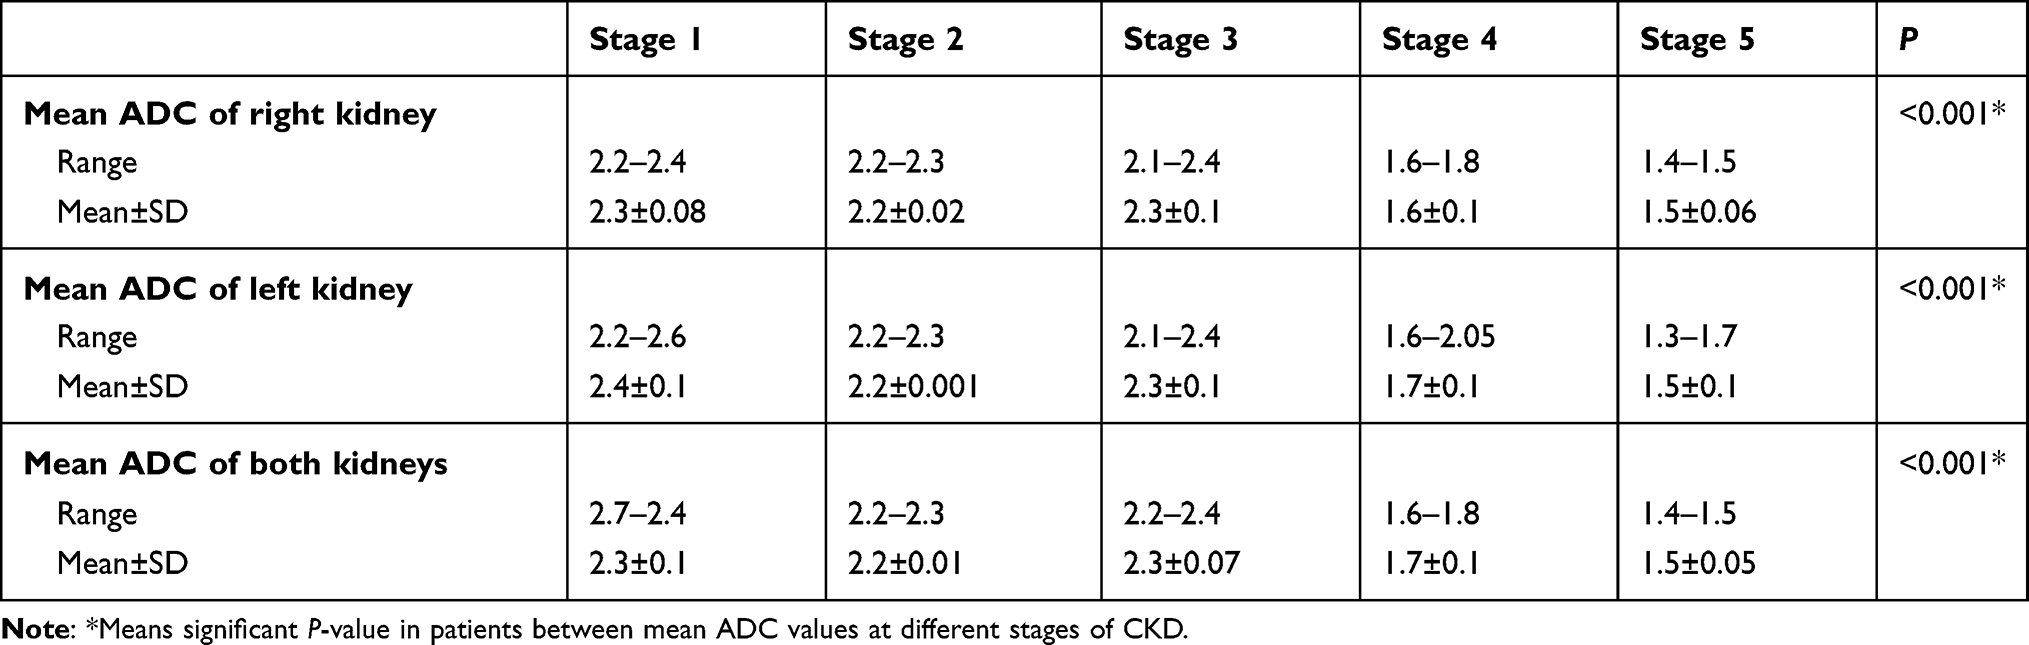 |
Table 5 The Relation Between Different Stages of CKD and Mean ADC Values |
Figure 2 showed receiver operating characteristics (ROC) of mean ADC values in detection of eGFR < 60 mL/min/1.73 m2 in patients with diabetic kidney disease. Mean ADC value at cut-off value of < 2.3 had 100% sensitivity, 80% specificity, and area under the curve was 0.93 (p<0.001).
Some variable case presentations according to the different stages of renal parenchymal affection and their DW-MRI and ADC values were represented including normal volunteers (Figures 3–6).
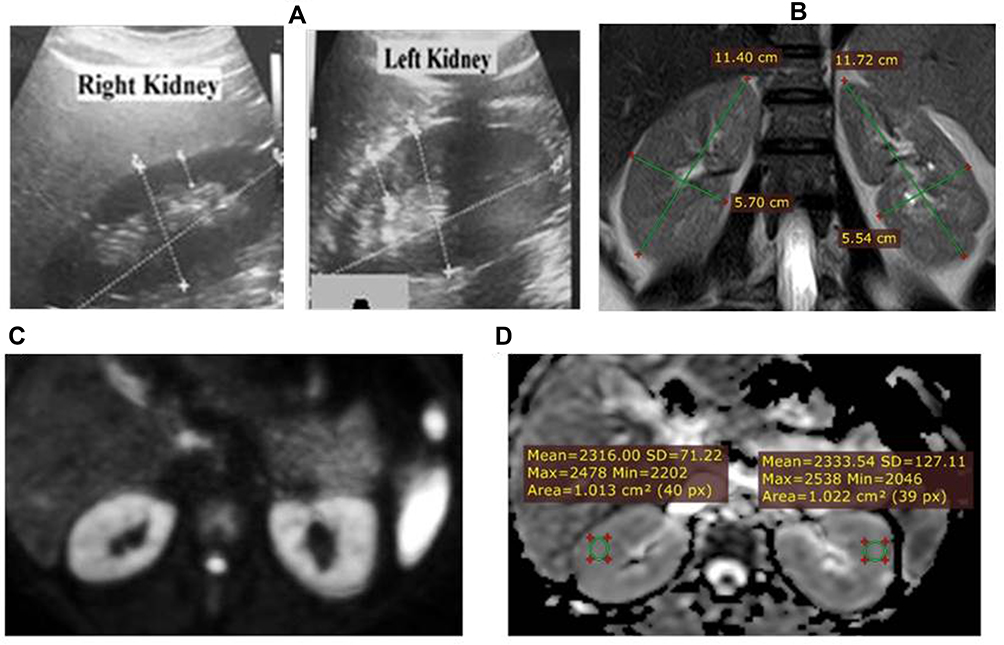 |
Figure 3 25 year old healthy female volunteer. SCr: 0.7 mg/dl, BU: 32mg/dl., eGFR: 140 mL/min/1.73m2. (A) US: both kidneys are normal regarding size and cortical echogenicity. (B) Coronal T2WI with normal kidney measures. (C and D) DWI and ADC map showing restricted renal parenchyma on both sides. The mean ADC value of the right kidney measures 2.31×10⁻³ mm2/s and that of the left kidney measures 2.33×10⁻³ mm2/s. The mean ADC of both kidneys was 2.3×10⁻³mm2/s. |
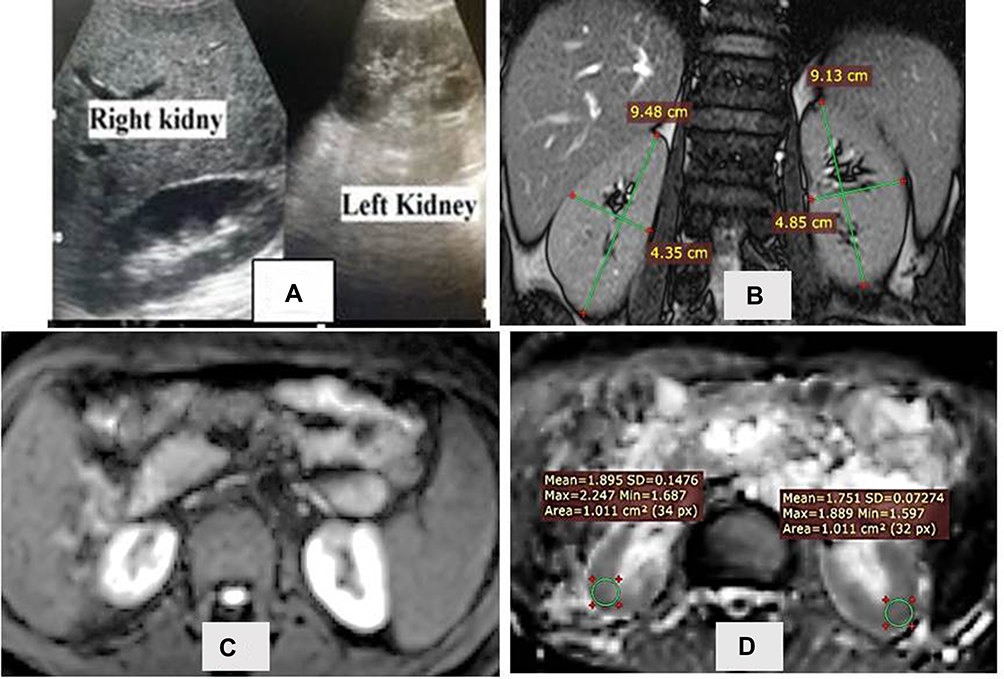 |
Figure 4 19 year old male patient with type 2 DM for 4 years, on insulin therapy. SCr: 0.7 mg/dl, BU: 37mg/dl, A/C ratio: 127 mg Alb/g, Creat. <microalbuminuria. eGFR: 159mL/min/1.73mL m2: Stage 1 diabetic nephropathy. (A) US of the kidneys showed normal sized kidneys with normal cortical echogenicity. (B) Coronal T2WI with normal kidney measurements. (C and D) DWI and ADC map showing restricted renal parenchyma on both sides. The mean ADC value taken from DWI-MRI on right kidney measures 1.89×10⁻³ mm2/s and on the left kidney measures 1.75 ×10⁻³ mm2/s. The mean ADC of both kidneys was 1.8 ×10⁻³ mm2/s. |
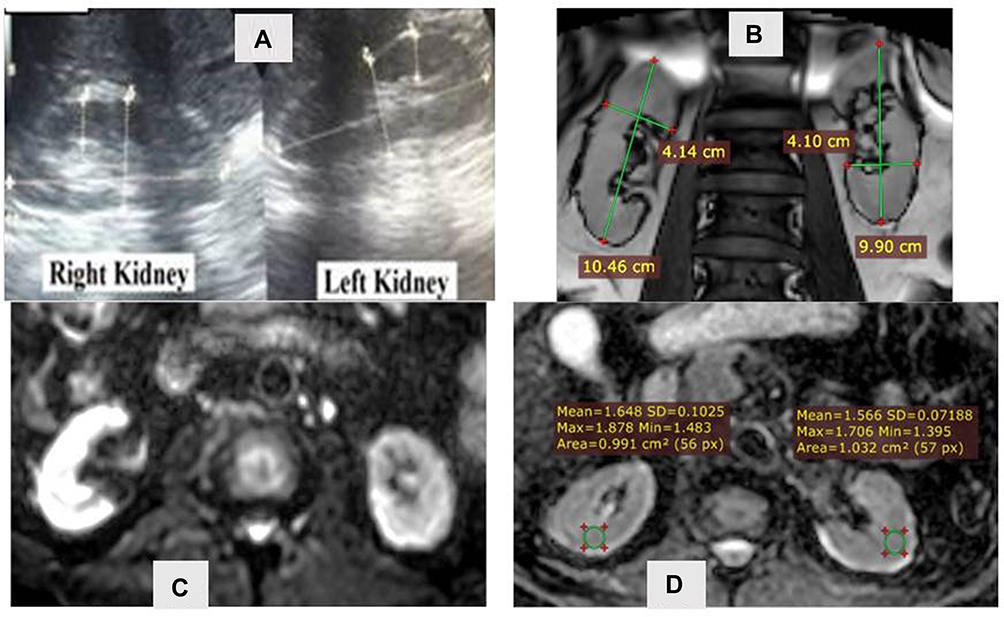 |
Figure 5 55 year old female hypertensive patient with type 2 diabetes mellitus for 15 years on combined oral hypoglycemic and insulin therapy. SCr: 0.5mg/dl, BU:81mg/dleGFR:45mL/min/1.73 m2: Stage 3 diabetic nephropathy. US of the kidneys: (A) normal sized kidneys with average cortical echogenicity. (B) Coronal T2WI MRI revealed slight outline renal irregularity and thinned cortex but still average size of both kidneys. No abnormal signal masses detected. Intact P/C systems. (C and D) DWI-MRI and the corresponding ADC map revealed restricted renal parenchyma on both sides. The mean ADC value of the right kidney measures 1.64×10⁻³ mm2/s and the mean ADC value of the left kidney measures 1.56×10⁻³ mm2/s. The mean ADC of both kidneys reached 1.6×10⁻³ mm2/s. |
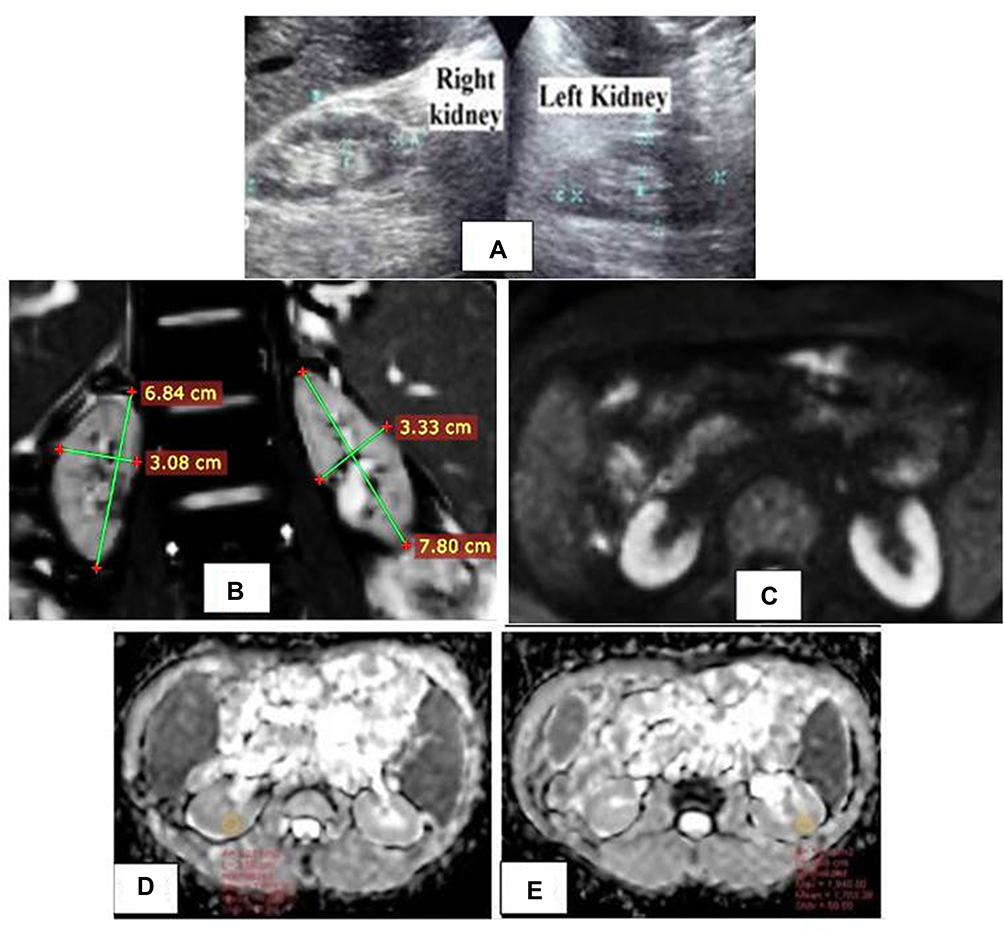 |
Figure 6 57 year old male patient with type 2 diabetes mellitus for 8 years on combined oral hypoglycemic and insulin therapy. The patient is hypertensive and on regular dialysis. SCr: 7.6mg/dl, BU: 138mg/dl eGFR: 8mL/min/1.73 m2: Stage 5 diabetic nephropathy. (A) US of both kidneys showed small sized kidneys with increased cortical echogenicity grade II–III. (B) Coronal MRI T2WI and small sized renal dimensions. (C–E) DW-MRI and the generated ADC map showed restricted renal parenchyma on both sides and evident low signal of kidney tissues. The mean ADC value of the right kidney measures 1.36×10⁻³ mm2/s and the mean ADC value from the left kidney measures 1.44×10⁻³ mm2/s. The mean ADC value of both kidneys was 1.4×10⁻³ mm2/s. |
Discussion
Magnetic resonance imaging (MRI) has been recently reported as a valuable technique for the evaluation of pathophysiological changes in impaired kidneys and for the possible assessment of renal function. Many studies have revealed that apparent diffusion coefficient (ADC) of the kidney correlates well with the estimated GFR (eGFR).6
Diabetic kidney disease contributes to approximately 50% of patients with end-stage kidney disease requiring dialysis.9 Kidney fibrosis is the most common structural change in ESRD and there is poor correlation between the degree of renal fibrosis and the current screening markers, namely serum creatinine and blood urea, so there is urgent need for noninvasive imaging technique to assess kidney fibrosis as in the case of liver fibrosis. MRI is an emerging noninvasive tool to assess kidney fibrosis in diabetic disease.10 Ultrasound failed as a noninvasive tool because renal size, cortical thickness and cortical echogenicity are preserved until ESRD occurs.11 In addition, ultrasound findings are operator-dependent, and the renal volume is significantly affected by the degree of hydration at the time of examination. Renal length also can be physiologically shorter by about 10% with increasing age of the patient examined.12 So the indices of kidney size and cortical echogenicity are limited indicators of CKD stages.13
Our study found that mean ADC values of diabetic kidney disease group of patients were lower than that in healthy control subjects with normal renal function. The ADC values of diabetic renal parenchyma were negatively correlated with SCr/BU levels (p<0.001). These findings in our study agree with previous studies.14–20 Baseline cortical ADC was found to be associated with change in eGFR over time independent of albuminuria in a recently published multi-center, randomized, double-blinded, 12-month COMBINE (CKD Optimal Management with Binders and Nicotinamide) trial which involved 122 CKD patients with eGFR 20–45 mL/min per 1.73m2 to investigate functional MRI as noninvasive method to identify patients at high risk of progression.20 However, in another retrospective study on 180 patients to investigate the relationship between ADC values of the kidneys and eGFR, they found that patients with low eGFR tended to have lower ADC values but without significant correlation between mean ADC values and eGFR. In this study, transverse multisection echo-planar diffusion-weighted imaging (DWI) was performed using diffusion gradient b-values of 50 and 1000 s/mm2. Regions of interests (ROIs) were manually delineated in the parenchyma as large as possible at the level of the middle portion of the bilateral kidneys.21
The lower ADC values in diabetic renal parenchymal disease may be explained by reduced renal perfusion and water diffusion. Glomerulosclerosis, interstitial fibrosis and atrophy of the renal tubules restrict the free movement of water molecules in extracellular and intracellular space, resulting in lowering of the ADC values.14
We found that there was a progressive decline in ADC values with increasing stage of DKD (2.3±0.07 ×10⁻³mm2/s vs 1.7±0.1 × 10⁻³mm2/s vs 1.5±0.05 ×10⁻³mm2/s for stages 3, 4, and 5 respectively). The difference was more obvious between stages 3 and 4. This is not in accordance with a recent study that evaluated pathological and functional alterations in CKD by applying intravoxel incoherent motion diffusion-weighted imaging, which found it feasible in detection of renal insufficiency especially at an early stage.22
The limitations of this study include the relatively small number of patients studied and the lack of histopathologic correlation, however, this was a preliminary experience study.
Conclusion
ADC values using DW-MRI in patients with diabetic kidney disease provide a noninvasive technique to assess the degree of renal parenchymal affection, especially in patients with stage 4 and 5 CKD and diabetes mellitus with possible strong correlation with eGFR, and to follow-up progression of diabetic kidney disease.
Abbreviations
SCr, serum creatinine; eGFR, estimated glomerular filtration rate; GFR, glomerular filtration rate; BU, blood urea; ADC, apparent diffusion coefficient; MRI, magnetic resonance imaging; ROC, receiving operator characteristic; DW-MRI, diffusion-weighted magnetic resonance imaging; CKD, chronic kidney disease; CRIC, chronic renal insufficiency cohort.
Ethics Statement
The research was conducted in accordance with the ethical standards of the Minia University committee on human experimentation and with the Helsinki Declaration of 1975, as revised in 2008. Informed consent was obtained from all patients for being included in the study.
Acknowledgment
We thank our colleagues from Internal Medicine and Radiology departments who provided insight and expertise that greatly assisted the research.
Author Contributions
All authors contributed to data analysis, critically revised the manuscript, agree to the journal in which the paper was submitted, gave final approval of the version to be published, and agree to be accountable for all aspects of the work.
Disclosure
The authors have no conflicts of interest to declare.
References
1. Hill NR, Fatoba ST, Oke JL, et al. Global prevalence of chronic kidney disease - a systematic review and meta-analysis. PLoS One. 2016;11(7):e0158765. doi:10.1371/journal.pone.0158765
2. Ingelfinger JR, Rosen CJ. Cardiac and renovascular complications in type 2 diabetes–is there hope? N Engl J Med. 2016;375(4):380–382. doi:10.1056/NEJMe1607413
3. Berhane AM, Weil EJ, Knowler WC, Nelson RG, Hanson RL. Albuminuria and estimated glomerular filtration rate as predictors of diabetic end-stage renal disease and death. Clin J Am Soc Nephrol. 2011;6(10):2444–2451. doi:10.2215/CJN.00580111
4. Hsu CY, Propert K, Xie D, et al. Measured GFR does not outperform estimated GFR in predicting CKD-related complications. J Am Soc Nephrol. 2011;22(10):1931–1937. doi:10.1681/ASN.2010101077
5. Nguyen DL, de Labriolle-vaylet C, Durand E, et al. Reproducibility of differential renal function measurement using technetium-99m-ethylenedicysteine dynamic renal scintigraphy: a French prospective multicentre study. Nucl Med Commun. 2018;39(1):10–15. doi:10.1097/MNM.0000000000000769
6. Yamada K, Shinmoto H, Oshio K, Ito S, Kumagai H, Kaji T. Diffusion-weighted MR imaging for the assessment of renal function: analysis using statistical models based on truncated gaussian and gamma distributions. Magn Reson Med Sci. 2016;15(2):237–245. doi:10.2463/mrms.mp.2015-0067
7. Lu L, Sedor JR, Gulani V, et al. Use of diffusion tensor MRI to identify early changes in diabetic nephropathy. Am J Nephrol. 2011;34(5):476–482. doi:10.1159/000333044
8. Chandarana H, Lee VS. Renal functional MRI: are we ready for clinical application? AJR Am J Roentgenol. 2009;192(6):1550–1557. doi:10.2214/AJR.09.2390
9. Pugliese G, Penno G, Natali A, et al. Diabetic kidney disease: new clinical and therapeutic issues. Joint position statement of the Italian Diabetes Society and the Italian Society of Nephrology on “The natural history of diabetic kidney disease and treatment of hyperglycemia in patients with type 2 diabetes and impaired renal function”. Nutr Metab Cardiovasc Dis. 2019;29(11):1127–1150. doi:10.1016/j.numecd.2019.07.017
10. Brown RS, Sun MRM, Stillman IE, Russell TL, Rosas SE, Wei JL. The utility of magnetic resonance imaging for noninvasive evaluation of diabetic nephropathy. Nephrol Dial Transplant. 2019.
11. Buturovic-Ponikvar J, Visnar-Perovic A. Ultrasonography in chronic renal failure. Eur J Radiol. 2003;46(2):115–122. doi:10.1016/S0720-048X(03)00073-1
12. Soldo D, Brkljacic B, Bozikov V, Drinkovic I, Hauser M. Diabetic nephropathy. Comparison of conventional and duplex Doppler ultrasonographic findings. Acta Radiol. 1997;38(2):296–302. doi:10.1080/02841859709172067
13. Hanamura K, Tojo A, Kinugasa S, Asaba K, Fujita T. The resistive index is a marker of renal function, pathology, prognosis, and responsiveness to steroid therapy in chronic kidney disease patients. Int J Nephrol. 2012;2012:139565. doi:10.1155/2012/139565
14. Goyal A, Sharma R, Bhalla AS, Gamanagatti S, Seth A. Diffusion-weighted MRI in assessment of renal dysfunction. Indian J Radiol Imaging. 2012;22(3):155–159. doi:10.4103/0971-3026.107169
15. Yoshikawa T, Kawamitsu H, Mitchell DG, et al. ADC measurement of abdominal organs and lesions using parallel imaging technique. AJR Am J Roentgenol. 2006;187(6):1521–1530. doi:10.2214/AJR.05.0778
16. Namimoto T, Yamashita Y, Mitsuzaki K, Nakayama Y, Tang Y, Takahashi M. Measurement of the apparent diffusion coefficient in diffuse renal disease by diffusion-weighted echo-planar MR imaging. J Magn Reson Imaging. 1999;9(6):832–837. doi:10.1002/(SICI)1522-2586(199906)9:6<832::AID-JMRI10>3.0.CO;2-1
17. Thoeny HC, De Keyzer F, Oyen RH, Peeters RR. Diffusion-weighted MR imaging of kidneys in healthy volunteers and patients with parenchymal diseases: initial experience. Radiology. 2005;235(3):911–917. doi:10.1148/radiol.2353040554
18. Xu Y, Wang X, Jiang X. Relationship between the renal apparent diffusion coefficient and glomerular filtration rate: preliminary experience. J Magn Reson Imaging. 2007;26(3):678–681. doi:10.1002/jmri.20979
19. Xu X, Fang W, Ling H, Chai W, Chen K. Diffusion-weighted MR imaging of kidneys in patients with chronic kidney disease: initial study. Eur Radiol. 2010;20(4):978–983. doi:10.1007/s00330-009-1619-8
20. Srivastava A, Cai X, Lee J, et al. Kidney functional magnetic resonance imaging and change in eGFR in individuals with CKD. Clin J Am Soc Nephrol. 2020;15(6):776–783. doi:10.2215/CJN.13201019
21. Toya R, Naganawa S, Kawai H, Ikeda M. Correlation between estimated glomerular filtration rate (eGFR) and apparent diffusion coefficient (ADC) values of the kidneys. Magn Reson Med Sci. 2010;9(2):59–64. doi:10.2463/mrms.9.59
22. Mao W, Zhou J, Zeng M, et al. Chronic kidney disease: pathological and functional evaluation with intravoxel incoherent motion diffusion-weighted imaging. J Magn Reson Imaging. 2018;47(5):1251–1259. doi:10.1002/jmri.25861
 © 2021 The Author(s). This work is published and licensed by Dove Medical Press Limited. The full terms of this license are available at https://www.dovepress.com/terms.php and incorporate the Creative Commons Attribution - Non Commercial (unported, v3.0) License.
By accessing the work you hereby accept the Terms. Non-commercial uses of the work are permitted without any further permission from Dove Medical Press Limited, provided the work is properly attributed. For permission for commercial use of this work, please see paragraphs 4.2 and 5 of our Terms.
© 2021 The Author(s). This work is published and licensed by Dove Medical Press Limited. The full terms of this license are available at https://www.dovepress.com/terms.php and incorporate the Creative Commons Attribution - Non Commercial (unported, v3.0) License.
By accessing the work you hereby accept the Terms. Non-commercial uses of the work are permitted without any further permission from Dove Medical Press Limited, provided the work is properly attributed. For permission for commercial use of this work, please see paragraphs 4.2 and 5 of our Terms.