")
Back to Journals » Cancer Management and Research » Volume 14
The Role of Diabetes Mellitus in the Malignant Pancreatic Cyst Neoplasm Diagnosis and Prognosis
Authors Deng J, Guo Y, Gu J, Du J , Kong L , Tao B, Li J, Fu D
Received 14 January 2022
Accepted for publication 16 May 2022
Published 22 June 2022 Volume 2022:14 Pages 2091—2104
DOI https://doi.org/10.2147/CMAR.S355365
Checked for plagiarism Yes
Review by Single anonymous peer review
Peer reviewer comments 2
Editor who approved publication: Dr Matthew Witek
Junyuan Deng, Yujie Guo, Jichun Gu, Jiali Du, Lei Kong, Boan Tao, Ji Li, Deliang Fu
Department of Pancreatic Surgery, Pancreatic Disease Institute, Huashan Hospital, Fudan University, Shanghai, People’s Republic of China
Correspondence: Ji Li, Department of Pancreatic Surgery, Pancreatic Disease Institute, Huashan Hospital, Fudan University, Shanghai, People’s Republic of China, Email [email protected]
Purpose: Pancreatic cyst neoplasm (PCN) is a precursor of pancreatic cancer. Previous studies reported PCN was often concurrent with diabetes. We aim to examine the association between diabetes with PCN malignancy and to detect the potential role of diabetes in PCN management and treatment.
Patients and Methods: A total of 224 patients who were diagnosed with the three major types of PCN (IPMN, MCN, and SCN) and underwent surgical resection were selected. Patients were divided into three groups (normal group, new-onset diabetes group (NODM) (< 4years), and long-standing diabetes group (LSDM) (> 4years)) according to diabetic history and diagnostic time interval. Diabetes, fast blood glucose level, HbA1c, and insulin resistance level were measured. Malignant PCN (mPCN) radiological features (worrisome features and high-risk stigmata) were analyzed. Pathological features (PCN type, dysplasia grade, tumor stage, and tumor volume) and immunohistology of Ki67 and SMAD4 were performed. Diagnostic efficacy of each variable was determined by the ROC curve. mPCN diagnosis was the main outcome in diagnostic prediction and overall survival as the glucose controlling outcome variables.
Results: Diabetes groups (NODM and LSDM) showed difference with the normal group in age, weight loss, malignancy, CA19-9 value, CEA value, Ki-67 value, tumor volume, pathological grade, and a lowered pancreatic fistula risk. NODM was related to insulin resistance, weight loss, and SMAD4 mutation. NODM (87.3%) and high insulin resistance rate (93.6%) significantly increased the sensitivity of radiological evidence-based mPCN diagnosis. Moreover, long-standing diabetes and elevated HbA1c led to reduced survival in mPCN patients than the normal PCN group. Anti-diabetic drugs showed limited influence on PCN malignancy and tumor volume.
Conclusion: NODM in PCN patients was associated with malignancy, insulin resistance, weight loss, and SMAD4 mutation. Prediabetic status and NODM diagnosis enhanced the diagnostic accuracy of radiological standards (worrisome features and high-risk stigmata). Stable glucose surveillance is necessary for mPCN patients’ survival.
Keywords: pancreatic cyst neoplasms, diabetes mellitus, pancreatic cancer, cancer diagnostic model
Introduction
Pancreatic cyst neoplasms (PCN), including intraductal papillary mucinous neoplasms (IPMN), mucinous cystic neoplasms (MCN), serous cystic neoplasms (SCN), and other rare cystic lesions, are regarded as a group of heterogeneous pancreatic cysts.1 The prevalence of PCN is rare in pancreatic diseases, and it is estimated that less than 1% of pancreatic tumors seen in oncology clinics are cystic.2 However, PCNs are known to be the precursor of pancreatic ductal adenocarcinoma (PDA), which is projected to be the second leading cause of cancer death in 2030.3 It is generally accepted that malignant PCN (mPCN), or invasive PCN is a type of pancreatic cancer. Currently, with the increasing use of high-quality and cross-sectional imaging technologies, the diagnosis of PCNs is significantly increased in the past decades. Radiological features, including worrisome features and high-risk stigmata, have been applied to help doctors make resection discission to distinguish malignant PCN. However, the accuracy of radiological features is controversial, and novel methods for enhancing the efficiency of worrisome features and high-risk stigmata are warranted currently.4
Recently, due to the high prevalence of diabetes mellitus (DM) in PDA, the relationship between DM with PDA has been raising great attention recent years. Currently, DM is divided into the new-onset diabetes mellitus (NODM) and long-standing diabetes mellitus (LSDM).5 Long-term diabetes is regarded as a prognostic factor for pancreatic cancer (PDA) onset, and NODM is a paraneoplastic syndrome induced by PDA.6,7 At the time of NODM diagnosis, most unresectable pancreatic tumor tissue is resectable, and tumor stages were much lower, which may significantly increase the survival of PDA patients.8 Because of this, a predicting model based on diabetes and hyperglycemic status was developed to assess PDA risk.9 As the precursor of PDA, IPMN and MCN were also reported to have a close relationship with diabetes, especially NODM.10–12 The odds ratio of malignance in DM patients was 2.69 and 3.26, and the percentage was significantly elevated to 4.65 and 6.95 in NODM cases.10,11 Because of this, it is logical to extrapolate that DM is a potential diagnostic predictor for invasive PCN diagnosis. In the 2018 version of European evidence-based guidelines on pancreatic cyst neoplasms, NODM was listed as a relative resection indication for branch duct IPMN (BD-IPMN).13 However, BD-IPMN only exists in a small part of PCN patients, and it is not clear whether DM or NODM is associated with malignancy in the whole PCN population. Aside from this, the mechanism of how DM affects PCN perioperative management, and the postoperative prognosis is still unknown.
Hence, this study is aimed to evaluate the relationship between DM and malignant PCN diagnosis, perioperative management and prognosis after surgery. We also examined diabetic markers, such as HbA1c, fasting blood glucose, and insulin level, to determine which may be the ideal predictor for malignant diagnosis and long-term glucose management targets.
Methods
Case Selection and Power Analysis
In this study, we mainly focused our study on the three major type of PCN: IPMN, MCN and SCN. We selected 502 patients (male 189, female 313) primarily. By excluding patients who did not test fasting blood glucose (n=7), blood insulin level (n=150), unclear diabetes diagnosis records (n=21), and HbA1c level (n=100), 224 cases (male 72, female 152) were left in our study. A cohort of 224 consecutive patients who underwent pancreatic resection for histologically confirmed IPMN, MCN, and SCN between September 2013 and December 2020 at the Dept. pancreatic surgery in Huashan Hospital, Fudan University, Shanghai, China, were reviewed retrospectively. The clinical, radiological and pathological information was collected from medical histories and surgery records.
What is more, a power analysis was used to assess the expected sample size.14 The prevalence of malignancy in the normal group was 20%, and 57.5% in the diabetic group. The expected sample size was 43 in the Normal group and 15 in the DM group (P<0.05).
Assessment of Preoperative Diabetes Mellitus and Diabetic Markers
The assessment of diabetes mellitus (NODM) is based on the current American Diabetes Association (ADA) guidelines.15,16 The major criteria of DM diagnosis were preoperative fasting plasma glucose ≥12.6 mg/dL, random plasma glucose ≥ 200mg/dL or hemoglobin A1c (HbA1c) ≥6.5%. Patients who had DM history were also concluded into DM group.15 According to the data from previous studies, the definition of new-onset diabetes mellitus (NODM) is DM diagnosed within four years from PCN diagnosis.17,18 DM patients who had DM for more than four years were taken into the long-standing diabetes mellitus (LSDM) group. For cohort clean, patients who did not have a clear DM diagnosis date were excluded from our research. Patients’ insulin resistance (IR) level was measured through the HOMA-IR index. HOMA-IR was calculated as [fasting glucose (mmol/l) x fasting insulin (p mol/L)]/135.19
Surgical Indications
Pancreatic surgery was performed based on malignant signs and patients’ decisions. The planning of resection was made according to the site, and the dimension of the tumor. The extension resection and vascular resection choices were made according to intraoperative findings and the results of the frozen section analysis of the resection margin.
Radiological Evaluation
A radiologist blinded to the final pathological diagnosis evaluated preoperative computed tomography and magnetic resonance imaging studies. The radiological evaluation was consistent with the 2012 Fukuoka consensus,20 worrisome features and high-risk stigmata were determined by assessing: (1) the main pancreatic duct (MPD) largest diameter, (2) enhancing solid components within the cyst, (3) largest cyst size, (4) thickened/enhancing cyst walls, (5) non-enhancing mural nodules, (6) abrupt change in caliber of the MPD with distal pancreatic atrophy, (7) lymphadenopathy. Radiological IPMN type was classified as follows: IPMN with MPD dilatation ≥5 mm was classified as the main duct IPMN (MD-IPMN); lesions with cysts >5 mm showing communication with the MPD were classified as the branch-duct IPMN (BD-IPMN).
Pathological Evaluation
Pathological evaluations, including the measurement of gene mutations and PCN type definition, were performed by two independent professional pathologists at Huashan Hospital. 1. Protein expression analysis, including SMAD4 protein expression, and Ki-67 expression, were analyzed and graded by immunolabeling the resected tumor sample. 2. History of the KRAS G12D mutation and TP53 mutation was obtained from the pathological record of patients. 3. PCN type definition. In our study, three major PCN types: SCN, MCN, and IPMN were included in our study. MCN was measured based on the presence of ovarian-type stroma, which forms a layer of variable thickness beneath the epithelial lining. The stromal cells have oval nuclei and spindled cytoplasm arranged in long fascicles. The resemblance to ovarian stroma is strengthened by the presence of occasional “luteinized” cells – epithelioid cells with abundant clear cytoplasm.13,20 According to the 2012 international consensus for IPMN and MCN management, IPMN was defined as branch-duct IPMN (BD-IPMN) in the presence of cysts >5 mm without the involvement of the MPD, and IPMN with MPD dilatation≥5 mm was classified as the main duct IPMN (MD-IPMN).20
Outcome Measurement
The outcome of histopathological samples was determined as low-grade dysplasia (LGD), high-grade dysplasia (HGD), and malignant PCN (mPCN). Analysis of high-grade dysplasia used patients with low-grade dysplasia as the reference group. Analysis of mPCN used patients with low- and high-grade dysplasia as the reference group. One thing should be noted that pancreatic cancer that originated separately from the IPMN was considered a concomitant or distinct pancreatic ductal carcinoma. These patients were excluded from our analysis.
Statistical Analysis
The examined variables are shown as frequencies and percentages, and continuous variables as median and range. Comparisons of the variables were conducted using the chi-square or Fisher exact tests depending on the number of observations using SPSS software (SPSS, Chicago, IL, USA). All hypothesis tests were 2-sided. The statistical significance was set at P <0.05. ROC, binominal logistic regression, and linear regression analysis were performed using SPSS software (SPSS, Chicago, IL, USA). Odds ratio (ORs) and 95% confidence intervals (CIs) were calculated using an unadjusted binomial logistic regression. Continuous variables were analyzed using the Mann–Whitney U-test or Kruskal–Wallis test appropriately. Overall survival (OS) of the patients was measured by Kaplan-Meier Curve through Prism 9 Software. Anti-diabetic drug analysis was calculated by one-way ANOVA in Prism 9 software. All the study data and reviewed and approved by all the authors.
Results
Baseline Characteristics of PCN Cohort
We divided all PCN patients into three groups: The normal group, the new-onset diabetes mellitus (NODM) group, and the long-standing diabetes mellitus (LSDM) group. Both the NODM and LSDM groups were the DM groups. The baseline characteristics of our study are shown in the Table 1. In this study, 33 (14.73%) patients met the criteria of new-onset diabetes mellitus, and 21 (9.37%) cases met the criteria of long-standing diabetes mellitus. The mean duration of NODM and LSDM were 0.97 and 115.68 months. Only 5 NODM patients were diagnosed with NODM before hospital admission. For diabetic markers, NODM and LSDM showed statistical differences in HbA1c (P=0.036), IR (P=0.461), and blood glucose (P=0.124) had no difference in the two groups. DM groups showed statistical difference with normal group in age (Normal: NODM: LSDM= 58.72: 63.21: 62.69, P<0.01), malignancy (P<0.01), CA19-9 (115.98: 470.05: 184.87, P=0.024), CEA (4.76: 22.19: 36.97, P<0.01), blood glucose level (BG) (5.31:9.91:8.74, P<0.01), HbA1c (5.58: 7.52: 8.22, P<0.01) and insulin resistance (2.88: 8.70:5.44, P<0.01). But no difference was observed in sex and BMI variables.
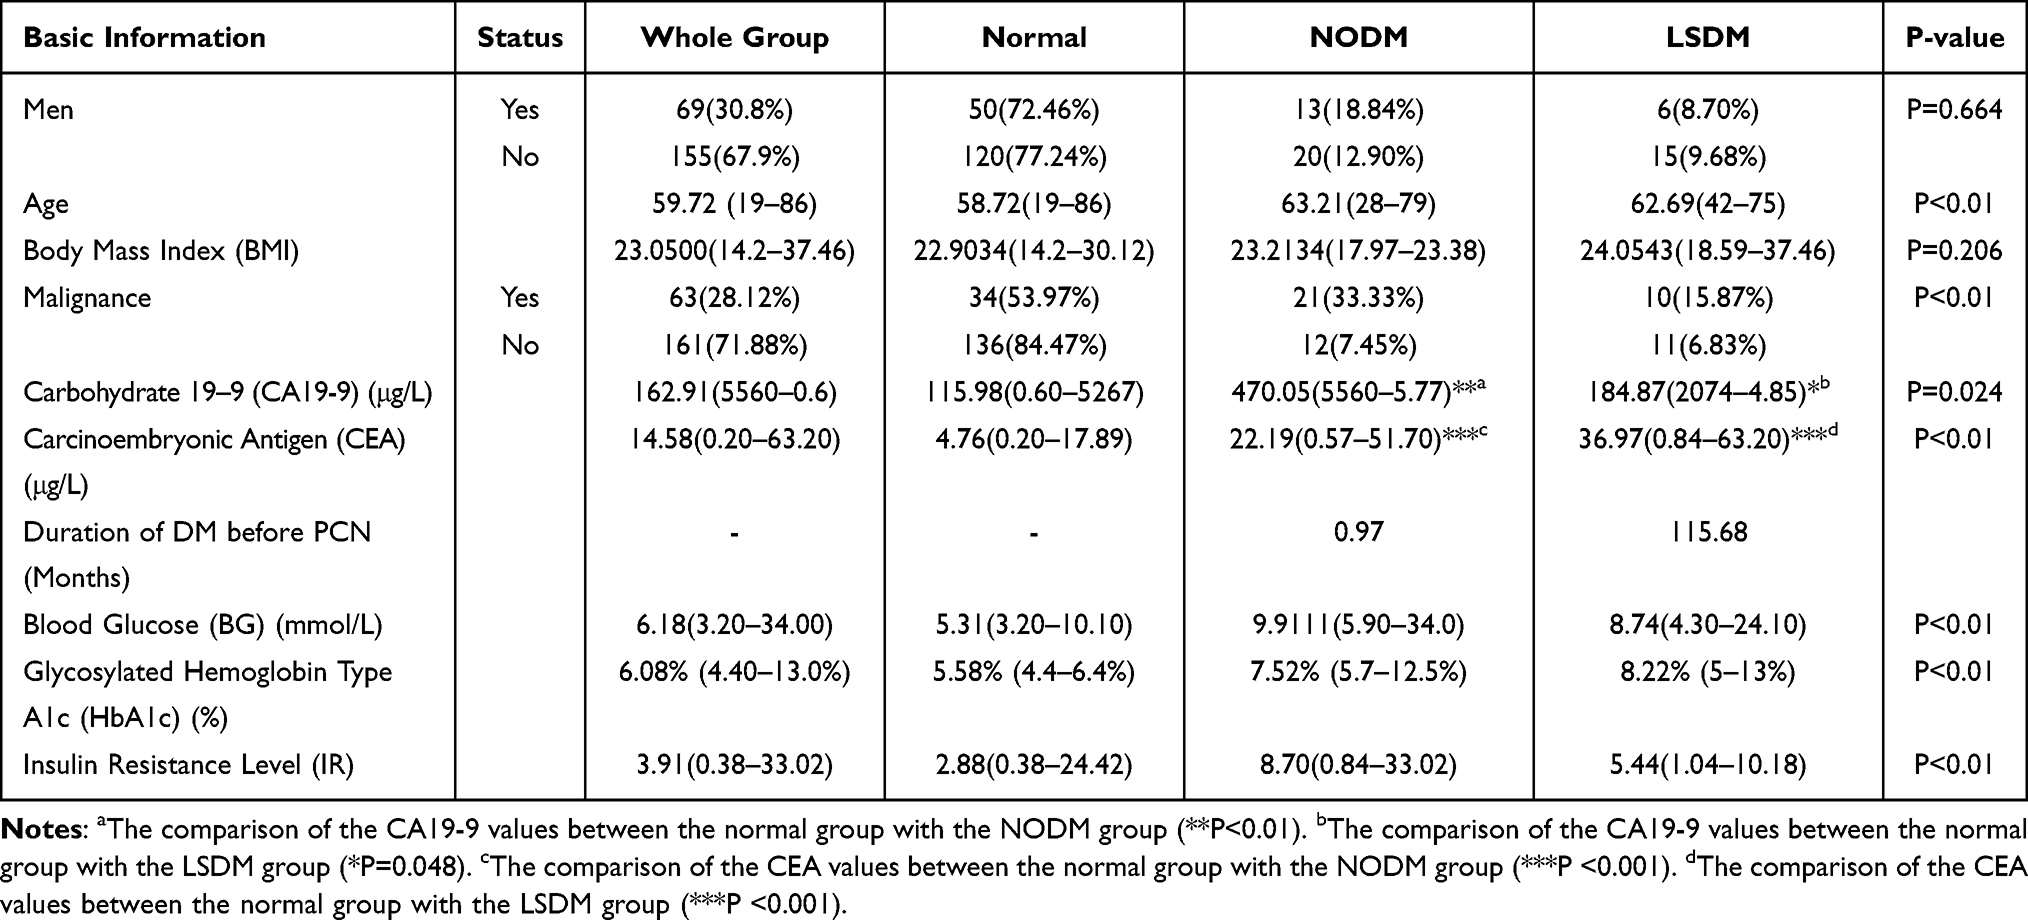 |
Table 1 Basic Information of the Normal, the NODM, and the LSDM Group |
Clinical-Pathological Features in Diabetic PCN
In clinical symptoms when patients were admitted to our hospital, DM groups had a higher frequency of weight loss (P=0.041) and jaundice (P=0.025) (see Table 2). Other clinical symptoms, including the history of chronic pancreatitis, abdominal pains, obstructive jaundice, nausea, and history of acute pancreatitis, showed no statistical difference between normal PCN patients with DM patients.
 |
Table 2 Clinical Symptoms and Features |
DM was associated with malignancy in PCN cases (see Table 3). DM showed a higher proportion of HGD and mPCN than the normal group. The odds ratio of LSDM, NODM, and DM for malignancy were: 3.443 (95% CI:2.735–4.334, P<0.01), 7.464 (95% CI:6.089–9.150, P<0.01,) and 4.605 (3.892–5.448, P<0.01). But DM and the normal group had no difference in PCN types (IPMN, MCN, and SCN) distribution. Compared with the normal and the LSDM groups, NODM patients had a higher rate of BD-IPMN (66.67%, P=0.01). Moreover, compared with the normal group and the LSDM group, NODM showed a higher proportion of invasive carcinoma and higher pathological grade (G2 and G3, P<0.01). Ki-67 was significantly increased in DM groups compared with the normal group (19.71% (NODM), 20.31% (LSDM) vs 7.96% (Normal)) and a statistical difference was shown in Figure 1B. In Figure 1A, compared with the normal group, the LSDM group and the NODM group had deeper Ki-67 staining in both benign and malignant samples.
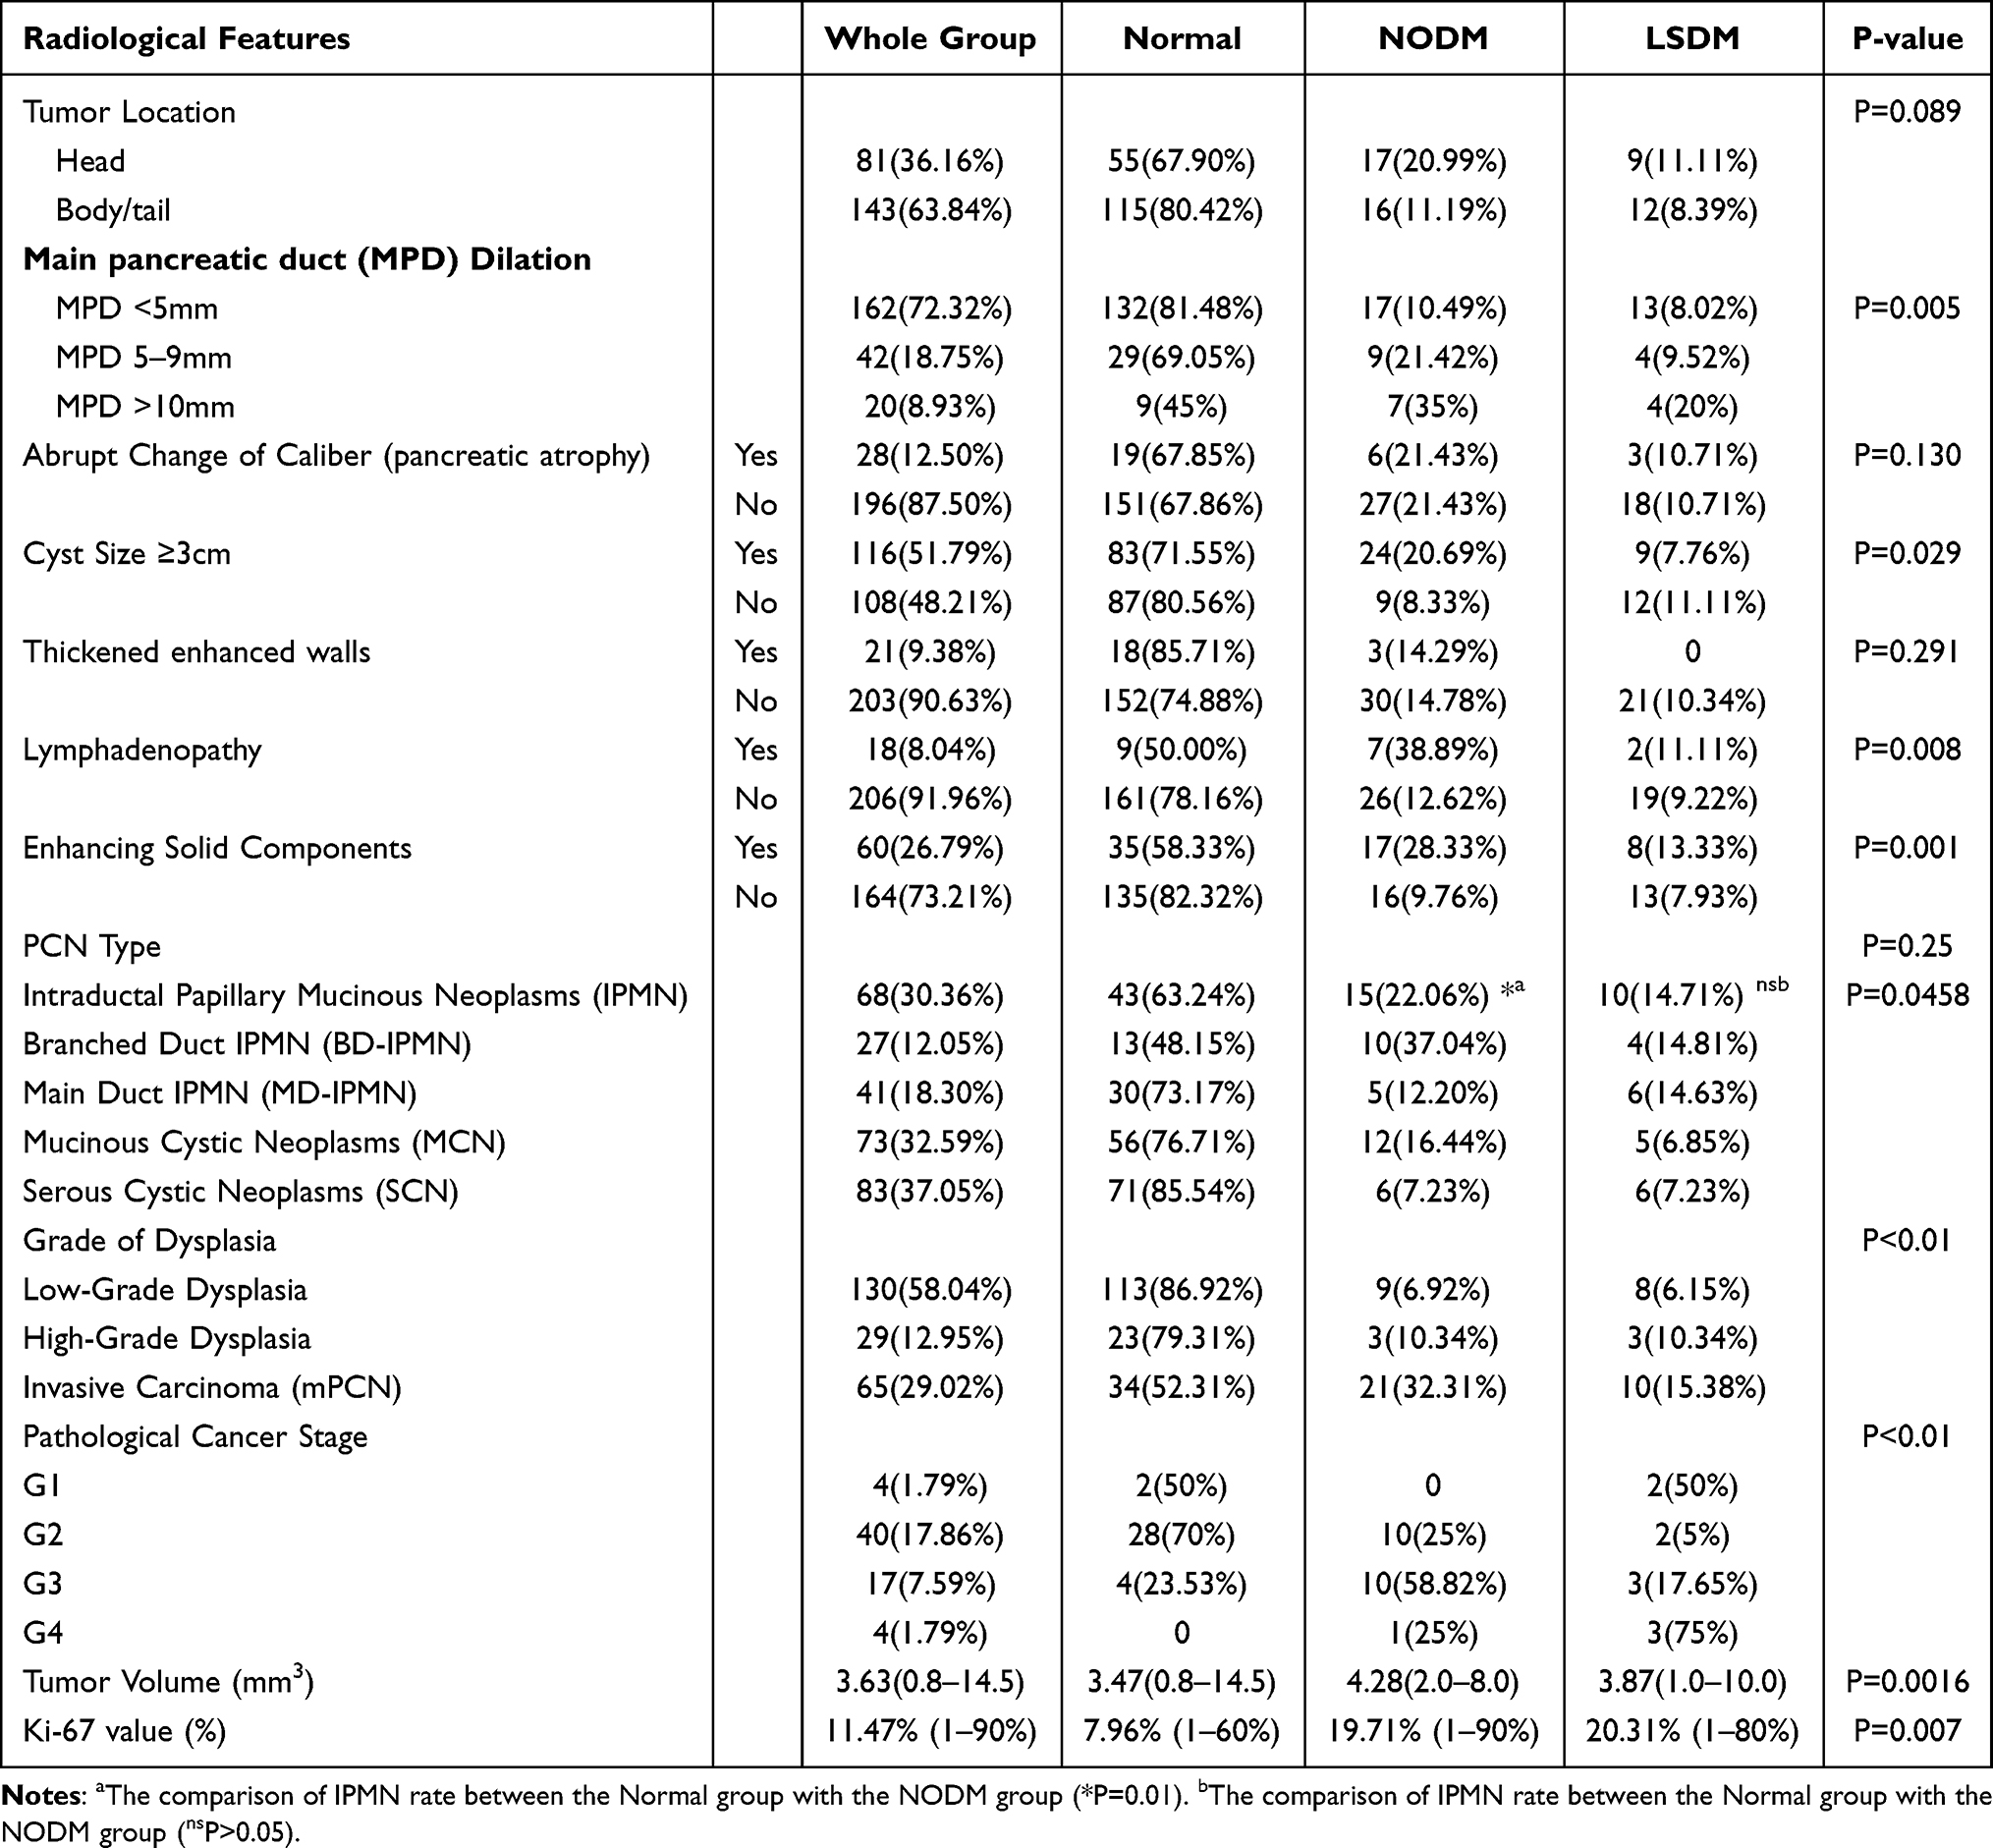 |
Table 3 Radiological and Pathological Features |
 |
Figure 1 The Ki-67 and SMAD4 expression in PCN patients. (A) The immunohistochemistry plot of Ki-67 and SMAD4 in PCN surgical samples (Left three plots: samples from the normal group; middle three plots: samples from the NODM group; right three plots: samples from the LSDM group). The upper three plots were the Ki-67 level (the brown dots) in benign PCN patients. The middle three plots were the Ki-67 level (the brown dots) in the malignant PCN patients. The lower three plots were the SMAD4 expression level (the brown dots) in the malignant PCN patients. (B) The conclusive histogram of the Ki-67 in the normal group, the NODM group and the LSDM group. The NODM and the LSDM group showed a significant elevation in Ki-67 value compared with the normal group (**P<0.01; *P<0.05). (C) The conclusive SMAD4 mutation proportion in three groups. The red bar represents the samples without SMAD4 mutation while the blue bar symbolizes the SMAD4 loss mutation in the NODM and the LSDM group. The NODM group showed a statistical increase in SMAD4 mutation than the normal group (**P<0.01), but the LSDM group showed no statistical difference from the normal group in SMAD4 mutation (ns: P>0.05). |
As for gene mutation frequencies in malignant PCN samples, the NODM group showed a significantly increased rate in SMAD4 compared with the LSDM and the normal group (6:1:0, P<0.01). In Figure 1A, SMAD staining was deeper in the LSDM group and the normal group. The NODM group showed a deletion of SMAD4 protein, which symbolized the SMAD4 loss mutation in samples. But there was no difference in KRAS G12D mutation (7:5:16, P=0.603) and TP53 mutation (3:0:4, P=0.449).
Surgery and Surgical Outcomes
In this study, 224 patients underwent surgical resection in our hospital. There was no statistical difference in surgery selection between euglycemic patients with diabetic patients (see Table 4). But the rate of laparoscopic surgery and PPPD was slightly higher in the normal group (27.64% and 5.88%) than in NODM (24.24% and 0%) and LSDM (19.04% and 0%). Moreover, we did not observe a statistical difference in most postoperative complications, including hospital stay, bleeding, wound infection, and delayed gastric emptying, except for pancreatic fistula (P=0.023). Through binomial logistic regression analysis, the odds ratio of DM, NODM, and LSDM in the onset of pancreatic fistula were 0.456 (95% CI:0.371–0.560, P<0.01), 0.481 (95% CI:0.402–0.575, P<0.01) and 0.703 (95% CI:0.541–0.913, P<0.01) By using linear logistic regression method, R2 value was highest in HbA1c (R2=0.061) compared with BG ((R2=0.041) and IR ((R2=0.003).
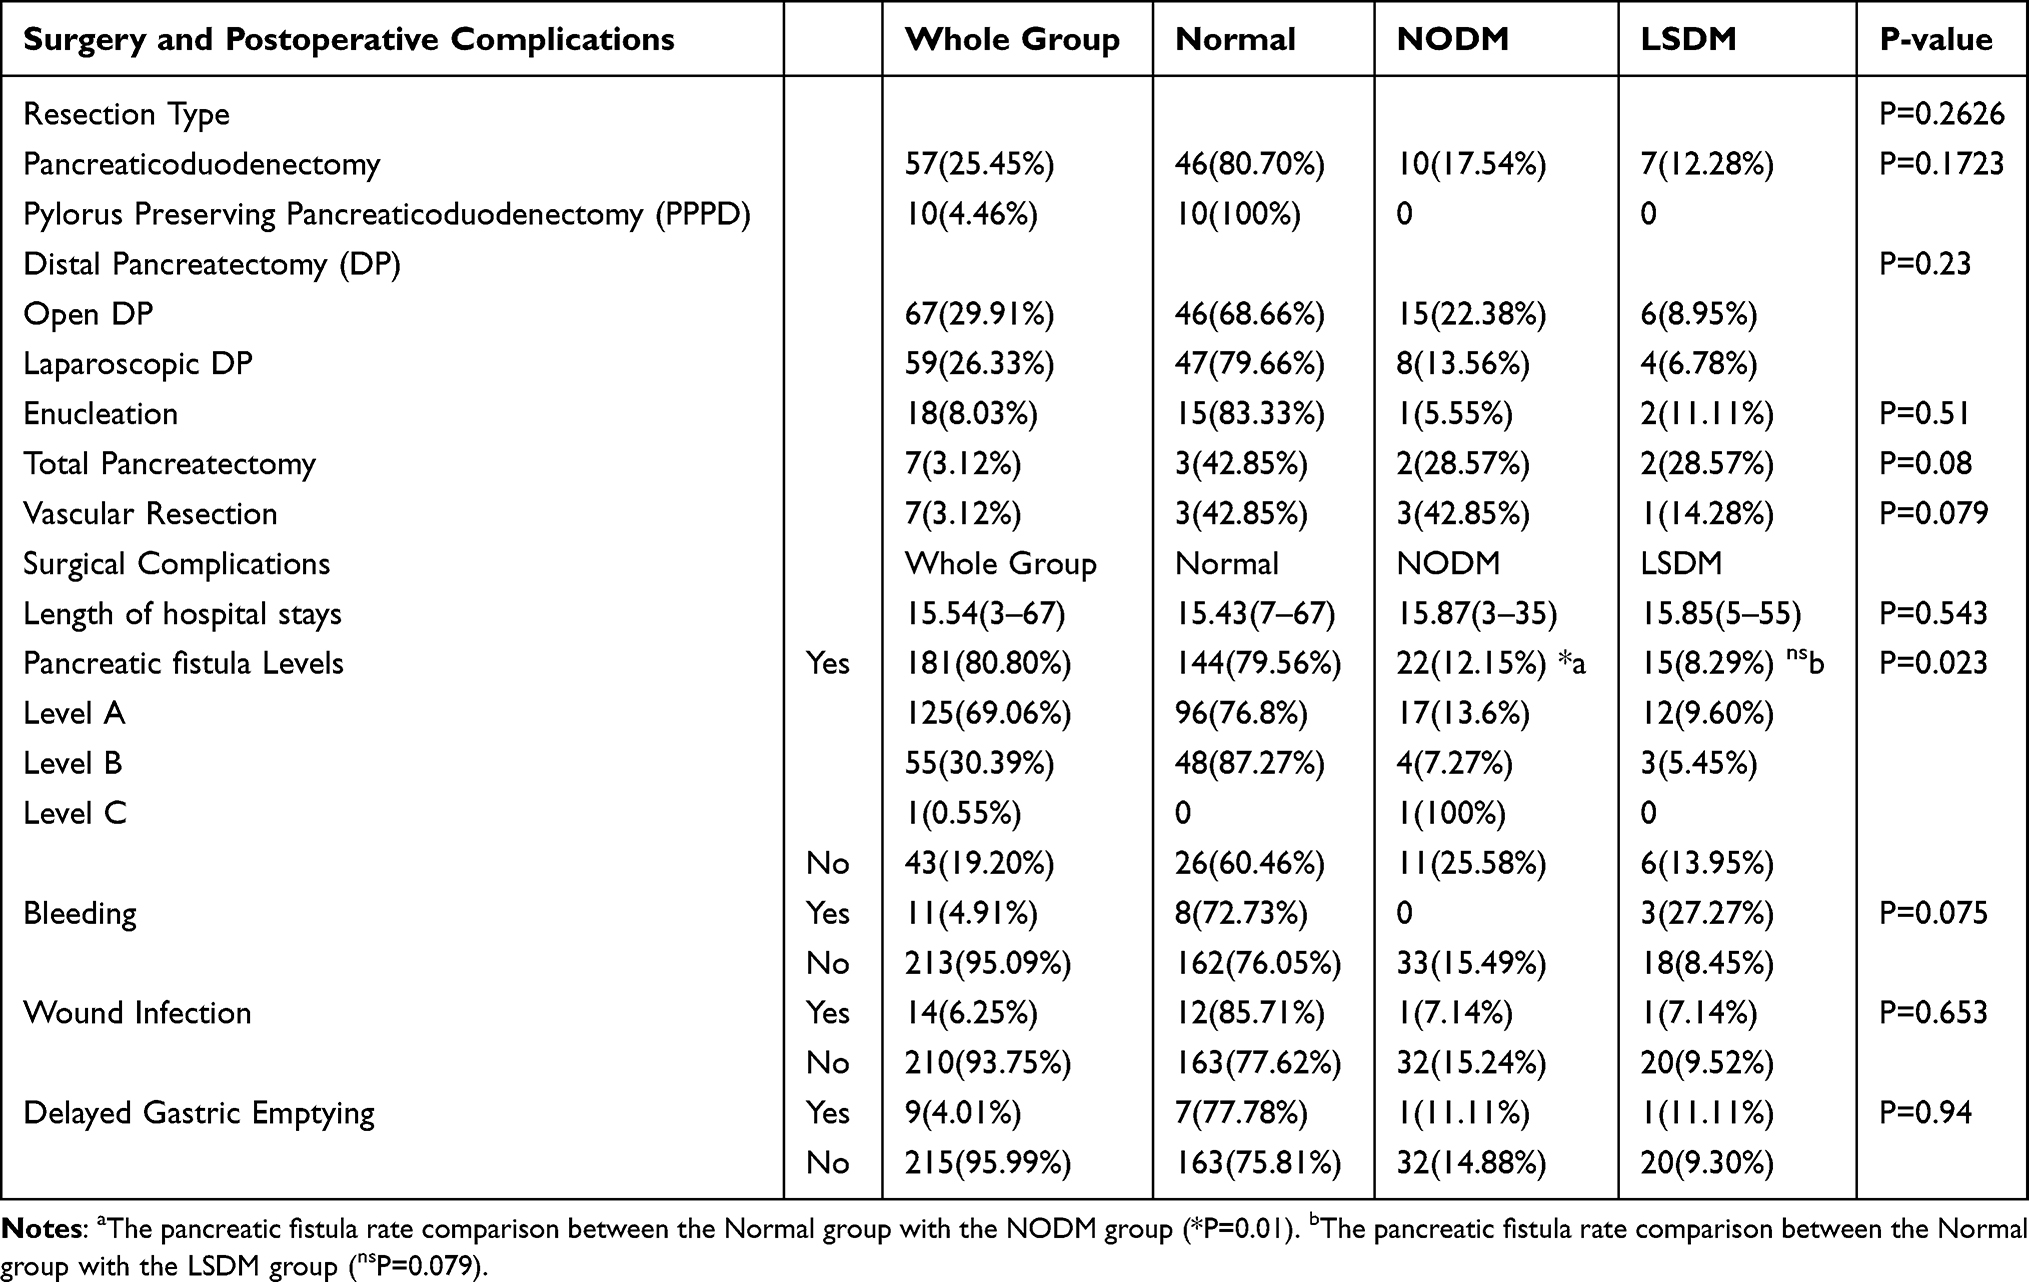 |
Table 4 Surgery and Surgical Outcomes |
mPCN Diagnostic Prediction
Currently, worrisome features and high-risk stigmata are the two main radiological diagnosis methods for mPCN. In radiological features (worrisome features (WF) and high-risk stigmata (HRS)), DM was not associated with tumor site (P=0.089), abrupt change of caliber with pancreatic atrophy (P=0.130), thickened enhanced walls (P=0.291). Worrisome features and high-risk stigmata features, including main pancreatic duct (MPD) dilation, cyst size bigger than 3 cm, lymphadenopathy, and enhanced solid components, were associated with DM. We then compared the diagnostic efficacy of DM, LSDM, and NODM with WF and HRS. The result is shown in Table 5. In the whole PCN group, NODM, DM, LSDM, IR, HbA1c, and BG did not better than the WF and the HRS systems in distinguishing mPCN. NODM had a better sensitivity and specificity score than DM and LSDM. The unadjusted odds ratio of malignancy was 8.264 (P<0.01) in NODM (P<0.01), 5.56 in LSDM (P<0.01), and 7.23 in the DM group (P<0.01).
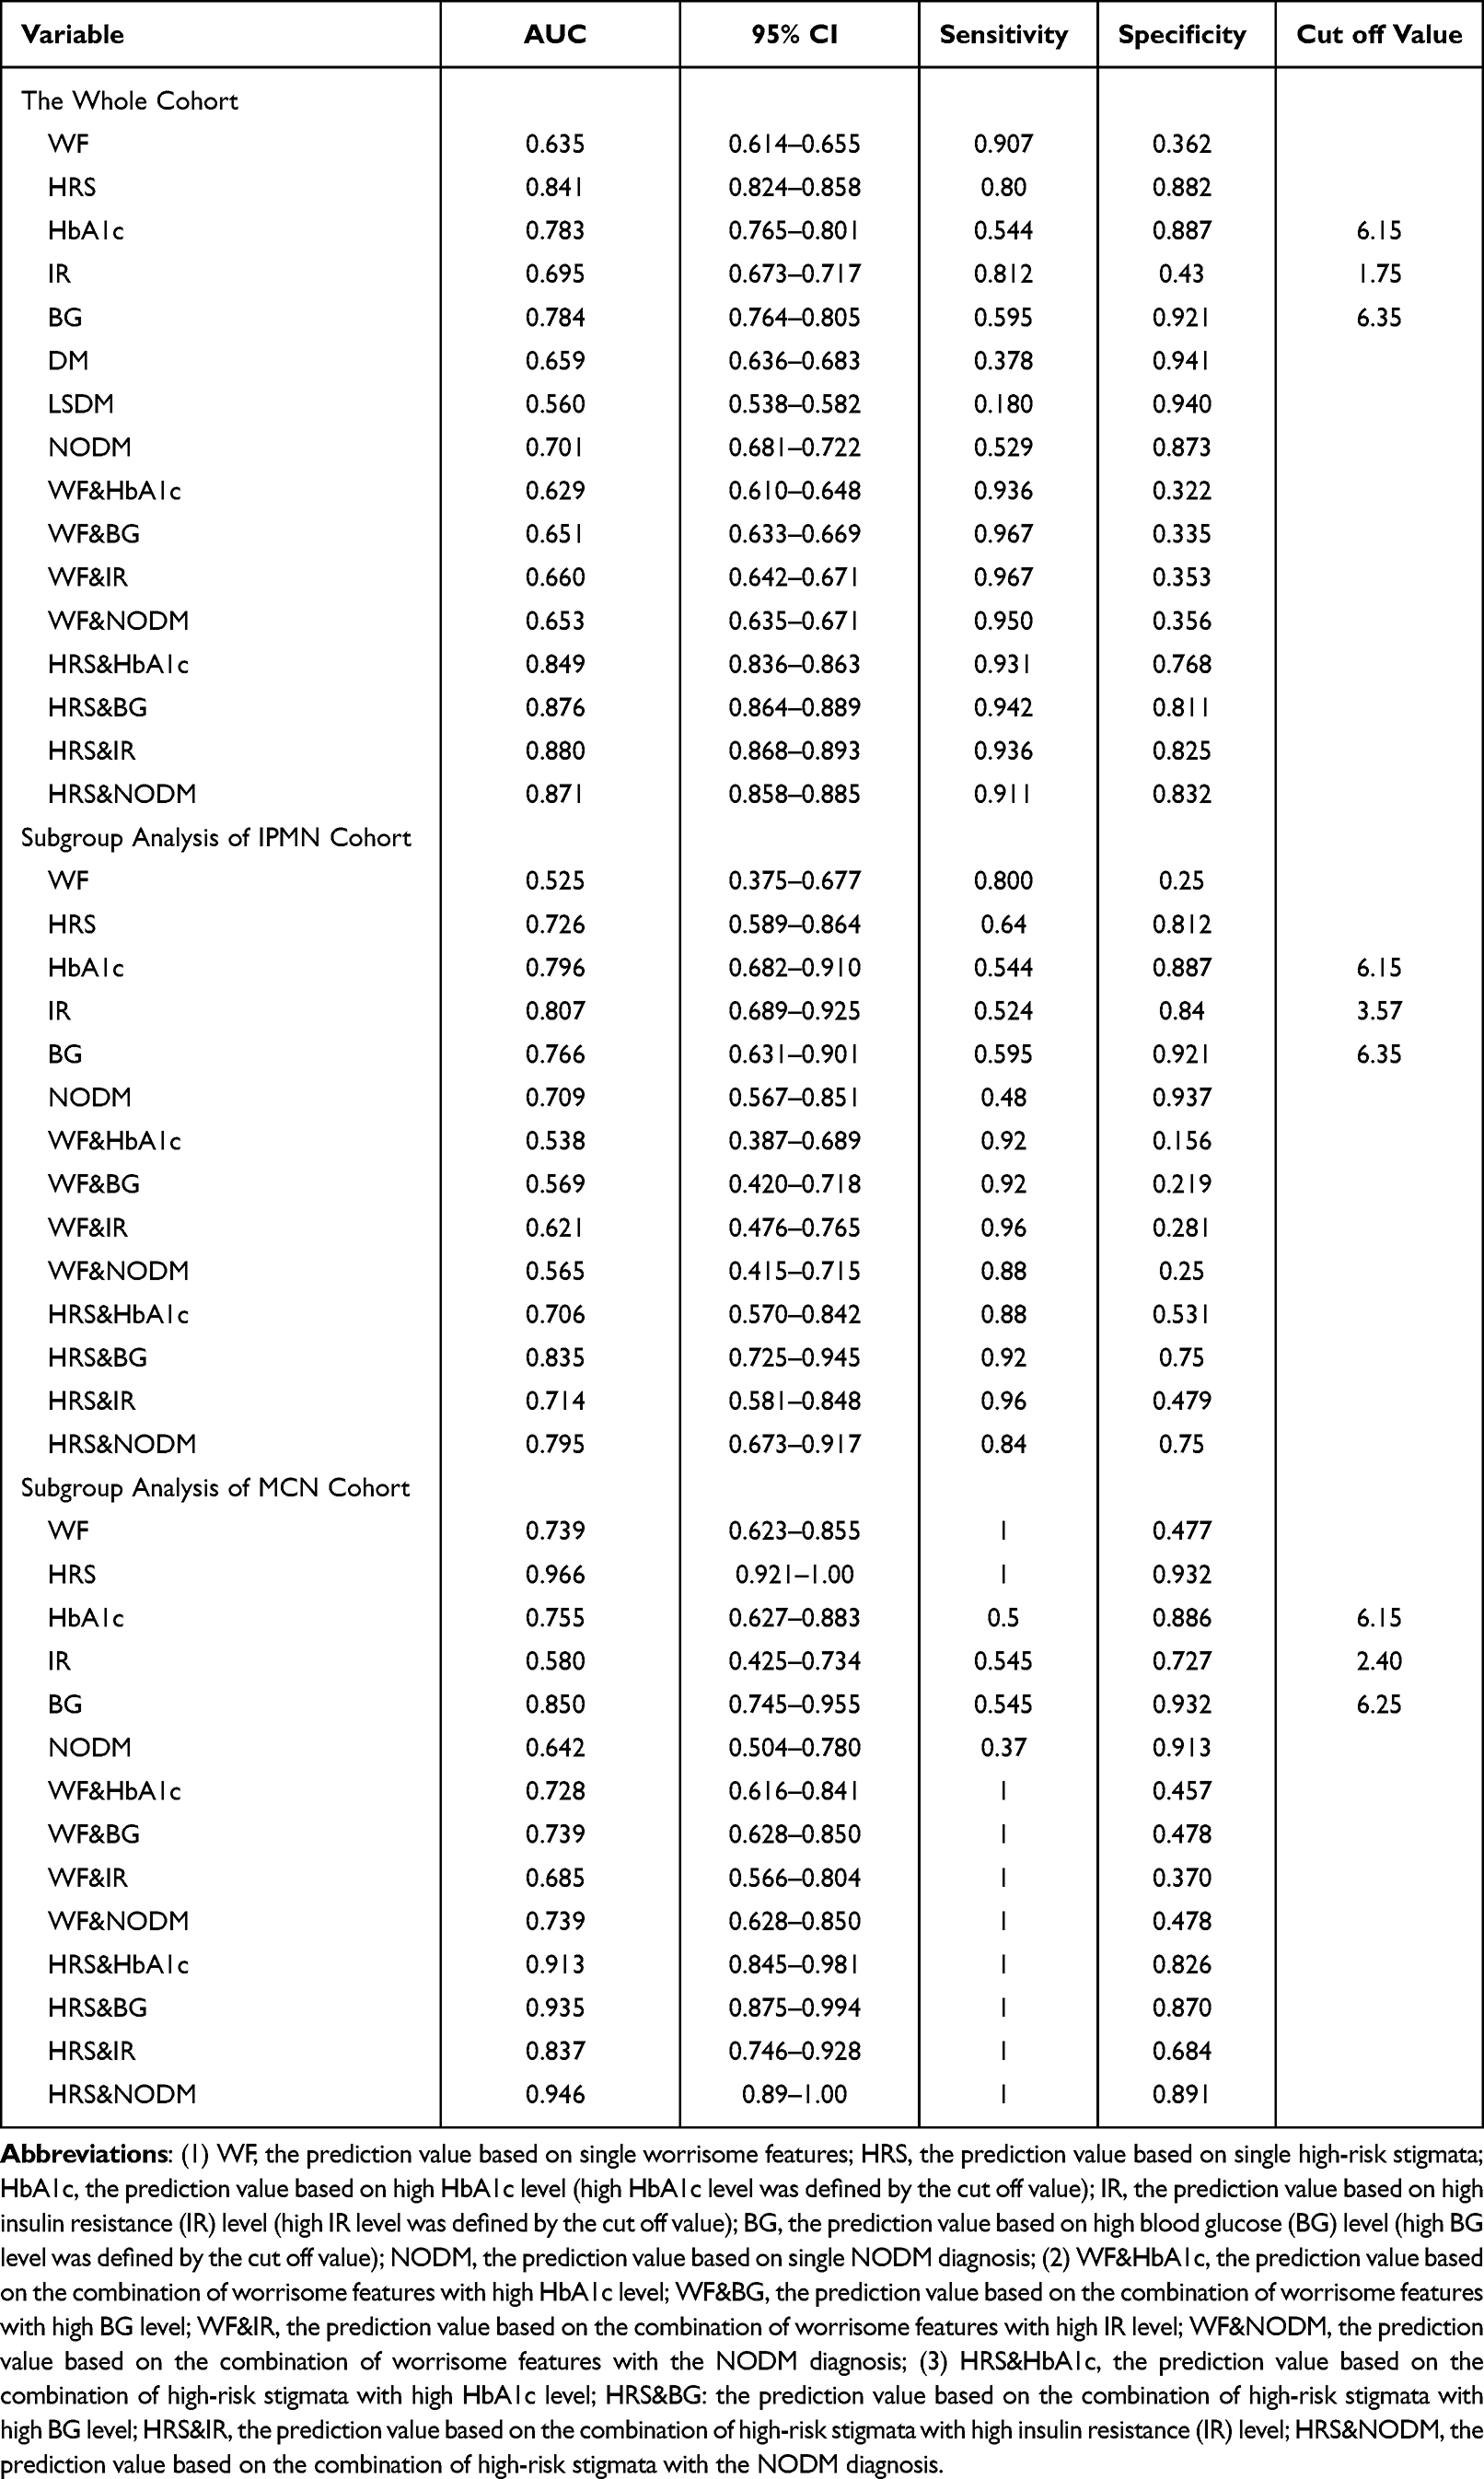 |
Table 5 ROC Result of Diagnostic Efficacy in Each Variable |
Because of this, we then combined NODM, HbA1c, BG, and IR with WF and HRS to see whether these variables could strengthen the diagnostic efficacy of worrisome features and high-risk stigmata. IR had the highest score in the WF combination groups with 96.7% sensitivity and 35.3% specificity. In the HRS combination groups, IR also showed the highest specificity (82.5%) and a slightly lower sensitivity score (93.6%) compared with the BG group (81.1% and 94.2%). In both WF and HRS combinations tests, all diabetic markers increased the sensitivity of WF and HRS, but specificity was decreased to a different extent. In IPMN subgroup analysis, blood glucose level combined with HRS had the highest score (92% sensitivity and75% specificity). In the MCN group, due to all variables having 100% sensitivity, BG and NODM slightly increased the specificity of the WF, but single HRS had the highest specificity score (93.2%).
Malignant PCN Survival and Cancer Biomarkers Analysis
We divided mPCN patients into three groups: The normal group, the NODM group and the LSDM group. By using the K-M curve to analyze the overall survival (OS) of these three groups (as is shown in Figure 2), we found that there was no statistical difference in the median survival time between the NODM group and the normal group (1590 days vs 1260 days, P=0.77) and a significantly reduced median survival was found in LSDM patients (581 days vs 1260 days, P=0.015). We ranked the patients based on each diabetic marker and defined the top 50% as the high group while the last was the low group. Based on this, the cut-off value of BG, IR and HbA1c were 6.9, 2.50, and 6.3. No statistical difference was found in BG (median survival: 894 days vs 1595 days, P=0.72) and IR (median survival: 1260 days vs 1595 days, P= 0.62). The high HbA1c group had a reduced OS than the lower group (median survival: 764 days vs 1260 days, P=0.04). Linear regression analysis was performed later to test the relationship between diabetic markers with tumor biomarkers. We tested CA19-9, CEA, and tumor volume. CA19-9 linear regression test showed that HbA1c (R2=0.512, P<0.05), IR (R2=0.118, P<0.05), and BG (R2=0.235, P<0.05) had a close relationship with CA19-9 elevation. With tumor volume, HbA1c (R2=0.078, P<0.05), IR (R2=0.001, P=0.202) and BG (R2=0.023, P<0.05). In CEA analysis, HbA1c also ranked the highest R2 level (R2=0.239, P<0.05) compared with IR (R2=0, P=0.232) and BG (R2=0.198, P<0.05).
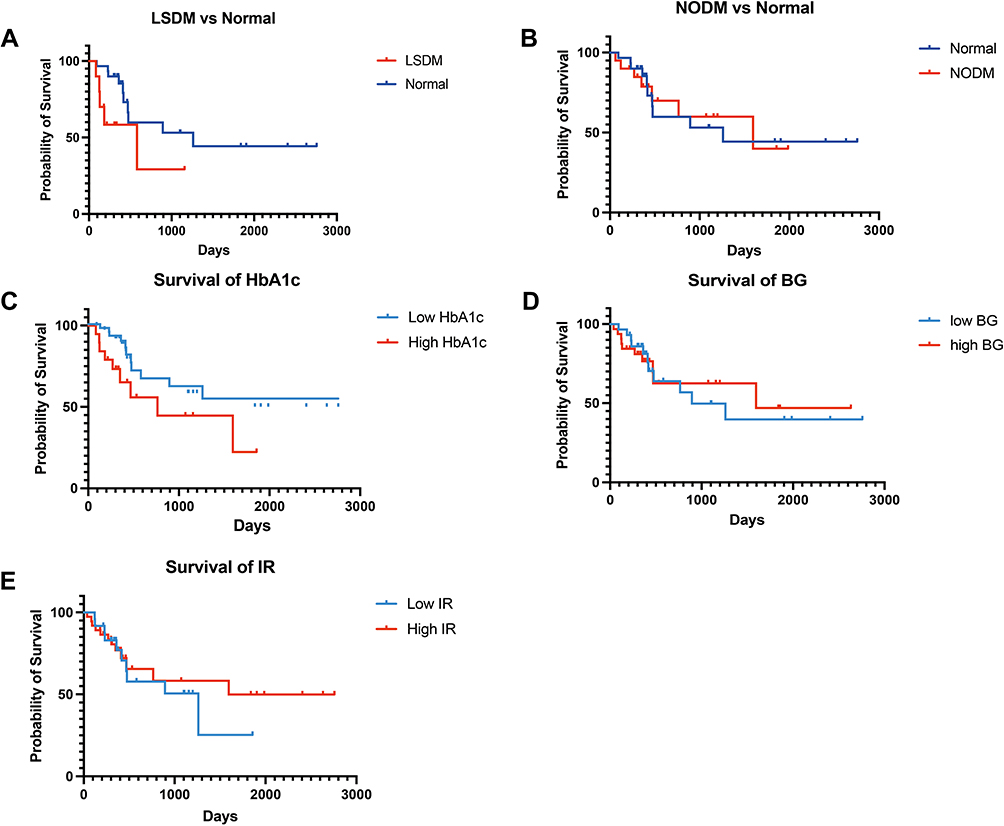 |
Figure 2 K-M survival plots of diabetes and diabetic markers. (A) The overall survival (OS) comparison between the LSDM group with the Normal group (median survival: 581 days vs 1260 days, P=0.015). (B) OS comparison between the NODM group with the Normal group (median survival: 1590 days vs 1260 days, P=0.77). (C) OS comparison between high HbA1c group (cut off value: 6.3%) with low HbA1c group (median survival: 764 days vs 1260 days, P=0.04); (D) OS comparison between high BG group (cut off value: 6.9 mmol/L) with low BG group (median survival: 894 days vs 1595 days, P=0.72); (E) The OS comparison between high IR (cut off value: 2.50) group with low IR group (median survival: 1260 days vs 1595 days, P= 0.62). |
Sub-Group Analysis of Anti-Diabetic Drugs
We then analyzed the influence of anti-diabetic drugs in diabetic PCN patients. In this part, patients who took acarbose were excluded from our study due to too few numbers (n=3). According to the different medications, we divided PCN patients into four groups: 1. patients who never took anti-diabetic drugs were defined as the “No group (N)”(n=11); 2. Patients who mainly took metformin as “metformin group (M)” (n=10); 3. patients whose regimen was primarily based on gliclazide was defined as the “gliclazide group (G)” (n=16); 4. patients who only used insulin was defined as the “insulin group (I)”(n=16). According to our result, we did not find any statistical difference between these four groups in variables including tumor volume (P=0.3264), CEA (P=0.0847), and CA19-9 (P=0.6079), tumor grade (P=0.3264) and Ki67 (P=0.7698). Metformin group had the lowest CA19-9 level (53.93 (M):74.7 (I): 392.74 (G): 456.92 (No)) and Ki67(0.10 (M):0.23 (I): 0.21 (G): 0.20 (No)), but had the highest value in CEA value (14.51 (M):3.334 (I): 3.04 (G): 4.57(N)) and tumor volume (4.66 (M):4.45 (I): 3.86 (G): 4.105 (No)) and tumor grade (2.22 (M):1.63 (I): 1.87 (G): 1.57(No)) (Figure 3).
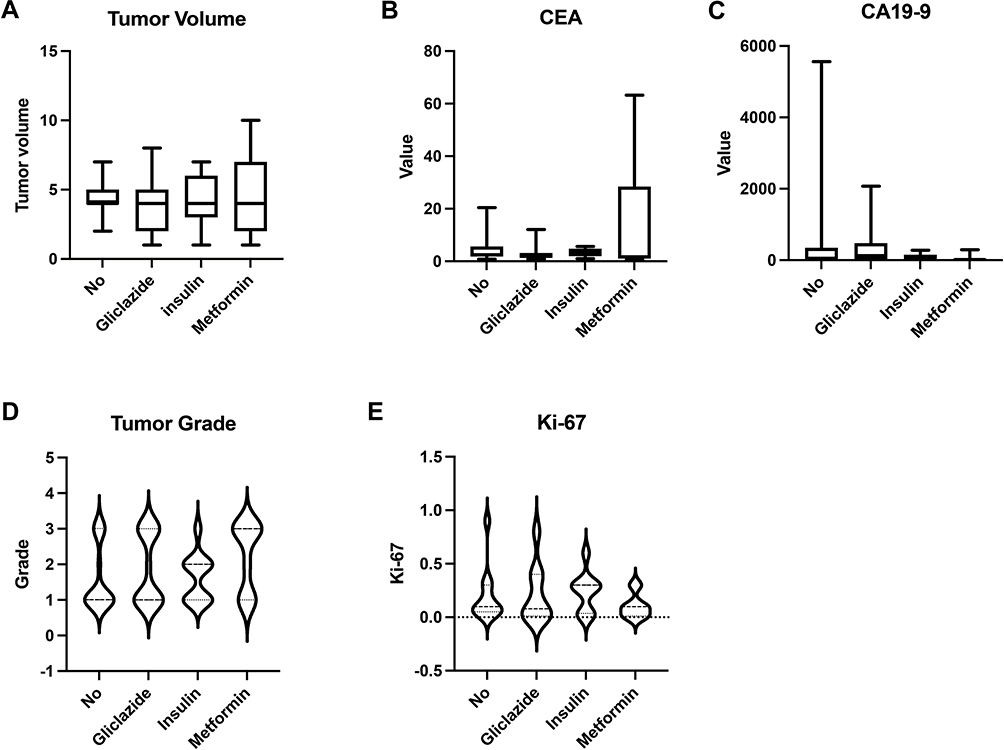 |
Figure 3 Subgroup analysis of anti-diabetic drugs in PCN patients. We divided diabetic patients into four groups. 1. patients who never took anti-diabetic drugs were in the “No group (N)” (n=11); 2. Patients who mainly took metformin as the “metformin group (M)” (n=10); 3. patients whose regimen was primarily based on gliclazide was “gliclazide group (G)” (n=16); 4. patients who only used insulin was the “insulin group (I)” (n=16). (A) The comparison of tumor volume (P=0.3264) between the no, gliclazide, insulin and metformin groups. (B) The comparison of CEA (P=0.0847) between the no, gliclazide, insulin, and metformin groups. (C) The comparison of CA19-9 (P=0.6079) between the no, gliclazide, insulin and metformin groups. (D) The comparison of the tumor grade (P=0.3264) between the no, gliclazide, insulin and metformin groups. (E) The comparison of the Ki67 value (P=0.7698) between the no, gliclazide, insulin and metformin groups. |
Discussion
Our study raised many unanswered questions. The first is that we observed that SMAD4 mutation might be a bridge linking NODM and PCN malignancy. Currently, genetic mutations including KRAS, TP53, and SMAD4 have already been reported as the main driving mutations in the development of mPCN. These three somatic mutations were closely related to the malignancy in PCN.21 Especially SMAD4 was differently expressed in benign PCN and malignant PCN.22,23 In our study, we found that NODM was related to mPCN with the highest odds ratio, which is generally regarded as a type of pancreatic cancer (PDA). From the result of our cohort, a significant increase in SMAD4 mutation was also found in the NODM group.
As one of the most common somatic mutations in pancreatic cancer, the loss of SMAD4 occurs in about half of the pancreatic cancer patients.24 Interestingly, the frequency of the newly occurred hyperglycemia in PDA patients was about 50%.25 In pancreatic cancer, SMAD4 protein works as a vital negative regulator of the TGF-β signal pathway.26 The transforming growth factor -β (TGF-β) signaling pathway is an important factor for malignant transformation, cancer invasion and metastasis in PDA.27 With the deletion of SMAD4 protein, the TGF-β signal pathway is over-activated and thus leading to the carcinogenesis of pancreatic cancer. Moreover, TGF-β has also been reported to have a close relationship with the diabetic event in PDA patients. On the one hand, the TGF-β signal pathway directly induced insulin secretion dysfunction and insulin intolerance in pancreatic β cells, which might cause a delayed insulin secretion peak in patients.28 With the reduced insulin response to blood glucose, peripheral blood glucose concentration could maintain a relatively higher blood glucose level. On the other hand, TGF-β could also activate NF-kB and hypoxia-induced factor-1 alpha (HIF-1 alpha) signal pathway, which were essential for the expression of adrenomedullin and galectin-3 in PDA.29–32 Adrenomedullin directly exacerbated the lipolysis in the peripheral adipose tissue and finally caused insulin resistance in fat tissue.33 And galectin-3 was important for eliciting a blunted insulin sensitivity in the muscle tissue.34 Coincidently, we also observed elevated insulin resistance in the NODM group, while the NODM group showed little relationship with BMI. This indicated that the mechanism of NODM onset in mPCN might be different from the typical mechanism of type 2 diabetes mellitus. With the occurrence of SMAD4 mutation, it is reasonable to postulate that PCN is more likely to be malignant and has a larger possibility to induce insulin resistance which may be the key driver of NODM in PCN patients. Due to the close relationship with SMAD4 mutation, NODM acquired the power of predicting malignancy in pancreatic cyst neoplasms. In the future, more studies on the relationship between SMAD4 and new-onset diabetes in pancreatic cyst neoplasms are needed to confirm our postulation.
As for the postoperative complications, diabetic patients showed a decreased risk of having pancreatic fistula, indicating that DM might be a protective factor for postoperative pancreatic fistula. One possible explanation is those diabetic patients had a harder pancreas texture and more peripancreatic fat mass which may block the formation of fistula.35–37
The second is that we found that the NODM history and diabetic markers were vital for mPCN diagnosis. Worrisome features and high-risk stigmata are generally accepted as the radiological principles for predicting malignant PCN, which can directly guide patients’ surgery discission and clinical outcomes.13,20 We also observed that a combination of diabetic markers with radiological features could be an ideal method for mPCN distinguishment. Although NODM was confirmed to be an independent indication of malignancy in PCN patients in the latest version of the European consensus, we were astonished to find that new-onset diabetic status or prediabetic status could not distinguish malignancy in PCN accurately alone. They both had relatively lower sensitivity in mPCN diagnosis compared with WF and HRS. However, after combining with NODM status or diabetic markers, the sensitivity of WF and HRS was significantly increased. This improvement may help us determine malignant PCN much earlier with higher efficacy, which may prolong patients’ lifespan and enhance their quality of life.
Moreover, our results also showed that prediabetic status measurement is even more critical in mPCN diagnosis. Prediabetic status is a status that people who have a relatively high blood glucose level but do not meet diabetes criteria. In our study, diabetic markers including IR, HbA1c, and BG were more sensitive in their cut-off value when compared with NODM. According to the ADA guideline, all the cut-off values did not meet diabetes diagnostic standards. This result indicated that all of them were under prediabetic status. Among them, IR had the highest sensitivity to mPCN prediction. Our study also confirmed that NODM had a close relationship with insulin resistance. Diabetic status may reflect the insulin resistance severity caused by malignant tumors, but the IR rate can directly assess the trends of insulin resistance both in diabetic status and prediabetic status. The rapid change in insulin resistance level may signal cancer onset, which is the key to early cancer diagnosis. However, diabetic tests such as IR and HbA1c tests can often be ignored in many studies and clinical practice.
And the third question is about the importance of glucose management and anti-diabetic drug selection. Although LSDM showed a limited effect in malignancy diagnosis, LSDM might determine the clinical outcome of mPCN patients. The LSDM predicts poor overall survival in PDA patients while NODM had little influence.38 A similar result was found in our research that the LSDM cohort had a significant OS reduction compared with the normal cohort, while NODM showed no difference. Previous studies reported that after the removal of cancerous tissue, high glucose status in newly diabetic patients induced by PDA would gradually be relived, which indicated that the tumor-promoting effect by NODM was also relieved.39 But for long-standing diabetic patients, hyperglycemia cannot be relieved after surgery and can even worsen due to normal pancreatic tissue removal. Thus, hyperglycemia can only be controlled through proper glucose surveillance and management in LSDM patients. Our study found that HbA1c had the potential of working as a good glucose monitoring target in malignant PCN patients. Unlike IR and BG, HbA1c reflects glucose control over a long period and a statistical OS difference of HbA1c indicates that stable glucose management is essential for mPCN patients. HbA1c is also associated with elevated CA19-9, CEA, and tumor volume levels, which means a high HbA1c level may lead to a more aggressive cancer type in patients. Currently, ADA guidance recommends controlling HbA1c lower than 7%. However, based on our research, we recommend that maintaining HbA1c lower than 6.3% may significantly prolong malignant PCN patients’ survival.16 Glucose surveillance based on HbA1c in the perioperative and postoperative periods is crucial for decreasing postoperative complications and elongating patients’ lives.
As for anti-diabetic drugs selections, a lot of evidence supported the hypothesis that the application of anti-diabetic drugs in diabetic patients can lower the risk of having pancreatic cancer in recent years, especially metformin.40–43 But in our study, we did not observe any robust evidence to support this hypothesis. The metformin’s effect was controversial in our research. The metformin group seems to have a decreased CA19-9, and Ki-67 levels but had the highest level in tumor grade, tumor volume, and CEA level. It seems that metformin has a limited effect in suppressing pancreatic cancer development directly. Interestingly, the metformin group showed the lowest HbA1c level compared with insulin, gliclazide, and no drug users. This result indicated that metformin users might have better glucose controlling effect than the anti-cancer effect. Glucose management based on HbA1c surveillance and metformin use may be an excellent way to prevent cancer recurrence and metastasis in resected mPCN patients.
Our study also had several limitations. Firstly, our cases were selected from 2013 to 2020. In order to keep our data consistent, the standard of worrisome features and high-risk stigmata was based on the 2012 Fukuoka consensus. We did not use the latest 2017 update and 2018 version of the European Consensus. It is unclear how DM and diabetic markers influence the latest diagnostic standard efficacy. Secondly, due to the low prevalence of PCN in clinical cases, we collected 224 patients with clear DM diagnostic and medical records. We excluded cases before 2012 because the diagnosis and treatment of PCN may not perfectly match the 2012 Fukuoka consensus. Moreover, our samples were larger than the expected sample volume via power analysis. Our data clarified the importance of diabetic tests such as IR, HbA1c, and fasting glucose level, which were easily ignored in clinical practice. Moreover, the diabetes diagnostic standards and diabetes-related tests are different in the different centers. A strict retrospective study based on one large volume pancreatic center may help us exclude the bias caused by different DM standards. By doing so, we could only focus on the influence initiated by diabetes mellitus itself. In the future, we could launch a multi-center, prospective study to detect the relationship between DM and PCN according to the result of this study.
Conclusion
In summary, DM showed a strong influence on the diagnosis and prognosis of mPCN (including IPMN, MCN, and SCN). The onset of NODM had a close relationship with SMAD4 mutation, insulin resistance and weight loss. NODM and diabetic markers could effectively strengthen the diagnostic sensitivity of WF and HRS in mPCN diagnosing, which can help patients detect pancreatic cancer earlier. DM was a protective factor for pancreatic fistula, while LSDM was a signal for poor prognosis of malignant PCN. Consistent and stable glucose management in diabetic patients is essential for preventing cancer recurrence. HbA1c (lower than 6.3%) may be a potential ideal value for glucose surveillance and the assessment of glucose management in resected mPCN patients. The effect of anti-diabetic drugs in preventing malignancy is limited, but metformin revealed an excellent effect on long-term glucose control.
Abbreviations
PCN, pancreatic cyst neoplasms; IPMN, intraductal papillary mucinous neoplasms; MCN, mucinous cystic neoplasms; SCN, serous cystic neoplasms; mPCN, malignant PCN; PDA, pancreatic ductal adenocarcinoma; DM, diabetes mellitus; NODM, new-onset diabetes mellitus; LSDM, long-standing diabetes mellitus; IR, insulin resistance; BG, blood glucose; WF, worrisome factors; HRS, high-risk stigmata; OS, overall survival; PPPD, pylorus-preserving pancreaticoduodenectomy; MPD, main pancreatic duct; HbA1c, hemoglobin A1C; LGD, low-grade dysplasia; HGD, high-grade dysplasia; HbA1c, glycosylated hemoglobin type A1c; CEA, carcinoembryonic antigen; CA19-9, carbohydrate 19-9.
Ethical Statement
The authors are accountable for all aspects of this study in ensuring that questions related to the accuracy or integrity of any part of the work are well investigated and resolved. The study was conducted based on the principles of Declaration of Helsinki and was authorized by the Ethics Committee of Huashan Hospital, Fudan University. Officially written informed consent was acquired from all the patients involved in this study.
Funding
This project is supported and funded by the National Natural Science Foundation of China (No.81772566) and NSFC-DFG Cooperation Group (GZ1456).
Disclosure
The authors report no conflicts of interest in this work.
References
1. van Huijgevoort NCM, Del Chiaro M, Wolfgang CL, van Hooft JE, Besselink MG. Diagnosis and management of pancreatic cystic neoplasms: current evidence and guidelines. Nat Rev Gastroenterol Hepatol. 2019;16(11):676–689. doi:10.1038/s41575-019-0195-x
2. Volkan Adsay N. Cystic lesions of the pancreas. Mod Pathol. 2007;20(Suppl 1):S71–93. doi:10.1038/modpathol.3800706
3. Rahib L, Smith BD, Aizenberg R, Rosenzweig AB, Fleshman JM, Matrisian LM. Projecting cancer incidence and deaths to 2030: the unexpected burden of thyroid, liver, and pancreas cancers in the United States. Cancer Res. 2014;74(11):2913–2921. doi:10.1158/0008-5472.CAN-14-0155
4. Yamada S, Fujii T, Murotani K, et al. Comparison of the international consensus guidelines for predicting malignancy in intraductal papillary mucinous neoplasms. Surgery. 2016;159(3):878–884. doi:10.1016/j.surg.2015.08.042
5. Andersen DK, Korc M, Petersen GM, et al. Diabetes, pancreatogenic diabetes, and pancreatic cancer. Diabetes. 2017;66(5):1103–1110. doi:10.2337/db16-1477
6. Ma J, Wang J, Ge L, Long B, Zhang J. The impact of diabetes mellitus on clinical outcomes following chemotherapy for the patients with pancreatic cancer: a meta-analysis. Acta Diabetol. 2019;56(10):1103–1111. doi:10.1007/s00592-019-01337-2
7. Lv X, Qiao W, Leng Y, Wu L, Zhou Y. Impact of diabetes mellitus on clinical outcomes of pancreatic cancer after surgical resection: a systematic review and meta-analysis. PLoS One. 2017;12(2):e0171370. doi:10.1371/journal.pone.0171370
8. Pelaez-Luna M, Takahashi N, Fletcher JG, Chari ST. Resectability of presymptomatic pancreatic cancer and its relationship to onset of diabetes: a retrospective review of CT scans and fasting glucose values prior to diagnosis. Am J Gastroenterol. 2007;102(10):2157–2163. doi:10.1111/j.1572-0241.2007.01480.x
9. Sharma A, Kandlakunta H, Nagpal SJS, et al. Model to determine risk of pancreatic cancer in patients with new-onset diabetes. Gastroenterology. 2018;155(3):730–739.e733. doi:10.1053/j.gastro.2018.05.023
10. Pergolini I, Jäger C, Safak O, et al. Diabetes and weight loss are associated with malignancies in patients with intraductal papillary mucinous neoplasms. Clin Gastroenterol Hepatol. 2021;19(1):171–179. doi:10.1016/j.cgh.2020.04.090
11. Morales-Oyarvide V, Mino-Kenudson M, Ferrone CR, et al. Diabetes mellitus in intraductal papillary mucinous neoplasm of the pancreas is associated with high-grade dysplasia and invasive carcinoma. Pancreatology. 2017;17(6):920–926. doi:10.1016/j.pan.2017.08.073
12. Schweber AB, Brooks C, Agarunov E, et al. New onset diabetes predicts progression of low risk pancreatic mucinous cysts. Pancreatology. 2020;20(8):1755–1763. doi:10.1016/j.pan.2020.09.015
13. European Study Group on Cystic Tumours of the Pancreas. European evidence-based guidelines on pancreatic cystic neoplasms. Gut. 2018;67(5):789–804. doi:10.1136/gutjnl-2018-316027
14. Ledolter J, Kardon RH. Focus on data: statistical design of experiments and sample size selection using power analysis. Invest Ophthalmol Vis Sci. 2020;61(8):11. doi:10.1167/iovs.61.8.11
15. American Diabetes A. 2. classification and diagnosis of diabetes: standards of medical care in diabetes-2018. Diabetes Care. 2018;41(Suppl 1):S13–S27.
16. Buse JB, Wexler DJ, Tsapas A, et al. 2019 Update to: management of hyperglycemia in type 2 diabetes, 2018. A consensus report by the American Diabetes Association (ADA) and the European Association for the Study of Diabetes (EASD). Diabetes Care. 2020;43(2):487–493. doi:10.2337/dci19-0066
17. Yuan C, Rubinson DA, Qian ZR, et al. Survival among patients with pancreatic cancer and long-standing or recent-onset diabetes mellitus. J Clin Oncol. 2015;33(1):29–35. doi:10.1200/JCO.2014.57.5688
18. Yuan C, Babic A, Khalaf N, et al. Diabetes, weight change, and pancreatic cancer risk. JAMA Oncology. 2020;6(10):e202948–e202948. doi:10.1001/jamaoncol.2020.2948
19. Matthews DR, Hosker JP, Rudenski AS, Naylor BA, Treacher DF, Turner RC. Homeostasis model assessment: insulin resistance and beta-cell function from fasting plasma glucose and insulin concentrations in man. Diabetologia. 1985;28(7):412–419. doi:10.1007/BF00280883
20. Tanaka M, Fernández-del Castillo C, Adsay V, et al. International consensus guidelines 2012 for the management of IPMN and MCN of the pancreas. Pancreatology. 2012;12(3):183–197. doi:10.1016/j.pan.2012.04.004
21. Yu J, Sadakari Y, Shindo K, et al. Digital next-generation sequencing identifies low-abundance mutations in pancreatic juice samples collected from the duodenum of patients with pancreatic cancer and intraductal papillary mucinous neoplasms. Gut. 2017;66(9):1677–1687. doi:10.1136/gutjnl-2015-311166
22. Bardeesy N, Cheng KH, Berger JH, et al. Smad4 is dispensable for normal pancreas development yet critical in progression and tumor biology of pancreas cancer. Genes Dev. 2006;20(22):3130–3146. doi:10.1101/gad.1478706
23. Noë M, Niknafs N, Fischer CG, et al. Genomic characterization of malignant progression in neoplastic pancreatic cysts. Nat Commun. 2020;11(1):4085. doi:10.1038/s41467-020-17917-8
24. Hu HF, Ye Z, Qin Y, et al. Mutations in key driver genes of pancreatic cancer: molecularly targeted therapies and other clinical implications. Acta Pharmacol Sin. 2021;42(11):1725–1741. doi:10.1038/s41401-020-00584-2
25. Deng J, Guo Y, Du J, et al. The intricate crosstalk between insulin and pancreatic ductal adenocarcinoma: a review from clinical to molecular. Front Cell Dev Biol. 2022;10:844028. doi:10.3389/fcell.2022.844028
26. Huang W, Navarro-Serer B, Jeong YJ, et al. Pattern of invasion in human pancreatic cancer organoids is associated with Loss of SMAD4 and clinical outcome. Cancer Res. 2020;80(13):2804–2817. doi:10.1158/0008-5472.CAN-19-1523
27. Shen W, Tao G-Q, Zhang Y, Cai B, Sun J, Tian ZQ. TGF-Β in pancreatic cancer initiation and progression: two sides of the same coin. Cell Biosci. 2017;7:39. doi:10.1186/s13578-017-0168-0
28. Parajuli P, Nguyen TL, Prunier C, Razzaque MS, Xu K, Atfi A. Pancreatic cancer triggers diabetes through TGF-β-mediated selective depletion of islet β-cells. Life Sci Alliance. 2020;3:e201900573. doi:10.26508/lsa.201900573
29. Ma P, Tang WG, Hu JW, et al. HSP4 triggers epithelial-mesenchymal transition and promotes motility capacities of hepatocellular carcinoma cells via activating AKT. Liver Int. 2020;40(5):1211–1223. doi:10.1111/liv.14410
30. Natsuizaka M, Ozasa M, Darmanin S, et al. Synergistic up-regulation of Hexokinase-2, glucose transporters and angiogenic factors in pancreatic cancer cells by glucose deprivation and hypoxia. Exp Cell Res. 2007;313(15):3337–3348. doi:10.1016/j.yexcr.2007.06.013
31. Masoud GN, Li W. HIF-1α pathway: role, regulation and intervention for cancer therapy. Acta Pharm Sin B. 2015;5(5):378–389. doi:10.1016/j.apsb.2015.05.007
32. Cao N, Tang X, Gao R, et al. Galectin-3 participates in PASMC migration and proliferation by interacting with TGF-β1. Life Sci. 2021;274:119347. doi:10.1016/j.lfs.2021.119347
33. Sagar G, Sah RP, Javeed N, et al. Pathogenesis of pancreatic cancer exosome-induced lipolysis in adipose tissue. Gut. 2016;65(7):1165–1174. doi:10.1136/gutjnl-2014-308350
34. Liao WC, Huang BS, Yu YH, et al. Galectin-3 and S100A9: novel diabetogenic factors mediating pancreatic cancer-associated diabetes. Diabetes Care. 2019;42(9):1752–1759. doi:10.2337/dc19-0217
35. Chu CK, Mazo AE, Sarmiento JM, et al. Impact of diabetes mellitus on perioperative outcomes after resection for pancreatic adenocarcinoma. J Am Coll Surg. 2010;210(4):463–473. doi:10.1016/j.jamcollsurg.2009.12.029
36. Peng YP, Zhu XL, Yin LD, et al. Risk factors of postoperative pancreatic fistula in patients after distal pancreatectomy: a systematic review and meta-analysis. Sci Rep. 2017;7(1):185. doi:10.1038/s41598-017-00311-8
37. Xia X, Huang C, Cen G, Qiu ZJ. Preoperative diabetes as a protective factor for pancreatic fistula after pancreaticoduodenectomy: a meta-analysis. Hepatobiliary Pancreat Dis Int. 2015;14(2):132–138. doi:10.1016/S1499-3872(15)60330-7
38. Mao Y, Tao M, Jia X, et al. Effect of diabetes mellitus on survival in patients with pancreatic cancer: a systematic review and meta-analysis. Sci Rep. 2015;5:17102. doi:10.1038/srep17102
39. Shingyoji A, Mikata R, Ogasawara S, et al. Diverse transitions in diabetes status during the clinical course of patients with resectable pancreatic cancer. Jpn J Clin Oncol. 2020;50(12):1403–1411. doi:10.1093/jjco/hyaa136
40. Cho J, Scragg R, Pandol SJ, Goodarzi MO, Petrov MS. Antidiabetic medications and mortality risk in individuals with pancreatic cancer–related diabetes and postpancreatitis diabetes: a nationwide cohort study. Diabetes Care. 2019;42(9):1675. doi:10.2337/dc19-0145
41. Amin S, Mhango G, Lin J, et al. Metformin improves survival in patients with pancreatic ductal adenocarcinoma and pre-existing diabetes: a propensity score analysis. Am J Gastroenterol. 2016;111(9):1350–1357. doi:10.1038/ajg.2016.288
42. Singh S, Singh PP, Singh AG, Murad MH, McWilliams RR, Chari ST. Anti-diabetic medications and risk of pancreatic cancer in patients with diabetes mellitus: a systematic review and meta-analysis. Am J Gastroenterol. 2013;108(4):
43. Chen K, Qian W, Jiang Z, et al. Metformin suppresses cancer initiation and progression in genetic mouse models of pancreatic cancer. Mol Cancer. 2017;16(1):131. doi:10.1186/s12943-017-0701-0
 © 2022 The Author(s). This work is published and licensed by Dove Medical Press Limited. The full terms of this license are available at https://www.dovepress.com/terms.php and incorporate the Creative Commons Attribution - Non Commercial (unported, v3.0) License.
By accessing the work you hereby accept the Terms. Non-commercial uses of the work are permitted without any further permission from Dove Medical Press Limited, provided the work is properly attributed. For permission for commercial use of this work, please see paragraphs 4.2 and 5 of our Terms.
© 2022 The Author(s). This work is published and licensed by Dove Medical Press Limited. The full terms of this license are available at https://www.dovepress.com/terms.php and incorporate the Creative Commons Attribution - Non Commercial (unported, v3.0) License.
By accessing the work you hereby accept the Terms. Non-commercial uses of the work are permitted without any further permission from Dove Medical Press Limited, provided the work is properly attributed. For permission for commercial use of this work, please see paragraphs 4.2 and 5 of our Terms.