")
Back to Journals » Clinical Epidemiology » Volume 14
The Role of Cumulative Mean Arterial Pressure Levels in First Stroke Events Among Adults with Hypertension: A 10-Year Prospective Cohort Study
Authors Wang D, Wang J, Liu J, Qin Y, Lou P , Zhang Y, Zhang Y, Xiang Q
Received 20 January 2022
Accepted for publication 25 April 2022
Published 4 May 2022 Volume 2022:14 Pages 665—676
DOI https://doi.org/10.2147/CLEP.S359284
Checked for plagiarism Yes
Review by Single anonymous peer review
Peer reviewer comments 5
Editor who approved publication: Dr Eyal Cohen
Dan Wang,1 Jiaqi Wang,1 Jiali Liu,1 Yu Qin,2 Peian Lou,3 Yongqing Zhang,2 Yuqing Zhang,4 Quanyong Xiang1,2
1School of Public Health, Southeast University, Nanjing, People’s Republic of China; 2Department of Chronic Non-Communicable Disease Control, Jiangsu Provincial Center for Disease Control and Prevention, Nanjing, People’s Republic of China; 3Department of Chronic Non-communicable Disease Control, Xuzhou Center for Disease Control and Prevention, Xuzhou, People’s Republic of China; 4Department of Cardiology, Nanjing Jiangning Hospital, the Affiliated Jiangning Hospital of Nanjing Medical University, Nanjing, People’s Republic of China
Correspondence: Quanyong Xiang, School of Public Health, Southeast University, Nanjing, People’s Republic of China, Tel +86-25-83759469 ; +86-18118996918, Email [email protected]
Background: Mean arterial pressure (MAP) has been proved to be an independent risk factor for stroke. In this study, we explored whether cumulative exposure of MAP in patients with hypertension is more associated with the occurrence of stroke.
Methods: In this prospective follow-up cohort study of hypertension from June 2010 to May 2020, 9136 participants without previous stroke at recruitment were included, of whom 492 (5.4%) had a first incident stroke during the study period (418 ischemic strokes and 74 hemorrhagic strokes). The study exposure factor was cumulative MAP, and was quartered from low to high (Q1, Q2, Q3, Q4). We analyzed the risk of first stroke using multivariable adjusted Cox regression models and used stratified analysis to further explore the risk of stroke in hypertensive patients with different characteristics.
Results: Increased cumulative MAP in patients with hypertension were associated with risk for ischemic stroke (HR, Q2, 1.23 [95% CI, 0.91– 1.67]; Q3, 1.35 [95% CI, 1.01– 1.82]; Q4, 1.55 [95% CI, 1.15– 2.10]; P=0.035). Furthermore, this trend persisted after stratified analysis in men (HR, Q3, 1.76[1.10– 2.82]; Q4, 2.05[1.28– 3.28]), aged 60 or above (HR, Q4, 1.63[1.13– 2.35]) and higher body mass index (BMI) populations (HR, Q3, 1.48[1.02– 2.14]; Q4, 1.59[1.09– 2.32]). In contrast, cumulative MAP was not significantly associated with stroke in women, age under 60, and non-obese individuals.
Conclusion: Increased cumulative MAP is an independent risk factor of ischemic stroke in patients with hypertension. Special attention should also be paid to men, aged 60 or older, or those with a higher BMI.
Keywords: cumulative mean arterial pressure, stroke, hypertension, blood pressure, population science
Introduction
Stroke is a leading cause of death and persistent disability worldwide.1 The incidence and prevalence of stroke in China have increased progressively, with an estimated 2.4 million new strokes and 1.1 million stroke-related deaths annually.2 And after the first stroke events, patients tend to have a poor long-term prognosis, which puts them at high risk of recurrence and death.3 High blood pressure (BP) is a major risk factor for stroke.4 In terms of BP variables, mean arterial pressure (MAP) has been well demonstrated to be an independent risk factor for stroke,5 and the strongest predictor of in-hospital death in patients with ischemic stroke comparing with systolic blood pressure (SBP), diastolic blood pressure (DBP), and pulse pressure (PP).6
MAP is defined as average BP throughout the cardiac cycle, and is a major driver of perfusion of vital organs.7 Cumulative exposure is calculated as the sum of the dose level multiplied by exposure time, which is used to predict the long-term effects of exposure factors on target organs. Specifically, the impact of cumulative levels of BP exposure has been shown to be independent of other vascular risk factors on brain structure and function.8 A large prospective study9 found that 6-year cumulative BP is a stronger predictor of cardiovascular diseases (CVDs) and all-cause mortality than BP variability. However, few studies to date have evaluated the predictive power of cumulative MAP.10 Therefore, the purpose of this study was to prospectively evaluate the effect of cumulative MAP on stroke events using the big data of the Follow-up Cohort Study of Hypertension (FCSH) in Jiangsu Province, China, from 2010 to 2020.
Methods
Data Source and Study Population
According to the characteristics of regional economic development, population distribution and life style, a multistage stratified cluster-sampling method was applied. This study selected five representative counties or districts in Jiangsu Province, China, and then three towns were randomly selected from each county or district. In each town, eight to ten villages were then randomly selected to conduct essential hypertension screening for all adults over 18 years old (permanent residents) from Jan. 2010 to May 2010. According to the inclusion and exclusion criteria (see below), a total of 11,000 hypertension patients were finally enrolled. A total of 273 respondents excluded for missing baseline information, such as: age, weight, smoking, drinking, diabetes, high-density lipoprotein cholesterol (HDL-C), Fasting plasma glucose (FPG), and others. A total of 725 patients with missing complete 12-month BP records between June 2010 and May 2011 were excluded. During the first year of follow-up, between June 2010 and May 2011, a total of 1216 patients without complete 12-month BP records were excluded for various reasons, including death (n=72), elderly persons who were too ill to move and then refused follow-up (n= 835) or left their original residence (n=309). Also, to avoid interference from pre-existing conditions, patients who had a history of stroke were also excluded (n=375). Finally, a total of 9136 hypertensive patients were included in the analysis (Figure 1). All the participants signed an informed consent form and were surveyed on demographic information, behavioral habits and various biochemical clinical indicators. The study protocol was approved by the ethical review committee of the Jiangsu Province Center for Disease Control and Prevention (SL2015-B004-01). Individual person’s data have not contained in any form (including any individual details, images or videos) in this manuscript. The procedures were in accordance with the standards of the ethics committee of Jiangsu Provincial Center for Disease Control and Prevention and with the Declaration of Helsinki (1975, revised 2013).
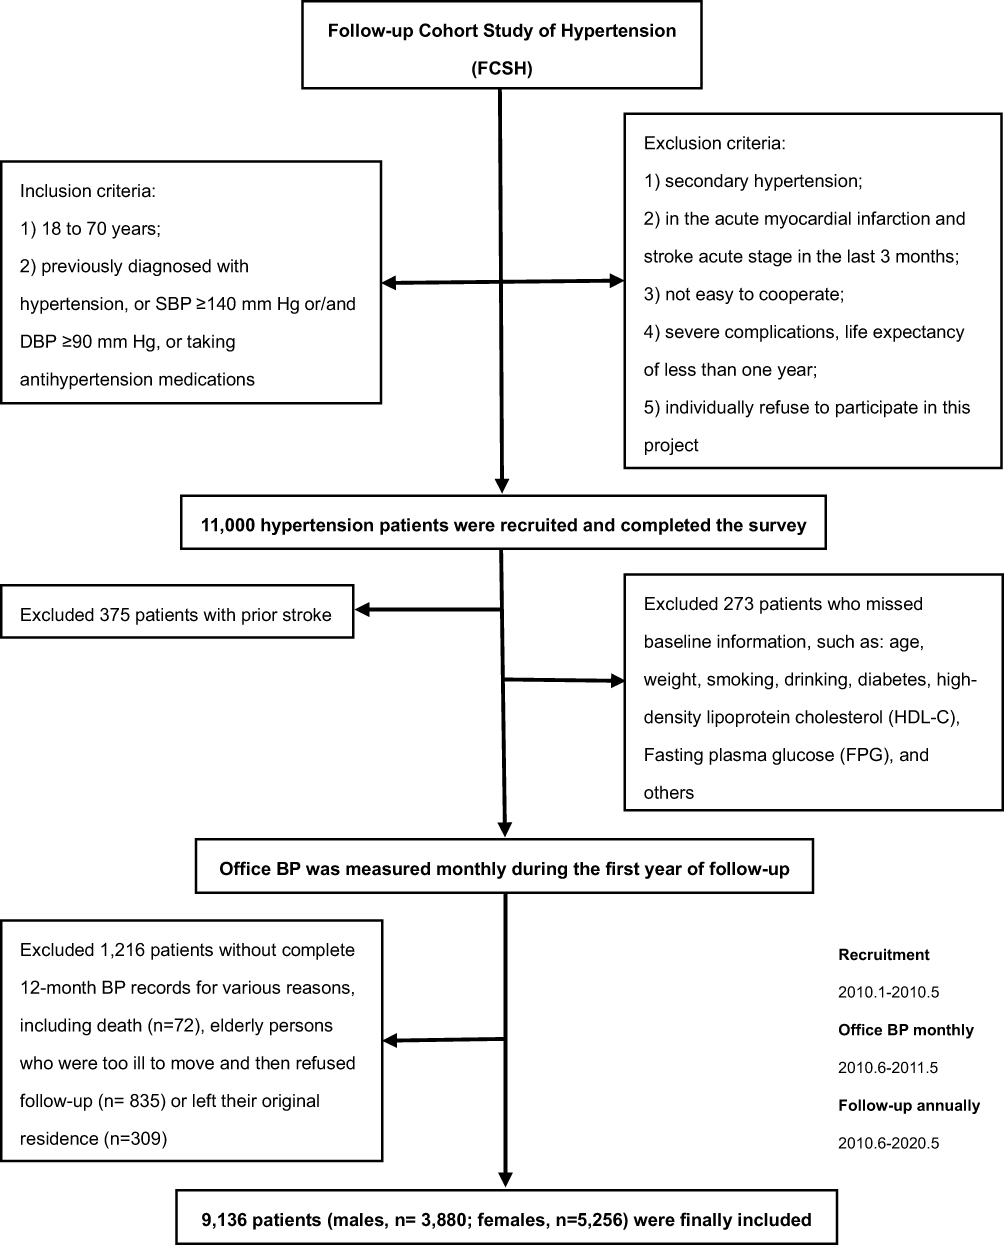 |
Figure 1 Flow chart of the study. |
Inclusions and Exclusions
Patients aged between 18 and 70 years, a) who have been diagnosed with hypertension by doctors, b) SBP ≥140 mm Hg or/and DBP ≥90 mm Hg, c) or taking antihypertension medications, were enrolled. And patients were excluded if they have the following conditions: a) patients with secondary hypertension; b) in the acute myocardial infarction and stroke acute stage in the last 3 months; c) not easy to cooperate; d) severe complications, life expectancy of less than one year; e) individually refuse to participate in this project.
Baseline Data and Measurements
After the recruitment, qualified investigators who had received unified training used the uniform questionnaire form to survey the information of participants using a face-to-face method. The baseline data included: a) demographic information: sex, age, education level; b) clinical indicators: height, weight, FPG, total cholesterol (TC), triglyceride (TG), HDL-C, low-density lipoprotein cholesterol (LDL-C), and serum creatinine (Cr); c) lifestyle variables: taste (light or salty), daily intake of vegetables and fruits, restriction of high-fat food intake, mental status (the feeling of depression and stress), smoking and drinking; d) related medical history: diabetes, dyslipidemia, stroke, duration of hypertension, family history of hypertension and CVDs, and self-assessment of health status. FPG was measured by a qualified professional laboratory at the monitoring site and other blood testing items were tested by the Jiangsu Province Center for Disease Control and Prevention. Automatic biochemical analyzer (Abbott Laboratories) was used to detect blood lipid levels. All testing procedures were strictly controlled.
Definition of Related Indicators
In this study, smoking was defined as having smoked at least one cigarette per day during the 30 days prior to the study,11 and drinking was defined as having consumed alcohol at least once a week during the 30 days prior to the survey.12 Hypertension was defined as office SBP ≥140 mm Hg, and/or DBP ≥90 mm Hg, and/or subjects reported a history of hypertension, and/or had taken antihypertensive medications.13 Diabetes was defined as FPG ≥7.0 mmol /L, and/or subjects reported a history of diabetes, and/or had taken hypoglycemic drugs.14 Dyslipidemia was defined according to the Chinese guidelines on prevention and treatment of dyslipidemia in adults (2007).15 LDL-C was estimated by the Friedewald equation as (TC) – (HDL-C) – (TG/5) in mmol/L.16,17 According to the standards of the World Health Organization,18 the intake of vegetables and fruits ≤ 400 g/d was defined as insufficient intake of vegetables and fruits. The body mass index (BMI) was calculated as weight/height2 (kg/m2), which was classified into four categories: <18.5, 18.5–23.9, 24.0–27.9, and ≥28.0 kg/m2. These categories are based on the criteria of the Cooperative Meta-Analysis Group of the Working Group on Obesity in China.19,20 Besides, in the classification analysis, different development patterns of SBP and DBP from middle age to old age formed the basis for dividing the study population into those older than and younger than 60 years.21
Definition of Parameter Variability
Cumulative MAP was defined as the sum of MAP from each consecutive examination multiplied by the time interval between the two successive examinations.10 Participants’ BP was measured monthly between June 2010 and May 2011 to observe long-term fluctuations in BP levels, and cumulative MAP was calculated using these one-year BP record data. Cumulative BP exposure model was calculated as follows: cumulative MAP = [(MAP1+MAP2)/2 × time1-2] + [(MAP2+MAP3)/2 × time2-3] + … + [(MAP11+ MAP12)/2 × time11-12]. Among them, MAP1, MAP2, MAP3 … MAP12 were mean arterial pressure levels calculated from BP values in consecutive follow-up months, and time1-2, time2-3 … time11-12 were time intervals between two adjacent follow-up BP measurements.
BP was measured by trained personal after at least 5 minutes of rest in a relaxed sitting position, using an Omron HEM-7200 BP apparatus. Patients were seated quietly for 5 minutes, both feet on the floor with the arm supported at heart level. A correctly sized cuff with the air bladder encircling at least 2/3 of the arm was used. BP was measured twice at intervals of 1 minute in each arm, and the average of 2 readings in the arm with the higher BP reading was used for final BP value. MAP was calculated as 1/3SBP + 2/3DBP.6
Study Outcomes and Follow-Up
For all enrolled hypertensive patients, regular follow-up was conducted. Between June 2010 and May 2020, a face-to-face follow-up survey was conducted in May each year and stroke events were recorded by verifying annual medical diagnostic records. The end point in this study was the first incident stroke event. All incidences of stroke during the study period were recorded by type (ischemic or hemorrhagic confirmed by neuroimaging).22 The stroke diagnose must be confirmed by brain imaging using CT or MRI and be reviewed by end-point event review committee. Participants who did not have a stroke during the follow-up time were considered to have completed the survey at the date of death or at the end of the follow-up.
Statistical Analysis
Cumulative MAP was divided equally into four subgroups (Q1, Q2, Q3, Q4) according to quartile level from low to high. Quantitative variables with normal distribution were represented by mean ± standard deviation, and analysis of variance was used for comparison between multiple groups. Categorical variables were expressed as frequency and percentage (%), and χ2 test was used for comparison between groups.
The hazard ratio (HR) and 95% confidence interval (95% CI) for first incident stroke event were calculated by using univariate and multivariate Cox proportional risk regression analysis, with the lower subgroup (Q1) as the reference. Model 1 was adjusted for age, sex, BMI, WC, baseline FPG, TC, TG, HDL-C, LDL-C, Cr, diabetes, dyslipidemia, duration of hypertension and self-assessment of health status. Model 2 was adjusted for Model 1 plus lifestyle variables, including smoking, drinking, physical exercise, adequate daily intake of fruits and vegetables, restriction of high-fat food intake, taste and mental status (stress or depression).
In addition, the population was classified by sex, age and body mass index (BMI) to further explore the risk of stroke. The sensitivity analysis was used to analyze the confounding effects of antihypertensive drugs and behavioral intervention therapy (including salt restriction, regular exercise, weight control, smoking cessation, alcohol restriction, and/or psychological guidance) to consolidate results. All data were rechecked before input, and the qualified ones were input into the computer with EpiData3.1 double-track software, and verified again. Statistical analysis was performed using SPSS (version 22.0), and double-tailed P value <0.05 was considered statistically significant.
Results
General Characteristics of the Study Population
Table 1 shows the baseline characteristics of the participants by quartiles of cumulative MAP. A total of 9136 patients (42.5% males and 57.5% females) aged 19 to 70 years (average 58.2±7.7 years old) completed the survey and were included in the analysis. The mean BMI was 26.1±3.7 kg/m2, 3892 (42.6%) were overweight and 2651 (29.0%) were obese of the cohort. During the 10-year follow-up, 492 had a first incident stroke event, including 418 (85%) ischemic strokes and 74 (15%) hemorrhagic strokes.
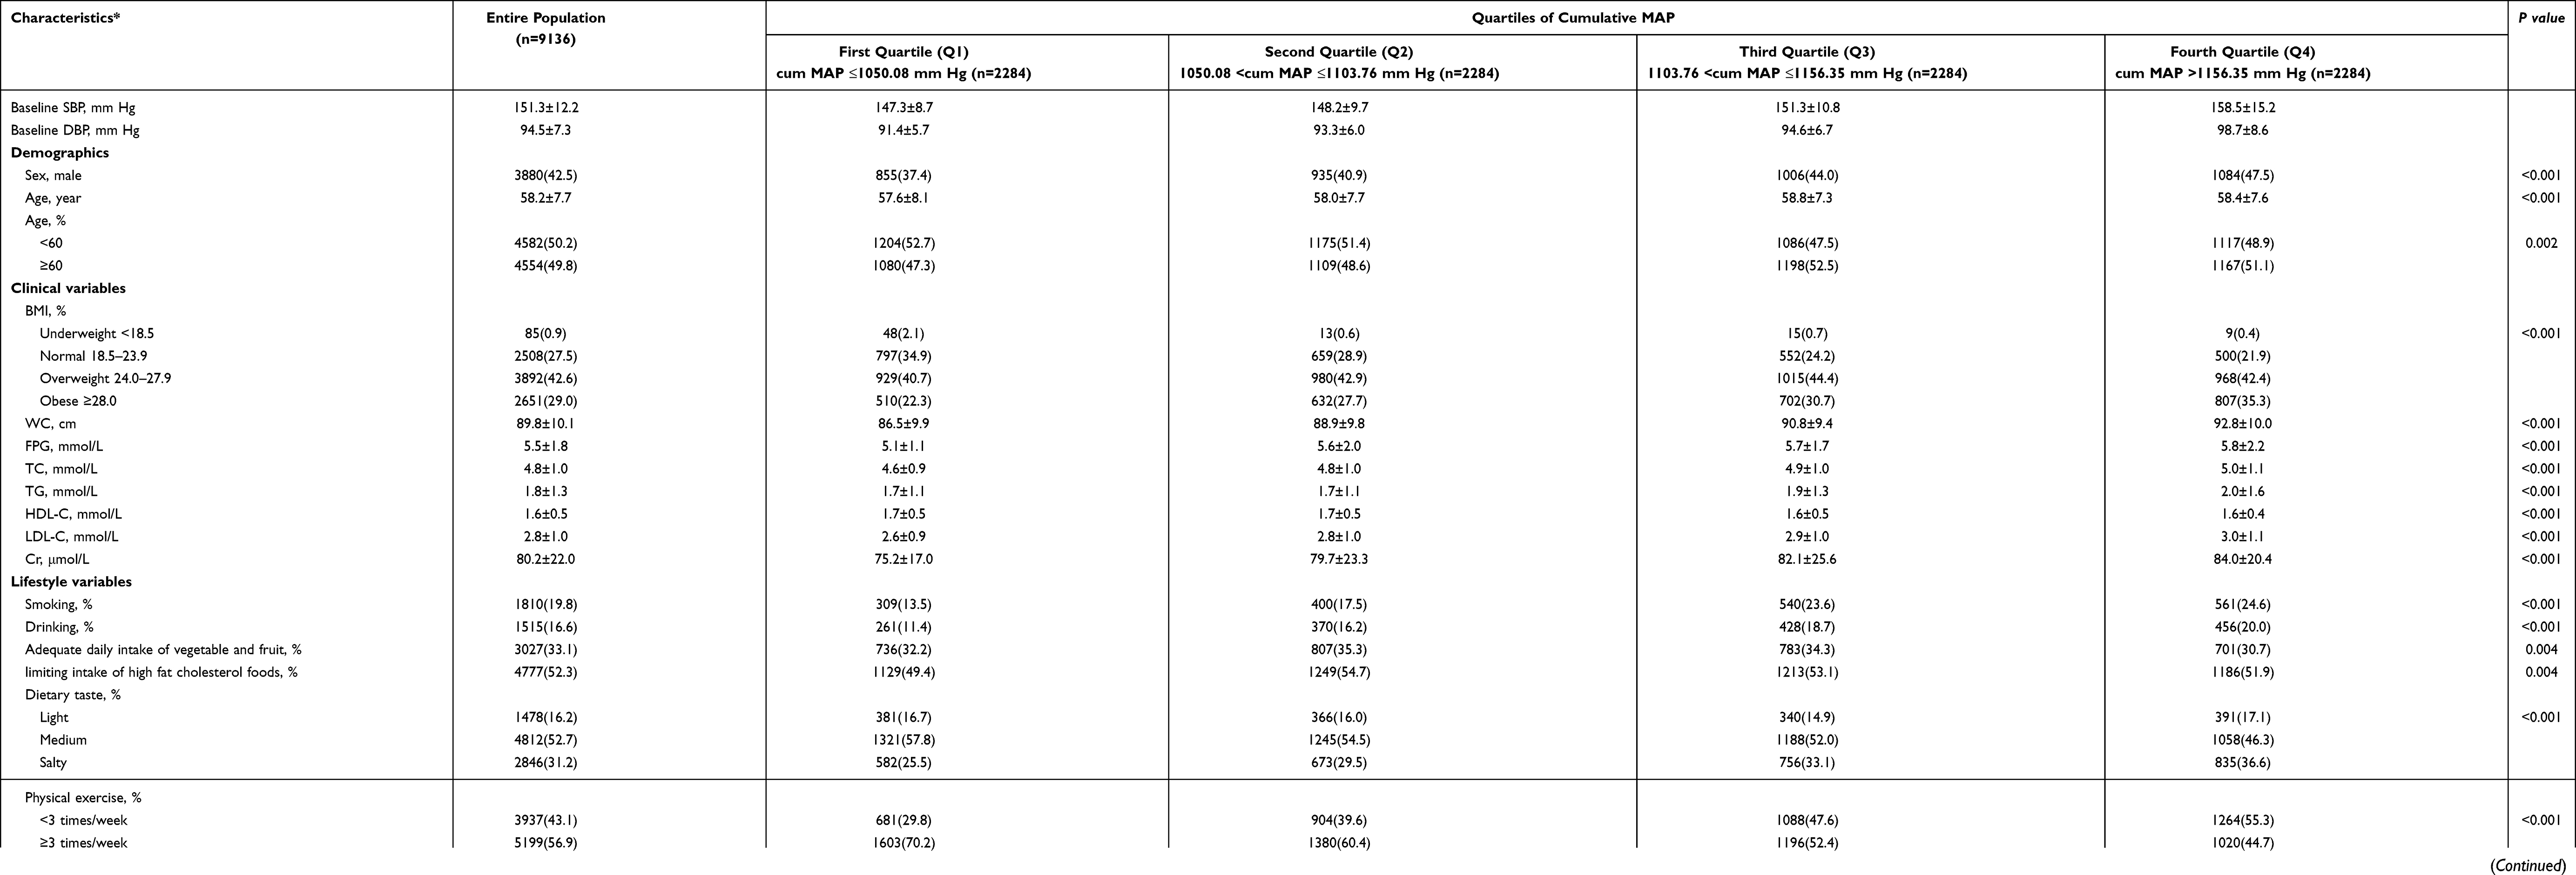 |
Table 1 Baseline Characteristics of the Study Sample |
Compared with patients with high cumulative MAP, those with a lower cumulative MAP tended to be younger, leaner, more likely to be women, without diabetes, and non-smokers, with lower baseline levels of HDL-C. Mean baseline SBP and DBP were 151.3 and 94.5 mmHg, respectively. Almost half of the cohort had history of hypertension for five years or more (50.8%).
Analysis of Cox Regression Model Affecting the Incidence of Stroke
Crude and adjusted hazard ratios (HRs) for cumulative MAP subgroups are given in Table 2. Even after multiple adjustments for baseline disease, risk factors, elevated cumulative MAP was associated with a marked increase in risk of stroke (HR, Q2, 1.13[95% CI, 0.86–1.49]; Q3, 1.29[95% CI, 0.98–1.69]; Q4, 1.53[95% CI, 1.17–2.01]; P=0.013, Model 2).
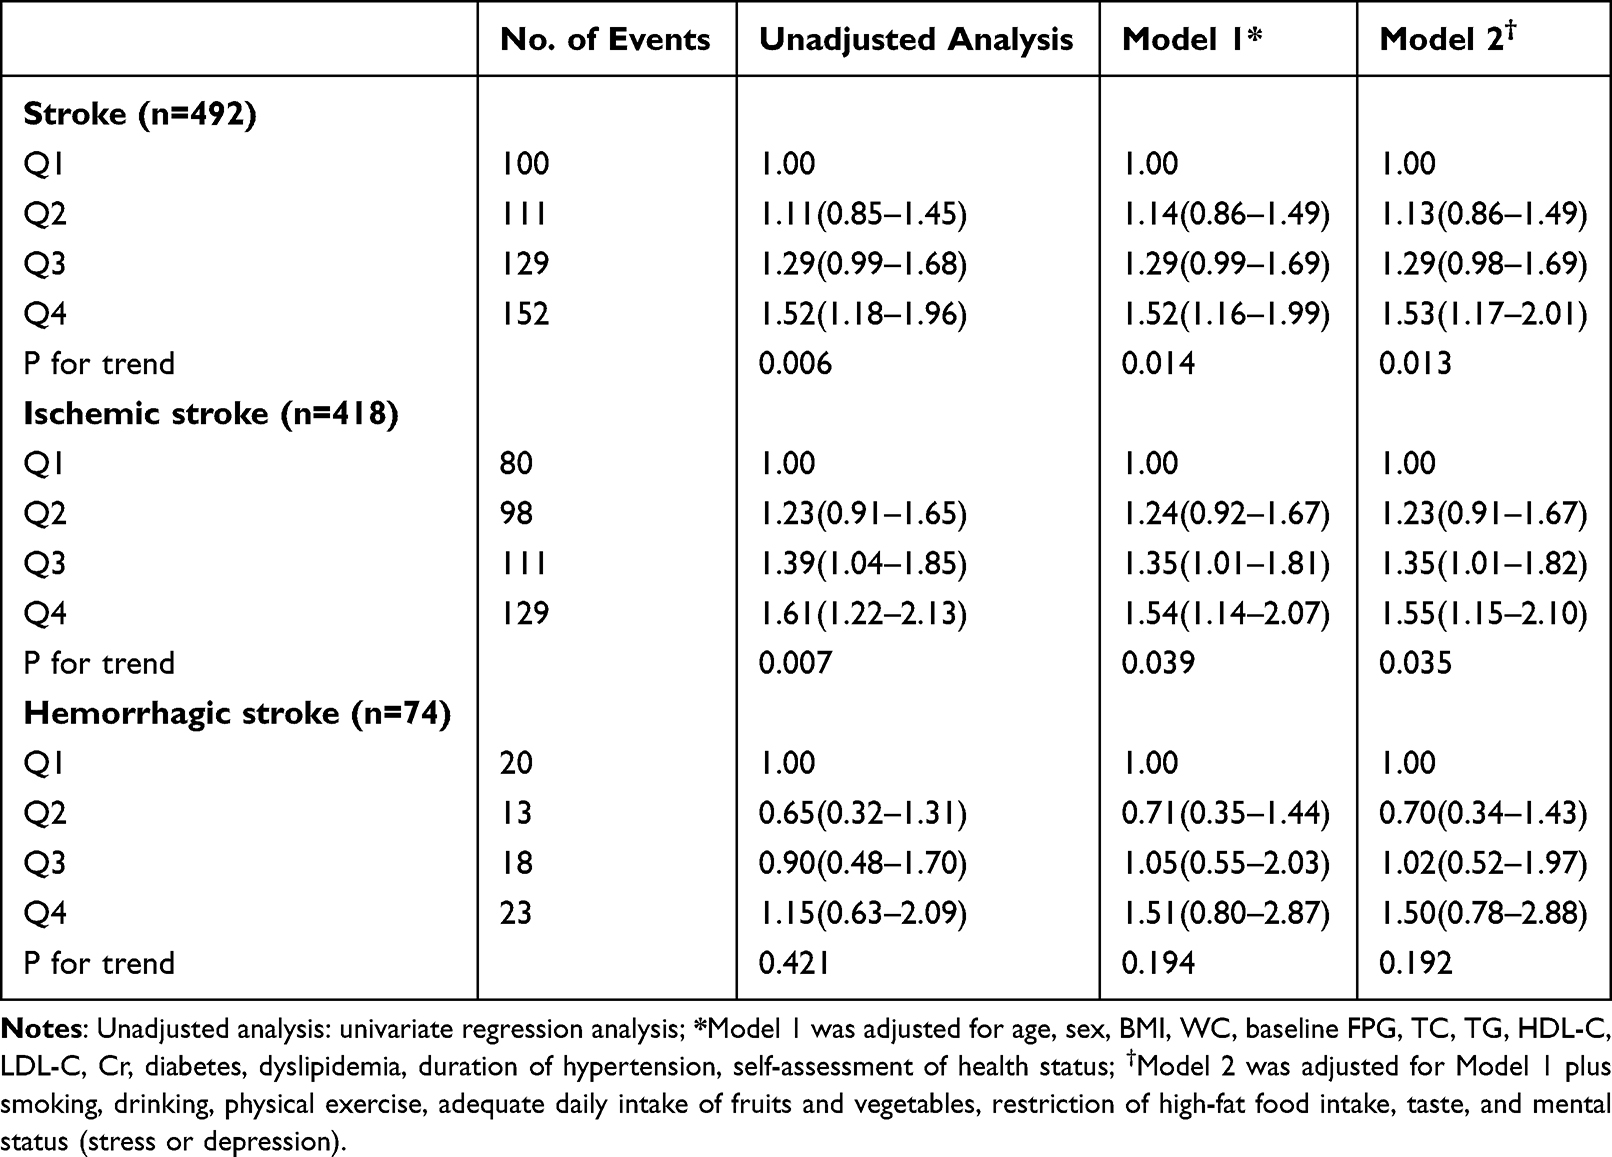 |
Table 2 Crude and Adjusted Stroke Hazard Ratios for Cumulative MAP Subgroups |
Cumulative MAP was shown to have a stronger association on ischemic stroke (HR, Q2, 1.23[95% CI, 0.91–1.67]; Q3, 1.35[95% CI, 1.01–1.82]; Q4, 1.55[95% CI, 1.15–2.10]; P=0.035, Model 2) when the analysis was broken down by stroke type. By contrast, there was no increased risk of hemorrhagic stroke after the same adjustments for cumulative MAP subgroups (HR, Q2, 0.7 [95% CI, 0.34–1.43]; Q3, 1.02 [95% CI, 0.52–1.97]; Q4, 1.50 [95% CI, 0.78–2.88]; P=0.192, Model 2).
Sensitivity Analysis
Considering patients with hypertension were treated with antihypertensive drug treatments medication, non-pharmacologic treatment or both during the 10-year follow-up, similar results were observed in the sensitivity analysis (Table 3), and similar patterns were obtained when the received non-pharmacologic treatments population (stroke, P=0.021; ischemic stroke, P=0.039) and the received antihypertensive drug treatments population (stroke, P=0.009; ischemic stroke, P=0.020) were analyzed separately. These all also indicated that results of the sensitivity analysis did not change the trend of the study conclusion.
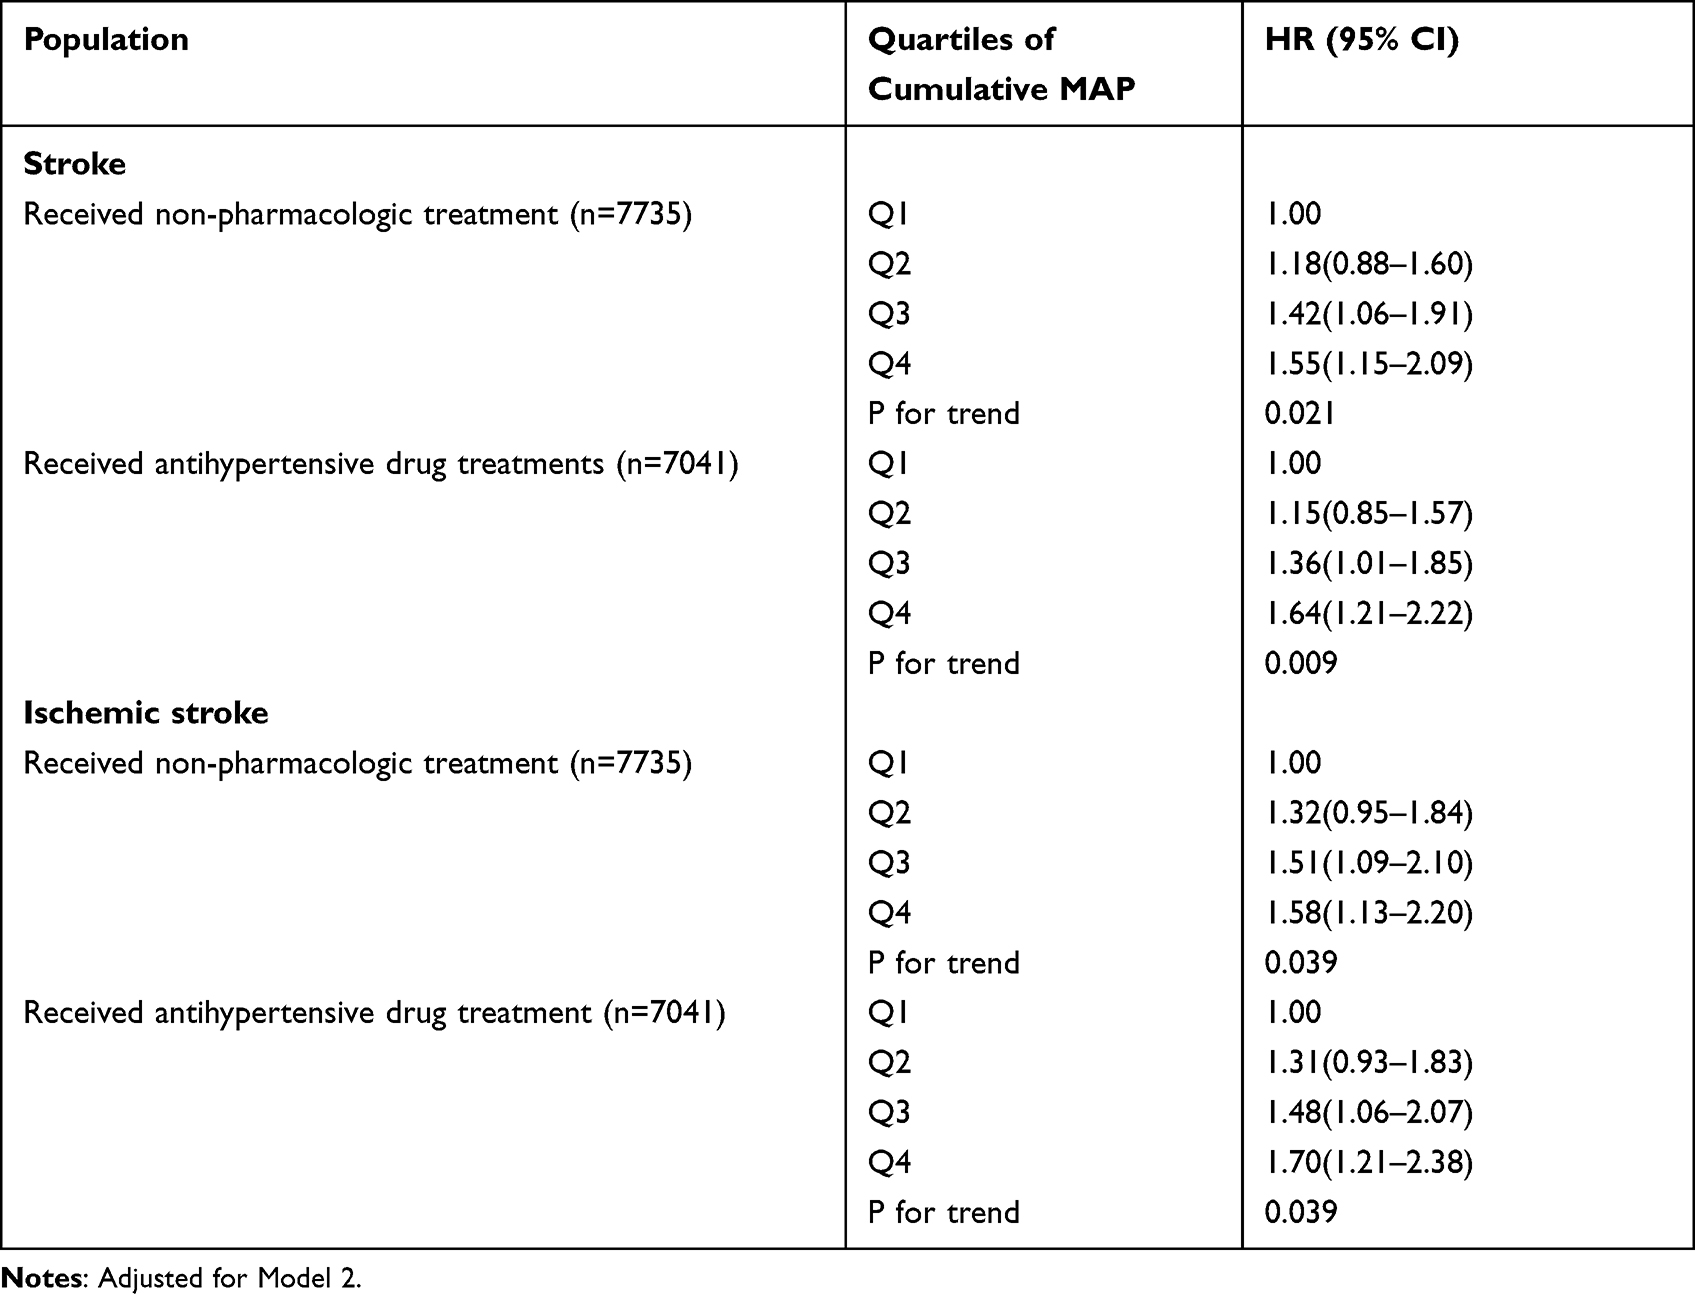 |
Table 3 Multivariate Cox Proportional Regression Model Analysis of Stroke Risk Among Different Subjects (Sensitivity Analysis) |
Stratified Analysis of Adjusted Ischemic Stroke Risk
The effect of cumulative MAP on ischemic stroke was statistically significant in hypertensive males (HR, Q2, 1.30[95% CI, 0.79–2.13]; Q3, 1.76[95% CI, 1.10–2.82]; Q4, 2.05[95% CI, 1.28–3.28]) and people aged 60 or above (HR, Q2, 1.17[95% CI, 0.81–1.71]; Q3, 1.31[95% CI, 0.90–1.89]; Q4, 1.63[95% CI, 1.13–2.35], Table 4). There was also a dose-response relationship between cumulative MAP and stroke in higher BMI populations, and increased cumulative MAP was an independently adjustable risk factor for ischemic stroke (HR, Q2, 1.23[95% CI, 0.83–1.81]; Q3, 1.48[95% CI, 1.02–2.14]; Q4, 1.59[95% CI, 1.09–2.32]). However, the same association was not significant in females, those <60 year and non-obese. These results all found that, visualized in Figure 2 as well, elevated cumulative MAP can significantly increase the risk of ischemic stroke in hypertensive patients with certain characteristics.
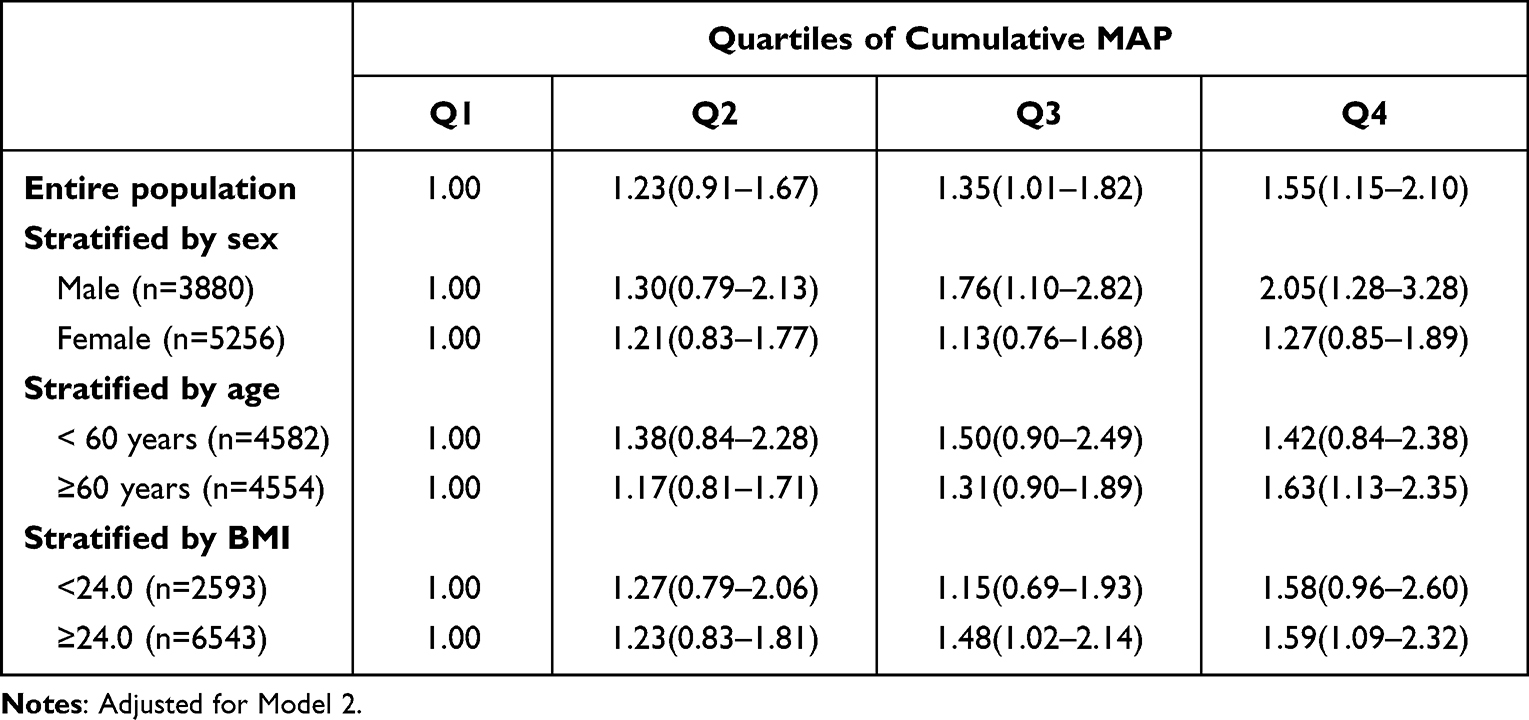 |
Table 4 Adjusted Ischemic Stroke Hazard Ratios for Cumulative MAP Subgroups Stratified by Sex, Age and BMI |
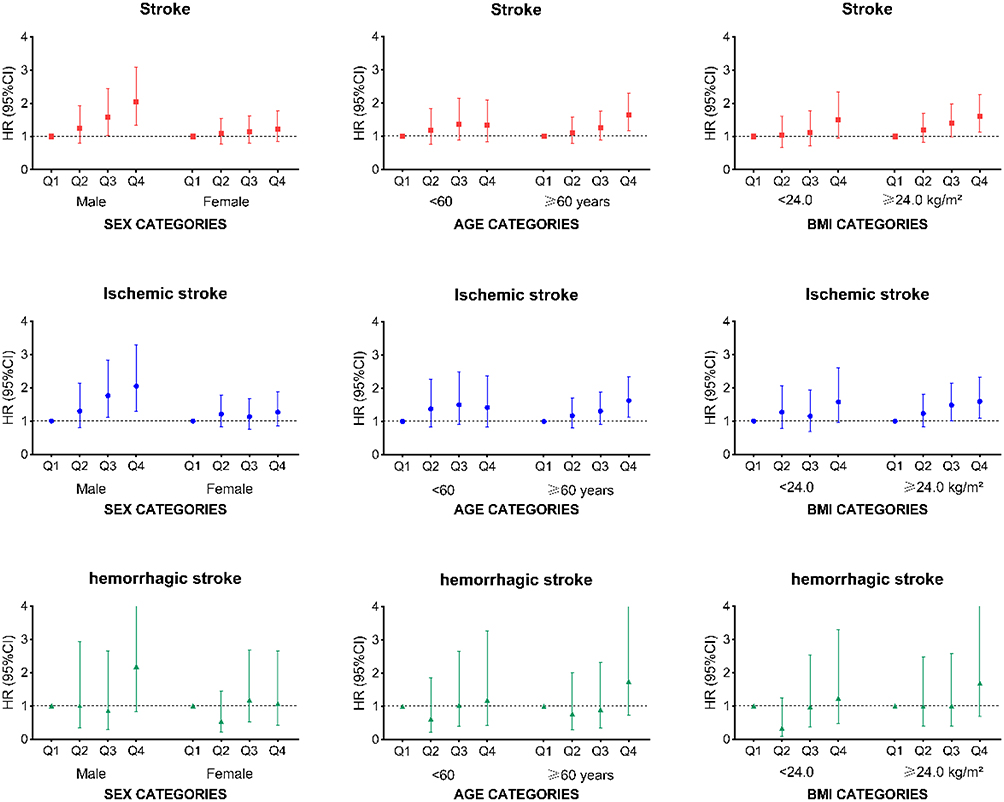 |
Figure 2 Subgroup analysis of the association between cumulative MAP quartile levels and stroke stratified by sex, age, and BMI. Notes: Hazard ratios (HRs) and 95% CI of stroke by quartile levels of cumulative MAP (Q1, cum MAP ≤1050.08 mm Hg, n=2284; Q2, 1050.08 <cum MAP ≤1103.76 mm Hg, n=2284; Q3, 1103.76 <cum MAP ≤1156.35 mm Hg, n=2284; Q4, cum MAP >1156.35 mm Hg, n=2284). |
Discussion
The most common risk factor among stroke survivors was hypertension (88%).2 In this prospective cohort of more than 9000 hypertensive patients, we found a dose-response relationship between cumulative MAP and ischemic stroke, especially in men, aged 60 or older, and those with a higher BMI.
In previous studies, MAP was proved to be an independent risk factor to predict the risk of stroke23 and the clinical prognostic power of it in predicting CVDs risk has been reported to be even better than that of SBP and DBP.24 It was also proved to be a modifiable therapeutic target for preventing or reducing adverse outcomes after cerebrovascular therapy in patients with ischemic stroke.25 In our study, we found a strong association between cumulative MAP and the risk of ischemic stroke in hypertensive patients. In fact, cumulative exposure has been found to have important research value and has been widely used in epidemiological studies.26,27
It is well-known that stroke is the leading cause of death, and long-term physical and cognitive impairment in China, building proper management models for both prevention and prognosis is critical.28,29 While the need for primary prevention, optimized management, and control of risk factors is common across all age and sex groups,30,31 sex and age differences in ischemic stroke risk prompted us to stratification,32,33 and we found that men, higher BMI and aged 60 or older subgroups may need earlier, more aggressive strategies.
Cumulative MAP measures the level of BP fluctuations over time. Long-term continuous high BP and large fluctuation of BP are important determinants of cardiac and vascular target organ damage.34 It may play a role in left ventricular mass, endothelial dysfunction and the development of atherosclerosis, which ultimately leads to the occurrence of serious cardiovascular and cerebrovascular diseases.35–38
This study was a prospective cohort study of 9136 people in Jiangsu Province, China and followed up for 10 years, which is highly representative and of certain research value in Jiangsu Province. Second, different from other hypertension cohort studies, the value of cumulative MAP in hypertensive patients was calculated by using BP data of continuous follow-up for a whole year. Third, this study adjusted for comprehensive confounding factors (including demographic characteristics, clinical measurement indicators, lifestyle variables and related disease history) and used the sensitivity analysis to further eliminate some potential effects on study results. Fourth, our large and long-term study made up for the shortcomings of previous studies on cumulative MAP cohort, and based on Cui et al. ‘s study,10 we directly targeted the population of hypertensive patients to further study the role of cumulative MAP, and expanded the specific characteristics of high-risk group.
Likewise, there are several limitations to our study. One is that in this 10-year prospective study to detect the risk of stroke incidence, follow-up measurements of BP were not carried over to the end of study. However, we have measured 12 consecutive months to assess the cumulative exposure level of MAP in the first year of follow-up. The second is that our study population included all hypertensive patients and did not stage hypertensive patients on medication to exclude high-risk patients, which may have overestimated the study results. However, we have considered both pharmacologic and nonpharmacologic treatments for high-risk hypertensive patients and analyzed the relationship between cumulative MAP and stroke in pharmacologically and non-pharmacologically treated populations separately using sensitivity analysis to further robust the study results. In addition, there are other uncorrected confounders, such as high sodium intake and type of antihypertensive medication taken.
Cumulative MAP can be used as a supplementary indicator of SBP and DBP to monitor BP fluctuation level, so as to more accurately prevent the occurrence of stroke. With the popularization of public health system, the storage and calculation of BP value become more intelligent. We hope that in the future, more studies will build on the extensive research on MAP and dynamically assess the relationship between cumulative MAP and cardiovascular disease and even to quantify the thresholds of cumulative MAP.
In conclusion, increased cumulative MAP in patients with hypertension was associated with an increased risk of ischemic stroke, which is an independent risk factor of ischemic stroke in hypertensive patients. In particular, attention should be paid to the importance of keeping persistent low level of cumulative MAP in men, higher BMI, or people aged 60 or older to reduce the risk of ischemic stroke.
Data Sharing Statement
Xiang et al can provide the data request.
Ethics of Approval Statement
The study protocol was approved by the ethical review committee of the Jiangsu Provincial Center for Disease Control and Prevention (SL2015-B004-01).
Acknowledgments
We thank Wang Zengwu and Wang Xin (Division of Prevention and Community Health, National Center for Cardiovascular Disease, Fuwai Hospital) for their constructive suggestions and the technical support. We thank all the colleagues involving in this survey from Peixian, Haian, Lianshui, Sihong County and Jiangye District Center for Disease Control and Prevention.
Author Contributions
All authors made a significant contribution to the work reported, whether that is in the conception, study design, execution, acquisition of data, analysis and interpretation, or in all these areas; took part in drafting, revising or critically reviewing the article; gave final approval of the version to be published; have agreed on the journal to which the article has been submitted; and agree to be accountable for all aspects of the work.
Funding
Jiangsu Province Health Research Project (H201224); Chinese National Specific Fund for Health Research in Public Interest (200902001).
Disclosure
The authors declare no conflict of interest.
References
1. Johnston SC, Mendis S, Mathers CD. Global variation in stroke burden and mortality: estimates from monitoring, surveillance, and modelling. Lancet Neurol. 2009;8:345–354.
2. Wang W, Jiang B, Sun H, et al. Prevalence, Incidence, and Mortality of Stroke in China: results from a Nationwide Population-Based Survey of 480 687 Adults. Circulation. 2017;135:759–771.
3. Chen Y, Wright N, Guo Y, et al. Mortality and recurrent vascular events after first incident stroke: a 9-year community-based study of 0·5 million Chinese adults. Lancet Glob Health. 2020;8:e580–e590.
4. O’Donnell MJ, Xavier D, Liu L, et al. Risk factors for ischaemic and intracerebral haemorrhagic stroke in 22 countries (the INTERSTROKE study): a case-control study. Lancet. 2010;376:112–123.
5. Verdecchia P, Schillaci G, Reboldi G, et al. Different prognostic impact of 24-hour mean blood pressure and pulse pressure on stroke and coronary artery disease in essential hypertension. Circulation. 2001;103:2579–2584.
6. Bangalore S, Schwamm L, Smith EE, et al. Blood pressure and in-hospital outcomes in patients presenting with ischaemic stroke. Eur Heart J. 2017;38:2827–2835.
7. Grillo A, Salvi P, Furlanis G, et al. Mean arterial pressure estimated by brachial pulse wave analysis and comparison with currently used algorithms. J Hypertens. 2020;38:2161–2168.
8. Mahinrad S, Kurian S, Garner CR, et al. Cumulative Blood Pressure Exposure During Young Adulthood and Mobility and Cognitive Function in Midlife. Circulation. 2020;141:712–724.
9. Bao M, Song Y, Li J. PREDICTIVE VALUE COMPARISON OF BLOOD PRESSURE VARIABILITY, CUMULATIVE BLOOD PRESSURE, AND BLOOD PRESSURE TRAJECTORY FOR CARDIOVASCULAR EVENTS AND ALL-CAUSE MORTALITY. J Am Coll Cardiol. 2020;75:2024.
10. Cui X, Zhao Q, Yu J, et al. Cumulative mean arterial pressure and risks of adverse cardiac and cerebrovascular events: a prospective cohort study of 53,813 adults. J Hum Hypertens. 2018;32:585–593.
11. McClave AK, McKnight-Eily LR, Davis SP, et al. Smoking characteristics of adults with selected lifetime mental illnesses: results from the 2007 National Health Interview Survey. Am J Public Health. 2010;100:2464–2472.
12. Simpson RF, Hermon C, Liu B, et al. Alcohol drinking patterns and liver cirrhosis risk: analysis of the prospective UK Million Women Study. Lancet Public Health. 2019;4:e41–e48.
13. Liu LS. Writing Group of 2010 Chinese Guidelines for the Management of Hypertension. [2010 Chinese guidelines for the management of hypertension]. Zhonghua Xin Xue Guan Bing Za Zhi. 2011;39:579–615.
14. Chinese Diabetes Society. National Offic for Primary Diabetes Care. Zhonghua Nei Ke Za Zhi. 2018;57:885–893.
15. Joint Committee for Developing Chinese guidelines on Prevention and Treatment of Dyslipidemia in Adults. [Chinese guidelines on prevention and treatment of dyslipidemia in adults]. Zhonghua Xin Xue Guan Bing Za Zhi. 2007;35:390–419. Chinese.
16. Martin SS, Blaha MJ, Elshazly MB, et al. Comparison of a novel method vs the Friedewald equation for estimating low-density lipoprotein cholesterol levels from the standard lipid profile. JAMA. 2013;310:2061–2068.
17. Friedewald WT, Levy RI, Fredrickson DS. Estimation of the concentration of low-density lipoprotein cholesterol in plasma, without use of the preparative ultracentrifuge. Clin Chem. 1972;18:499–502.
18. Keller I, Tukuitonga C. The WHO/FAO fruit and vegetable promotion initiative. Acta Hortic. 2007;1:27–37.
19. Zhou BF. Cooperative Meta-Analysis Group of the Working Group on Obesity in China. Predictive values of body mass index and waist circumference for risk factors of certain related diseases in Chinese adults–study on optimal cut-off points of body mass index and waist circumference in Chinese adults. Biomed Environ Sci. 2002;15:83–96.
20. He Y, Jiang B, Wang J, et al. BMI versus the metabolic syndrome in relation to cardiovascular risk in elderly Chinese individuals. Diabetes Care. 2007;30:2128–2134.
21. Khattar RS, Swales JD, Dore C, et al. Effect of aging on the prognostic significance of ambulatory systolic, diastolic, and pulse pressure in essential hypertension. Circulation. 2001;104:783–789.
22. Peralta CA, McClure LA, Scherzer R, et al. Effect of Intensive Versus Usual Blood Pressure Control on Kidney Function Among Individuals With Prior Lacunar Stroke: a Post Hoc Analysis of the Secondary Prevention of Small Subcortical Strokes (SPS3) Randomized Trial. Circulation. 2016;133:584–591.
23. Miura K, Nakagawa H, Ohashi Y, et al. Four blood pressure indexes and the risk of stroke and myocardial infarction in Japanese men and women: a meta-analysis of 16 cohort studies. Circulation. 2009;119.
24. Sesso HD, Stampfer MJ, Rosner B, et al. Systolic and diastolic blood pressure, pulse pressure, and mean arterial pressure as predictors of cardiovascular disease risk in Men. Hypertension. 2000;36:801–807.
25. Rasmussen M, Schonenberger S, Henden PL, et al. Blood Pressure Thresholds and Neurologic Outcomes After Endovascular Therapy for Acute Ischemic Stroke: an Analysis of Individual Patient Data From 3 Randomized Clinical Trials. JAMA Neurol. 2020;77:622–631.
26. Myers R, Brauer M, Dummer T, et al. High-Ambient Air Pollution Exposure Among Never Smokers Versus Ever Smokers With Lung Cancer. J Thorac Oncol. 2021;16:425.
27. Zhang Y, Pletcher MJ, Vittinghoff E, et al. Association Between Cumulative Low-Density Lipoprotein Cholesterol Exposure During Young Adulthood and Middle Age and Risk of Cardiovascular Events. JAMA Cardiol. 2021;6:1406–1413.
28. Chao BH, Yan F, Hua Y, et al. Stroke prevention and control system in China: CSPPC-Stroke Program. Int J Stroke. 2021;16:265–272.
29. Chao BH, Tu WJ, Wang LD, et al. Initial establishment of a stroke management model in China: 10 years (2011-2020) of Stroke Prevention Project Committee, National Health Commission. Chin Med J. 2021;134:2418–2420.
30. Duchnowski P, Hryniewiecki T, Kusmierczyk M, et al. Red cell distribution width is a prognostic marker of perioperative stroke in patients undergoing cardiac valve surgery. Interact Cardiovasc Thorac Surg. 2017;25:925–929.
31. Duchnowski P, Szymański P, Kuśmierczyk M, et al. Usefulness of FRAIL Scale in Heart Valve Diseases. Clin Interv Aging. 2020;15:1071–1075.
32. Bonkhoff AK, Schirmer MD, Bretzner M, et al. Outcome after acute ischemic stroke is linked to sex-specific lesion patterns. Nat Commun. 2021;12:3289.
33. Howard VJ, Madsen TE, Kleindorfer DO, et al. Sex and Race Differences in the Association of Incident Ischemic Stroke With Risk Factors. JAMA Neurol. 2019;76:179–186.
34. Miao CY, Xie HH, Zhan LS, et al. Blood pressure variability is more important than blood pressure level in determination of end-organ damage in rats. J Hypertens. 2006;24:1125–1135.
35. Kario K. Systemic Hemodynamic Atherothrombotic Syndrome and Resonance Hypothesis of Blood Pressure Variability: triggering Cardiovascular Events. Korean Circ J. 2016;46:456–467.
36. Sander D, Kukla C, Klingelhöfer J, et al. Relationship between circadian blood pressure patterns and progression of early carotid atherosclerosis: a 3-year follow-up study. Circulation. 2000;102:1536–1541.
37. Mancia G, Parati G, Castiglioni P, et al. Daily life blood pressure changes are steeper in hypertensive than in normotensive subjects. Hypertension. 2003;42:277–282.
38. Shin SH, Jang JH, Baek YS, et al. Relation of blood pressure variability to left ventricular function and arterial stiffness in hypertensive patients. Singapore Med J. 2019;60:427–431.
 © 2022 The Author(s). This work is published and licensed by Dove Medical Press Limited. The full terms of this license are available at https://www.dovepress.com/terms.php and incorporate the Creative Commons Attribution - Non Commercial (unported, v3.0) License.
By accessing the work you hereby accept the Terms. Non-commercial uses of the work are permitted without any further permission from Dove Medical Press Limited, provided the work is properly attributed. For permission for commercial use of this work, please see paragraphs 4.2 and 5 of our Terms.
© 2022 The Author(s). This work is published and licensed by Dove Medical Press Limited. The full terms of this license are available at https://www.dovepress.com/terms.php and incorporate the Creative Commons Attribution - Non Commercial (unported, v3.0) License.
By accessing the work you hereby accept the Terms. Non-commercial uses of the work are permitted without any further permission from Dove Medical Press Limited, provided the work is properly attributed. For permission for commercial use of this work, please see paragraphs 4.2 and 5 of our Terms.