")
Back to Journals » Clinical Ophthalmology » Volume 15
The Role of Corneal Biomechanics in the Assessment of Ectasia Susceptibility Before Laser Vision Correction
Authors Baptista PM , Marta AA , Marques JH , Abreu AC , Monteiro S , Menéres P , Pinto MDC
Received 10 December 2020
Accepted for publication 20 January 2021
Published 19 February 2021 Volume 2021:15 Pages 745—758
DOI https://doi.org/10.2147/OPTH.S296744
Checked for plagiarism Yes
Review by Single anonymous peer review
Peer reviewer comments 3
Editor who approved publication: Dr Scott Fraser
Pedro Manuel Baptista,1,2 Ana Ambrósio Marta,1 João Heitor Marques,1 Ana Carolina Abreu,1 Sílvia Monteiro,1 Pedro Menéres,1,2 Maria do Céu Pinto1
1Ophthalmology Department, Centro Hospitalar Universitário do Porto, Porto, Portugal; 2Instituto de Ciências Biomédicas Abel Salazar, Porto, Portugal
Correspondence: Pedro Manuel Baptista
Centro Hospitalar Universitário do Porto, Largo Prof. Abel Salazar, Porto, 4099-001, Portugal
Tel + 35-1917868372
Email [email protected]
Purpose: To describe the tomographic and corneal biomechanical status of a sample of eyes excluded from LVC and to present the differences in biomechanical behavior in relation to cutoffs of clinical- and tomography-based screening methods used in clinical practice.
Patients and Methods: Observational cross-sectional study including 61 eyes from 32 consecutive patients who were excluded from LVC in our department. Clinical and demographic data were collected from the patients’ clinical records. Tomographic data was assessed with a Scheimpflug camera (Pentacam, OCULUS®). Ablation depth (μm) and residual stromal bed (μm) were calculated by the WaveLight® EX500 laser system software (Alcon, EUA). The corneal biomechanical assessment was made through ultra-high speed Scheimpflug imaging during noncontact tonometry (Corvis ST, OCULUS®). Several ectasia risk scores were analyzed.
Results: Mean age was 31.0± 6 years old and mean manifest spherical equivalent was − 2.01 ± 2.3D. Belin–Ambrósio deviation index was the tomographic parameter with higher proportion of eyes within the ectasia high risk interval. In the biomechanical assessment, more than 95% of eyes met the criteria for ectasia susceptibility in four of the first generation and in two of the second generation parameters. In a cutoff based comparative analysis, eyes with Kmax ≥ 45.5 D, eyes with VCOMA < 0 and eyes with ARTmax ≤ 350 presented significantly softer corneal biomechanical behavior.
Conclusion: The majority of eyes excluded from LVC in the present study met the criteria for ectasia susceptibility in several biomechanical parameters, validating the clinical and tomographic based screening prior to LVC in our center. Differences found in the biomechanical assessment regarding cutoffs used in clinical practice highlight its differential role in characterizing risk profile of these patients. Tomography should not be overlooked and the integration of all data, including treatment-related parameters, can be the future of risk ectasia screening prior LVC.
Keywords: keratorefractive surgery, ectasia, ultra-high speed Scheimpflug camera, Corvis, tomography, corneal biomechanics
Introduction
Corneal ectasia after corneal laser vision correction (LVC) procedures is rare,1 but it may have devastating consequences in previously healthy eyes of young and active patients. Its actual incidence is decreasing,2 due to the evolution of both laser-associated technology and the advances in preoperative risk assessment.
Eyes with mild or subclinical forms of corneal ectatic diseases are at higher risk of developing iatrogenic progressive ectasia, after LVC.3 The integration of tomography along with the biomechanical status of the cornea, and the structural impact from the surgical procedure itself and after surgery are currently the main predictors of biomechanical decompensation leading to ectasia progression after LVC.4
After the ectasia risk score system (ERSS) validation, back in 2008, including the residual stromal bed (RSB) concept,5 the study of the structural impact resulting from the procedure has evolved and the percent tissue altered (PTA) became the main parameter associated with an increased risk.6,7 In 2018, after a review of more than 30,000 laser-assisted in situ keratomileusis (LASIK) cases, Bohac et al,8 concluded that, although the aforementioned widely established risk factors were the most prevalent in cases of corneal ectasia after LASIK, a greater accuracy, higher sensitivity and specificity were still needed, since ectasia has also been reported in cases without any of those factors.
As proposed by Roberts and Dupps,9 a focal reduction in corneal elastic modulus precipitates a cycle of biomechanical decompensation, hence running a biomechanical assessment has been expected to enhance the overall accuracy in the identification of mild forms of ectatic corneal disease.10 The Corvis ST® (OCULUS, Wetzlar, Germany), is a noncontact tonometer system with a collimated air pulse offering a consistent pressure profile that acquires 4300 frames/s using an ultra high-speed Scheimpflug camera with ultraviolet-free 455 nm blue light, covering 8.5 mm horizontally of a single slit to allow evaluation of corneal deformation.11
While the original set of parameters to assess corneal deformation had a relatively poor performance in distinguishing healthy and keratoconic (KC) eyes, in 2014, a new parameter was developed based on logistic regression analysis, combining deformation response parameters with corneal thickness profile—the Corvis biomechanical index (CBI).12 However, to address ectasia risk there was a need to go further and Ambrósio Jr et al4 combined data from corneal deformation response, including CBI, with tomographic data, through artificial intelligence and developed a more accurate index, the new tomographic and biomechanical index (TBI).
This study aims to describe the tomographic and corneal biomechanical status of a sample of eyes excluded from LVC and to present the differences in biomechanical behavior in relation to cutoffs of clinical- and tomography-based screening methods used in clinical practice.
Patients and Methods
Design
Observational cross-sectional study. The study protocol adhered to the tenets of the Declaration of Helsinki. Approval was obtained from the “Departamento de Ensino, Formação e Investigação” (DEFI), no: 130-DEFI-132-CE. The informed consent from the patients was waived by the DEFI due to total anonymization and confidentiality of the data and the absence of detailed individual data.
Population
This study included 61 eyes from 32 consecutive patients who were excluded from LVC. Each eye was evaluated regarding the following criteria of high risk for corneal ectasia and the exclusion decision was made by an experienced refractive surgeon after a subjective integration of all:
- ERSS (≥4) including the RSB (<300 µm) assessment
- Tomographic data:
- Corneal thickness at the thinnest point (TPCT; <500 µm);
- Maximum anterior keratometry (Kmax; ≥45.5 D);
- Maximum Ambrósio relational thickness (ARTmax; ≤350);
- Wavefront-based comatic aberration Zernike coefficient in the 90° meridian (VCOMA; <0 RMS);
- Index of height decentration (IHD; ≥0.010);
- Belin–Ambrósio deviation index (BAD-D; ≥1.6);
- Score of the brain cornea ectasia risk calculator for photorefractive keratectomy (BCRCprk; ≥8) or for LASIK (BCRClasik; ≥8);
- PTA (≥40%)
Setting
Centro Hospitalar e Universitário do Porto, Porto, Portugal.
Data Gathering
Data were collected from the patients’ clinical records regarding age, gender, distance best corrected visual acuity (BCVA, Snellen, converted to decimal) and manifest refraction spherical equivalent (MRSE, diopters).
Tomographic data was assessed with a Scheimpflug camera-based technology (Pentacam, OCULUS®) and recorded regarding pupil diameter (PD, mm), topographic pattern (Topo), anterior keratometric data (K1, K2 and Kmax from the sagittal curvature map), central corneal thickness (CCT, µm), TPCT, IHD, ARTmax, VCOMA (Z3–1 calculated for a pupil diameter of 6.0 mm) and BAD-D.
Ablation depth (AD, µm) and RSB (µm) were calculated by the WaveLight® EX500 laser system software (Alcon, EUA) according to the Munnerlyn Formula, including data from the anterior keratometry, dioptric correction, the optic zone width choose in each case by the surgeon (usually 6.5 mm) and a flap thickness (FT) of 120 µm.
Several ectasia risk scores were analyzed: the ERSS (including age, MRSE, CCT, RSB and Topo); the BCRCprk and BCRClasik (including age, TPCT, AD, IHD and BAD-D); the PTA (%) [(FT+AD)/CCT].
Corneal Biomechanics Assessment
The analysis was made through the DCR parameters of the ultra high-speed Scheimpflug camera-based analysis during noncontact tonometry (Corvis ST, OCULUS®). Only exams with “OK” quality score were included. Parameters from the three major timepoints were recorded: time from the initiation of air puff until the first applanation (A1T), second applanation (A2T) and highest concavity (HCT). Additional first-generation parameters from the maximum deformation on the oscillatory phase (Max) and from whole eye movement (WEM) were analyzed, along with the biomechanically corrected IOP (bIOP, mmHg) and the composed second-generation parameters including stiffness parameter in A1 (SP-A1), stress strain index (SS-I), CBI and TBI. Pachymetry assessment through the Corvis-derived central corneal thickness (cCCT, µm) was made. Figure 1 represents an example of a printout showing the corneal shape within different timepoints and several biomechanical parameters. All the Corvis-derived parameters used in the study and its explanation are summarized in Table 1.
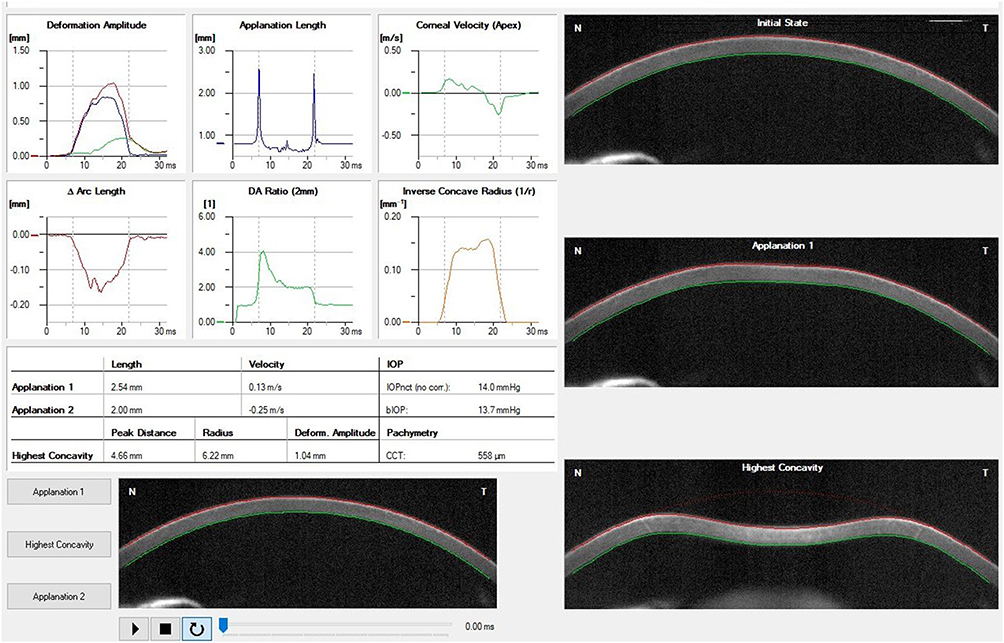 |
Figure 1 Example of a printout from the Corvis ST® describing the corneal shape within different timepoints and several biomechanical parameters. |
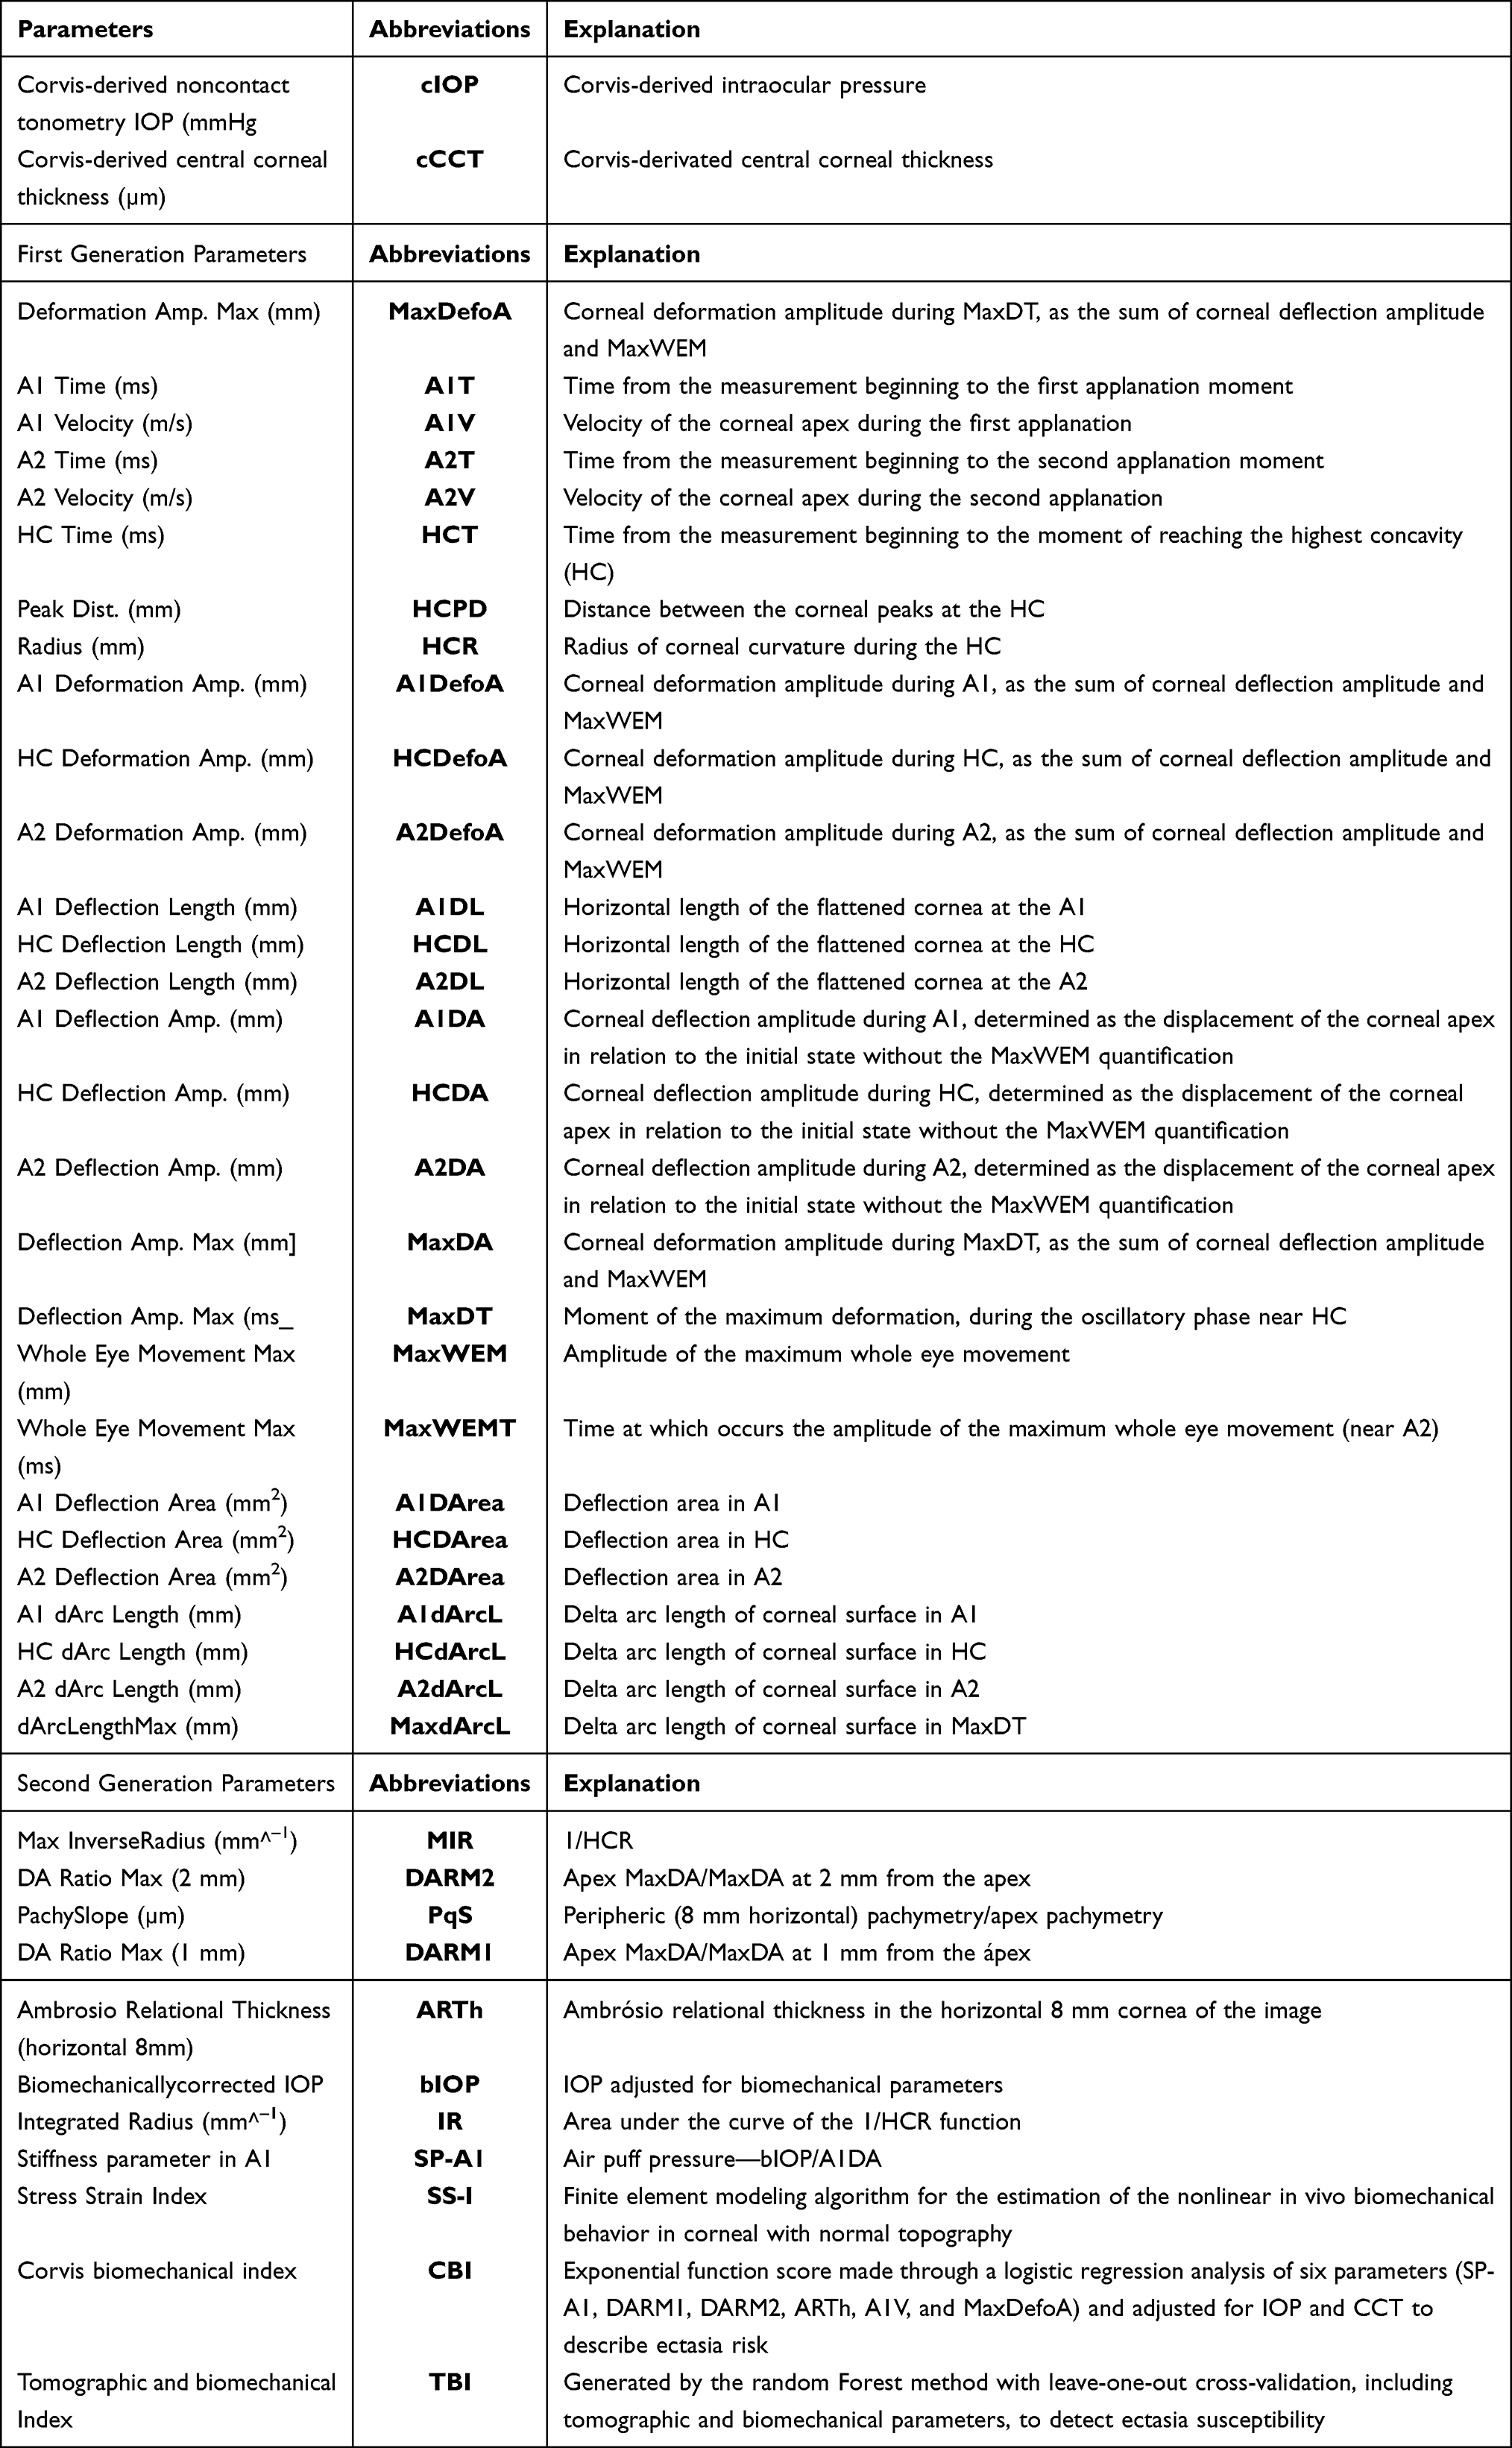 |
Table 1 Scheimpflug Camera-Based Corneal Biomechanical Parameters with Explanation |
Stepwise Data Analysis
A stepwise analysis through three steps was carried out in the present study.
- First step: general description of the sample regarding clinical and tomographic assessment and analysis of the different scores/indices evaluated. For the parameters with the aforementioned defined criteria of high-risk for corneal ectasia, a calculation of the proportion of eyes within the ectasia high-risk category was made. (Table 2)
- Second step: general description of the corneal biomechanical behavior in all samples. For the parameters with reported criteria of corneal ectasia susceptibility (or subclinical disease),4,12,13 a calculation of the proportion of eyes within this category was made.
- Third step: direct comparison of corneal biomechanical behavior between groups divided independently according to the criteria of high-risk for corneal ectasia used in our department to exclude eyes from LVC. Comparisons were not made regarding BAD-D, RSB, PTA and BCRCprk, as there was not sufficient numbers within both groups to do a reliable statistical analysis when divided by the cutoffs chosen (1.6 for the BAD-D, 300 µm for the RSB, 40% for the PTA and eight for the BCRCprk).
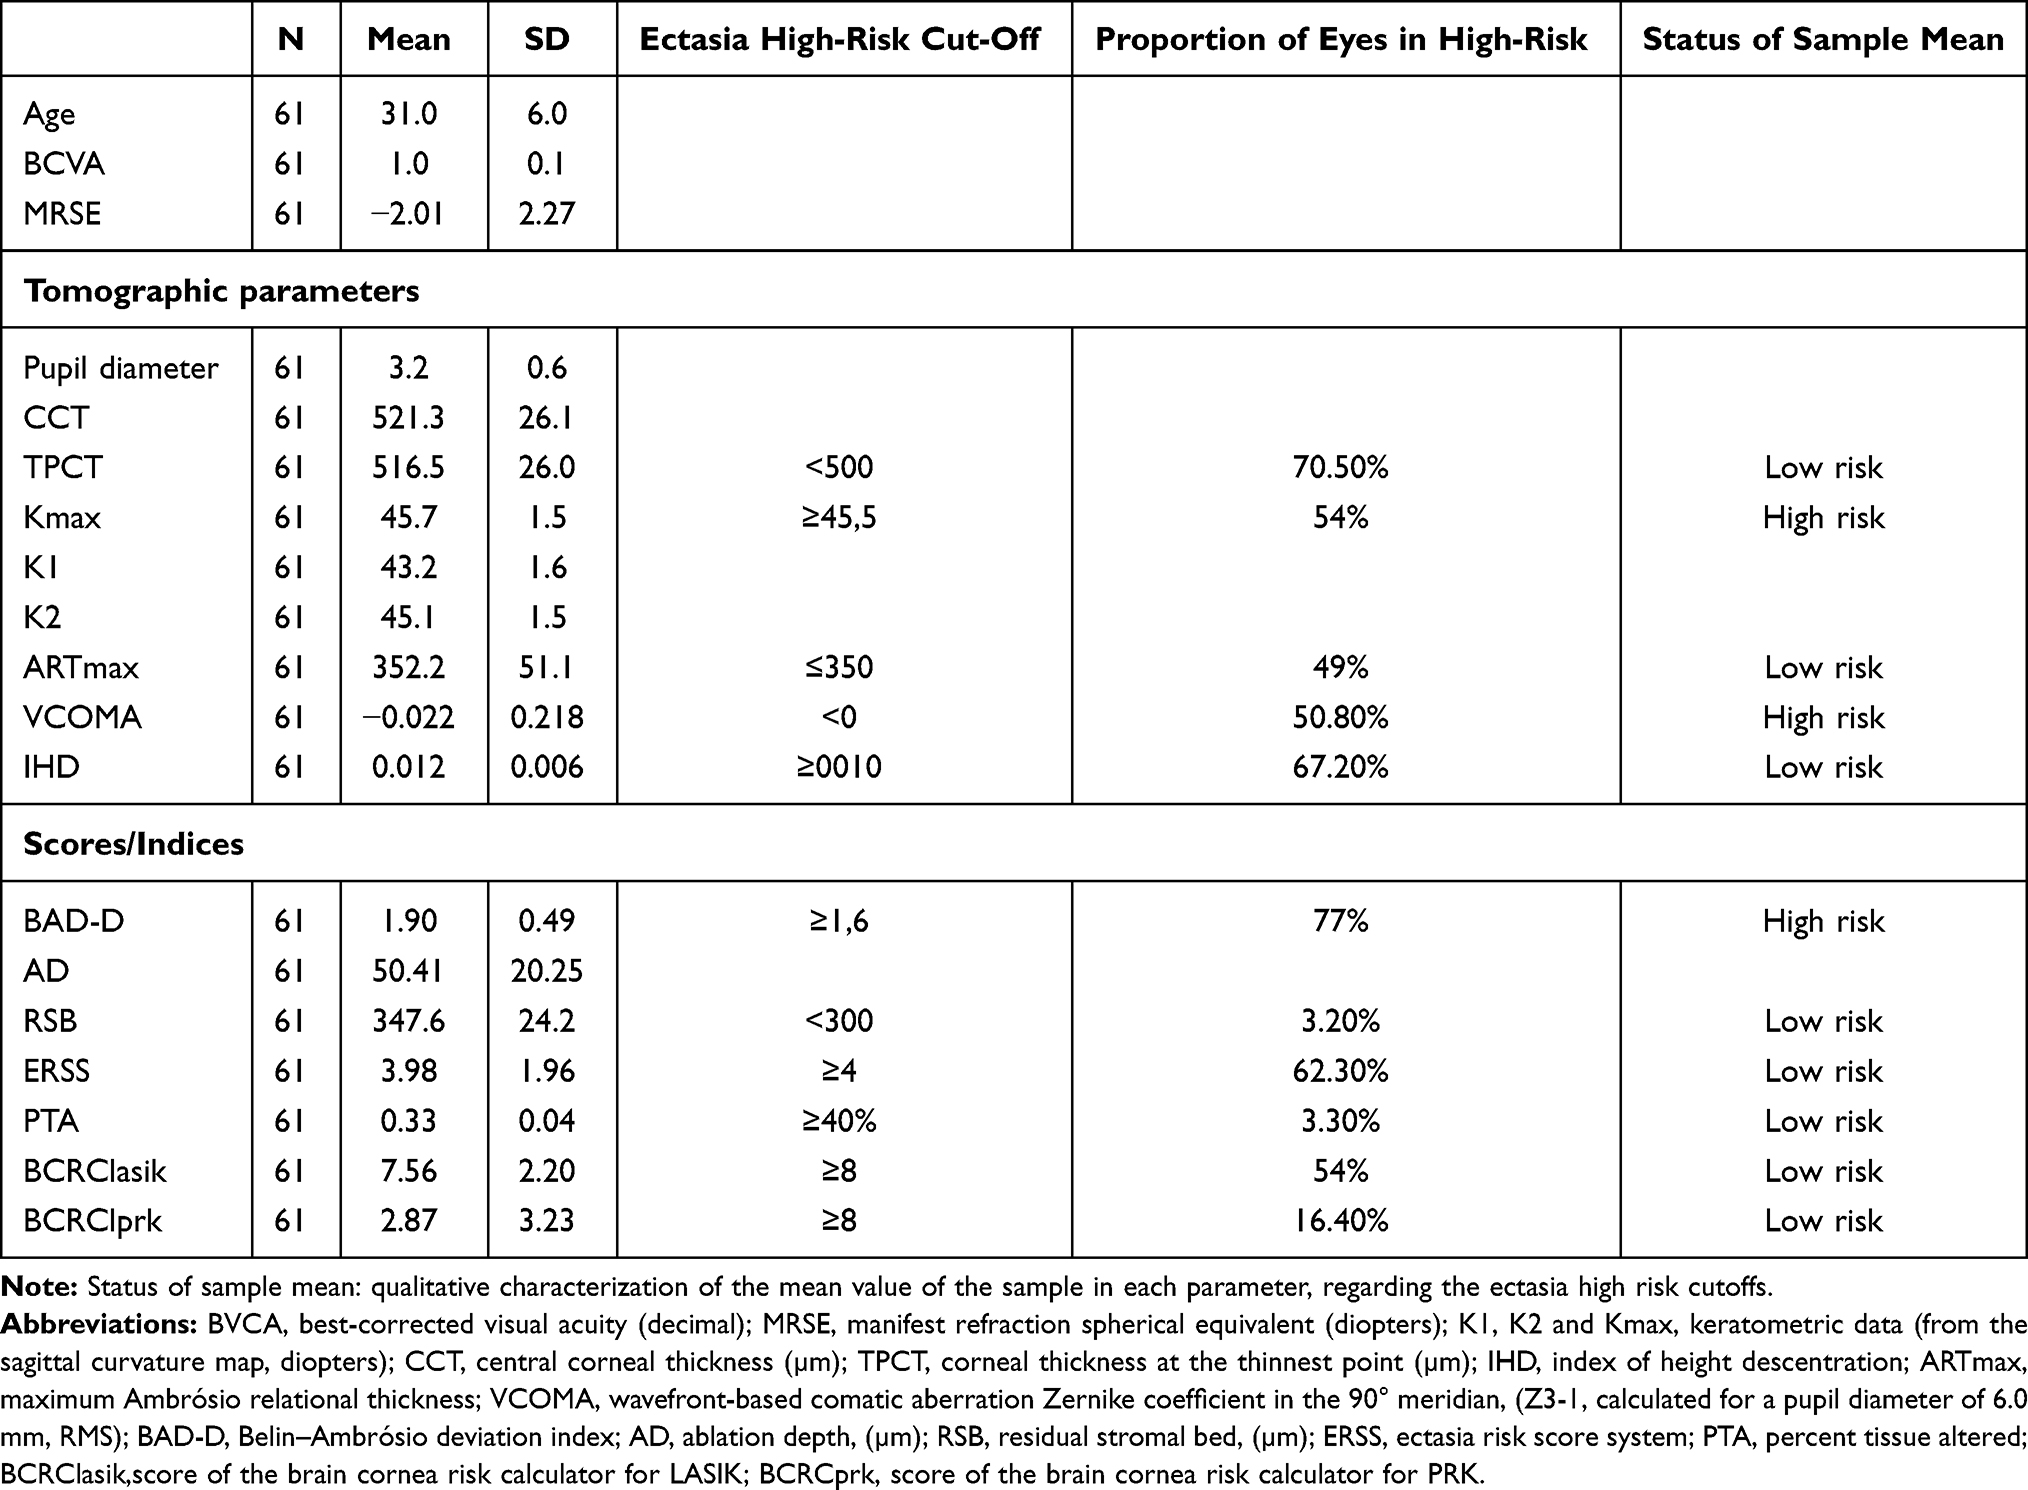 |
Table 2 Clinical, Demographic, Tomographic and Score/Indices Analysis, All Samples |
Statistical Analysis
Statistical analysis was performed with the SPSS, version 24.0 (IBM Corporation, Armonk, NY, USA). Normality of the data was tested with the Shapiro–Wilk test. When parametric analysis could be applied, the Student’s t-test was used to compare groups. When nonparametric tests were needed, the Wilcoxon rank-sum test was applied. Correlations were studied with Spearman rank correlation method. Values are show as mean ±standard deviation unless otherwise specified. All p-values were two-sided, and p-values <0.05 were considered significant.
Results
First Step
Mean age was 31.0 ± 6 years old and mean MRSE was −2.01 ± 2.3D. Although the normal mean CCT (521.3 ± 26.1 µm) found, the present sample showed, in average, a borderline value in the ARTmax (352.2 ± 51) and a BAD-D (1.9 ± 0.5) within the high risk for ectasia category (Table 2).
With an average AD of 50.41 ± 20.3, the sample presented with a mean RSB of 347.6 ± 24.2 µm. Average borderline values in the ERSS (3.98 ± 2.0) but within the low risk range in the PTA (33 ± 0.04%) were found. Although the mean values of the BCRCprk in the BCRClasik were 2.87 ± 3.2 and 7.56 ± 2.2, respectively, both out of respective high-risk ranges, the proportion of eyes in high-risk were higher in the BCRClasik (54% vs 16.4%) (Table 2).
Second Step
Regarding the corneal biomechanical assessment, mean values of 516 ± 30 in the cCCT, 0.60 ± 0.2 in the CBI and 0.49 ± 0.2 in the TBI were found. From the first generation parameters, more than 95% of eyes met the criteria for ectasia susceptibility in the A2V, HCR, A1DL and A2DL. From the second generation parameters, the ones with higher proportion of eyes meeting the aforementioned criteria were the DARM1, CBI and TBI. Both basic (first generation) and composed (second generation) biomechanical parameters are described in Table 3. None of the biomechanical parameters was associated with age (p<0.05 in all)
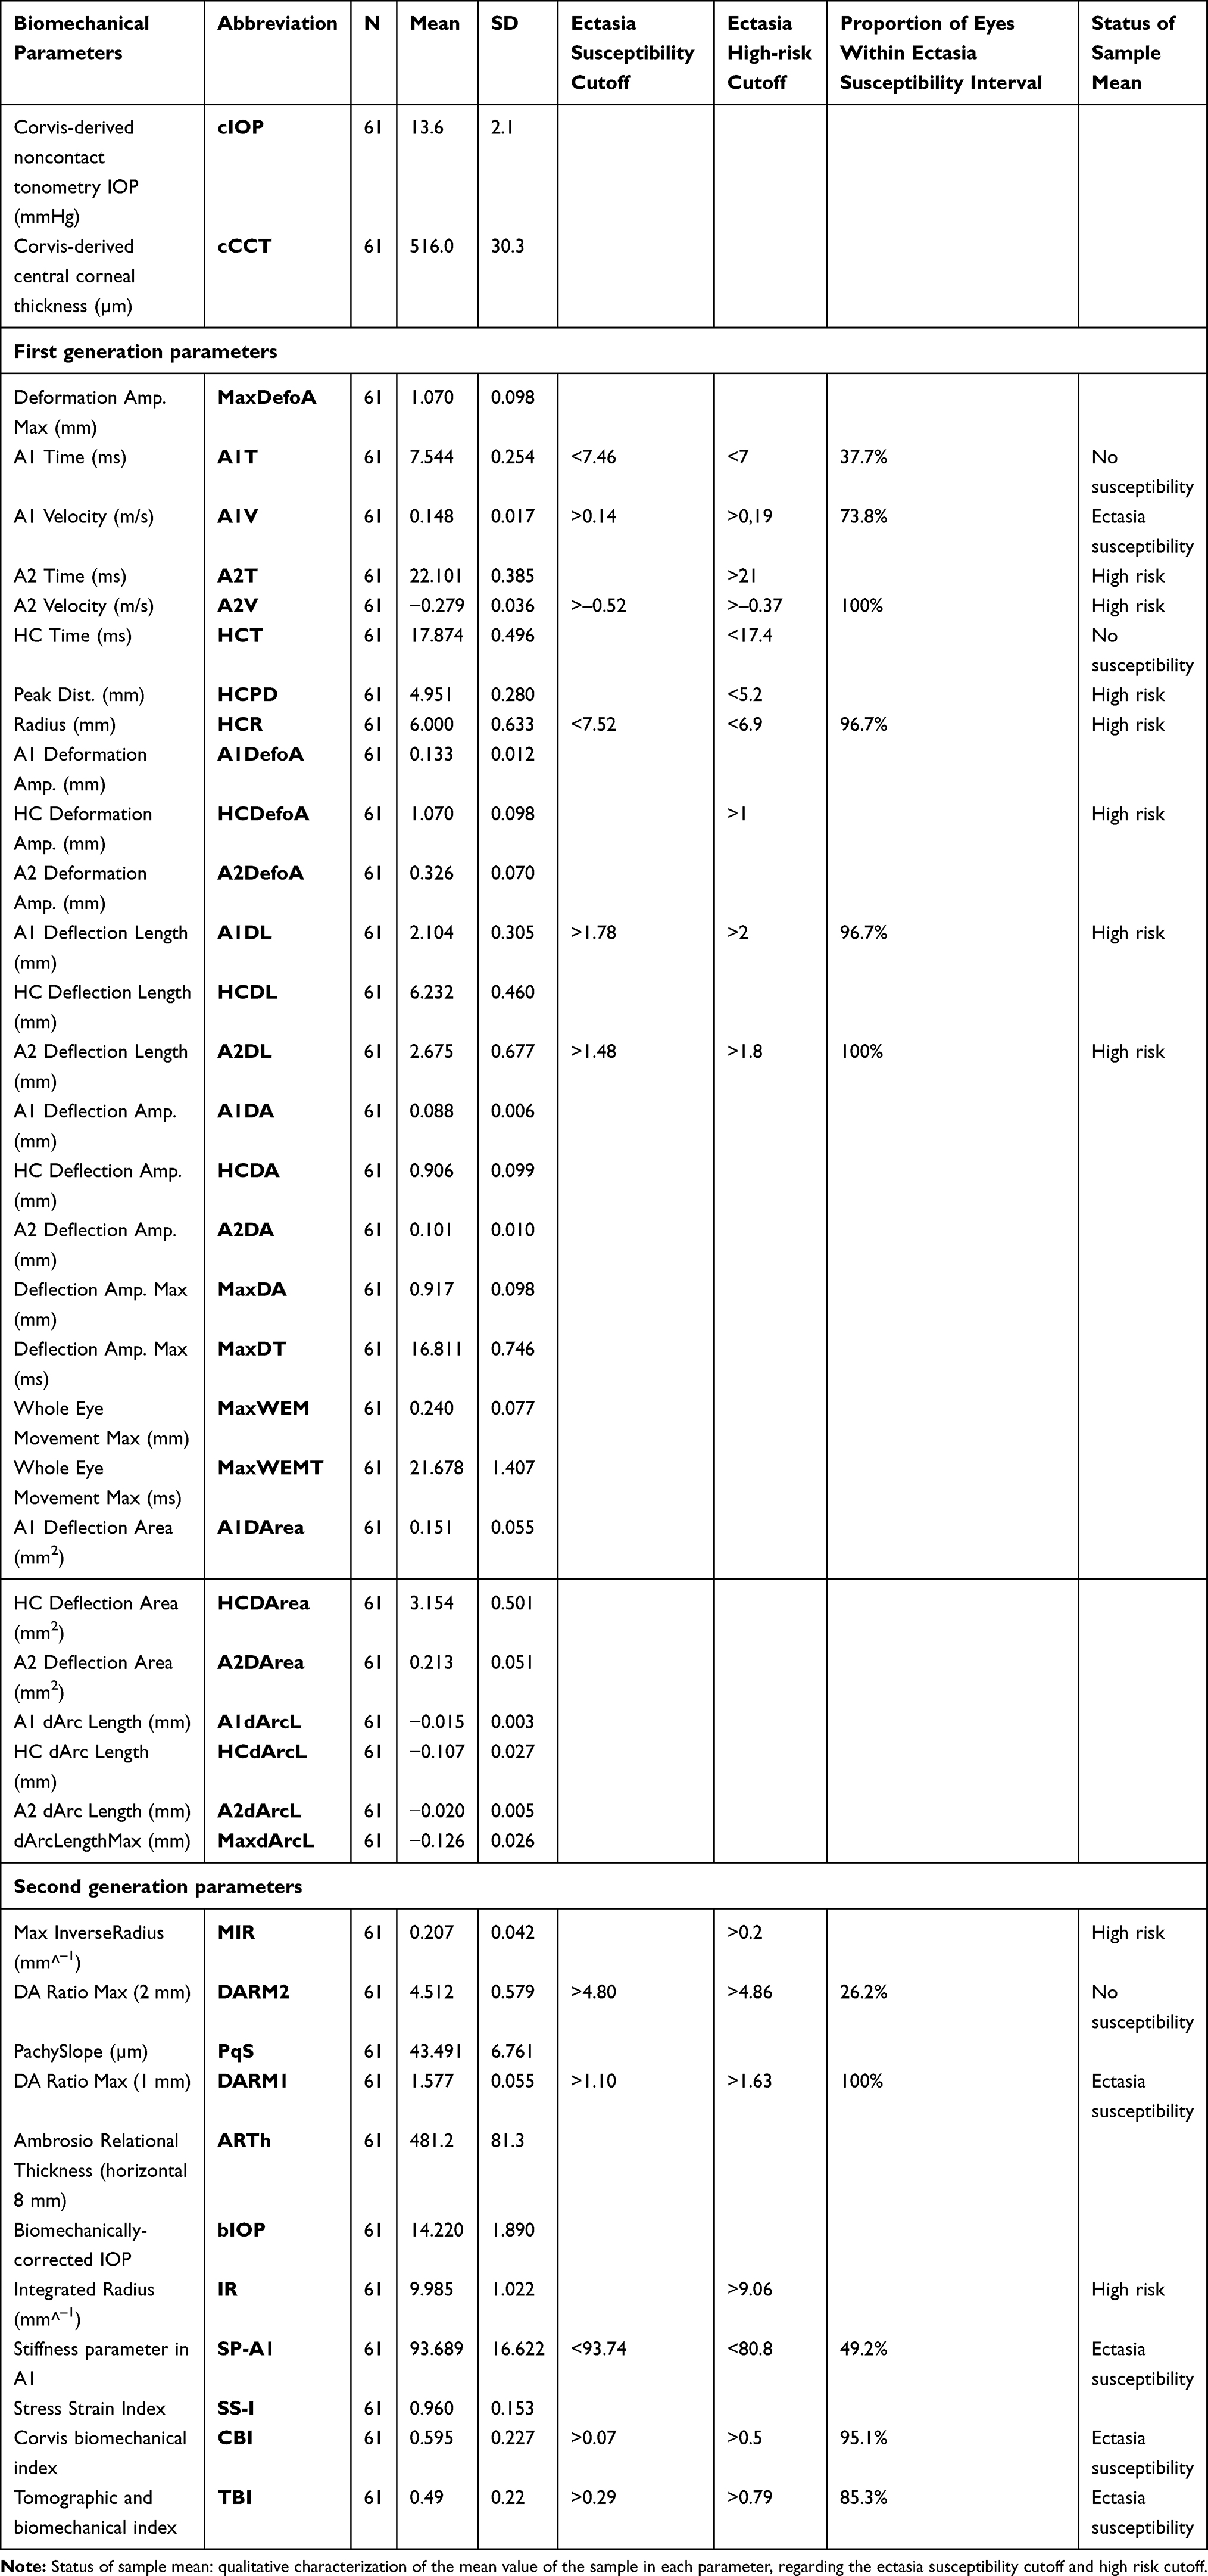 |
Table 3 Biomechanical Parameters Analysis, All Samples |
Third Step
In the comparative analysis of corneal biomechanical behavior between groups, significant differences were found in several biomechanical parameters regarding both tomographic (Table 4) and scores/indices (Table 5) data.
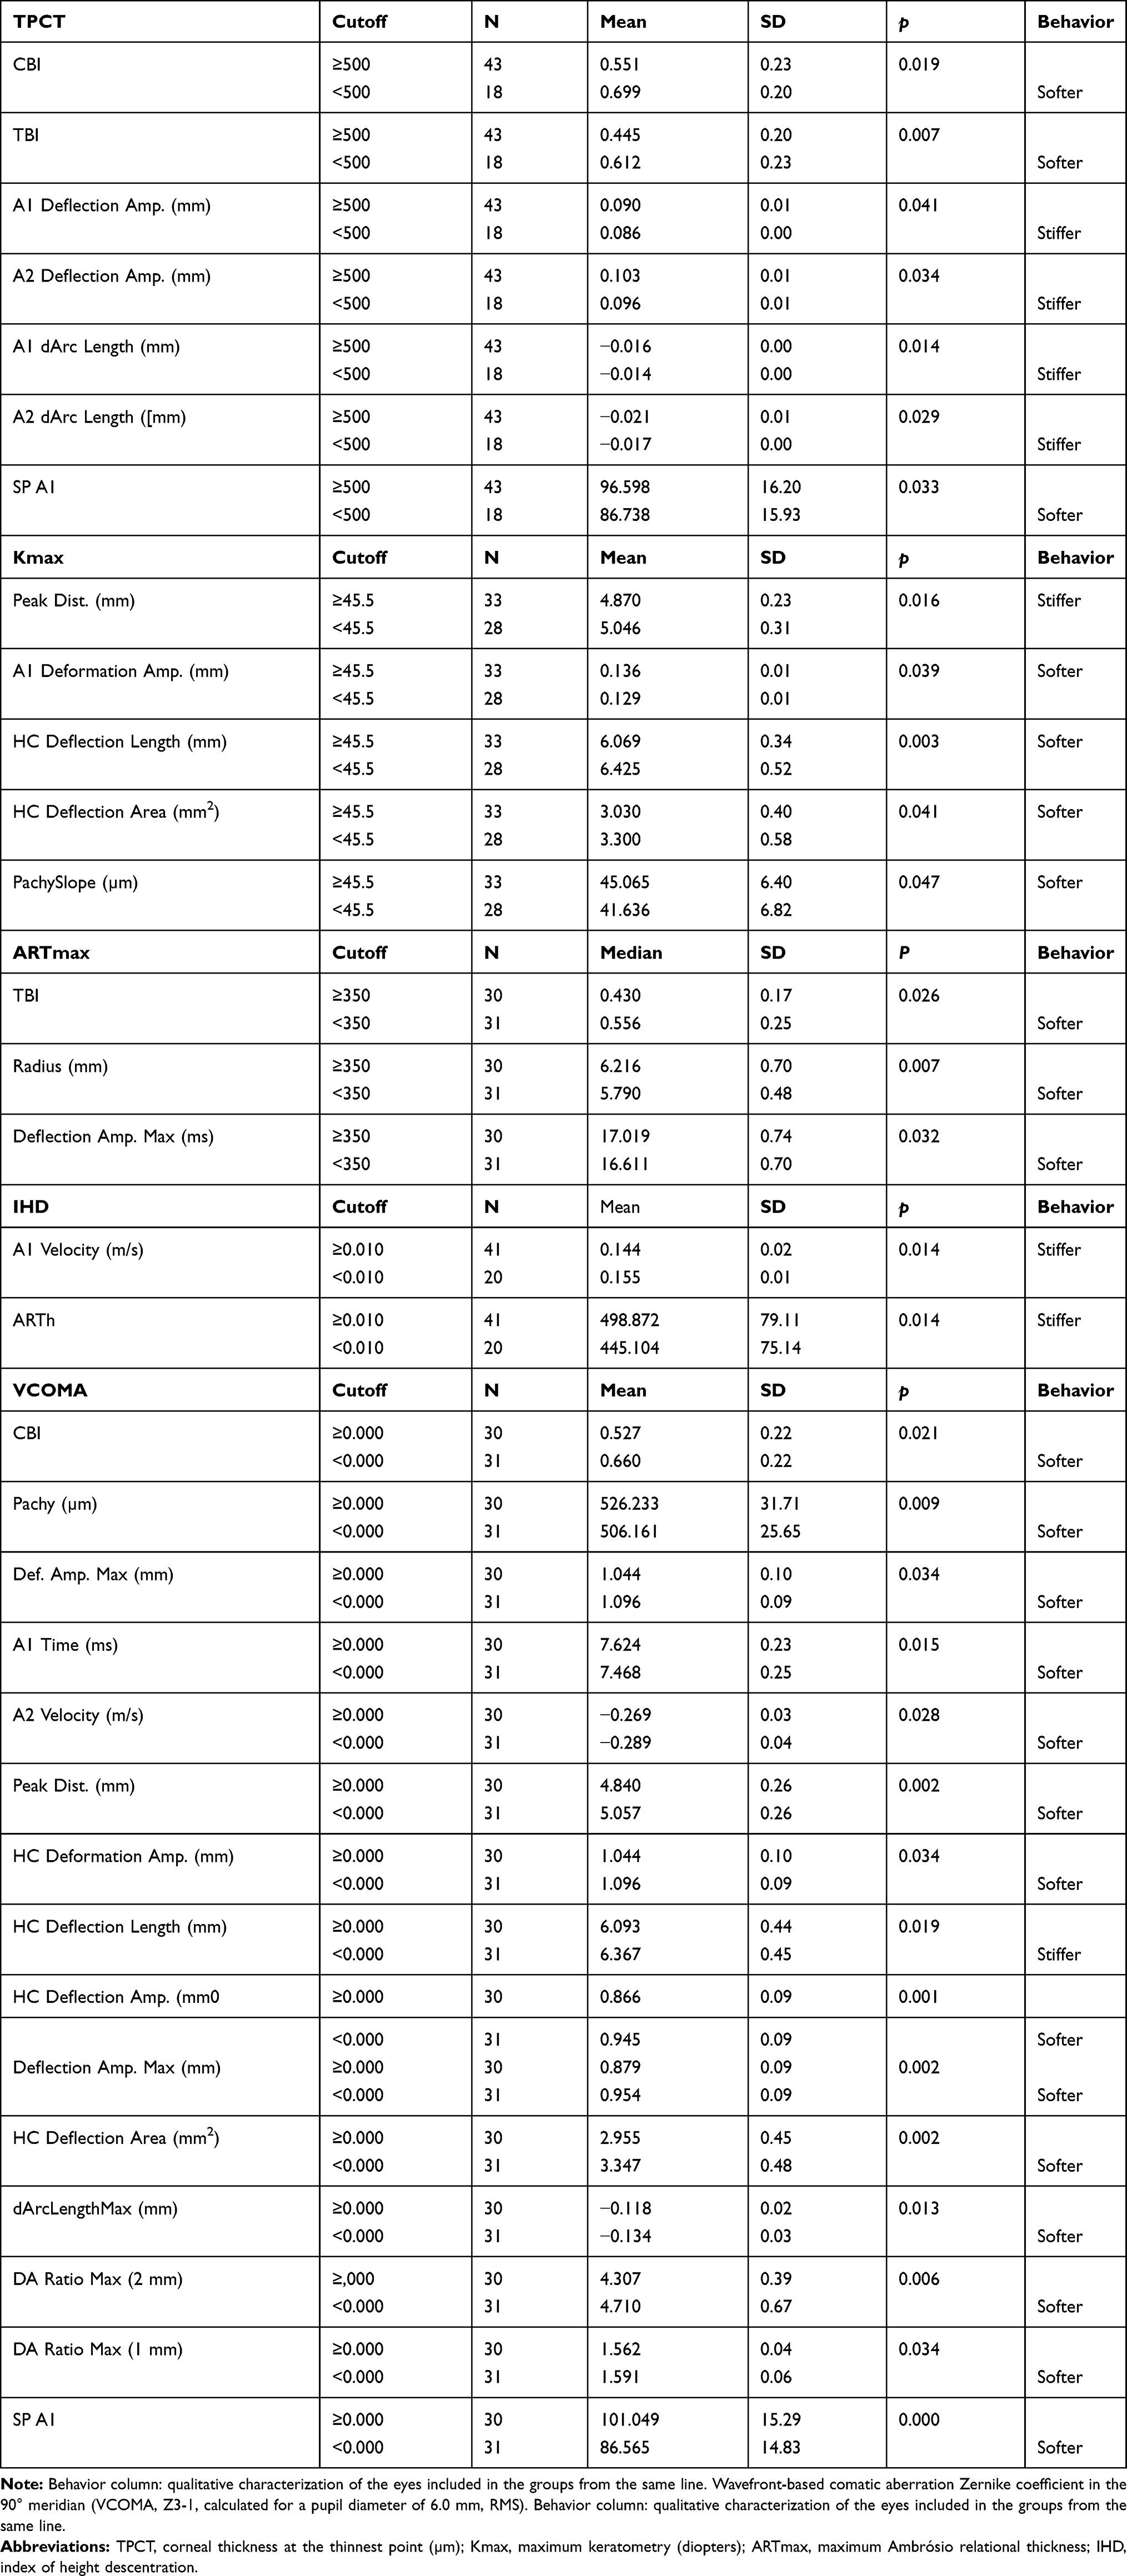 |
Table 4 Comparison of Corneal Biomechanical Parameters Between Groups Divided According Clinically Relevant Selected Cutoffs (Tomographic) |
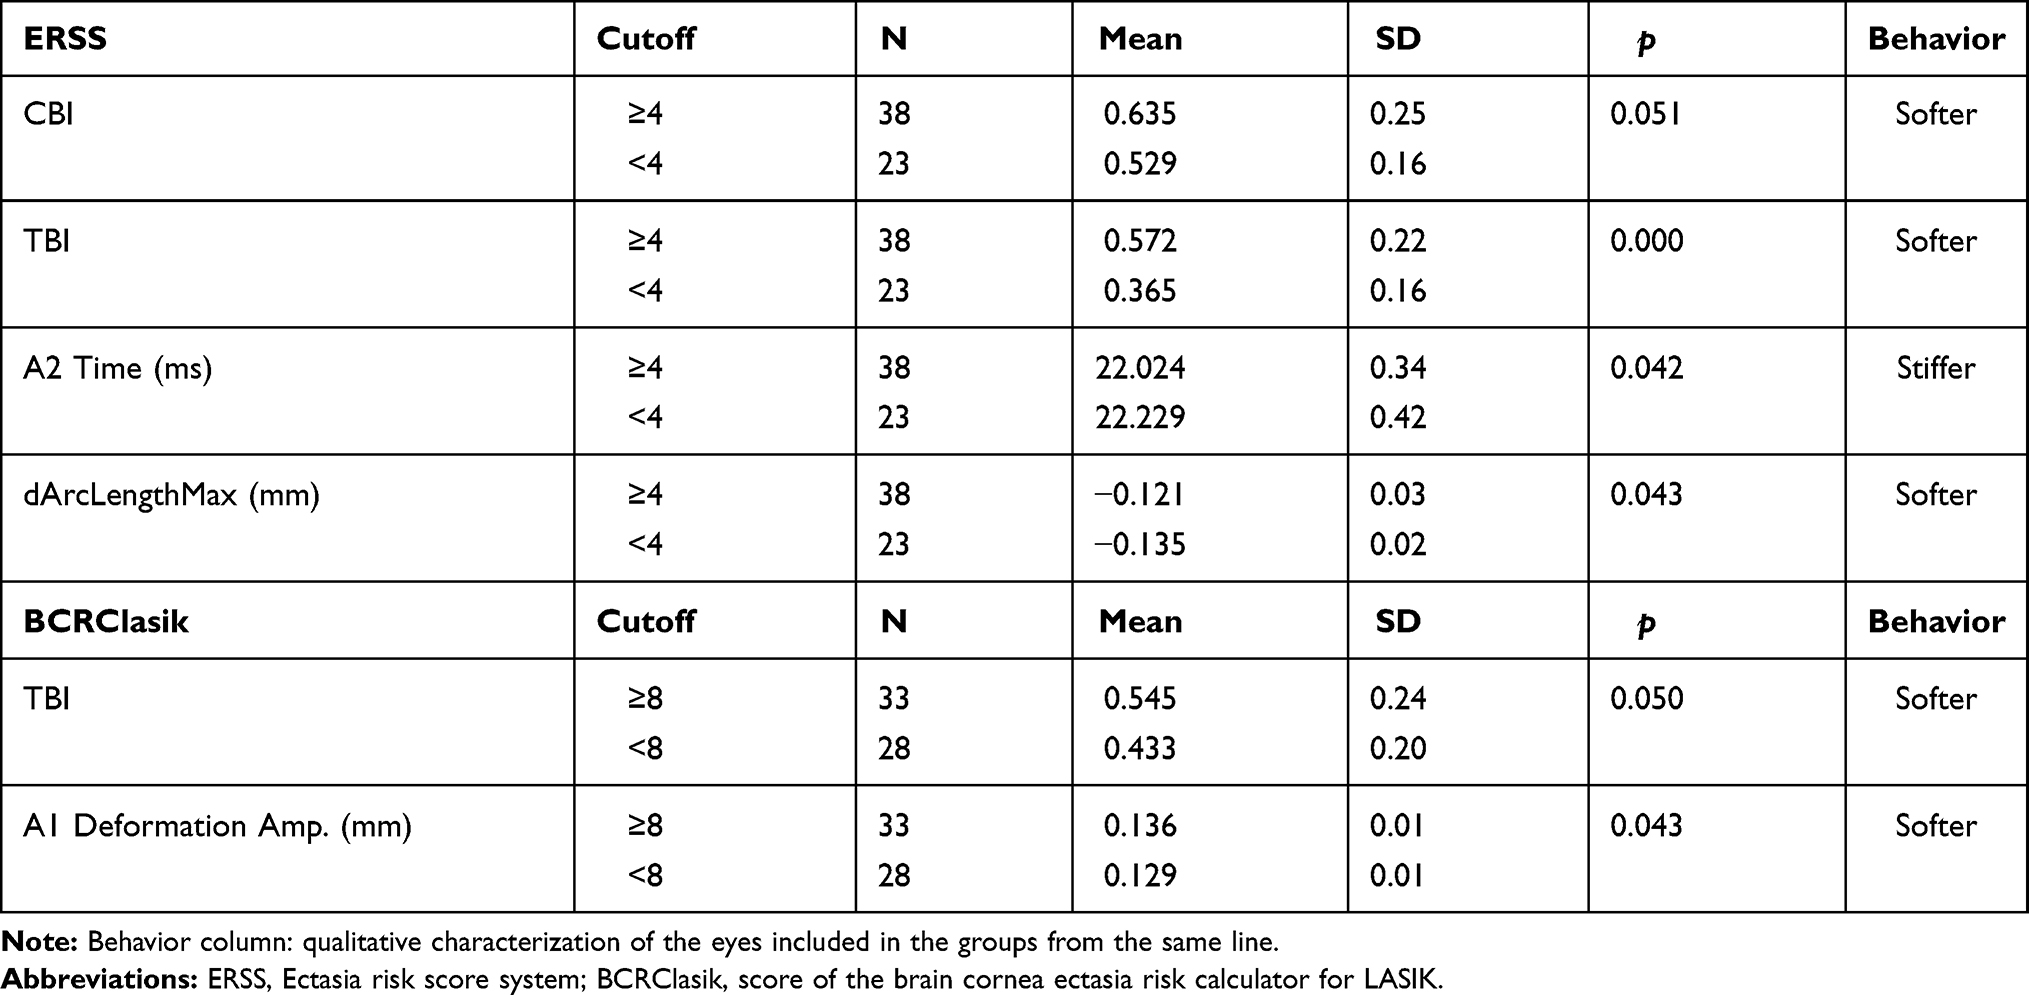 |
Table 5 Comparison of Corneal Biomechanical Parameters Between Groups Divided According Clinically Relevant Selected Cutoffs (Scores) |
Eyes with TPCT ≤500 showed, in general, biomechanical behavior compatible with softer corneas when analyzed the second generation parameters but the opposite behavior when analyzed the first generation deflection parameters and dArc lengths in A1 and A2. Eyes with Kmax ≥45.5 D showed, in general, biomechanical behavior compatible with softer corneas, in A1 and HC timepoints, except for the PDHC. Eyes with IHD ≥0.010 showed biomechanical behavior compatible with stiffer corneas. Eyes with VCOMA <0 showed biomechanical behavior compatible with softer corneas in many parameters at the four timepoints A1, HC, Max and A2. Eyes with ARTmax ≤350 showed biomechanical behavior compatible with softer corneas. Eyes with ERSS ≥4 showed higher TBI and a trend to higher CBI (p=0.051) and eyes with BCRClasik ≥8 showed a trend to higher TBI values (p=0.050).
Discussion
The presurgical ectasia risk assessment before LVC is predominantly based on three spheres: the characteristics of the corneal tissue, which is prone to suffer changes after years of potential, environmental aggressions; treatment-related factors (type of treatment, flap thickness and the amount of refractive error to be corrected); and the intrinsic characteristics of the patient (age, profile and lifestyle). Although knowing the second and third ones at a given point, the first is usually an iceberg which we do not know how it will behave in the years after potential environmental aggressions.
The ERSS was validated before the advent of corneal tomography, thus settling in a very poor first sphere; however, it encompasses the two other spheres. One of the parameters involved was the RSB which was for a long time the main treatment-related metric used, but was more recently outdated by the PTA concept from Giri et al.14 The emergence of tomographic and aberrometry assessments gave rise to a noteworthy amount of new quantitative information, most of which was studied within the ectasia risk setting.15,16 One of the most complete and powerful tomographic indices is the BAD-D, which includes data from pachymetry at the thinnest point and its progression and elevation maps with the associated best fit sphere concept.17 However, also due to the lack of some aforementioned important information, other than tomographic, the corneal tomography and biomechanics study group (BRAIN, Rio de Janeiro, Brazil) created calculators (BCRCprk in the BCRClasik) which combine tomographic data with treatment-related data, including age as a biomechanical surrogate. The main advantage of these scores is the quantifiable and user-friendly information given, related to the two most performed LVC techniques. Our sample illustrates this, as the ratio of eyes within the high-risk category was expectedly higher when applying the BCRClasik rather than the BCRCprk score.
The ultrahigh-speed Scheimpflug camera-derived basic analysis describes corneal biomechanical behavior at three major timepoints: A1T, HC and A2T. Moreover, it provides information on the maximum deformation at the oscillatory phase (MaxDT) and from WEM, all within nearly a 35 ms interval in which the cornea makes the ingoing/outgoing movements after the air puff.18 In addition, eyes with decreased stiffness were expected to be associated with higher values on the deformation and deflection amplitudes, deflection areas and applanation lengths at all timepoints, lower A1T with higher A1V, but higher A2T with lower absolute A2V, lower MaxDT and higher peak distance (HCPD) and lower radius (HCR) when the cornea is in HCT.19,20 Within the setting of a single-parameter analysis, A1T, A2T and HC-related parameters were the first regarded as being most important. Alternatively, deflection areas were considered less important parameters in this basic analysis.19,20 The WEM concept should be appreciated since the accessory movement occurred beyond the 8 mm-diameter area. It is greatest near the A2T and it is expected to be lower in softer corneas, as more energy is absorbed and converted into movement in the center of these corneas, with little energy spreading to peripheric cornea.19 Besides the evident limitations of single parameters to describe the complex biomechanical behavior, they are affected by IOP—otherwise, none of the air-puff tonometers would work. Nevertheless, large amounts of data from all these parameters started being analyzed through various methods which aimed to develop characterization models of greater consistency, resulting in the second generation parameters and being in constant evolution, nowadays.19 The stiffness parameter A1 (SP-A1), created by the group of Roberts et al,21 was proposed as the most accurate in defining global eye rigidity, including the relation of IOP with both corneal and scleral biomechanical components. Nevertheless, CBI12 appeared as an exponential function score build on a logistic regression analysis of six DCR parameters (SP-A1, DARM1, DARM2, ARTh, A1V and MaxDefoA) and adjusted for IOP and CCT, which showed high sensitivity and specificity for the detection of corneal ectasia for a cutoff of 0.5.12 More recently, the group of Ambrósio et al,4 reported increased accuracy for subclinical ectasia detection with a cutoff value of 0.07. The stress strain index (SS-I) was built by finite element modeling and validated as the newest and most accurate algorithm for the estimation of the nonlinear, in vivo biomechanical behavior in corneas with normal topography.22
Nonetheless, the association of tomography and biomechanics is vital towards the study and comprehensive assessment of ectasia risk. In fact, the TBI had 100% sensitivity and specificity to detect frank ectasia cases with a value >0.79, and after optimization of the cutoff to 0.29, was even able to discriminate subclinical ectasia among eyes with normal topography in very asymmetric patients, with a higher AUROC (0.996) than CBI (0.936) or BAD-D (0.956).4 Further external studies were conducted, and the ability to detect ectatic disease with this new index, even in milder forms, has been validated.23–25 Thus, as advances in the detection of ectasia susceptibility are increasing and becoming more accurate, possibly making it a new entity in the future,26 the authors of this study wanted to highlight the role of its diagnosis as a biomechanical entity in the field of LVC preoperative research.
In the present study, the descriptive statistics of the sample give rise to important reflections. Firstly, we should highlight that our sample mean values were found within the ectasia high-risk range in the Kmax, VCOMA the and BAD-D (Table 2), regarding the tomographic and variables scores/indices analyzed, respectively. Moreover, more than 50% of the eyes where within the high-risk group regarding TPCT, Kmax, VCOMA, IHD, BAD-D, ERSS and BCRClasik. Therefore, besides raising the probability of impaired biomechanical behavior, these results validate the safety of the clinical practice in our department, since these eyes had been excluded from LVC. In contrast, within 17 biomechanical parameters comprising some studied cutoffs for ectasia risk,13 including CBI12 and TBI4 (Table 3), the present sample was, on average, within the ectasia high-risk range in nine parameters, and within the ectasia susceptibility interval in five of them. Nevertheless, within the 11 parameters with reported cutoff value for ectasia susceptibility, the ratio of eyes meeting this criterion was higher than 50% in eight parameters, and higher than 80% in seven. This, in addition to the difference verified between CBI (95.1%) and TBI (85.3%), emphasizes two main ideas: the differential role of corneal biomechanics assessment beyond ectasia risk, toward the diagnosis of ectasia susceptibility and the importance of an integrated index. It is imperative to notice the lack of association between age (ranging from 21 to 44 years old) and any biomechanical parameter in our sample. In fact, recent studies with Corvis27 reported alteration in corneal biomechanics with age, but information in literature is still controversial.28,29 Nevertheless, age is considered a risk factor for corneal ectasia after LVC and was, for many years, integrated in several scores, including the ERSS, BCRCprk and BCRClasik, as a surrogate biomarker for corneal biomechanical behavior. Since our sample comprises a wide range of ages, our results do not validate the age/corneal biomechanics relation, despite the sample size limitation.
Regarding the cutoff-based comparative analysis from tomographic parameters, a higher Kmax (≥45.5 D) was associated with clearly softer corneas and this is in line with a recent work including 97 healthy and 262 keratoconic eyes15 which compared several Pentacam-derived variables and highlighted a cutoff of 45 D in the mean keratometry for the diagnosis of definite keratoconus. The same study described another interesting conclusion: the introduction of coma data (third and fifth order) and anterior curvature maps indices (surface variance and vertical asymmetry), side by side with the powerful BAD-D, within logistic regression models to discriminate both definite and suspected keratoconus, from controls. In the present study, negative VCOMA was clearly associated with softer behavior, but more conflicting results appear in the analysis of the IHD variable, with differences only found in two biomechanical parameters and towards stiffer behavior in corneas with IHD ≥0.010. Thus, the results of the present work are in line with the aforementioned study, validating the assessment of the VCOMA (third order), but not the IHD in LVC candidates. Conversely, the biomechanical behavior assessment of the present study touches two controversies: first, the conflicting results showed at a cutoff of 500 µm in the TPCT devalue its utilization as a clinically relevant surrogate of corneal fragility; second, the small number of parameters with significant differences found at a cutoff of 350 µm in the ARTmax sustains the discussion on which the value should be used in the LVC setting, despite the demonstrated higher accuracy in differentiating both keratoconus and subclinical disease with the Ambrósio relational thickness concept, rather than using corneal thickness itself.30 However, assumptions should be made carefully, as the TPCT and the ARTmax were the parameters in which the number of eyes was more unbalanced between groups in the cutoff-based comparative analysis.
In relation to the scores/indices, some important issues must be discussed. Regarding the cutoff-based comparative analysis with the ERSS, despite only few differences being found, it is of notice that TBI and CBI were included, proving that clinical, topographic and treatment-related data are still valuable.
The type of surgery (PRK, LASIK, Smile) is a major aspect to be considered, as different procedures carry different risks. In this sense, the different proportion of eyes considered in high-risk applying the BCRCprk and BCRClasik calculators highlights the role of the inclusion of treatment-related data in ectasia risk assessment before LVC, in a time of rapid technology innovation. Moreover, the 15% of eyes classified without ectasia susceptibility by the most accurate parameter, integrating tomography and biomechanics, together with the nearly 85% of eyes with low risk for PRK procedure according to BCRCprk, highlights the integration of all parameters as a key factor toward the ideal procedure for each eye, which may widen the surgical indications in the future.
The relatively low number of eyes is a main limitation of the study. As BAD-D is one of the most valuable parameters in the integrated analysis for exclusion from LVC, in our department, the majority of eyes presented values above the 1.6 cutoff, which preclude comparative analysis, possibly being another limitation.
To the best of the authors’ knowledge, this is the first study describing corneal biomechanical behavior by ultrahigh-speed Scheimpflug camera during noncontact tonometry in eyes excluded from LVC and linking it to widely used scores/indices and clinical and tomographic parameters, which is considered the main strength of this study.
Conclusion
The majority of eyes excluded from LVC in the present study met the criteria for ectasia susceptibility in several biomechanical parameters, including the CBI and TBI, validating the clinical and tomographic based screening prior to LVC in our center; however, differences found in the biomechanical assessment regarding cutoffs used in clinical practice highlight its differential role in characterizing risk profile of these patients. Nevertheless, tomography should not be overlooked and the integration of all data, including treatment-related parameters, can be the future of risk ectasia screening prior LVC.
Acknowledgments
We want to express our gratitude to those who made this work possible and are not referred as co-authors, mainly the other residents and the technicians who performed the exams and, above all, to the chief of the Ophthalmology Department from the Centro Hospitalar e Universitário do Porto, Prof. Dr Pedro Menéres, for his vision and enthusiasm with new technologies and resources to improve the ophthalmic care of the population.
Funding
This study received no funding. There is no financial, activity relationships or affiliations disclosures regarding any of the authors. The authors do not have any proprietary interest.
Disclosure
The authors report no conflicts of interest in this work.
References
1. Spadea L, Cantera E, Cortes M, Conocchia NE, Stewart CW. Corneal ectasia after myopic laser in situ keratomileusis: a long-term study. Clinical Ophthalmol. 2012;6:1801–1813. doi:10.2147/OPTH.S37249
2. Ambrósio R
3. Binder PS, Lindstrom RL, Stulting RD, et al. Keratoconus and corneal ectasia after LASIK. J Cataract Refract Surg. 2005;31:2035–2038. doi:10.1016/j.jcrs.2005.12.002
4. Ambrósio R
5. Randleman JB, Trattler WB, Stulting RD. Validation of the ectasia risk score system for preoperative laser in situ keratomileusis screening. Am J Ophthalmol. 2008;145:813–818. doi:10.1016/j.ajo.2007.12.033
6. Santhiago MR, Smadja D, Gomes BF, et al. Association between the percent tissue altered and post-laser in situ keratomileusis ectasia in eyes with normal preoperative topography. Am J Ophthalmol. 2014;158:87–95.e1. doi:10.1016/j.ajo.2014.04.002
7. Santhiago MR, Smadja D, Wilson SE, Krueger RR, Monteiro ML, Randleman JB. Role of percent tissue altered on ectasia after LASIK in eyes with suspicious topography. J Refractive Surgery. 2015;31:258–265. doi:10.3928/1081597X-20150319-05
8. Bohac M, Koncarevic M, Pasalic A, et al. Incidence and clinical characteristics of post LASIK ectasia: a review of over 30,000 LASIK cases. Semin Ophthalmol. 2018;33:869–877. doi:10.1080/08820538.2018.1539183
9. Roberts CJ, Dupps WJ
10. Ambrósio R
11. Salomão MQ, Hofling-Lima AL, Faria-Correia F, et al. Dynamic corneal deformation response and integrated corneal tomography. Indian J Ophthalmol. 2018;66:373–382. doi:10.4103/ijo.IJO_831_17
12. Vinciguerra R, Ambrósio R
13. Moshirfar M, Motlagh MN, Murri MS, Momeni-Moghaddam H, Ronquillo YC, Hoopes PC. Advances in biomechanical parameters for screening of refractive surgery candidates: a review of the literature, part III. Med Hypothesis, Discovery Innovation Ophthalmol j. 2019;8:219–240.
14. Giri P, Azar DT. Risk profiles of ectasia after keratorefractive surgery. Curr Opin Ophthalmol. 2017;28:337–342. doi:10.1097/ICU.0000000000000383
15. Hashemi H, Beiranvand A, Yekta A, Maleki A, Yazdani N, Khabazkhoob M. Pentacam top indices for diagnosing subclinical and definite keratoconus. J Current Ophthalmol. 2016;28:21–26. doi:10.1016/j.joco.2016.01.009
16. Bühren J, Kühne C, Kohnen T. Defining subclinical keratoconus using corneal first-surface higher-order aberrations. Am J Ophthalmol. 2007;143:381–389. doi:10.1016/j.ajo.2006.11.062
17. Belin MW, Ambrósio R Jr. Analyzing tomographic corneal elevation for detecting ectasia. In: Alió JL, editor. Keratoconus. Recent Advances in Diagnosis and Treatment. Switzerland: Springer International Publishing Switzerland; 2017:65–75.
18. Salomão MQ, Hofling-Lima AL, Gomes Esporcatte LP, et al. The role of corneal biomechanics for the evaluation of ectasia patients. Int J Environ Res Public Health. 2020;17:17. doi:10.3390/ijerph17062113
19. Jędzierowska M, Koprowski R. Novel dynamic corneal response parameters in a practice use: a critical review. Biomed Eng Online. 2019;18:17. doi:10.1186/s12938-019-0636-3
20. Valbon B, Jr R, Fontes B, Luz A, Roberts C, Alves M. Ocular biomechanical metrics by corvis st in healthy brazilian patients. J Refractive Surgery. 2014;30:1–6. doi:10.3928/1081597X-20140521-01
21. Roberts C, Mahmoud A, Bons J, et al. Introduction of two novel stiffness parameters and interpretation of air puff–induced biomechanical deformation parameters with a dynamic scheimpflug analyzer. J Refractive Surgery. 2017;33:266–273.
22. Eliasy A, Chen KJ, Vinciguerra R, et al. Determination of corneal biomechanical behavior in-vivo for healthy eyes using corvis st tonometry: stress-strain index. Front Bioengineering Biotechnol. 2019;7:105. doi:10.3389/fbioe.2019.00105
23. Ferreira-Mendes J, Lopes BT, Faria-Correia F, Salomão MQ, Rodrigues-Barros S, Ambrósio R
24. Sedaghat MR, Momeni-Moghaddam H, Ambrósio R
25. Kataria P, Padmanabhan P, Gopalakrishnan A, Padmanaban V, Mahadik S, Ambrósio R
26. Koh S, Ambrósio R
27. Valbon BF, Ambrósio-Jr. R, Fontes BM, Alves MR. Effects of age on corneal deformation by non-contact tonometry integrated with an ultra-high-speed (UHS) Scheimpflug camera %J Arquivos Brasileiros de Oftalmologia. Arquivos Brasileiros De Oftalmologia. 2013;76:229–232. doi:10.1590/s0004-27492013000400008
28. Asaoka R, Nakakura S, Tabuchi H, et al. The relationship between corvis ST tonometry measured corneal parameters and intraocular pressure, corneal thickness and corneal curvature. PLoS One. 2015;10:e0140385–e. doi:10.1371/journal.pone.0140385
29. Orr JB, Zvirgzdina M, Wolffsohn J. The influence of age, ethnicity, eye/body size and diet on corneal biomechanics. Invest Ophthalmol Vis Sci. 2017;58:1131.
30. Ambrósio R Jr, Faria Correia F, Belin MW. Analyzing tomographic thickness for detecting corneal ectatic diseases. In: Alió JL, editor. Keratoconus. Recent Advances in Diagnosis and Treatment. Switzerland: Springer International Publishing Switzerland; 2017:77–85.
 © 2021 The Author(s). This work is published and licensed by Dove Medical Press Limited. The full terms of this license are available at https://www.dovepress.com/terms.php and incorporate the Creative Commons Attribution - Non Commercial (unported, v3.0) License.
By accessing the work you hereby accept the Terms. Non-commercial uses of the work are permitted without any further permission from Dove Medical Press Limited, provided the work is properly attributed. For permission for commercial use of this work, please see paragraphs 4.2 and 5 of our Terms.
© 2021 The Author(s). This work is published and licensed by Dove Medical Press Limited. The full terms of this license are available at https://www.dovepress.com/terms.php and incorporate the Creative Commons Attribution - Non Commercial (unported, v3.0) License.
By accessing the work you hereby accept the Terms. Non-commercial uses of the work are permitted without any further permission from Dove Medical Press Limited, provided the work is properly attributed. For permission for commercial use of this work, please see paragraphs 4.2 and 5 of our Terms.