")
Back to Journals » International Journal of Nanomedicine » Volume 15
The Role of Autophagy in M2 Polarization of Macrophages Induced by Micro/Nano Topography
Authors Luo J, He Y, Meng F , Yan N , Zhang Y, Song W
Received 6 July 2020
Accepted for publication 14 September 2020
Published 9 October 2020 Volume 2020:15 Pages 7763—7774
DOI https://doi.org/10.2147/IJN.S270100
Checked for plagiarism Yes
Review by Single anonymous peer review
Peer reviewer comments 3
Editor who approved publication: Professor Lei Yang
Jing Luo,1,2,* Yide He,1,* Fanhui Meng,1,3,* Ning Yan,1 Yumei Zhang,1 Wen Song1
1State Key Laboratory of Military Stomatology & National Clinical Research Center for Oral Diseases & Shaanxi Key Laboratory of Oral Diseases, Department of Prosthodontics, School of Stomatology, The Fourth Military Medical University, Xi’an 710032, People’s Republic of China; 2Department of Stomatology, General Hospital of Southern Theater Command, PLA, Guangzhou 510010, People’s Republic of China; 3State Key Laboratory of Military Stomatology and National Clinical Research Center for Oral Diseases and Shaanxi Key Laboratory of Oral Diseases, Department of Dental Materials, School of Stomatology, The Fourth Military Medical University, Xi’an 710032, People’s Republic of China
*These authors contributed equally to this work
Correspondence: Yumei Zhang Email [email protected]
Wen Song Email [email protected]
Background: The proper topography of implant surface can induce macrophages polarization, whereas the regulation mechanism has not been fully deciphered. The study aimed to examine the regulation mechanism of macrophages M2 polarization by titanium (Ti) implant surface micro/nano topography.
Results: Firstly, the titanium implant micropits-nanotubular surface with ∼ 30 nm diameters (MNT) can induce the M2 polarization of RAW264.7 spontaneously, as indicated by the spindle-like cell morphological alteration and specific molecular marker arginase-1 (Arg1) expression. Next, the autophagic vacuoles (AVs) number is significantly increased on MNT surface, as confirmed by the monodansylcadaverine (MDC) and CYTO-ID staining as well as the transmission electron microscope (TEM) observation. In addition, increasing or decreasing the autophagosomes number by rapamycin or 3-methyladenine (3-MA) will result in augmentation or attenuation of Arg1. Furthermore, blocking the fusion between autophagosomes and lysosomes by bafilomycin also significantly reduces Arg1, even in the presence of rapamycin. Finally, the ERK phosphorylation is selectively upregulated on MNT surface and the AVs number and Arg1 expression are significantly suppressed by U0126 treatment.
Conclusion: Our findings suggest that the ERK-Beclin-1-autophagy axis may play a pivotal role in the regulation of M2 polarization induced by nanotopography.
Keywords: macrophages polarization, micro/nano topography, TiO2 nanotubes, autophagy, ERK
Introduction
The role of macrophages polarization in tissue healing and remodeling has attracted more and more attention recently.1,2 Specifically, the classical M1 polarized macrophages secrete a variety of inflammatory cytokines that fine tune the inflammation process, whereas the alternative M2 polarized macrophages are responsible for tissue healing process.2 As a result, inducing macrophages for M2 polarization has become a promising strategy to better the tissue remodeling microenvironment, which is a crucial idea in tissue engineering. To date, numerous stimuli can realize M2 polarization, among which the IL-4/IL-10 cytokines are considered as a standard model.3 However, the cytokines are both vulnerable and cost-consuming and this has constrained their application. With the development of nanoscience and nanotechnology, the nanomaterials have been extensively investigated as potential solutions for biomedical issues. To be specific, many reports have demonstrated that the biophysical clues such as the surface topography which the macrophages grow on is critical for polarization regulation.4–6 Our previous studies also indicate that the micro/nano topography of TiO2 nanotubular surface with ~30 nm diameter is able to induce M2 polarization and consequently influence the osseointegration in vivo.7,8 This phenomenon has not only provided a more convenient and safe way to induce M2 polarization, but has also led to the concept of “osteoimmunity” during the designation of bone implant.9,10 Unfortunately, how the macrophages M2 polarization is regulated by implant surface topography has not been systematically investigated yet, which makes the designation vague.
Autophagy is a conserved intracellular self-digestion system, which plays an important role in maintaining cell homeostasis.11 A growing amount of evidence suggests that autophagy is closely related to various cellular processes in various cell types. For instance, autophagy is required for mesenchymal stem cells (MSCs) differentiation and osteoblast mineralization.12 Our previous study also found that the MNT surface can induce autophagy response in osteoblasts, which is required for the subsequent differentiation.13 Moreover, in macrophages, the autophagy activity is essential for M2 polarization and the impaired autophagy will lead to proinflammatory state.14 According to the report from Chen et al,15 the autophagy may be responsible for the macrophages polarization regulation by nanotopography.15 Therefore, we hypothesize that the autophagy may also be a key point in the regulation of M2 polarization by MNT surface. However, unlike the biochemical factors that can either enter into or target the receptor to induce intracellular responses, the biophysical topography can only influence the outside of cellular membrane and how this signal can influence intracellular autophagy process remains unclear.
There is one classical molecular signaling pathway that bridges the extracellular stimulus and intracellular responses, the mitogen-activated protein kinase (MAPK) signaling pathway. There are three members of MAPK family, ERK, p38, and JNK, which are associated with numerous cell functions including cell division, differentiation and secretion. Given the extensive regulation processes and the links with extracellular stimuli, we infer that the MAPK may help to induce autophagy response on MNT surface. In fact, the crosstalk between MAPK and autophagy has been elucidated enormously in different cell types.16,17 In addition, our previous study also suggests that the MAPK signaling pathway is activated on MNT surface in osteoblasts.18 Taken together, we hypothesize that the MNT surface may induce autophagy response through MAPK pathway and consequently influence the macrophages M2 polarization.
In the present study, the MNT surface was fabricated on pure titanium (Ti) surface by acid etching plus anodization under 5 V voltage to generate ~30 nm diameter nanotubes, and the polished Ti (P) surface was taken as control. Murine macrophage cell line RAW264.7 was cultured on different surfaces and the M2 polarization, autophagy and MAPK pathway was systematically investigated.
Materials and Methods
Implant Preparation and Characterization
Pure Ti plates (10 mm × 10 mm × 1 mm, Northwest Institute for Nonferrous Metal Research, Xi’an, People's Republic of China) were polished to mirror-like smoothness by SiC sandpapers (Matador, Germany) from 800# to 7000# and denoted as the P group. To prepare the MNT sample, the P sample was etched in 0.5 wt% HF for 20 minutes followed by anodization in an electrolyte containing 0.5 wt.% HF and 6.0 wt% H3PO4 under a constant voltage of 5 V for 1 hour. The prepared sample was sonicated sequentially in acetone, absolute ethanol, and deionized water to remove potential contaminants. Prior to cell culture, the sample was sterilized in 75% ethanol for 12 hours plus UV irradiation. The surface architecture and topography were examined by SEM (S-4800, Hitachi, Japan) and AFM (Dimension Icon, Bruker, Germany) respectively. The surface water contact angle was measured by the DSA1 System (Kruss, Germany).
Cell Culture and Seeding on Implant Surface
Murine macrophage cell line RAW 264.7 (ATCC TIB-71TM) were cultured in DMEM medium (Corning, NY, USA) supplemented with 10% fetal bovine serum (FBS; Hangzhou Sijiqing Biological Engineering Materials Co., Ltd, People's Republic of China) and 1% penicillin/streptomycin, in a humidified incubator (37°C, 5% CO2). When the confluence reached ~80%, the cells were trypsinized for cell seeding on either the P or MNT surface at the density of 5×10⁴ cells/cm2.
Cell Morphology Observation
After 3 and 7 days culture on Ti implant surface, the cells were rinsed in PBS and fixed either in 2.5% glutaraldehyde overnight at 4°C or 4% paraformaldehyde for 20 minutes at room temperature to perform the SEM and CLSM observation (Leica AF6000, Germany) respectively. For the SEM observation, the sample was dehydrated sequentially in ethanol (30100%), freeze-dried and sputtering coated with platinum. For the CLSM observation, the actin cytoskeleton was stained with Alexa Fluor 488-conjugated phalloidin (1:20, Cell Signaling Technology, Danvers, MA, USA) for 30 minutes at room temperature while the nucleus was stained with 4′,6-diamidino-2-phenylindole (DAPI, Sigma).
Flow Cytometry Analysis
After 3 and 7 days culture on different surfaces, the cells were collected by trypsinization to subject immunostaining of PE-labeled anti-CD206 (eBioscience, USA) for 30 minutes at 4°C, while protected from light. The untreated cells were defined as blank control. After washing in PBS to remove unbounded dye background, the sample was examined by the Beckman Coulter Epics XL cytometer (Beckman Coulter, Fullerton, CA, USA).
Real-Time Quantitative Polymerase Chain Reaction (qPCR)
The M2 polarization specific marker Arg1 was measured by qPCR analysis. Briefly, the total RNA was extracted by RNAiso Plus (Takara, Tokyo, Japan) according to the manufacturer’s instructions, which was used as the template for cDNA synthesis by using PrimeScriptTM RT Master Mix (Perfects Real Time; Takara). The qPCR was performed by SYBR®Premix Ex TaqTMII on a CFX96 system (Bio-Rad Laboratories, Hercules, CA, USA), with the Arg1 primer sequence of Forward 5ʹ-AGCTCTGGGAATCTGCATGG-3ʹ and Reverse 5ʹ-ATGTACACGATGTCTTTGGCAGATA-3ʹ. The glyceraldehyde-3-phosphate dehydrogenase (GAPDH) was used as housekeeper gene to normalize the mRNA level, with the primer sequence of Forward 5ʹ-CCAATGTGTCCGTCGTGGATCT-3ʹ and Reverse 5ʹ-GTTGAAGTCGCAGGAGACAACC-3ʹ.
Western Blot
The intracellular total protein was isolated by lysing the cells in RIPA buffer (Beyotime, People's Republic of China) containing protease inhibitors, which was quantified by using the bicinchoninic acid (BCA) method and boiled with loading buffer. For Western blot analysis, 20 μg proteins were electrophoresed on a 10% SDS-PAGE gel, and then transferred onto the polyvinylidene fluoride membrane (PVDF, EMD Millipore, Billerica, MA, USA). After blocking with 5% BSA for 1 hour at room temperature, the membrane was incubated with primary antibodies including anti-Arg1 (1:1000, EMD Millipore), anti-ERK (1:1000, Cell Signaling Technology), anti-phospho-ERK (1:1000, Cell Signaling Technology), anti-p38 (1:1000, Cell Signaling Technology), anti-phospho-p38 (1:1000, Cell Signaling Technology), anti-JNK (1:1000, Cell Signaling Technology), anti-phospho-JNK (1:1000, Cell Signaling Technology), anti-LC3A/B (1:1000, Cell Signaling Technology), anti-Beclin-1 (1:1000, Cell Signaling Technology), and anti-GAPDH (1:4000, CWBIO, People's Republic of China) overnight at 4°C. The membrane was washed thoroughly by TBST to remove the unbounded antibodies and then incubated with horseradish peroxidase (HRP)-conjugated secondary antibody (1:40,000, Cell Signaling Technology) for 2 hours at room temperature. After thoroughly washing in TBST, the bands were visualized by enhanced chemiluminescence and detected by Tanon-5500. The greyscale of bands was analyzed by ImageJ software.
MDC and CYTO-ID Staining
The autophagosomes formation was detected by MDC and CYTO-ID staining respectively according to previous reports.19,20 Briefly, the cells were rinsed in HBSS and either treated with MDC (Solarbio Science, People's Republic of China) or CYTO-ID (Enzo Life Sciences CAT.NO: ENZ-51,031-0050) for 30 minutes at 37°C. Then the cells were rinsed in HBSS and imaged immediately by CLSM.
TEM Observation
The cells were collected by trypsin and pre-fixed in the mixture of 2.5% glutaraldehyde and 4% paraformaldehyde (1:1). The sample was post-fixed with 1% osmium tetroxide, dehydrated sequentially with ethanol and embedded in epoxy resin. Ultra-thin sections were prepared by the diamond knife, which were stained by uranyl acetate-lead citrate. Six images were taken randomly under the TEM (FEI TECNAI, USA) observation and the AVs were recognized and counted according to a previous publication.21
Statistical Analysis
Data were analyzed by SPSS 19.0 software. All experiments were independently repeated three times and presented as means ± standard deviations. The means were compared by Student’s t-tests and differences with P-values of less than 0.05 were considered statistically significant.
Results
Implant Surface Characterization Discussion
The surface architecture, topography and wettability of Ti samples were determined first (Figure 1). The P surface was quite flat both under lower and higher magnifications of scanning electron microscope (SEM) observation (Figure 1A). The MNT surface was occupied by regular microscale etched pits under lower magnification (Figure 1A). Under higher magnification, uniform nanotubes with average diameters of ~30 nm were vertically aligned homogeneously (Figure 1A). The surface topographies were detected by atomic force microscope (AFM) and the height, phase and amplitude images were obtained (Figure 1B). The Sq value calculated from the height images was used to represent the average roughness. The average roughness of P surface was 2.42 ± 0.04 nm while it increased to 6.5 ± 0.1 nm on MNT surface (Figure 1C). The wettability was depicted as the static water contact angle. The P surface showed ~40o, which reduced to ~9o after the MNT topography fabrication (Figure 1D).
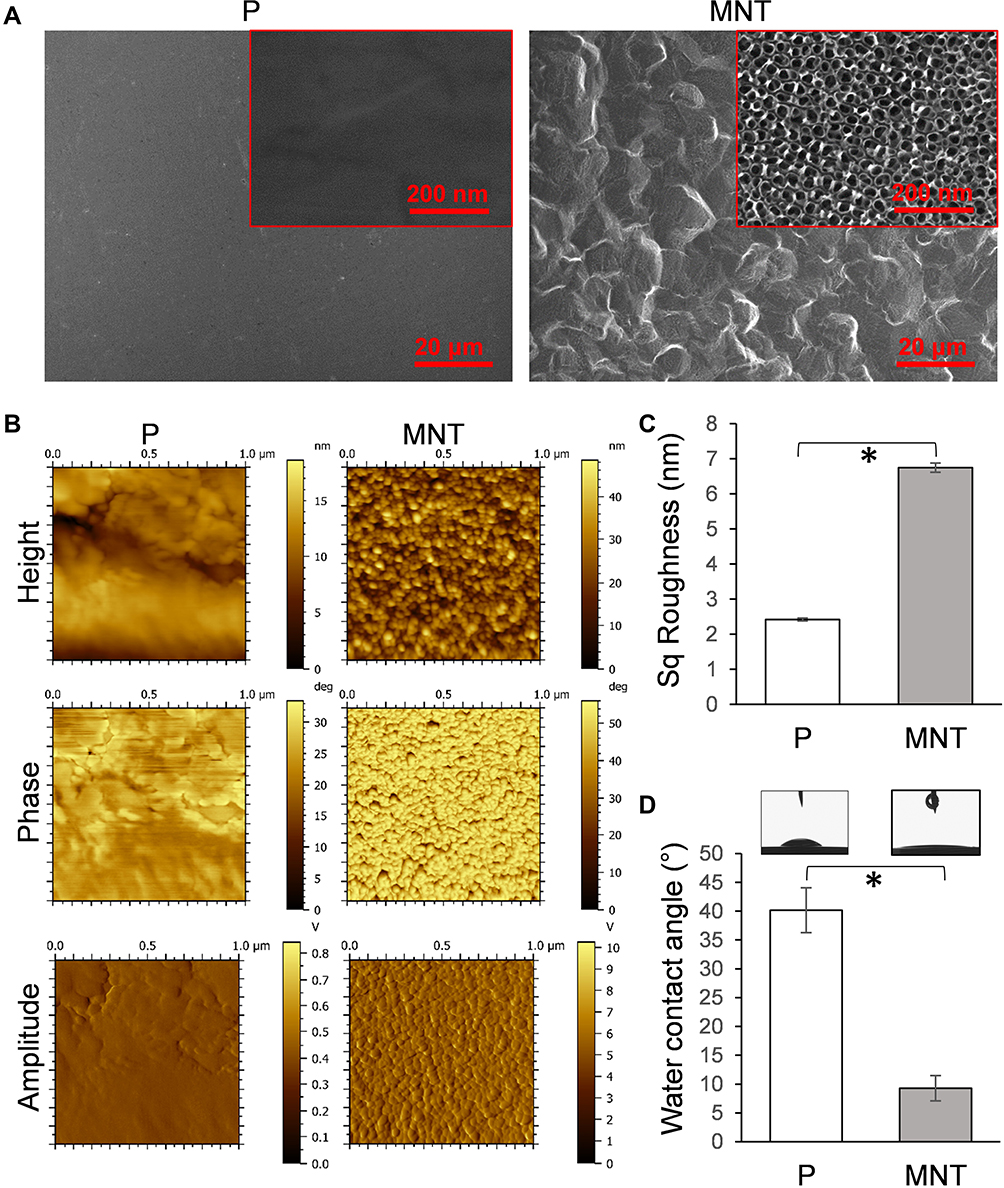 |
Figure 1 Implant surface characterization. The fabricated Ti implant surface structure was examined by SEM under both lower and higher magnifications (A). The surface topography was scanned by AFM (B), and the average roughness was calculated as Sq value (C). The water contact angle was measured by DSA (D). *P<0.05. |
The MNT Can Induce RAW264.7 M2 Polarization
The macrophage polarization in response to different topographies was investigated. Since the macrophage polarization had a clear impact on the cell morphology, eg, the M1 macrophages were round while M2 macrophages were spindle-shaped,22 the cell morphology was observed initially (Figure 2). Generally, the shape of RAW264.7 macrophages was round on the P surface whereas it was spindle-like on the MNT surface, both at Day 3 and Day 7 (Figure 2A). The quantitative analysis from the SEM images showed that the RAW264.7 cells had higher spreading area on P surface while the MNT surface was more favorable for their elongation (Figure 2B and C). To further confirm the M2 polarization state, the M2 macrophages specific markers were determined. Flow cytometry analysis showed that the surface marker CD206 was lower on MNT surface at Day 3 compared to P, which, however, was increased to be higher at Day 7 (Figure 2D). Similarly, the mRNA level of Arg1 was nearly the same at Day 3, while at Day 7 it was ~16-fold higher on MNT surface compared to the P group (Figure 2E). The protein expression of phenotype marker arginase-1 (Arg1) on MNT surface was enhanced ~3-fold higher at Day 3 compared to P surface, which was further promoted to ~5.7-fold at Day 7 (Figure 2F). The cytokines measurement also revealed that the M2-type cytokines containing IL-4 and PDGF-BB were significantly up-regulated on MNT surface (Figure S1).
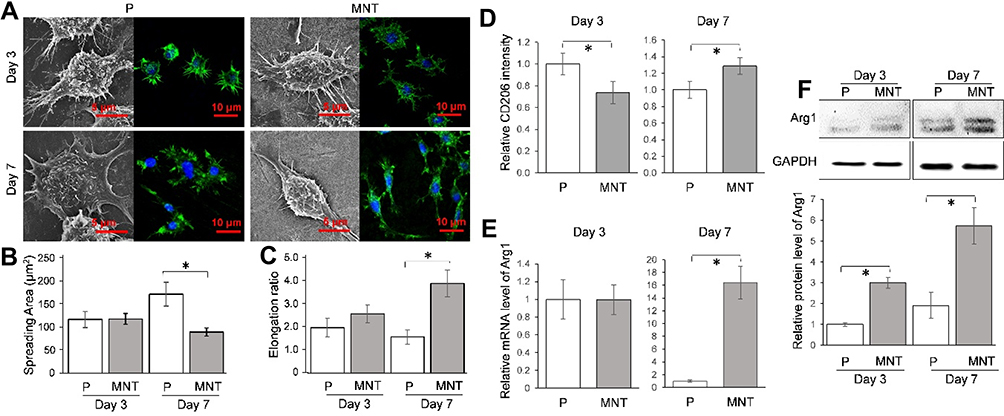 |
Figure 2 The intrinsic ability of MNT surface to induce M2 polarization. The RAW264.7 was grown on different surfaces for 3 and 7 days. The cell morphology was observed by SEM directly while the actin filaments arrangement was observed by CLSM after phalloidin staining (A). From the SEM images, the ImageJ software was used to calculate the cell spreading area (B), while the elongation ratio was illustrated as the ratio between the long-axis and short-axis of a cell (C). The M2 polarization surface marker CD206 intensity was determined by flow cytometry (D), while the phenotypic marker Arg1 was measured at both the mRNA and protein level by qPCR (E) and Western blot (F) respectively. *P<0.05. |
The MNT Increases Autophagic Vacuoles (AVs) Accumulation
We further analyzed whether autophagy activity was influenced by different surface topographies in RAW264.7. As indicated in the Western blot, the LC3-II were significantly enhanced on the MNT surface (Figure 3A), suggesting more autophagosomes (APs) formation. The APs formation was observed by confocal laser scanning microscope (CLSM) after the monodansylcadaverine (MDC) and CYTO-ID staining respectively. The number of green dots formation on MNT surface was more than that on the P surface, both in the MDC and CYTO-ID staining respectively (Figure 3B and C). In addition, the autophagic vacuoles (AVs) were directly examined by transmission electron microscope (TEM), which also showed that more AVs were accumulated in RAW264.7 on the MNT surface (Figure 3D and E).
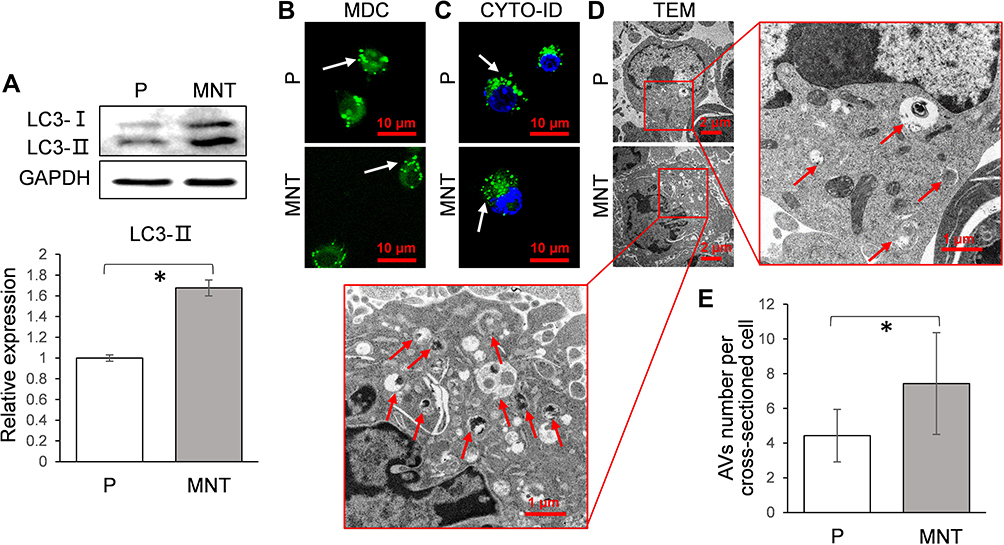 |
Figure 3 The AVs formation is increased on MNT surface. The RAW264.7 was grown on both surfaces for 7 days. The LC3 conversion from cytosolic LC3-I to membrane-associated LC3-II was analyzed by Western blot (A). Meanwhile, the APs were observed in situ by CLSM after staining with MDC (B) and CYTO-ID (C) respectively. The cells were trypsinized and examined by TEM, in order to directly observe the AVs architecture (D) as well as count the number (E). *P<0.05. |
The AVs Formation is Involved in Arg1 Expression
To confirm whether the accumulated AVs was involved in the M2 polarization regulation, the AVs formation was intervened by either the inhibitor 3-methyladenine (3-MA) or the inducer rapamycin (RAPA) to observe the consequent alterations (Figure 4). In the presence of 3-MA or RAPA, the green dots number was decreased or increased apparently on both surfaces, as indicated by MDC and CYTO-ID staining (Figure 4A and B). Similarly, the TEM images also showed that the AVs number was significantly decreased or increased after treatment of 3-MA or RAPA (Figure 4C and D). This was also indicated by the Western blot analysis that the LC3-II expression were inhibited or promoted in the presence of 3-MA or RAPA respectively (Figure 4EH). More importantly, the Arg1 expression was significantly attenuated or augmented after 3-MA or RAPA treatment (Figure 4E and F, I and J).
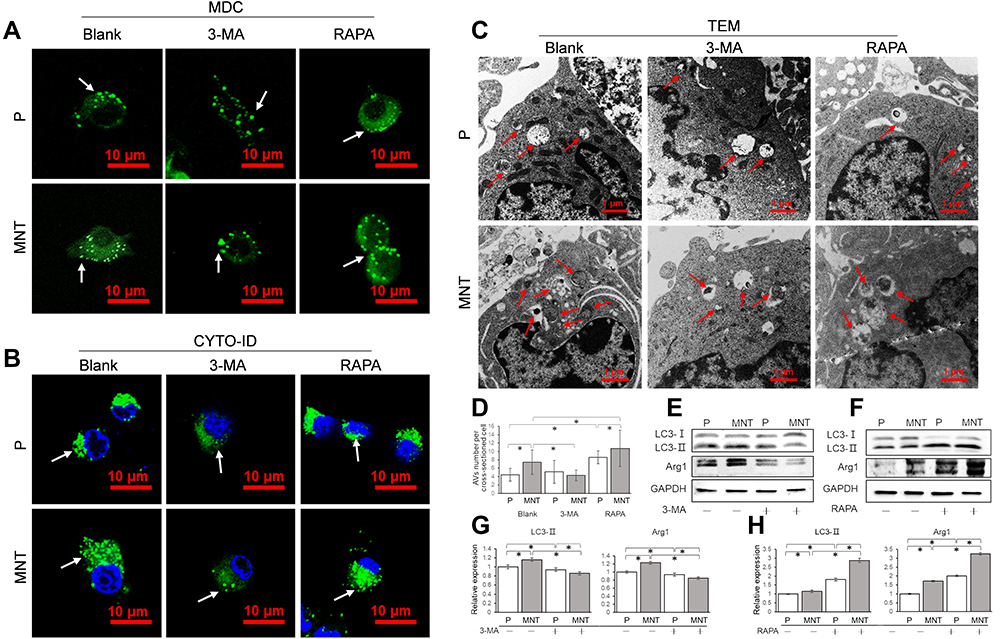 |
Figure 4 The AVs formation is related to M2 polarization. The RAW264.7 was either treated with 3-MA (10 mM) or RAPA (100 nM) to decrease or increase AVs formation. The corresponding AVs number alterations were confirmed by CLSM observation in situ after staining with MDC (A) and CYTO-ID (B) respectively. Meanwhile, the cells were trypsinized and examined by TEM (C and D). The LC3 conversion from cytosolic LC3-I to membrane-associated LC3-II and the M2 polarization marker Arg1 expression were analyzed by Western blot (E and F). The greyscale was analyzed by ImageJ software (G and H). *P<0.05. |
Autophagy Flux is Required for Arg1 Expression
To figure out why the AVs accumulation was related to M2 polarization, the autophagy flux was intervened by bafilomycin A1 (BAF) to inhibit the fusion between APs and lysosomes (Figure 5). As shown in the MDC and CYTO-ID staining, the APs dots formation was enhanced after BAF intervention, with or without RAPA co-treatment (Figure 5A and B). The LC3-II expression was also significantly augmented after BAF supplement (Figure 5C and D). However, the Arg1 expression was significantly inhibited, no matter whether the RAPA was co-treated (Figure 5C and D). This indicates that the autophagy flux, eg, the digestion of autolysosomes (ALs), may be the key process for M2 polarization regulation.
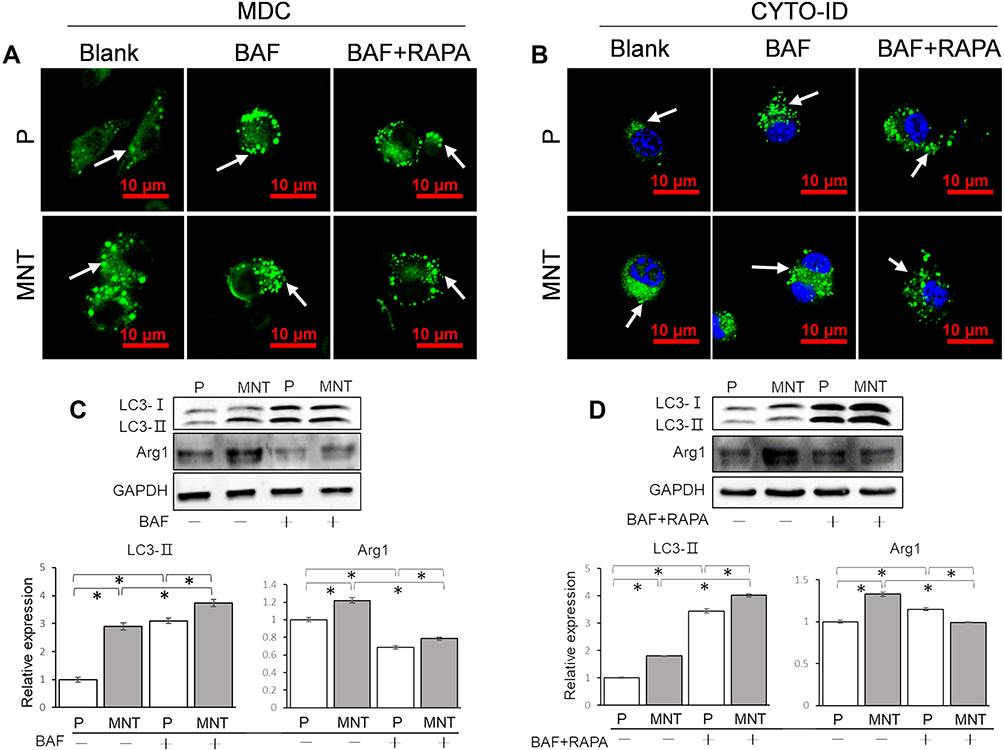 |
Figure 5 The autophagy flux is required for M2 polarization. The RAW264.7 was treated with BAF (1 nM) to block the ALs digestion, with or without RAPA (100 nM) co-treatment. The AVs in situ observation was performed by CLSM after staining with MDC (A) and CYTO-ID (B) respectively. The LC3 turnover assay and M2 polarization marker Arg1 expression were examined by Western blot and the greyscale was analyzed by ImageJ software (C and D). *P<0.05. |
The ERK Pathway is Selectively Activated by MNT Surface
In order to find out how the autophagy was activated on MNT surface, the MAPK signaling pathway was examined after culture of RAW264.7 for 7 days. It was notable that the phosphorylation of ERK was upregulated to ~2-fold higher on MNT surface while the p38 and JNK were not changed (Figure 6A and B). This indicates that the ERK pathway may be involved in the autophagy activation.
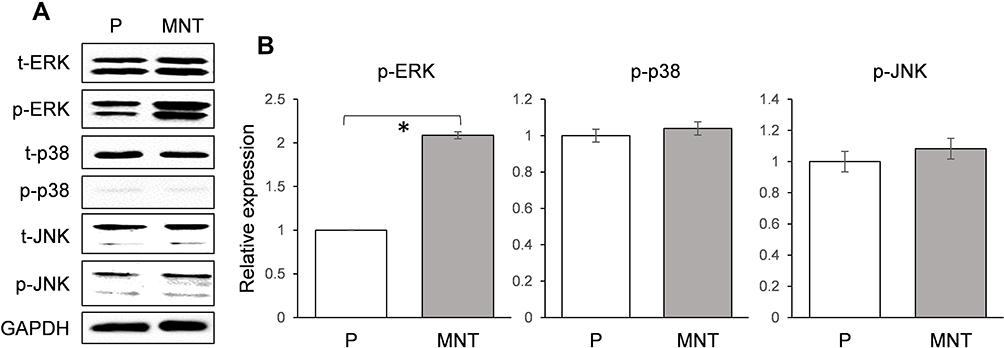 |
Figure 6 The MAPK signaling pathway validation. The RAW264.7 was grown on both surfaces for 7 days. Three members of MAPK family (ERK, p38 and JNK) expression and their phosphorylation level were determined by Western blot (A). The greyscale was analyzed by ImageJ software (B). *P<0.05. |
The ERK Pathway is Required for Autophagy Activation and Arg1 Expression
The influence of ERK pathway on autophagy and M2 polarization was investigated by inhibiting ERK activity with U0126. The AVs dots formation was severely impaired after U0126 treatment, both on P and MNT surfaces (Figure 7A and B). This was also confirmed by TEM observation that the AVs were significantly decreased by U0126 treatment, both on P and MNT surfaces (Figure 7C and D). Similarly, the LC3-II protein was downregulated considerably (Figure 7E and F). Moreover, the Arg1 expression was decreased to more than 50% (Figure 7E and F), indicating that the M2 polarization was severely disturbed after ERK inhibition.
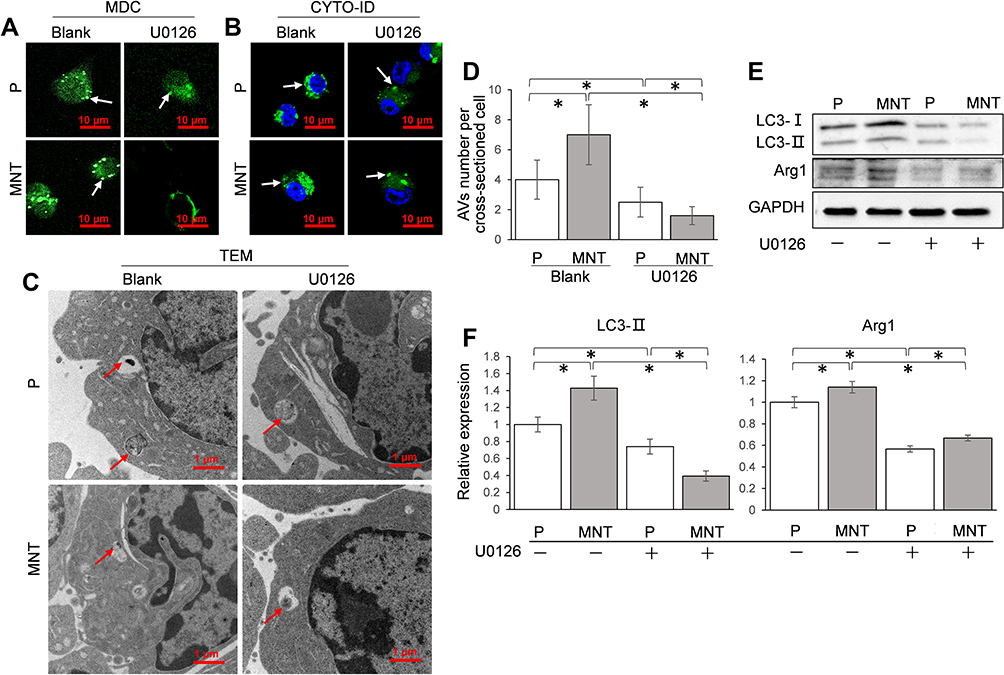 |
Figure 7 ERK pathway is required for AVs formation and M2 polarization. The RAW264.7 was treated with U0126 (10 nM) to inhibit ERK activity. The corresponding AVs number alterations were confirmed by CLSM observation in situ after staining with MDC (A) and CYTO-ID (B) respectively. The AVs architecture was examined by TEM (C and D). The LC3 conversion and the M2 polarization marker Arg1 expression were analyzed by Western blot (E). The greyscale was analyzed by ImageJ software (F). *P<0.05. |
The Beclin-1 May Be the Target of ERK for the Activation of Autophagy
To find out how the ERK phosphorylation directly results in autophagy activation, Beclin-1 has attracted our attention. It was notable that the Beclin-1 expression was upregulated on MNT surface, which was inhibited to more than 50% after U0126 treatment (Figure 8A and B). Therefore, we may infer that the MNT surface can influence macrophage M2 polarization through increasing ERK phosphorylation level to induce Beclin-1 upregulation and autophagy activation (Figure 8C).
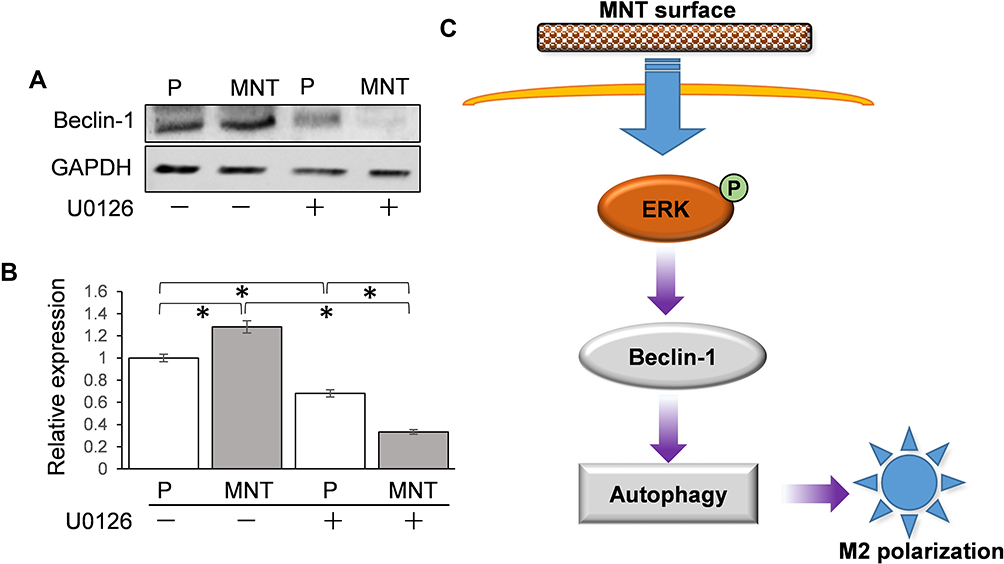 |
Figure 8 ERK may directly target Beclin-1 for autophagy activation. The RAW264.7 was grown on different surfaces with or without U0126 treatment. The related Beclin-1 expression was determined by Western blot (A) and the greyscale was analyzed by ImageJ software (B). (C) The scheme of potential M2 polarization regulation by MNT surface. The MNT surface can enhance the phosphorylation level of ERK, which directly upregulates the Beclin-1 activity and promotes autophagy response and the consequent M2 polarization. *P<0.05. |
Discussion
It is well accepted that different implant surface topographies can induce distinct cellular responses and their in vivo outcomes.23 Additionally, due to the findings that the nanotopography induced macrophages polarization also has substantial influence on implant in vivo fate, the role of macrophages during tissue engineering has attracted more and more attention. However, how the macrophages polarization is regulated by different implant topographies has not been well elucidated compared to the soluble biochemical factors.24,25 The purpose of this study was to investigate the effect of nanotopography of Ti surface on M2 macrophage polarization and its molecular mechanism. First of all, the MNT topography has been fabricated, which has been a standard model for the investigation of cell responses to substrate topographies in our group.26,27 There are several ways to identify the M2 phenotype differentiation of macrophages, among which the specific molecular markers expression is considered as the gold standard.28 In agreement with our previous reports, not only the cell morphology is elongated on MNT surface, which is a general visualized alteration of M2 macrophages,29 but also the molecular markers of CD206 and Arg1 are significantly upregulated. It should be noted that the differences are not that obvious at an early stage. This may be because the macrophages polarization is sequentially activated from M1 to M2 under certain circumstances and the shift may not be completed at day 3 on MNT surface.30,31
To confirm the relationship between autophagy and M2 polarization as regulated by the MNT surface, the basal autophagy activity is determined. We have found that the AVs accumulation is significantly increased on MNT surface, as indicated by the LC3-II upregulation and the AVs quantification by CLSM and TEM respectively. This reminds us that the increased AVs may be related to M2 polarization. To test the hypothesis, the AVs formation is inhibited or promoted by 3-MA and RAPA respectively to survey whether the M2 polarization is changed. The results have shown that the AVs number is decreased or increased after 3-MA or RAPA treatment and the Arg1 is down- or up-regulated accordingly. This suggests that the AVs accumulation is closely related to the M2 polarization. However, it is still unknown why the increased AVs accumulation is significant for M2 polarization. In brief, the autophagy process can be divided into the upstream autophagosomes formation stage and the downstream autophagosomes fusion with lysosomes for degradation stage.32 Therefore, there may be two possible ways of how the autophagy can regulate macrophages polarization. The first way may be that the autophagosomes formation and the polarization signaling have some critical common molecules. For example, during the osteogenic differentiation of stem cells, the AMMPK signaling pathway is crucial for calcium homeostasis.33 In the meanwhile, the AMMPK pathway is also a key tache for autophagy initiation.34 The other way may be that some digestion products of autophagy flux may play as critical switches for cell differentiation. For example, according to Nuschke’s report, the rest stage of hMSCs are filled with autophagosomes, whose digestion products may switch on the differentiation process.35 Since we have observed an increase of AVs accumulation, we infer that the autophagosomes digestion products may be important for M2 polarization. To test this deduction, the fusion between autophagosomes and lysosomes is inhibited by BAF. Due to the inhibition of autolysosomes formation, the accumulation of AVs number is increased and LC3-II expression is also augmented considerably. However, the Arg1 expression is significantly attenuated, suggesting that the M2 polarization is inhibited. Moreover, even in the presence of RAPA to improve the AVs formation, the BAF treatment still results in attenuation of Arg1 expression. This indicates that the digestion of AVs may be the key process which initiates M2 polarization.
The next question is how the autophagy activity is influenced by different surface topographies. In fact, there are several publications suggesting that different implant surface physical characteristics, such as topographies, stiffness and surface charges, can influence autophagy activity.15,36 However, the related mechanisms have not been fully elucidated. In our previous study, we found that the ERK and p38 MAPK signaling pathways play important roles during osteoblast differentiation regulation by the MNT surface. Since the MAPK signaling and autophagy are extensively cross-talked, we infer that the MNT surface may also influence the macrophages autophagy activity through the MAPK pathway. After validation of the three main members of MAPK family in RAW264.7, it is the phosphorylation level of ERK that has been significantly upregulated by MNT. In addition, after inhibition of ERK pathway by U0126, the AVs number is significantly reduced and the Arg1 expression is also downregulated. Taken together, these results indicate that the activation of ERK signaling pathway may be the upstream of autophagy induction and the consequent M2 polarization by the MNT topography. In fact, the ERK can induce autophagy mainly through two different ways according to previous reports. One way is that the ERK upregulates the tuberous sclerosis complex (TSC) activity and thus inhibits the mammalian target of rapamycin (mTOR) and results in autophagy.37,38 The other way is that the ERK directly promotes Beclin-1 expression and activates autophagy.39 From our previous observation, the NT surface can induce autophagy in osteoblasts without influence of mTOR activity.13 In addition, the phosphorylation of mTOR did not change obviously on the MNT surface (Figure S2). Consequently, the MNT surface may also induce autophagy through the mTOR-independent way in the macrophages. Thus, the MNT may induce macrophage autophagy through the ERK-Beclin-1 pathway. This is confirmed by the Western blot analysis that the Beclin-1 is upregulated on MNT surface and that considerably decreased after ERK inhibition by U0126. Finally, how the ERK pathway is activated by the substrate surface topography remains unclear. According to previous reports, manipulating cell adhesive ligands to formulate proper nanotopography is able to control macrophage polarization directions.40,41 Therefore, our implant surface may have influenced the cell adhesion organization, thus resulting in ERK pathway activation.
Conclusion
The present study has systematically investigated the regulation mechanisms of the physical topography on the M2 polarization of macrophages. Specifically, the MNT surface can influence the activity of ERK-Beclin-1-autophagy axis in RAW264.7. Although increasing or decreasing the number of autophagosomes will result in enhancement or attenuation of M2 polarization respectively, the digestion of autophagosomes may be more important to initiate the M2 polarization process.
Funding
The work is granted by the National Natural Science Foundation of the People's Republic of China [grant numbers 81530051, 31800790 and 31670966], Shaanxi Provincial Key Research and Development Plan Project (2019SF-031) and Young Talent fund of University Association for Science and Technology in Shaanxi, People's Republic of China (20190304). The work is also supported by grants (2020TD-033) from the Shaanxi Key Scientific and Technological Innovation Team and by the Youth Innovation Team of Shaanxi Universities.
Disclosure
The authors report no conflicts of interest in this work.
References
1. Kang H, Kim S, Wong DSH, et al. Remote manipulation of ligand nano-oscillations regulates adhesion and polarization of macrophages in vivo. Nano Lett. 2017;17(10):6415–6427. doi:10.1021/acs.nanolett.7b03405
2. Krzyszczyk P, Schloss R, Palmer A, Berthiaume F. The role of macrophages in acute and chronic wound healing and interventions to promote pro-wound healing phenotypes. Front Physiol. 2018;9:419.
3. Shayan M, Padmanabhan J, Morris AH, et al. Nanopatterned bulk metallic glass-based biomaterials modulate macrophage polarization. Acta Biomater. 2018;75:427–438. doi:10.1016/j.actbio.2018.05.051
4. Meli VS, Veerasubramanian PK, Atcha H, Reitz Z, Downing TL, Liu WF. Biophysical regulation of macrophages in health and disease. J Leukoc Biol. 2019;106(2):283–299.
5. Singh S, Awuah D, Rostam HM, et al. Unbiased analysis of the impact of micropatterned biomaterials on macrophage behavior provides insights beyond predefined polarization states. ACS Biomaterials Sci Eng. 2017;3(6):969–978. doi:10.1021/acsbiomaterials.7b00104
6. Vassey MJ, Figueredo GP, Scurr DJ, et al. Immune modulation by design: using topography to control human monocyte attachment and macrophage differentiation. Adv Sci. 2020;7(11):1903392. doi:10.1002/advs.201903392
7. Ma QL, Zhao LZ, Liu RR, et al. Improved implant osseointegration of a nanostructured titanium surface via mediation of macrophage polarization. Biomaterials. 2014;35(37):9853–9867. doi:10.1016/j.biomaterials.2014.08.025
8. Wang J, Meng F, Song W, et al. Nanostructured titanium regulates osseointegration via influencing macrophage polarization in the osteogenic environment. Int J Nanomed. 2018;13:4029–4043. doi:10.2147/IJN.S163956
9. Wei F, Xiao Y. Modulation of the osteoimmune environment in the development of biomaterials for osteogenesis. Adv Exp Med Biol. 2018;1077:69–86.
10. Sadowska JM, Wei F, Guo J, et al. The effect of biomimetic calcium deficient hydroxyapatite and sintered beta-tricalcium phosphate on osteoimmune reaction and osteogenesis. Acta Biomater. 2019;96:605–618. doi:10.1016/j.actbio.2019.06.057
11. Mizushima N, Levine B, Cuervo AM, Klionsky DJ. Autophagy fights disease through cellular self-digestion. Nature. 2008;451(7182):1069–1075. doi:10.1038/nature06639
12. Ma Y, Qi M, An Y, et al. Autophagy controls mesenchymal stem cell properties and senescence during bone aging. Aging Cell. 2018;17:1. doi:10.1111/acel.12709
13. Song W, Shi M, Dong M, Zhang Y. Inducing temporal and reversible autophagy by nanotopography for potential control of cell differentiation. ACS Appl Mater Interfaces. 2016;8(49):33475–33483. doi:10.1021/acsami.6b11699
14. Boakye YD, Groyer L, Heiss EH. An increased autophagic flux contributes to the anti-inflammatory potential of urolithin A in macrophages. Biochimica Et Biophysica Acta General Subjects. 2018;1862(1):61–70.
15. Chen Z, Bachhuka A, Han S, et al. Tuning chemistry and topography of nanoengineered surfaces to manipulate immune response for bone regeneration applications. ACS Nano. 2017;11(5):4494–4506. doi:10.1021/acsnano.6b07808
16. Lu Z, Xie D, Chen Y, et al. TLR2 mediates autophagy through ERK signaling pathway in Mycoplasma gallisepticum-infected RAW264.7 cells. Mol Immunol. 2017;87:161–170. doi:10.1016/j.molimm.2017.04.013
17. Li L, Zhang J, Zhang Q, et al. High glucose suppresses keratinocyte migration through the inhibition of p38 MAPK/Autophagy pathway. Front Physiol. 2019;10:24. doi:10.3389/fphys.2019.00024
18. Wang W, Liu Q, Zhang Y, Zhao L. Involvement of ILK/ERK1/2 and ILK/p38 pathways in mediating the enhanced osteoblast differentiation by micro/nanotopography. Acta Biomater. 2014;10(8):3705–3715. doi:10.1016/j.actbio.2014.04.019
19. Guo S, Pridham KJ, Virbasius CM, et al. A large-scale RNA interference screen identifies genes that regulate autophagy at different stages. Sci Rep. 2018;8(1):2822. doi:10.1038/s41598-018-21106-5
20. Chan LL, Shen D, Wilkinson AR, et al. A novel image-based cytometry method for autophagy detection in living cells. Autophagy. 2012;8(9):1371–1382. doi:10.4161/auto.21028
21. Klionsky DJ, Abdalla FC, Abeliovich H, et al. Guidelines for the use and interpretation of assays for monitoring autophagy. Autophagy. 2012;8(4):445–544.
22. Luu TU, Gott SC, Woo BW, Rao MP, Liu WF. Micro- and nanopatterned topographical cues for regulating macrophage cell shape and phenotype. ACS Appl Mater Interfaces. 2015;7(51):28665–28672. doi:10.1021/acsami.5b10589
23. Liang C, Hu Y, Wang H, et al. Biomimetic cardiovascular stents for in vivo re-endothelialization. Biomaterials. 2016;103:170–182. doi:10.1016/j.biomaterials.2016.06.042
24. Pan H, Xie Y, Zhang Z, et al. Immunomodulation effect of a hierarchical macropore/nanosurface on osteogenesis and angiogenesis. Biomed Mater. 2017;12(4):045006. doi:10.1088/1748-605X/aa6b7c
25. Jain N, Moeller J, Vogel V. Mechanobiology of macrophages: how physical factors coregulate macrophage plasticity and phagocytosis. Annu Rev Biomed Eng. 2019;21:267–297. doi:10.1146/annurev-bioeng-062117-121224
26. Liu Q, Wang W, Zhang L, et al. Involvement of N-cadherin/beta-catenin interaction in the micro/nanotopography induced indirect mechanotransduction. Biomaterials. 2014;35(24):6206–6218. doi:10.1016/j.biomaterials.2014.04.068
27. Shi M, Song W, Han T, et al. Role of the unfolded protein response in topography-induced osteogenic differentiation in rat bone marrow mesenchymal stem cells. Acta Biomater. 2017;54:175–185. doi:10.1016/j.actbio.2017.03.018
28. Jablonski KA, Amici SA, Webb LM, et al. Novel markers to delineate murine M1 and M2 macrophages. PLoS One. 2015;10(12):e0145342. doi:10.1371/journal.pone.0145342
29. Chen W, Zhao Y, Li XC, Kubiak JZ, Ghobrial RM, Kloc M. Rho-specific Guanine nucleotide exchange factors (Rho-GEFs) inhibition affects macrophage phenotype and disrupts Golgi complex. Int J Biochem Cell Biol. 2017;93:12–24. doi:10.1016/j.biocel.2017.10.009
30. Troidl C, Jung G, Troidl K, et al. The temporal and spatial distribution of macrophage subpopulations during arteriogenesis. Curr Vasc Pharmacol. 2013;11(1):5–12. doi:10.2174/157016113804547629
31. Spiller KL, Nassiri S, Witherel CE, et al. Sequential delivery of immunomodulatory cytokines to facilitate the M1-to-M2 transition of macrophages and enhance vascularization of bone scaffolds. Biomaterials. 2015;37:194–207. doi:10.1016/j.biomaterials.2014.10.017
32. Nakamura S, Yoshimori T. New insights into autophagosome-lysosome fusion. J Cell Sci. 2017;130(7):1209–1216. doi:10.1242/jcs.196352
33. Kim EK, Lim S, Park JM, et al. Human mesenchymal stem cell differentiation to the osteogenic or adipogenic lineage is regulated by AMP-activated protein kinase. J Cell Physiol. 2012;227(4):1680–1687. doi:10.1002/jcp.22892
34. Shang L, Wang X. AMPK and mTOR coordinate the regulation of Ulk1 and mammalian autophagy initiation. Autophagy. 2011;7(8):924–926. doi:10.4161/auto.7.8.15860
35. Nuschke A, Rodrigues M, Stolz DB, Chu CT, Griffith L, Wells A. Human mesenchymal stem cells/multipotent stromal cells consume accumulated autophagosomes early in differentiation. Stem Cell Res Ther. 2014;5(6):140. doi:10.1186/scrt530
36. Chen Z, Ni S, Han S, et al. Nanoporous microstructures mediate osteogenesis by modulating the osteo-immune response of macrophages. Nanoscale. 2017;9(2):706–718. doi:10.1039/C6NR06421C
37. Yoshida S, Pacitto R, Inoki K, Swanson J. Macropinocytosis, mTORC1 and cellular growth control. CMLS. 2018;75(7):1227–1239. doi:10.1007/s00018-017-2710-y
38. Wong M. Mammalian target of rapamycin (mTOR) inhibition as a potential antiepileptogenic therapy: from tuberous sclerosis to common acquired epilepsies. Epilepsia. 2010;51(1):27–36. doi:10.1111/j.1528-1167.2009.02341.x
39. Li X, Feng K, Li J, et al. Curcumin inhibits apoptosis of chondrocytes through activation ERK1/2 signaling pathways induced autophagy. Nutrients. 2017;9:4. doi:10.3390/nu9040414
40. Kang H, Yang B, Zhang K, et al. Immunoregulation of macrophages by dynamic ligand presentation via ligand-cation coordination. Nat Commun. 2019;10(1):1696. doi:10.1038/s41467-019-09733-6
41. Kang H, Wong SHD, Pan Q, Li G, Bian L. Anisotropic ligand nanogeometry modulates the adhesion and polarization state of macrophages. Nano Lett. 2019;19(3):1963–1975. doi:10.1021/acs.nanolett.8b05150
 © 2020 The Author(s). This work is published and licensed by Dove Medical Press Limited. The full terms of this license are available at https://www.dovepress.com/terms.php and incorporate the Creative Commons Attribution - Non Commercial (unported, v3.0) License.
By accessing the work you hereby accept the Terms. Non-commercial uses of the work are permitted without any further permission from Dove Medical Press Limited, provided the work is properly attributed. For permission for commercial use of this work, please see paragraphs 4.2 and 5 of our Terms.
© 2020 The Author(s). This work is published and licensed by Dove Medical Press Limited. The full terms of this license are available at https://www.dovepress.com/terms.php and incorporate the Creative Commons Attribution - Non Commercial (unported, v3.0) License.
By accessing the work you hereby accept the Terms. Non-commercial uses of the work are permitted without any further permission from Dove Medical Press Limited, provided the work is properly attributed. For permission for commercial use of this work, please see paragraphs 4.2 and 5 of our Terms.