")
Back to Journals » Diabetes, Metabolic Syndrome and Obesity » Volume 12
The Role Of Adiponectin, TNF-α And Glutathione In The Pathogenesis And Evolution Of Type 1 Diabetes
Authors Szabo CE , Ilieș RF, Aioanei CS, Catana A, Creț V , Șerban RS , Pop IV
Received 20 June 2019
Accepted for publication 3 October 2019
Published 5 November 2019 Volume 2019:12 Pages 2303—2308
DOI https://doi.org/10.2147/DMSO.S220133
Checked for plagiarism Yes
Review by Single anonymous peer review
Peer reviewer comments 2
Editor who approved publication: Prof. Dr. Juei-Tang Cheng
Csilla Enikő Szabo,1,2 Roxana Flavia Ilieș,3 Casian Simon Aioanei,3 Andreea Catana,3 Victoria Creț,2 Radu Sorin Șerban,1,2 Ioan Victor Pop3
1Department of Pediatrics I, Iuliu Hațieganu University of Medicine and Pharmacy, Cluj-Napoca, Romania; 2Pediatric Clinic I, Pediatric Emergency Hospital, Cluj-Napoca, Romania; 3Department of Medical Genetics, Iuliu Hațieganu University of Medicine and Pharmacy, Cluj Napoca, Romania
Correspondence: Csilla Enikő Szabo
Department of Pediatrics I, Iuliu Hațieganu University of Medicine and Pharmacy, Cluj-Napoca, Romania
Email [email protected]
Introduction: Type 1 diabetes (T1DM) is a chronic autoimmune or idiopathic condition, featuring complex and unique interactions between proteins and enzyme systems. The purpose of the present study is to investigate the role of AdipoQ +276G>T, TNF-α-308G>A, GSTT1/GSTM1 polymorphic variants in the development of T1DM.
Materials and methods: The study is designed as a cross-sectional study, involving 72 diabetic cases and 90 controls. Genotyping was carried out according to specific protocols for the above-mentioned polymorphic variants.
Results: The G allele of AdipoQ was associated with the development of type 1 diabetes (OR 0.577, CI95% 0.336–0.802, p=0.001), similar to the GG and GA genotypes (OR 0.405, CI95% 0.156–0.654, p=0.001 and OR 0.623, CI95% 0.401–0.855, p=0.004). The G allele of TNF-α was marginally associated with the development of type 1 diabetes (OR 0.789, CI95% 0.579–0.956, p=0.005). The presence of the T1 genotype was a strong predictor for type 1 diabetes (OR 3.4, CI95% 1.433–6.243, p<0.001).
Conclusion: The results of our study suggest that G alleles of AdipoQ and TNFα act as a protective factor in T1DM, while the T1 allele for GST could be considered a risk factor for the development of Type 1 diabetes in our study group.
Keywords: adiponectin, TNF-α, glutathion, pcr-rflp, multiplex, type 1 diabetes
Introduction
Type 1 diabetes mellitus (T1DM) is a chronic autoimmune or idiopathic disease which targets the β cells of the pancreas, by way of auto-reactive T-cells, pro-inflammatory cytokines, reactive oxygen species and loss of insulin.1,2 These changes bring forth a life-long need for insulin therapy, with important socioeconomical and quality of life implications. From a genetic point of view, T1DM is characterised by complex and unique interactions between enzyme systems.
Adiponectin is a plasma protein produced by adipose tissue, with a potential role as an insulin-sensitizing agent.3 Its gene is located on chromosome 3q26-27, a locus linked to diabetic nephropathy.4 Low serum adiponectin concentrations (under 10 µg/L) are considered a risk factor for macrovascular complications of persistent hyperglycaemia (as encountered in both Type 1 and Type 2 diabetes).5–7
Glutathione is one of the major systems involved in the detoxification of xenobiotics and reactive oxygen species. Glutathione S transferase (GST) is part of that system, an enzyme which catalyses the conjugation of the toxin with glutathione. It presents in various isoforms, of which we mention the mu (M1) and theta (T1) – these often present a polymorphic homozygous deletion, resulting in a null genotype and a complete absence of enzyme activity.1
Tumor necrosis factor α (TNF α) activates the RTNFα receptors, inducing the apoptosis of autoreactive T cells and the expansion of Treg cells. The α308A polymorphic variant is frequent in diabetic patients, while serum concentrations of TNFα are increased in diabetic patients.8
The purpose of the present research article is to offer information regarding the presented genetic variants in a Romanian pediatric population of patients diagnosed with type 1 diabetes.
Subjects And Methods
Ethics Statement
The present study has been approved by the Iuliu Hațieganu University of Medicine and Pharmacy in Cluj-Napoca, Romania, and the patients’ and their legal representatives’ informed consent was taken, in writing, before inclusion in the study, and was conducted in accordance with the Declaration of Helsinki.
Study Design
The study is a cross-sectional, observational case–control study. The study group includes patients diagnosed with type 1 diabetes mellitus, under or at 18 years of age, under surveillance at the First Pediatrics Clinic of the Pediatric Emergency Hospital Cluj-Napoca-this led to a total of 72 cases: 45% male patients and 55% female patients. Type 1 diabetes mellitus was diagnosed based upon one of the following criteria: Fasting (at least 8 hrs) plasma glucose ≥126 mg/dl measured on more than one occasion, a value of glycated hemoglobin (HbA1C) above 6.5% percent or random venous plasma glucose of more than 200 mg/dl, in a patient presenting classic symptoms of hyperglycemia.9,10 The control group was comprised of patients under or at 18 years of age, admitted to the First Pediatrics Clinic of the Pediatric Emergency Hospital Cluj-Napoca for different complaints that were unrelated to diabetes. Patients diagnosed with diabetes, either type 1 or 2 diabetes mellitus, as well as pre-diabetic states or symptoms indicating diabetes, were excluded from taking part in the control group. The control group was comprised of 90 controls, with 56% males and 44% female participants.
A 10-mL peripheral blood sample was taken on a purple cap K3EDTA vacutainer, and kept at 4°C until DNA extraction was performed, using a commercially available genomic DNA extraction kit (Wizard DNA Extraction Kit, Promega Corporation). Purity and obtained DNA concentration were tested spectrophotometrically, and upon validation, genotyping was carried out.
To determine the total adipokine plasma concentration, fasting venous blood samples were drawn, without the use of anticoagulant, from which the serum was separated through centrifugation. The serum was then processed by the ELISA method for adiponectin, immunoturbidimetric method for alpha 1 antitrypsin and chemiluminescence immunoassay method for TNFα.
Genotyping Of Adiponectin, GSTM And GSTT, TNF-α Polymorphisms
Genotyping for AdipoQ 276 G>T followed a PCR-RFLP protocol, using the following primers: 5ʹ-TCT CTC CAT GGC TGA CAG TG-3ʹ and 5ʹ-AGATGC AGC AAA GCC AAA GT-3ʹ, amplified under the following thermocycling conditions: denaturation for 10 min at 95°C, followed by 35 cycles of denaturation for 30 s at 95°C, annealing for 30 s at 55°C and elongation for 30 s at 72°C, with a final elongation of 7 mins at 72°C. The amplified AdipoQ fragment was digested overnight at 37°C using 5U of Mva1269I (Fermentas MBI, Vilnius, Lithuania) and migrated through a 3% agarose gel (MetaPhor Agarose, Cambrex Bio Science Inc.), distinguishing the following possible genotypes: TT, GT, GG.
Genotyping for glutathione S transferase M1/T1 followed a multiplex PCR protocol, using three sets of primers, as follows:
5ʹ-GAACTCCCTGAAAAGCTAAAGC-3ʹ; 5ʹ- GTTGGGCTCAAATATAGGGTGG- 3ʹand 5ʹ-TTCCTTACTGGTCCTCACATCTC-3ʹ; 5ʹ- TCACCGGATCATGGCCAGCA-3ʹ, as well as an internal amplification marker consisting of β globin, with the primer sequences: 5 ’ - C A A C T T C A T C C A C G T T C A C C - 3 ’ and 5ʹ-GAAGAGCCAAGGACAGGTAC-3ʹ.
100 ng of genomic DNA was amplified in 25 µl reaction mixture, comprised of: 1.5nM MgCl, 20 pmol of each primer, 200 µm of dNTPs and 0.5 units of Taq polymerase.
The mixture was amplified under the following thermocycling conditions: 5 min at 94°C, 35 cycles of 1 min at 94°C, 1 min at 72°C and a final polymerisation step for 10 mins at 72°C. The PCR product was submitted to electrophoresis in a 2% agarose gel (MetaPhor Agarose, Cambrex Bio Science Inc). Lack of amplification signifies a null genotype.
For TNFα, genotyping followed a PCR-RFLP protocol using the following primers: 5ʹ-TCCCCAAAAGAAATGGAGGCAATA-3ʹ and 5ʹ-GGTTTTGAGGGCCATGAGACGTCTGCTGGCTGGGTG-3ʹ. The amplification conditions consisted of 12 mins at 95°C, followed by 35 cycles of denaturation for 30 s at 95°C, primer annealing for 30 s at 60°C, elongation for 1 mins at 72°C and 5 mins for a final elongation at 72°C. The amplified sequences were digested using 5 units of NcoI enzyme (Thermo Fisher Scientific Inc., MA, USA). The resulted fragments were separated on a 3% agarose gel (MetaPhor Agarose, Cambrex Bio Science Inc.); the electrophoretic analysis revealed three banding patterns, corresponding to: A1A1 wild-type homozygous genotype, A1A2 heterozygous type and A2A2 homozygous mutant genotype.
Statistical Analysis
Statistical analysis was performed by the use of SPSS for MacBook software (SPSS, Inc. Chicago, IL). Hardy–Weinberg Equilibrium was measured using the Chi-squared (χ2) test. The continuous variables were presented as mean ± SD and categorical variables as percentages. The Pearson’s χ2 test and phi coefficient compared demographic and clinical data. Serum adiponectin and TNF-alpha concentrations were compared between subgroups using Mann–Whitney U or Student’s t tests and the correlations with continuous variables were calculated by the use of Spearman or Pearson coefficients. The association between HbA1c and other serum parameters was carried out by a multivariate linear regression model. The examined allelic polymorphisms among cases and controls were tested using Fisher’s exact test (OR with 95% confidence intervals). Log-linear analysis was used to determine the susceptibility of GSTM and GSTT polymorphisms for diabetes. A significant difference between groups was considered at a p-value <0.05.
Results
Demographic Study
The characteristics of type 1 diabetic subjects (n=72) regarding demographic and clinical data are presented in Table 1. The control group was composed of 90 healthy individuals with biochemical parameters and clinical data in normal limits. The serum adiponectin and TNF-alpha concentrations were not determined for the control group. There was reported a difference in age mean, but with no influence on the variant genes investigated.
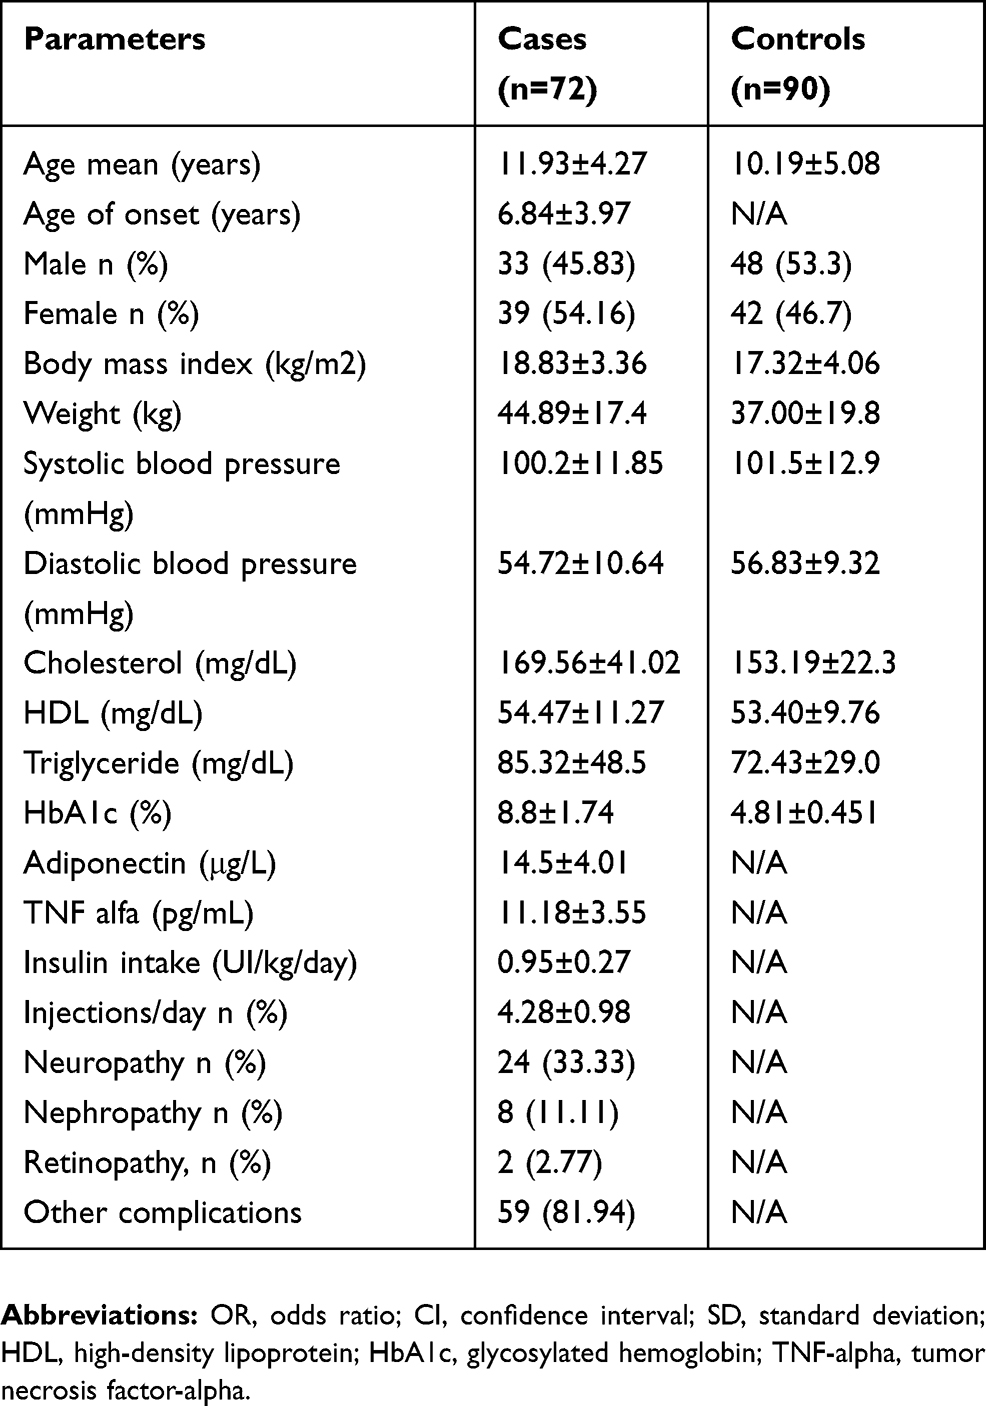 |
Table 1 Biochemical And Demographic Parameters Of The Case Group |
Analyses Of The Variant Genes, Clinical And Serum Parameters
Adiponectin
Analysis of adiponectin serum concentration was higher in men than in women in the diabetic individuals (mean±SD: 14.28±3.78 µg/L than 14.22±3.28 µg/L, p<0.04) and in patients diagnosed with dawn phenomenon than in other patients unrelated to gender (14.25±3.71 µg/L than 13.97±3.45 µg/L, p<0.03). Only 9 (12.5%) diabetic individuals had adiponectin serum levels <10µg/L and with minor corresponding complications related to atherosclerosis.
The serum level of adiponectin correlated positively with HbA1c (r=0.39, p<0.001), and negatively with BMI (r=−0.34, p<0.01), systolic (r=−0.29, p=0.004) and diastolic (r= 0.28, p=0.002) blood pressure. Negative correlations were also found with serum cholesterol and triglyceride concentration (r=−0.55, p=0.03; r=−0.49, p=0.02, respectively); and a positive one with HDL (r=0.8, p<0.001).
Hardy–Weinberg Equilibrium was respected for all the polymorphisms studied. The genotype and allele frequency of 276G>T Adiponectin gene variant can be consulted in Table 2. Serum adiponectin concentration was also higher in GT genotype patients compared to GG and TT genotypes (GT 14.41±3.73 µg/mL, p=0.024; GG 14.21±3.69 µg/mL, p=0.025; TT 14.32±3.75 µg/mL, p=0.021). In the multivariate linear regression model, the association between HbA1c and adiponectin level remained significant after adjustment for age, sex, BMI, presence of GG, GT and GT genotypes [R^2: 0.323, beta: 0.44 (95% CI: 0.111–0.431), p<0.02].
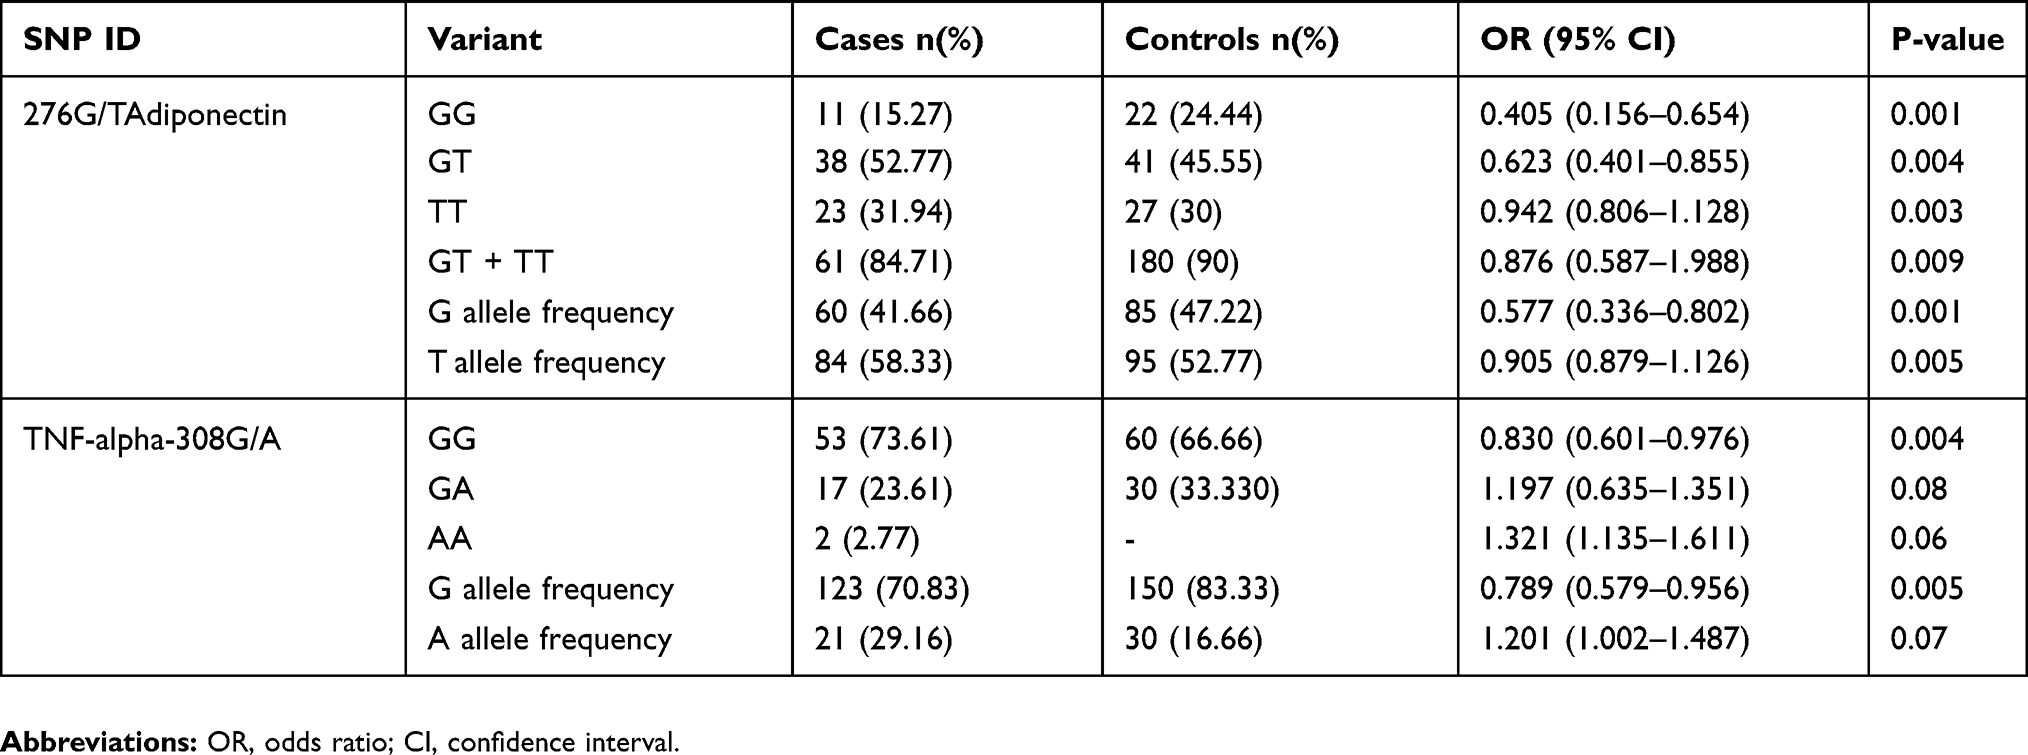 |
Table 2 Genotype Distribution And Allele Frequency Of 276G>T Adiponectin And TNF-Alpha−308G/A In Diabetic And Control Subjects |
The dominant model of Fisher’s exact test for evaluating the risk for type 1 diabetes mellitus predisposition did not reveal any statistical difference for the gene variant carriers of adiponectin 276G>T between the two groups studied (P=0.012). Only the GG genotype does identify slightly increased risk for developing diabetes under the recessive model, but with no significant statistical association (χ2 =2.091, OR=1.104 95% CI=0.696–1.402, P=0.06).
GSTM & GSTT
The risk associated with GSTT analyses revealed that the present genotype T+ (p <0.001) is associated with a predisposition for T1DM, conferring a 3.2-fold elevated risk (Table 3). In addition, GSTT polymorphism through the present genotype revealed an association with increased levels of HbA1c (p=0.031), but no association was shown with blood pressure, both systolic (p=0.01) and diastolic (p=0.02) when compared to the present genotype in diabetic individuals.
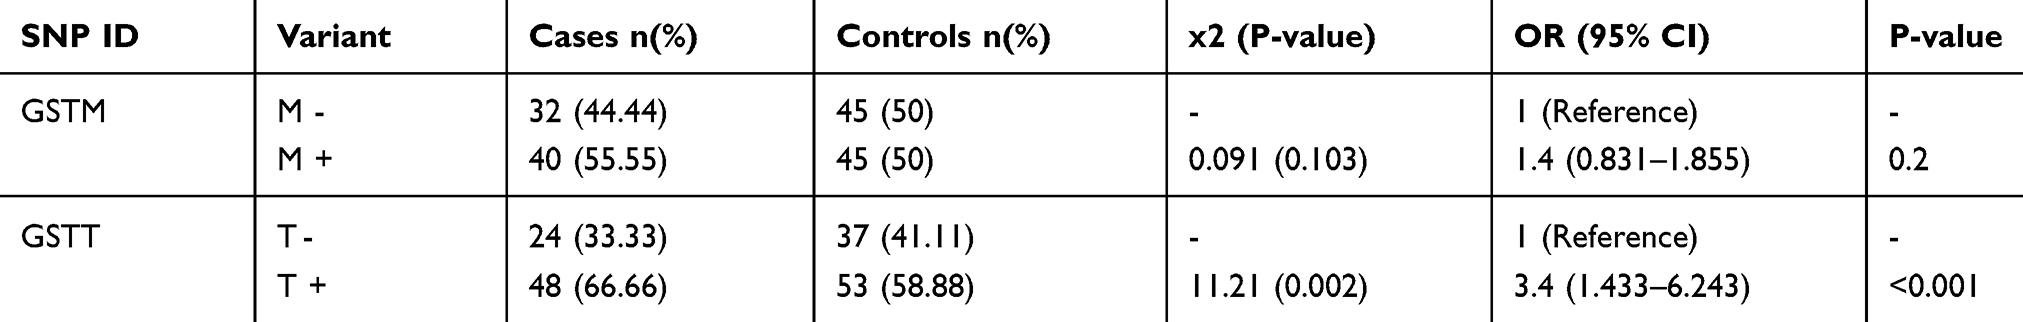 |
Table 3 Genotype Distribution And Frequency Of Alleles In Diabetic And Control Subjects Of GSTM, GTTM. Analysis By Chi-Square And Multiple Logistic Regression To Obtain Adjusted-Odds Ratio Values (OR) And Confidence Intervals (95% CI) |
The genotype (M-/T+) for both groups (31.94% and 27.27%) revealed an elevated predisposition for T1DM (p=0.002), conferring a 3.651-fold elevated risk (p=0.008) (Table 4). The analyses of Log linear showed no interaction between the GSTM and GSTT combined for susceptibility to T1DM (x2=2.01, DF=1, p=0.1) or any isolated effect of GSTM (x2=1.5, DF=2, p = 0.5) and GSTT (x2 = 9.5, DF = 2, p = 0.2).
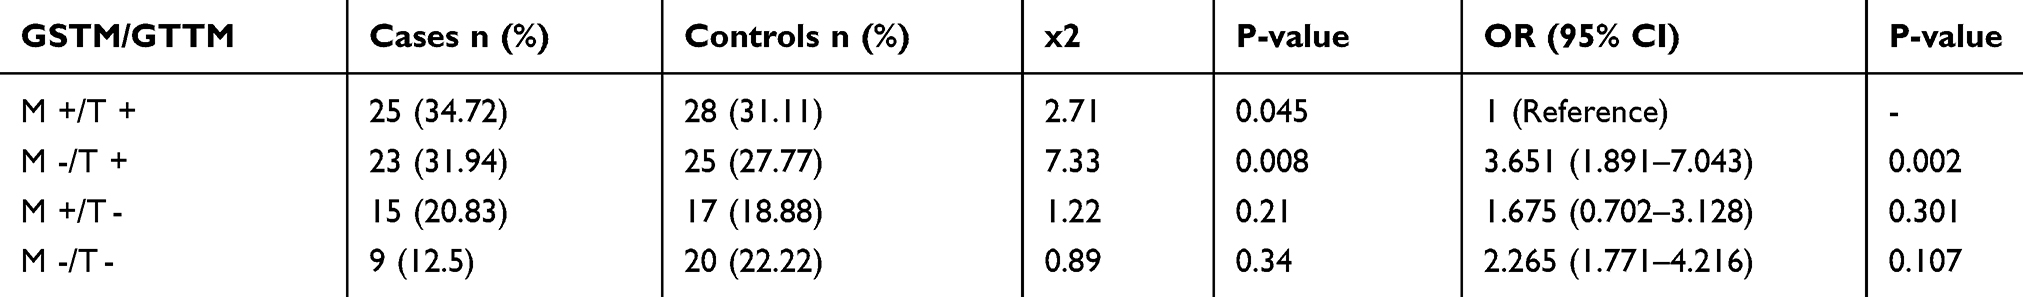 |
Table 4 Distribution Of Genotypic Frequencies For GSTM And GSTT In The Study Population And A Risk Analysis Of T1DM. Analysis By Chi-Square And Multiple Logistic Regression To Obtain Adjusted Odds Ratio Values (OR) And Confidence Intervals (95% CI). Significant Difference Between Groups (P<0.05) |
TNF-Alpha
Controls compared to cases showed a significant higher frequency of TNF-alpha GG genotype (p=0.004, OR=0.830, 95% CI 0.601–0.976) (Table 2). Regarding allele frequencies, the cases revealed a significant increase in the frequency of TNF-alpha allele G (p=0.005, OR 0.789, 95% CI 0.579–0.956). The dominant model of Fisher’s exact test did not reveal any significant increased risk for diabetes regarding heterozygous and mutant genotype (χ2=2.091, OR=1.197 95% CI=0.635–1.351, p=0.08; χ2=3.107, OR=1.321 95% CI=1.135–1.611, p=0.06, respectively). The recessive model did not reach statistical significance at all.
In our case, TNF-alpha GA genotype and corresponding TNF-alpha level correlated positively with adiponectin serum level (r=0.44, p=0.01). The 308G/A TNF-alpha variant gene was associated with a decreased 1.056-fold risk to develop metabolic syndrome (p=0.003); correlating negatively with lipid profile (r=−0.42, p<0.02). TNF-alpha GG genotype correlated positively with HbA1c (r=0.21, p<0.01).
Discussion
Regarding the adiponectin polymorphic variant, both the GG and the GT genotypes seemed to be protective factors against the development of T1DM; indeed, the G allele itself is a protective factor (OR 0.577, CI 95% 0.336-0.0802, p=0.001), with other polymorphisms of the AdipoQ gene having a protective effect for type 1 diabetes, however acting as a risk factor for type 2 diabetes mellitus.4,11 Serum adiponectin concentrations are considered lowered under 10 µg/L – this has been correlated with an increased risk of cardiovascular disease as well as retinopathy in type 2 diabetes mellitus patients. However in type 1 diabetes, the level of adiponectin is above average, with increased adiponectin levels being associated with microvascular complications.3,12,13
The findings for GSTT1/M1 fill in some gaps left by current literature, confirming the M1 null T1 wild type genotype as a risk factor for the development of T1DM, with the T1 wild type allele being a predictive or risk factor for T1DM.14,15 These findings come in disagreement go against some studies stating that the GSTT1 deletion is more frequent in type 1 diabetic patients and that the GSTM1 null genotype is an independent protective factor for type 1 Diabetes.1,16,17
For the TNFα polymorphism, the GG genotype and G allele seem to offer a minor protective effect towards type 1 diabetes, which is contradictory to the data presented by literature.18
The limits of the present study are the small number of subjects included in the study and the incomplete genotype-phenotype association due to the GST genotyping technique glutathione S transferase isoforms that cannot differentiate between homozygous variant genotypes and heterozygous genotype variants. This, alongside regional differences, may justify the discrepancy between data in the literature and the results of our study.
Conclusion
The G allele of AdipoQ, as well as the G allele of TNFα, seems to exhibit a protective effect on the development of type 1 diabetes. The T1 wild-type isoform of GST, as well as the M1 null T1 present genotype, is a risk factor for the development of type 1 diabetes in our population.
Disclosure
The authors report no conflicts of interest in this work.
References
1. Bekris LM, Shephard C, Peterson M, et al. Glutathione-s-transferase M1 and T1 polymorphisms and associations with type 1 diabetes age-at-onset. Autoimmunity. 2005;38(8):567–575.
2. Atkinson MA, Maclaren NK. The pathogenesis of insulin-dependent diabetes mellitus. N Engl J Med. 1994;331:1428. doi:10.1056/NEJM199411243312107
3. Imagawa A, Funahashi T, Nakamura T, et al. Elevated serum concentration of adipose-derived factor, adiponectin, in patients with type 1 diabetes. Diabetes Care. 2002;25(9):1665–1666. doi:10.2337/diacare.25.9.1665
4. Zhang D, Efendic S, Brismar K, Gu HF. Effects of MCF2L2, ADIPOQ and SOX2 genetic polymorphisms on the development of nephropathy in type 1 diabetes Mellitus. BMC Med Genet. 2010;11(1):116. doi:10.1186/1471-2350-11-116
5. Mojiminiyi OA, Abdella NA, Al Arouj M, Ben Nakhi A. Adiponectin, insulin resistance and clinical expression of the metabolic syndrome in patients with Type 2 diabetes. Int J Obes (Lond). 2007;31(2):213–220. Epub 2006 Jun 6. doi:10.1038/sj.ijo.0803355
6. Ouedraogo R, Gong Y, Berzins B, et al. Adiponectin deficiency increases leukocyte-endothelium interactions via upregulation of endothelial cell adhesion molecules in vivo. J Clin Invest. 2007;117(6):1718–1726. doi:10.1172/JCI29623
7. Ohashi K, Ouchi N, Matsuzawa Y. Anti-inflammatory and antiatherogenic properties of adiponectin. Biochimie. 2012;94:2137–2142. doi:10.1016/j.biochi.2012.06.008
8. Lechleitner M, Koch T, Herold M, Dzien A, Hoppichler F. Tumour necrosis factor-alpha plasma level in patients with type 1 diabetes mellitus and its association with glycaemic control and cardiovascular risk factors. Journal of Internal Medicine. 2000;248(1):67–76. doi:10.1046/j.1365-2796.2000.00705.x
9. Mayer-Davis EJ, Kahkoska AR, Jefferies C, et al. ISPAD clinical practice consensus guidelines 2018: definition, epidemiology, and classification of diabetes in children and adolescents. Pediatr Diabetes. 2018;19(Suppl 27):7. doi:10.1111/pedi.2018.19.issue-S27
10. American Diabetes Association Classification and Diagnosis of Diabetes. Diabetes Care. 2017;40(Suppl1):S11–S24. doi:10.2337/dc17-S005
11. Bostrom MA, Freedman BI, Langefeld CD, et al. Association of adiponectin gene polymorphisms with type 2 diabetes in an African American population enriched for nephropathy. Diabetes. 2009;58(2):499–504. doi:10.2337/db08-0598
12. Galler A, Gelbrich G, Kratzsch J, Noack N, Kapellen T, Kiess W. Elevated serum levels of adiponectin in children, adolescents and young adults with type 1 diabetes and the impact of age, gender, body mass index and metabolic control: a longitudinal study. Eur J Endocrinol. 2007;157(4):481–489. doi:10.1530/EJE-07-0250
13. Frystyk J, Tarnow L, Krarup Hansen T, Parving -H-H, Flyvbjerg A. Increased serum adiponectin levels in type 1 diabetic patients with microvascular complications. Diabetologia. 2005;48(9):1911–1918. doi:10.1007/s00125-005-1850-z
14. Bid HK, Konwar R, Saxena M, Chaudhari P, Agrawal CG, Banerjee M. Association of glutathione S-transferase (GSTM1, T1 and P1) gene polymorphisms with type 2 diabetes mellitus in north Indian population. J Postgrad Med. 2010;56(3):176–181. doi:10.4103/0022-3859.68633
15. Vojtková J, Ďurdík P, Čiljaková M, Michnová Z, Turčan T, Babušíková E. The association between glutathione S-transferase T1 and M1 gene polymorphisms and cardiovascular autonomic neuropathy in Slovak adolescents with type 1 diabetes mellitus. J Diabetes Complications. 2013;27(1):44–48. doi:10.1016/j.jdiacomp.2012.07.002
16. Barseem N, Elsamalehy M. Gene polymorphisms of glutathione S-Transferase T1/M1 in Egyptian children and adolescents with Type 1 diabetes mellitus. J Clin Res Pediatr Endocrinol. 2017;9(2):138–143. doi:10.4274/jcrpe.3690
17. Vojtková J, Durdík P, Ciljaková M, Michnová Z, Turcan T, Babusíková E. The association between gene polymorphisms of glutathione S-transferase T1/M1 and type 1 diabetes in Slovak children and adolescents. Cent Eur J Public Health. 2013;21(2):88–91. doi:10.21101/cejph.a3807
18. Allam G, Nasr A, Talaat IM, et al. Association between cytokine genes polymorphisms and type 1 diabetes: a case-control study on Saudi population. Immunological Investigations. 2018;47(3):229–240. doi:10.1080/08820139.2017.1416398
 © 2019 The Author(s). This work is published and licensed by Dove Medical Press Limited. The full terms of this license are available at https://www.dovepress.com/terms.php and incorporate the Creative Commons Attribution - Non Commercial (unported, v3.0) License.
By accessing the work you hereby accept the Terms. Non-commercial uses of the work are permitted without any further permission from Dove Medical Press Limited, provided the work is properly attributed. For permission for commercial use of this work, please see paragraphs 4.2 and 5 of our Terms.
© 2019 The Author(s). This work is published and licensed by Dove Medical Press Limited. The full terms of this license are available at https://www.dovepress.com/terms.php and incorporate the Creative Commons Attribution - Non Commercial (unported, v3.0) License.
By accessing the work you hereby accept the Terms. Non-commercial uses of the work are permitted without any further permission from Dove Medical Press Limited, provided the work is properly attributed. For permission for commercial use of this work, please see paragraphs 4.2 and 5 of our Terms.