")
Back to Journals » OncoTargets and Therapy » Volume 9
The relationship between the expression of USP22, BMI1, and EZH2 in hepatocellular carcinoma and their impacts on prognosis
Authors Zhai R, Tang F, Gong JH, Zhang J, Lei B, Li B, Wei YC, Liang XS, Tang B, He SQ
Received 20 April 2016
Accepted for publication 6 July 2016
Published 24 November 2016 Volume 2016:9 Pages 6987—6998
DOI https://doi.org/10.2147/OTT.S110985
Checked for plagiarism Yes
Review by Single anonymous peer review
Peer reviewer comments 2
Editor who approved publication: Professor Min Li
Run Zhai,1,2,* Fang Tang,3,* Jianhua Gong,1,2,* Jing Zhang,1,2 Biao Lei,1,2 Bo Li,2 Yangchao Wei,1,2 Xingsi Liang,1 Bo Tang,1,2 Songqing He1,2
1Laboratory of Liver Injury and Repair Molecular Medicine, Guilin Medical University, Guilin, Guangxi, People’s Republic of China; 2Department of Hepatobiliary Surgery, Affiliated Hospital, Guilin Medical University, Guilin, Guangxi, People’s Republic of China; 3Pathology Department, Affiliated Hospital, Guilin Medical University, Guilin, Guangxi, People’s Republic of China
*These authors contributed equally to this work
Abstract: Recent studies have shown that deubiquitination plays a key role in tumor progression, metastasis, resistance to chemotherapy drugs, and prognosis. In this study, we investigated the effects of the deubiquitinating enzyme USP22 on the expression of the drug-resistance genes BMI1 and EZH2 in hepatocellular carcinoma (HCC) and on prognosis. Downregulation of USP22 expression with interference ribonucleic acid in resistant HCC cell lines with high USP22 expression resulted in decreased BMI1 expression, but had no effect on EZH2 expression. USP22, BMI1, and EZH2 were highly expressed in HCC tissue, and the expression levels were positively correlated with tumor grade and clinical stage. Correlation analysis showed that USP22 expression was positively correlated with that of BMI1. Kaplan–Meier analysis showed that high levels of USP22 and BMI1 expression were associated with poor overall survival and relapse-free survival in all of the cases and in patients treated with transcatheter arterial chemoembolization. These results suggested that high levels of USP22 expression played an important role in drug resistance to chemotherapeutic drugs in HCC patients by upregulating the expression of BMI1; therefore, coexpression of USP22 and BMI1 may become a new predictor for HCC prognosis and may help guide clinical treatment.
Keywords: hepatocellular carcinoma, USP22, BMI1, EZH2
Introduction
Hepatocellular carcinoma (HCC) is the sixth-most common malignant tumor worldwide, and approximately 600,000 new cases are diagnosed each year.1 HCC is highly malignant and progresses rapidly. In addition, due to the lack of methods for early diagnosis, approximately 70% of patients will relapse or have metastases within 5 years, even with radical surgical treatment. The development of HCC is a multistage, multistep process, and the exact mechanism remains unknown. Many genes are involved in the development, progression, invasion, and metastasis of HCC. To significantly improve the treatment outcome of HCC, we must identify effective targets for HCC prevention and treatment based on a deeper understanding of the relationship between multiple genes and the relationship between these genes and the development and progression of HCC.
BMI1 is a member of the polycomb group (PcG) of proteins.2 BMI1 inhibits CDKN2A (a gene encoding the tumor suppressors p16INK4a and p19Arf), and induces telomerase activity to regulate cell-cycle progression, apoptosis, senescence, and immortalization.3,4 A large number of studies have shown that BMI1 is overexpressed in many human malignancies, including breast cancer,5 pancreatic cancer,6 and HCC.7–9 BMI1 is closely associated with the development and progression of these cancers, and often indicates a poor prognosis. Drosophila EZH2, a member of the PcG family, is a cancer-associated protein with histone-methyltransferase activity. It catalyzes trimethylation of lysine 27 of histone 3 (H3K27me3) to modify and mediate gene silencing, and it is involved in X-chromosome inactivation, cell differentiation, and embryonic development regulation.10 Recent studies have shown that EZH2 is associated with the invasion of many human cancers, including breast cancer11 and prostate cancer.12 EZH2 overexpression is closely associated with the progression and poor prognosis of human cancers.13
USP22, a member of the deubiquitinating enzyme family, is a subunit of the human Spt-Ada-Gcn5-acetyltransferase complex,14 and it plays an important role in tumor progression, metastasis, resistance to chemotherapy drugs, and the prognosis of cancer patients. USP22 is expressed in normal human tissues, including heart muscle, skeletal muscle, and the lungs, and its expression level is significantly higher in malignant tissues.15 Glinsky et al used genomic technologies to identify the signaling pathways known as “polycomb/cancer stem cell signals” that can predict tumor invasiveness and resistance.16,17 As members of the polycomb/cancer stem cell signal group, USP22 and BMI1 are activated in many cancer tissues. Liu et al showed that the expression of USP22 and BMI1 is closely correlated in colorectal cancer tissues.18 Moreover, many studies have demonstrated that the expression of EZH2 is correlated with that of BMI1 in tumor tissues. However, at present, studies of the correlation between the expression of BMI1 and USP22 and between the expression of EZH2 (another member of the PcG family) and USP22 in HCC tissue are lacking. In this study, we investigated this topic, as well as the relationship between the expression of USP22, BMI1, and EZH2 and the clinical characteristics and prognosis of HCC patients.
Materials and methods
Paraffin-embedded HCC-tissue sections
This study obtained approval from the ethics committee of the Affiliated Hospital of Guilin Medical College. The clinical testing set number is 100. All subjects provided written informed consent, and the anonymity and confidentiality of their personal data were ensured. In this study, all 167 tissue specimens were from HCC patients (n=167, 25–74 years of age) who had undergone radical surgery at the Department of Hepatobiliary and Pancreatic Surgery of Guilin Medical College from 2006 to 2008. None of the patients received palliative surgery, chemotherapy, or radiotherapy before radical surgery. All of the patients were diagnosed by postoperative pathological examination, and complete clinical data were collected. Each specimen contained cancerous tissue and paracancerous tissue. The basic information obtained for these clinical cases included age, sex, the state of virus infection of comorbid hepatitis, cirrhosis of the surrounding liver tissue, AFP, tumor size, tumor grade, intravascular thrombus, and tumor stage. Each HCC was graded according to the Edmondson–Steiner grading system and staged according to the pTNM (pathologic tumor, node, metastasis) classification criteria of the International Union Against Cancer. All 167 patients were followed up for 5 years after discharge by computed tomography and ultrasonography every 6 months.
Fresh cancerous and paracancerous HCC tissue
Forty specimens of cancerous tissue and 40 specimens of paracancerous tissue were taken from the HCC patients and stored in liquid nitrogen for subsequent laboratory testing.
Cell culture and RNA interference
The fluorouracil (5-FU)-resistant HCC cell line Bel/Fu was cultured in Roswell Park Memorial Institute 1640 medium containing 5% horse serum (HyClone, Logan, UT, USA), 20 ng/mL EGF, 10 μg/mL insulin (Sigma-Aldrich Co., St Louis, MO, USA), 0.5 μg/mL hydrocortisone (Sigma-Aldrich), 100 ng/mL cholera toxin (Sigma-Aldrich), 50 U/mL penicillin, and 50 mg/mL streptomycin. The cultures were maintained at 37°C in a 5% CO2 atmosphere and passaged every 2–3 days. USP22-specific small interfering RNA (siRNA) was designed and used to transfect the Bel/Fu cell line, which was then harvested and stored in a −80°C refrigerator for subsequent laboratory testing.
Immunohistochemistry
The specimens were fixed in 10% formalin, embedded in paraffin, and sliced into 4 μm sections. After being rendered transparent with xylene and hydrated with ethanol, the slides were incubated in 0.3% hydrogen peroxide solution at room temperature for 10 minutes to inactivate endogenous peroxidase, and the antigens were repaired at high pressure in ethylenediaminetetraacetic acid, pH 8. Next, antibodies to USP22 (1:100), BMI1 (1:100), and EZH2 (1:50) were added, and the slides were incubated at room temperature for 1 hour. After a phosphate-buffered saline wash, a secondary antibody was added, and the slides were incubated at room temperature for 30 minutes, followed by diaminobenzidine staining and hematoxylin counterstaining. Then, the slides were dehydrated, rendered transparent, and mounted. Phosphate-buffered saline was used in place of primary antibodies as a negative control. Testis tissue, nasopharyngeal epithelial tissue, and colon tissue were used as the positive control tissues for USP22, BMI1, and EZH2, respectively.
Two pathologists independently reviewed the immunohistochemical staining results. USP22, BMI1, and EZH2 were detected in the nucleus and the cytoplasm as brown particles. Based on the ratio of USP22-, BMI1-, and EZH2-positive cells and the intensity of staining, the rating criteria were 1) no positive cells, 0; positive cells <30%, 1+; positive cells 30%–60%, 2+; and positive cells >60%, 3+; and 2) no staining, 0; light yellow, 1+; yellow, 2+; and brown, 3+. The total score varied between 0 and 6 (intensity of staining + ratio of positive cells).19
Receiver-operating characteristic (ROC) curves were fit using USP22, BMI1, and EZH2 training sets in HCC patients as follows:20 the sensitivity and specificity of each training set were calculated based on the USP22, BMI1, and EZH2 immunohistochemical scores and the prognosis of each patient. Then, the sensitivity was used as the y-axis and the specificity as the x-axis to plot the calculated values of each patient on the graph. ROC curves were generated by connecting all of the dots. Next, the minimum-distance method was used to determine the optimal cutoff point on the curves, which was the cutoff point (with the cutoff value) for the high and low expression of USP22, BMI1, and EZH2.
Western blot analysis
The frozen tissue specimen (0.1 g) was added to lysis buffer (1 mL of radioimmunoprecipitation assay lysis buffer [Beyotime Biotechnology Co Ltd, Shanghai, People’s Republic of China], pipetted and mixed with 10 μL of phenylmethylsulfonyl fluoride). A sonicator (100 W) was used to homogenize the tissue specimen by applying 30 cycles of a 3-second burst and a 5-second interval. The homogenized tissue specimen was allowed to sit at room temperature for 10 minutes, and was then centrifuged at 4°C for 5 minutes to collect the supernatant. Protein concentrations were determined using the Bradford method. Each protein sample was added to 5× sodium dodecyl sulfate–polyacrylamide gel electrophoresis (SDS-PAGE) protein-loading buffer (KGI Biotechnology Development Co. Ltd., Nanjing, People’s Republic of China) and boiled for 5 minutes. After analysis by 12% SDS-PAGE, the protein samples were transferred to polyvinylidene difluoride membranes (Immobilon; EMD Millipore, Billerica, MA, USA), and blocked in 5% skim milk at 4°C overnight. After being washed with TBST (a mixture of Tris-buffered saline and Tween 20), the membrane was incubated with primary antibodies at 37°C for 1 hour. After another TBST wash, the membrane was incubated with a secondary antibody at 37°C for 1 hour and then washed with TBST again. According to the instructions for the enhanced chemiluminescence kit (Beyotime Biotechnology), equal volumes of the reagents A and B (1 mL of each) were mixed on a plastic wrap. The membrane was placed in full contact with the mixture (with the protein side facing down) for 1 minute, and then taken to the darkroom, and exposed to X-ray film in a film holder. ImageJ software was used to analyze and process the scanned images.
RNA extraction and RT-PCR
Total RNA was extracted using Trizol, and the concentration of each total RNA sample was determined using a spectrophotometer (SmartSpec Plus; Bio-Rad Laboratories Inc., Hercules, CA, USA). The USP22, BMI1, and EZH2 primers were synthesized by Jurassic/abi 3900 (Thermo Fisher Scientific, Waltham, MA, USA). The primers used for amplification were as follows: upstream BMI1 primer, 5′-TTCATTTTCTGCTGAACGACT-3′; downstream BMI1 primer, 5′-AGGTGGGGATTTAGCTCAGTG-3′; upstream EZH2 primer, 5′-GTTTGTTGGCGGAAGCGTGTAA-3′; downstream EZH2 primer, 5′-GATTGGAACTAAACATACTCTT-3′; upstream USP22 primer, 5′-AGCCTGCATCTTGTCTCGTC-3′; and downstream USP22 primer, 5′-AACAATGCACATCCTTCTAC-3′. Reverse transcription (RT) was performed using the FastQuant complementary DNA (cDNA) first-strand synthesis kit (Tiangen Biotech Co. Ltd., Beijing, People’s Republic of China), strictly following the instructions. The polymerase chain reaction (PCR) conditions were as follows: denaturation at 94°C for 3 minutes, 30 cycles of 94°C for 30 seconds, 55°C for 30 seconds, and 72°C for 1 minute, followed by extension at 72°C for 5 minutes. Following electrophoresis on 1.5% agarose gels, the PCR products were scanned and analyzed using the Box Chemi XR5 gel-imaging system (version 1.2.5.0).
qRT-PCR
Quantitative RT-PCR (qRT-PCR) reactions were performed to assess gene expression. An RNeasy Plus Mini kit (Qiagen NV, Venlo, the Netherlands) was used to extract total RNA from HCC specimens. RNA was quantified in a 2100 Bioanalyzer (Agilent Technologies, Santa Clara, CA, USA). Total RNA was added to the total RNA-reaction system (20 μL/1 mL) and reverse-transcribed into cDNA using a high-throughput cDNA RT kit (Thermo Fisher Scientific). For qRT-PCR, SYBR Premix Ex Taq (Takara Bio Inc., Kusatsu, Japan) was used according to the manufacturer’s instructions. The PCR products were analyzed in a GeneAmpV R 7300 sequence-detection system (Thermo Fisher Scientific). The primers used for amplification were as follows: upstream BMI1 primer, 5′-TTCATTTTCTGCTGAACGACT-3′; downstream BMI1 primer, 5′-AGGTGGGGATTTAGCTCAGTG-3′; upstream EZH2 primer, 5′-GTTTGTTGGCGGAAGCGTGTAA-3′; downstream EZH2 primer, 5′-GATTGGAACTAAACATACTCTT-3′; upstream USP22 primer, 5′-AGCCTGCATCTTGTCTCGTC-3′; and downstream USP22 primer, 5′-AACAATGCACATCCTTCTAC-3′.
Xenografts in nude mice
For the animal experiment, approval for the protocol was obtained from the ethics committee of Guilin Medical College. All animal-handling procedures were performed according to the Guide for the Care and Use of Laboratory Animals of the National Institutes of Health and followed the guidelines of the ethics committee of Guilin Medical college. Nude mice (40 male mice, 6–8 weeks old, weighing approximately 20 g) were purchased from the Experimental Animal Center of Guilin Medical College. The mice were randomly assigned to one of four groups, with ten mice in each group. 5-FU-resistant Bel/Fu human HCC cells were divided into three groups: transfected Bel/Fu cells with stable expression of siUSP22, untransfected Bel/Fu cells, and Bel/Fu cells transfected with a negative oligonucleotide. The cells were injected into the right side of the back of each nude mouse. The mice also received 5-FU treatment. The impact of USP22 downregulation on the growth of the xenografts in the nude mice was observed, and tumor growth was monitored and measured on days 7, 14, 21, and 28. The nude mice were euthanized by breaking their necks 4 weeks later, and subcutaneous xenograft tissues were taken under sterile conditions for subsequent testing.
Statistical analysis
SPSS 18.0 software (SPSS Inc., Chicago, IL, USA) was used for statistical analyses. The χ2 test was performed to assess the relationship between gene expression and clinical characteristics. The Spearman test was performed to analyze the correlations among USP22, BMI1, and EZH2. Survival curves were plotted using the Kaplan–Meier method and analyzed with a log-rank test. The Cox proportional hazard model was used to determine independent factors affecting survival. The significance level was set at α=0.05, and P<0.05 was considered statistically significant.
Results
Expression of USP22, BMI1, and EZH2 in cancerous and paracancerous HCC tissue
RT-PCR, q-PCR, immunohistochemistry, and Western blot analyses were performed to detect the expression of USP22, BMI1, and EZH2 in HCC cancerous and paracancerous tissues. USP22, BMI1, and EZH2 messenger RNAs (mRNAs) were highly expressed in HCC cancerous tissues and downregulated in paracancerous tissues (Figure 1A). The q-PCR and RT-PCR results were consistent (Figure 1B). In addition, immunohistochemical staining was performed to detect the expression of USP22, BMI1, and EZH2 proteins in HCC cancerous and paracancerous tissues. The results confirmed that USP22, BMI1, and EZH2 were highly expressed in HCC cancerous tissues and downregulated in paracancerous tissues (Figure 1C). Western blot analysis showed the same results as those generated by immunohistochemical staining (Figure 1D).
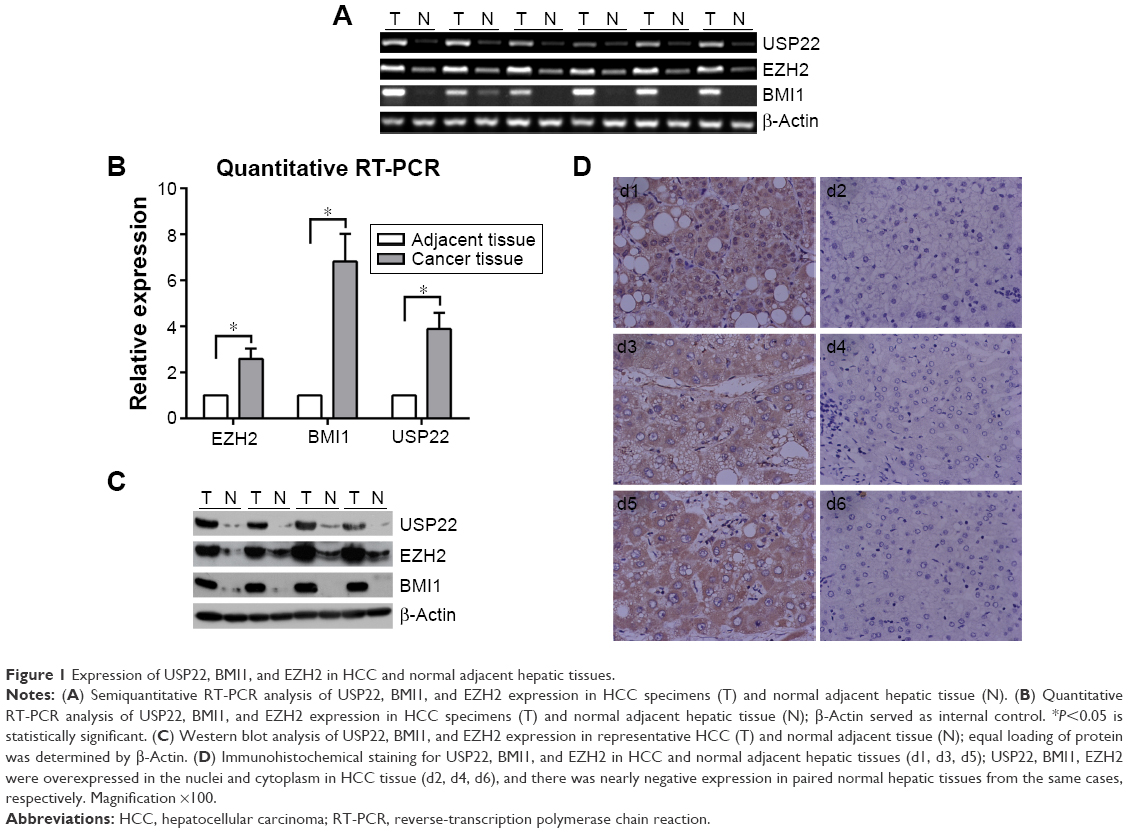 | Figure 1 Expression of USP22, BMI1, and EZH2 in HCC and normal adjacent hepatic tissues. |
ROC curves and cutoff values of USP22, BMI1, and EZH2
To analyze the relationship between USP22, BMI1, EZH2, and HCC prognosis, we used the training sets to fit ROC curves and to determine the cutoff points of the expression of USP22, BMI1, and EZH2. The results showed that for USP22, the cutoff point was 5.65 (P<0.001, Figure 2A) for the analysis of overall survival (OS), and it was 5.75 (P<0.001, Figure 2B) for the analysis of recurrence-free survival (RFS). Therefore, we selected 5 (>5 vs ≤5) as the cutoff point for USP22 expression and divided the patients into high and low USP22-expression groups accordingly for prognostic analysis. The ROC curves also showed that 5 was the cutoff point for BMI1 and EZH2; the patients were divided into high and low BMI1- and EZH2-expression groups accordingly (data not shown).
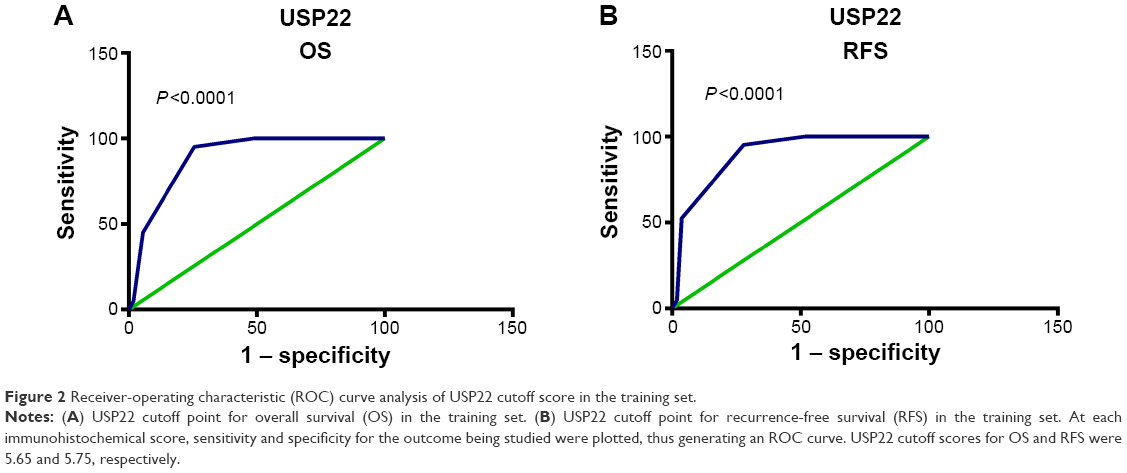 | Figure 2 Receiver-operating characteristic (ROC) curve analysis of USP22 cutoff score in the training set. |
Correlations among USP22, BMI1, and EZH2 and relationships to clinical characteristics of HCC
Among the 175 HCC patients in this study, 65 (32.6%), 56 (18.3%), and 93 (38.3%) patients showed significantly higher expression of USP22, BMI1, and EZH2, respectively, than that observed in the corresponding paracancerous tissues. Moreover, we found that high USP22 expression was often associated with high BMI1 expression in HCC patients. Correlation analysis showed that USP22 and BMI1 were significantly positively correlated in the training sets (P<0.001, Table 1) and in the experimental groups (P<0.001, Table 1), whereas no correlation existed between USP22 and EZH2 in the training sets (P=0.062, Table 1) or in the experimental groups (P=0.115, Table 1). For the experimental groups, expression of USP22 was positively correlated with tumor grade (P=0.012, Table 1), clinical stage (P=0.041, Table 1), and tumor number (P<0.001, Table 1). For the training set, the expression of BMI1 was also positively correlated with tumor grade and clinical stage (P=0.231 and P=0.637), but EZH2 was positively correlated only with clinical stage (P=0.031) and was unrelated to tumor grade (P=0.870). USP22, BMI1, and EZH2 were unrelated to other clinical indicators, including age, sex, tumor size, and AFP.
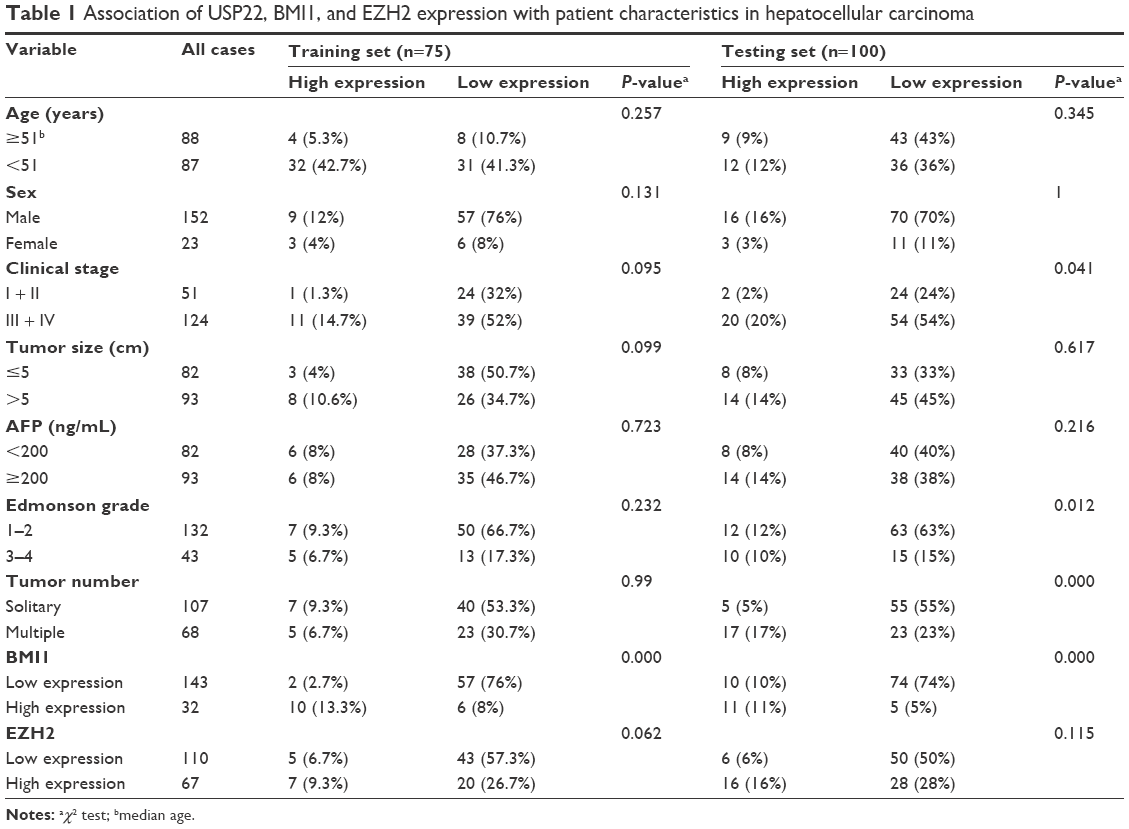 | Table 1 Association of USP22, BMI1, and EZH2 expression with patient characteristics in hepatocellular carcinoma |
Relationships among USP22, BMI1, EZH2, and prognosis
Univariate survival analysis of each indicator (USP22, BMI1, EZH2) showed that for the experimental groups, OS and PFS were significantly shorter in patients with high USP22, BMI1, or EZH2 expression than in those with low USP22, BMI1 or EZH2 expression (P<0.05, Figures 3–5A; P<0.05, Figures 3–5B). Similarly, when all of the patients were considered, high USP22, BMI1, or EZH2 expression was associated with a poor prognosis (P<0.05 for both OS and PFS, Figures 3–5C and D).
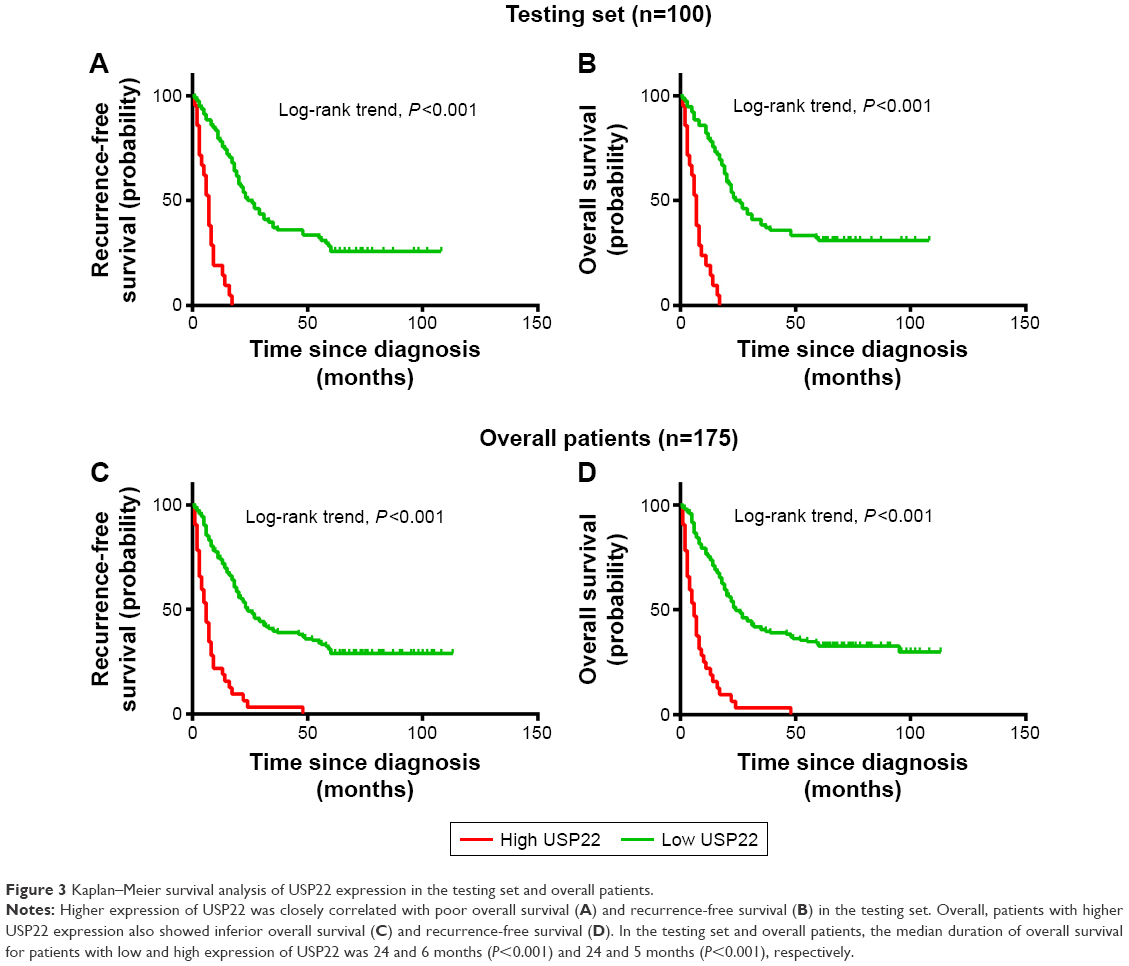 | Figure 3 Kaplan–Meier survival analysis of USP22 expression in the testing set and overall patients. |
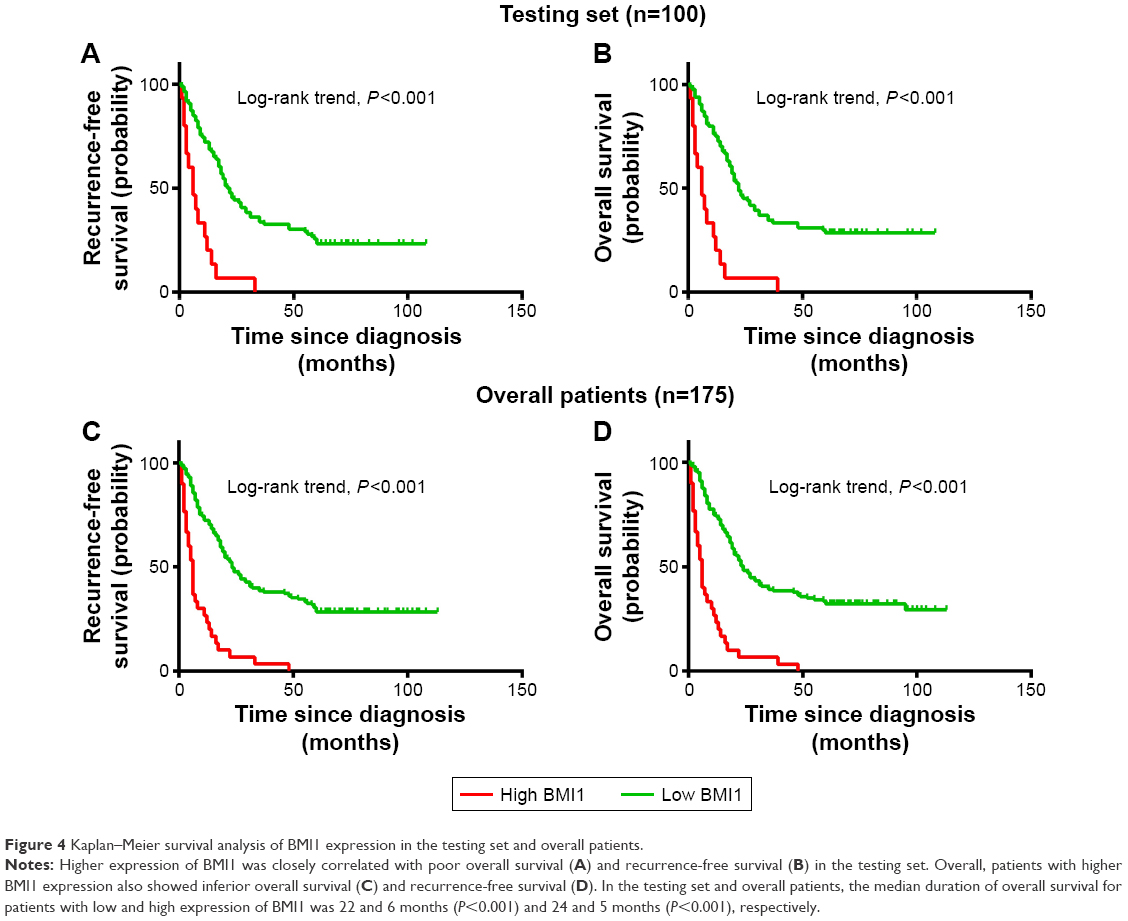 | Figure 4 Kaplan–Meier survival analysis of BMI1 expression in the testing set and overall patients. |
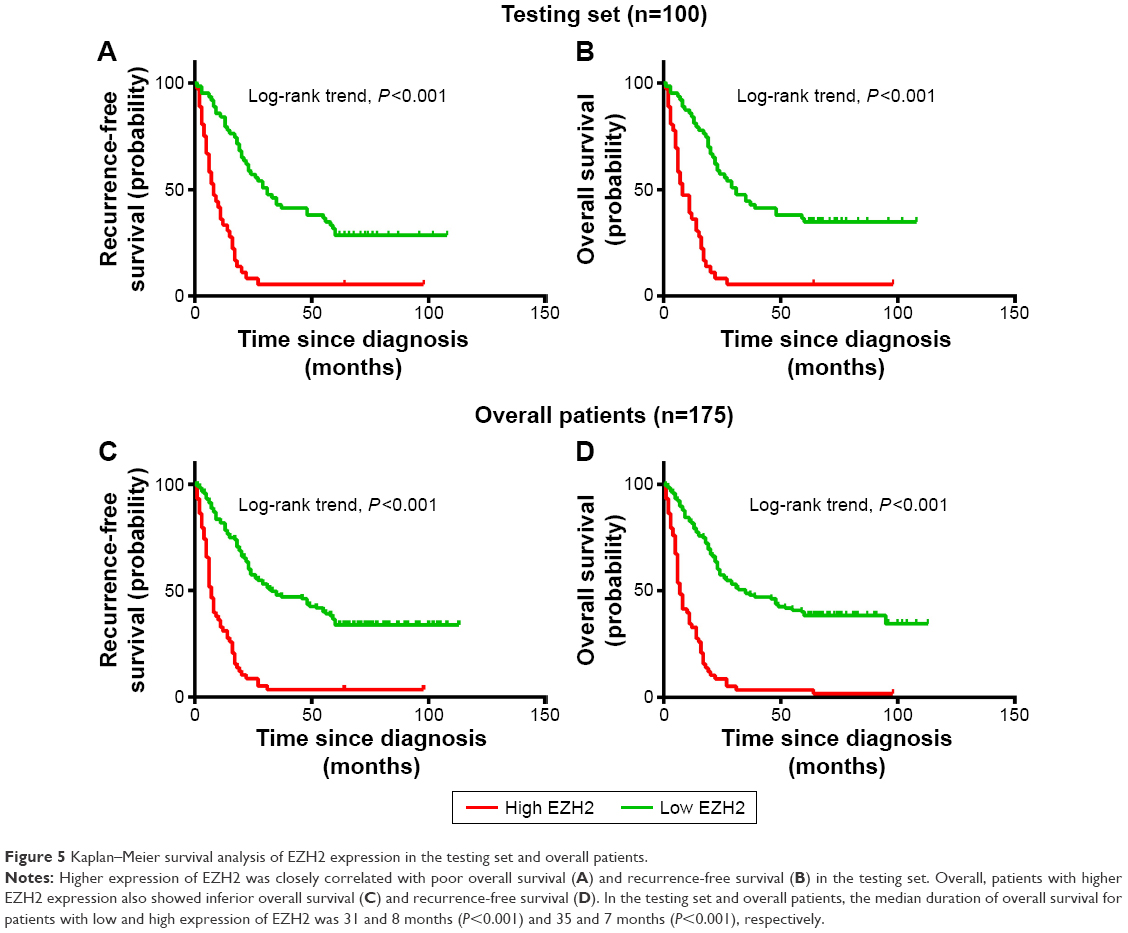 |
Figure 5 Kaplan–Meier survival analysis of EZH2 expression in the testing set and overall patients. |
Relationships among coexpression of USP22, BMI1, EZH2, and prognosis
The patients were divided into four groups according to the coexpression patterns of USP22, BMI1, and EZH2: low expression of all three indicators, high expression of only one indicator, low expression of only one indicator, and high expression of all three indicators. Survival analysis showed that for the experimental groups, RFS and OS were significantly shorter in patients with high coexpression of USP22, BMI1, and EZH2 than in those with high USP22, BMI1, or EZH2 expression and those with low coexpression of USP22, BMI1, and EZH2 (P<0.001, Figure 6A; P<0.001, Figure 6B). Similarly, when all of the patients were considered, high coexpression of USP22, BMI1, and EZH2 was associated with a poor prognosis (P<0.001 for both RFS and OS, Figure 6C and D).
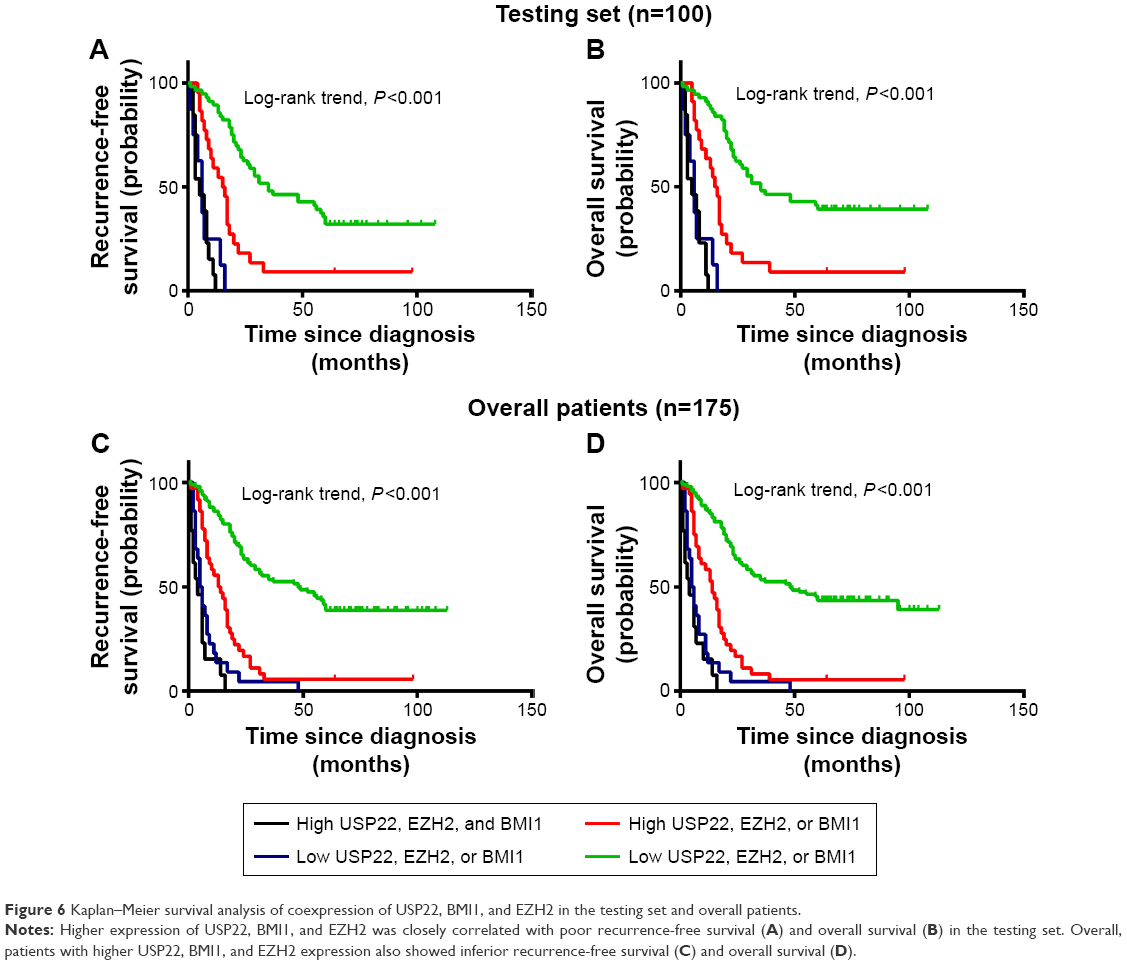 | Figure 6 Kaplan–Meier survival analysis of coexpression of USP22, BMI1, and EZH2 in the testing set and overall patients. |
Relationship between coexpression of USP22 and BMI1 and prognosis in HCC patients receiving TACE
Survival analysis of 43 HCC patients receiving transcatheter arterial chemoembolization (TACE) showed that the RFS and OS of patients with coexpression of USP22 and BMI1 were significantly shorter than the RFS and OS of those with low USP22 or BMI1 expression and those with low coexpression of USP22 and BMI1 (P<0.001, Figure 7A; P<0.01, Figure 7B).
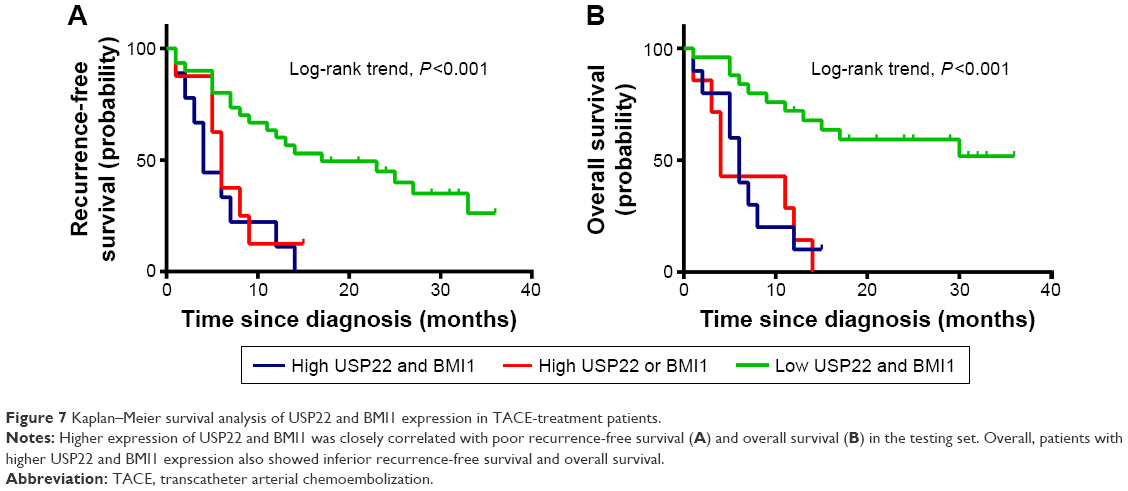 | Figure 7 Kaplan–Meier survival analysis of USP22 and BMI1 expression in TACE-treatment patients. |
Expression of BMI1 and EZH2 after RNA interference of USP22 expression in the 5-FU-resistant HCC cell line Bel/Fu
USP22 sequence-specific siRNA was transfected into the 5-FU-resistant HCC Bel/Fu cell line to silence USP22 expression, and Western blot analysis was performed to detect expression of BMI1 and EZH2. BMI1 expression was significantly downregulated in the USP22 siRNA group, with no significant change in EZH2 expression (Figure 8).
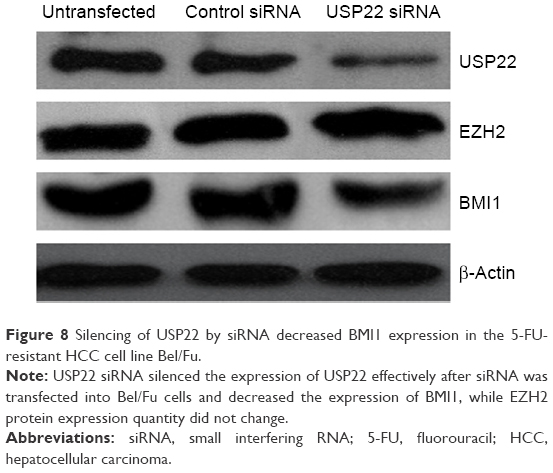 | Figure 8 Silencing of USP22 by siRNA decreased BMI1 expression in the 5-FU-resistant HCC cell line Bel/Fu. |
Development of subcutaneous xenografts in nude mice
After the Bel/Fu cells were injected into nude mice, the mean diameter of the subcutaneous xenografts that developed was 1.5 cm, whereas for mice injected with Bel/Fu cells with stable expression of USP22 siRNA, the mean diameter was smaller (1.4 cm, n=6, P<0.05, Figure 9); after the mice injected with Bel/Fu cells were treated with 5-FU, the mean diameter of xenografts was smaller (1.2 cm, n=6, P<0.05, Figure 9); after the mice injected with Bel/Fu cells with stable expression of USP22 siRNA were treated with 5-FU, the mean diameter of xenografts was 0.9 cm, significantly smaller than that observed in mice injected with Bel/Fu cells alone (n=6, P<0.05, Figure 9).
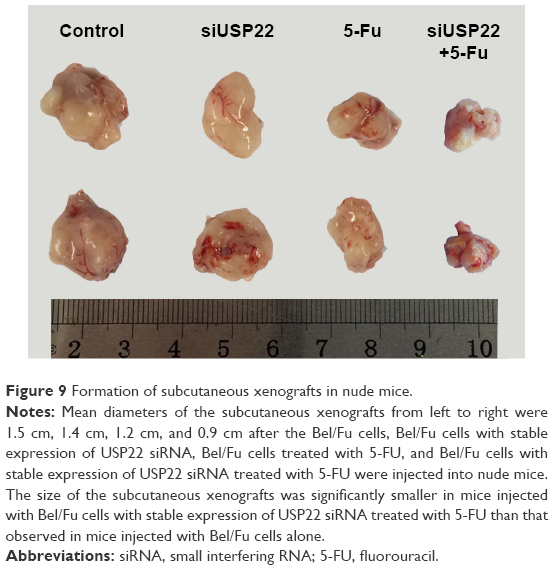 | Figure 9 Formation of subcutaneous xenografts in nude mice. |
Discussion
USP22, a deubiquitinating enzyme, plays an important role in tumor malignancy, metastasis, and prognosis.21–23 Previous studies have shown high USP22 expression in many cancer tissues. Many studies have shown that the expression level of USP22,24 BMI1,7–9,25 or EZH28,26 is higher in HCC tissues than in normal or paracancerous tissues. Our study showed that USP22, BMI1, and EZH2 were highly expressed in HCC tissue. Further analysis of the relationship between the indicators and clinical characteristics showed that expression of USP22, BMI1, and EZH2 in HCC tissue was positively correlated with tumor grade and clinical stage. Kaplan–Meier analysis showed that high coexpression of USP22, BMI1, and EZH2 was associated with shorter OS and RFS. These results suggested that high coexpression of USP22, BMI1, and EZH2 was associated with more malignant and progressive HCC and poorer prognosis, which may be related to deubiquitinating modification of substrate target molecules by USP22 and the role of EZH2 in maintaining cells in a dedifferentiated stage.27
Both USP22 and BMI1 are members of the polycomb/cancer stem cell signal family. Hu et al showed that in the colon cancer cell line HCT116, USP22 exerted its role by regulating the BMI1-regulated AKT-signaling pathway in cells in the G1–S phase.28 Our study showed that high USP22 expression was often associated with high BMI1 expression in HCC patients, and correlation analysis showed that USP22 expression was positively correlated with BMI1 expression. In the 5-FU-resistant HCC cell line Bel/Fu (with a high level of USP22 expression), after USP22 expression was downregulated with RNA interference, BMI1 expression was also downregulated, while EZH2 expression remained unchanged. Kaplan–Meier analysis showed that high coexpression of USP22 and BMI1 was associated with shorter OS and RFS in TACE-treated patients, suggesting that high USP22 expression increased HCC resistance to chemotherapy drugs, which may be related to USP22-related regulation of BMI1 expression in tumor cells. In animal experiments, the xenografts were slightly smaller in nude mice injected with Bel/Fu cells in which USP22 expression was downregulated by RNA interference than in those injected with Bel/Fu cells in which USP22 expression was not downregulated. After the mice injected with Bel/Fu cells with siRNA interference of USP22 expression were treated with 5-FU, the size of the subcutaneous xenografts significantly decreased, suggesting that downregulation of USP22 expression mitigated 5-FU resistance and increased the sensitivity of HCC to chemotherapy drugs, which may be related to the physiological function of USP22 to form a complex with BMI1. USP22, and BMI1 form a polyprotein complex that acts on its target homoeotic (Hox) gene cluster. The Hox genes play decisive roles in determining the directional differentiation and proliferation of cells and the regulation of the development of tissues and organs. The USP22–BMI1 protein complex modifies chromosomes to maintain the silencing of Hox genes, thereby increasing tumor resistance. At present, in addition to this study, there is no literature about a USP22-specific role in multiresistant reports. In prophase research work, in both mRNA and protein levels, relative USP22-expression level was significantly higher than in the human liver tissue adjacent to carcinoma and normal liver tissues, and the relative expression level in the human liver cell line USP22 was significantly higher than the normal liver cell line. Through this research, we found downregulation of USP22 expression mitigated 5-FU resistance and increased the sensitivity of HCC to chemotherapy drugs. These results indicate that high expression of USP22 may be involved in the development of tumors, with multiresistance playing an important role, and may be used as an independent molecular marker to predict the prognosis of patients with primary liver cancer and to overcome liver cancer chemotherapy resistance to prolong survival. However, the specific mechanism is still unclear. We speculate that USP22 as a specific ubiquitin proteasome can fully identify specificity in the core group protein H2A, H2B single ubiquitin-binding sites, and hydrolysis of the ubiquitin, and in the core protein ubiquitin will not cause group-protein degradation, but can directly affect the stability of the DNA double helix, which stimulates the replication of DNA transcription. USP22 was found to have close cooperative relations with the MYC oncogene, and key to the Myc protein playing a biological role. In cases of high expression, USP22 can be enhanced in the process of transcription of key MYC target-gene transcription-mediated tumor progression. USP22 is required for Myc function, and BMI1 was originally discovered as an oncogene capable of cooperating with Myc during transformation. BMI1 is one of the core members of the PcG family. Cancer stem cells are not only the source of malignant tumor cells with value added but are also the root of tumor chemotherapy resistance and relapse. Research proves that the development of drug resistance and tumor stem cell (cancer stem cells) closely related to the biological characteristics of cancer stem cells and identification of various tumors in the microenvironment are necessary to sustain its characteristic biological process and essential for the treatment of tumor recurrence. BMI1 is the key to regulate stem cell self-renewal and value-added activity factors. As a member of the family of PcG transcription-inhibitory factors, BMI1 can cause histone H2A ubiquitin and lead to target-gene silencing. We hypothesized that BMI may in this way inhibit multiresistant gene expression. This study is the first to report the relationship among the expression of USP22, BMI1, and EZH2 in HCC tissue. No correlation was observed between the expression levels of EZH2 and USP22; however, more studies are needed to investigate the relationship between EZH2 and USP22.
Conclusion
In summary, in this study, we detected the expression levels of USP22, BMI1, and EZH2 in HCC tissue and analyzed the relationship between these indicators and the related prognostic significance. We found that USP22, BMI1, and EZH2 were highly expressed in HCC tissue and that the levels of expression were positively correlated with tumor grade and clinical stage. The prognosis of patients with high coexpression of USP22, BMI1, and EZH2 was poor. For TACE-treated patients, coexpression of USP22 and BMI1 was associated with poor HCC prognosis and stronger resistance to anticancer drugs. Therefore, coexpression of USP22 and BMI1 may become a new prognostic factor that may help guide the clinical treatment of patients with HCC.
Acknowledgments
This research was supported in part by the National Natural Science Foundation of China (81360367, 81160066, 30870719, and 81360320), Natural Science Fund Project in Guangxi (2014GXNSFBA118162), Guangxi Health Department Self-Raised Funds Projects (Z2013464), Open Fund Project of Key Laboratory of Molecular Medicine in Liver Damage and Repair, Guangxi (QT2013025), Construction Project of Key Laboratory of Molecular Medicine in Liver Damage and Repair, Guangxi (SYS2013009), and Guangxi Distinguished Experts Special Fund Project, which is supported by the Guangxi Culture of Advancing Academic and Technical Leaders with Project Funds.
Disclosure
The authors report no conflicts of interest in this work.
References
Michielsen P, Ho E. Viral hepatitis B and hepatocellular carcinoma. Acta Gastroenterol Belg. 2011;74:4–8. | ||
Jacobs JJ, Lohuizen MV. Polycomb repression: from cellular memory to cellular proliferation and cancer. Biochim Biophys Acta. 2002;1602:151–161. | ||
Jacobs JJ, Kieboom K, Marino S, Depinho RA, van Lohuizen M. The oncogene and polycomb-group gene bmi-1 regulates cell proliferation and senescence through the ink4a locus. Nature. 1999;397:164–168. | ||
Dimri GP, Martinez JL, Jacobs JJ, et al. The Bmi-1 oncogene induces telomerase activity and immortalizes human mammary epithelial cells. Cancer Res. 2002;62:4736–4745. | ||
Kim JH, Yoon SY, Jeong SH, et al. Overexpression of Bmi-1 oncoprotein correlates with axillary lymph node metastases in invasive ductal breast cancer. Breast. 2004;13:383–388. | ||
Song W, Tao K, Lee H, et al. Bmi-1 is related to proliferation, survival and poor prognosis in pancreatic cancer. Cancer Sci. 2010;101:1754–1760. | ||
Effendi K, Mori T, Komuta M, Masugi Y, Du W, Sakamoto M. Bmi-1 gene is upregulated in early-stage hepatocellular carcinoma and correlates with ATP-binding cassette transporter B1 expression. Cancer Sci. 2010;101:666–672. | ||
Sasaki M, Ikeda H, Itatsu K, et al. The overexpression of polycomb group proteins Bmi1 and EZH2 is associated with the progression and aggressive biological behavior of hepatocellular carcinoma. Lab Invest. 2008;88:873–882. | ||
Wang H, Pan K, Zhang HK, et al. Increased polycomb-group oncogene Bmi-1 expression correlates with poor prognosis in hepatocellular carcinoma. J Cancer Res Clin Oncol. 2008;134:535–541. | ||
Cao R, Zhang Y. The functions of E(Z)/EZH2-mediated methylation of lysine 27 in histone H3. Curr Opin Genet Dev. 2004;14:155–164. | ||
Kleer CG, Cao Q, Varambally S, et al. EZH2 is a marker of aggressive breast cancer and promotes neoplastic transformation of breast epithelial cells. Proc Natl Acad Sci U S A. 2003;100:11606–11611. | ||
Ren G, Baritaki S, Marathe H, et al. Polycomb protein EZH2 regulates tumor invasion via the transcriptional repression of the metastasis suppressor RKIP in breast and prostate cancer. Cancer Res. 2012;72:3091–3104. | ||
Sauvageau M, Sauvageau G. Polycomb group proteins: multi-faceted regulators of somatic stem cells and cancer. Cell Stem Cell. 2010;7:299–313. | ||
Zhang XY, Pfeiffer HK, Thorne AW, McMahon SB. USP22, an hSAGA subunit and potential cancer stem cell marker, reverses the polycomb-catalyzed ubiquitylation of histone H2A. Cell Cycle. 2008;7:1522–1524. | ||
Lee HJ, Kim MS, Shin JM, Park TJ, Chung HM, Baek KH. The expression patterns of deubiquitinating enzymes, USP22 and Usp22. Gene Expr Patterns. 2006;6:277–284. | ||
Glinsky GV, Berezovska O, Glinskii AB. Microarray analysis identifies a death-from-cancer signature predicting therapy failure in patients with multiple types of cancer. J Clin Invest. 2005;115:1503–1521. | ||
Glinsky GV. “Stemness” genomics law governs clinical behavior of human cancer: implications for decision making in disease management. J Clin Oncol. 2008;26:2846–2853. | ||
Liu YL, Yang YM, Xu H, Dong XS. Increased expression of ubiquitin-specific protease 22 can promote cancer progression and predict therapy failure in human colorectal cancer. J Gastroenterol Hepatol. 2010;25:1800–1805. | ||
Zhou WH, Tang F, Xu J, et al. Aberrant upregulation of 14-3-3o′ expression serves as an inferior prognostic biomarker for gastric cancer. BMC Cancer. 2011;11:397. | ||
Zlobec I, Steele R, Terracciano L, Jass JR, Lugli A. Selecting immunohistochemical cut-off scores for novel biomarkers of progression and survival in colorectal cancer. J Clin Pathol. 2007;60:1112–1116. | ||
Zhang XY, Varthi M, Sykes SM, et al. The putative cancer stem cell marker USP22 is a subunit of the human SAGA complex required for activated transcription and cell-cycle progression. Mol Cell. 2008;29:102–111. | ||
Liu YL, Yang YM, Xu H, Dong XS. Aberrant expression of USP22 is associated with liver metastasis and poor prognosis of colorectal cancer. J Surg Oncol. 2011;103:283–289. | ||
Xu H, Liu YL, Yang YM, Dong XS. Knock-down of ubiquitin-specific protease 22 by micro-RNA interference inhibits colorectal cancer growth. Int J Colorectal Dis. 2012;27:21–30. | ||
Tang B, Tang F, Li B, et al. High USP22 expression indicates poor prognosis in hepatocellular carcinoma. Oncotarget. 2015;6:12654–12667. | ||
Li X, Yang Z, Song W, et al. Overexpression of Bmi-1 contributes to the invasion and metastasis of hepatocellular carcinoma by increasing the expression of matrix metalloproteinase (MMP)-2, MMP-9 and vascular endothelial growth factor via the PTEN/PI3K/Akt pathway. Int J Oncol. 2013;43:793–802. | ||
Sudo T, Utsunomiya T, Mimori K, et al. Clinicopathological significance of EZH2 mRNA expression in patients with hepatocellular carcinoma. Br J Cancer. 2005;92:1754–1758. | ||
Hajósi-Kalcakosz S, Dezső K, Bugyik E, et al. Enhancer of zeste homologue 2 (EZH2) is a reliable immunohistochemical marker to differentiate malignant and benign hepatic tumors. Diagn Pathol. 2012;7:86. | ||
Hu J, Liu YL, Piao SL, Yang DD, Yang YM, Cai L. Expression patterns of USP22 and potential targets BMI-1, PTEN, p-AKT in non-small-cell lung cancer. Lung Cancer. 2012;77:593–599. |
 © 2016 The Author(s). This work is published and licensed by Dove Medical Press Limited. The full terms of this license are available at https://www.dovepress.com/terms.php and incorporate the Creative Commons Attribution - Non Commercial (unported, v3.0) License.
By accessing the work you hereby accept the Terms. Non-commercial uses of the work are permitted without any further permission from Dove Medical Press Limited, provided the work is properly attributed. For permission for commercial use of this work, please see paragraphs 4.2 and 5 of our Terms.
© 2016 The Author(s). This work is published and licensed by Dove Medical Press Limited. The full terms of this license are available at https://www.dovepress.com/terms.php and incorporate the Creative Commons Attribution - Non Commercial (unported, v3.0) License.
By accessing the work you hereby accept the Terms. Non-commercial uses of the work are permitted without any further permission from Dove Medical Press Limited, provided the work is properly attributed. For permission for commercial use of this work, please see paragraphs 4.2 and 5 of our Terms.