")
Back to Journals » Psychology Research and Behavior Management » Volume 12
The relationship between psychological states and health perception in individuals at risk for cardiovascular disease
Authors Lee KS, Feltner FJ, Bailey AL , Lennie TA , Chung ML , Smalls BL , Schuman DL , Moser DK
Received 14 December 2018
Accepted for publication 7 March 2019
Published 7 May 2019 Volume 2019:12 Pages 317—324
DOI https://doi.org/10.2147/PRBM.S198280
Checked for plagiarism Yes
Review by Single anonymous peer review
Peer reviewer comments 2
Editor who approved publication: Professor Einar Thorsteinsson
Kyoung Suk Lee,1 Frances J Feltner,2 Alison L Bailey,3 Terry A Lennie,4 Misook L Chung,4 Brittany L Smalls,5 Donna L Schuman,6 Debra K Moser4
1College of Nursing, Research Institute of Nursing Science, Seoul National University, Seoul, South Korea; 2University of Kentucky, Family and Community Medicine, Lexington, KY, USA; 3University of Tennessee COM Chattanooga, Erlanger Health System, Chattanooga, TN, USA; 4College of Nursing, University of Kentucky, Lexington, KY, USA; 5College of Medicine Center for Health Service Research, University of Kentucky, Lexington, KY, USA; 6University of Kentucky, College of Social Work, Lexington, KY, USA
Backgrounds: Perceptions of health are important to motivate people to change behaviors. Non-adherence to healthy behaviors that prevent cardiovascular disease may result from inadequate health perceptions. However, there are few studies investigating relationships between health perceptions and psychological states.
Objective: To determine whether psychological states (ie, depressive symptoms and anxiety) are associated with the congruency between health perception and estimated risk for cardiovascular disease in adults with 2 or more cardiovascular disease risk factors.
Methods: Community dwellers at risk for cardiovascular disease were asked to complete the Patient Health Questionnaire-9 and the anxiety subscale of the Brief Symptom Inventory to measure depressive symptoms and anxiety, respectively. Participants rated their perceived health from excellent to poor. The estimated cardiovascular disease risks were measured with the 10-year cardiovascular disease Framingham risk scores. Participants were grouped into three health perception groups based on congruency between levels of health perception and cardiovascular disease risk. Multivariate multinomial logistic regression was done to examine the association between psychological states and health perception groups.
Results: Of 828 participants 54.7%, 12.0%, and 33.3% had congruent, pessimistically biased, and optimistically biased health perception, respectively. Depressive symptoms were significantly associated with pessimistic bias (adjusted odds ratio: 1.070, 95% confidence interval 1.010–1.133), but not anxiety. Optimistic bias was not associated with either depressive symptoms or anxiety.
Conclusions: A mismatch between individual health perceptions and cardiovascular disease risks was associated with depressive symptoms. As health perception is affected by depressive symptoms, clinicians should assess depressive symptoms when exploring health perceptions and engaging individuals in decision-making about a healthy lifestyle.
Keywords: emotion, perception, cardiovascular diseases, healthy lifestyle
Introduction
Cardiovascular disease (CVD) is a significant health problem related to adverse outcomes and staggering health expenditures.1 In addition to traditional risk factors (eg, age) and depression,1,2 engaging in a healthy lifestyle (eg, blood pressure management, weight control, healthy diet, regular physical activities, and smoking cessation) is recognized as a significant factor to reduce the risk of developing CVD.1 However, the adherence rate to recommended healthy behaviors is not adequate. The projected improvement in the recommended healthy lifestyle between 2010 and 2020 is approximately 6%, which is 14% lower than the goal of American Heart Association.1 Thus, it is important to identify reasons for inadequate engagement in health protective behaviors to prevent incident CVD.
Individual perception of health is one of the primary factors influencing the decision to engage in health protective behaviors.3,4 If individuals judge their health status as good, they are likely to maintain their current lifestyle. However, perceived health is not always congruent with actual health status.4–7 Biased perception (ie, pessimistic and optimistic bias) can be problematic. Young healthy women who overestimated their risk of getting breast cancer compared to their actual risk were more likely to have premature mammography screening and be fearful of breast cancer.8 Therefore, unbiased perceptions of health are essential for individuals to make appropriate healthy lifestyle choices.
Because biased perception of health is a barrier to adopting a healthy lifestyle, investigators have examined factors related to inaccurate risk perception for CVD. Most researchers have focused on demographic and clinical factors (eg, education and lipid level).5–7,9 However, emotional states also affect how individuals perceive and respond to information.10–12 For example, depression is one of the important predictors of the incident CVD. It is suggested that unhealthy lifestyle practices in depressed people contribute to CVD.2 It is possible that making unhealthy choices in individuals with depression might be related to biased perception of CVD due to depressed mood. Therefore, the purpose of this study was to determine whether psychological states (i.e, depressive symptoms and anxiety) are associated with the congruency between health perception and estimated risk for CVD in adults with 2 or more CVD risk factors.
Methods
Data source and participants
This was a secondary analysis of baseline data collected from the HeartHealth intervention study.13 The parent study was aimed at testing the effectiveness of a 3-month CVD risk-reduction program in rural residents who were at risk for CVD. The intervention was focused on increasing knowledge and building skills to adopt a healthy lifestyle (ie, diet, activity, medication adherence, and psychological health) via individualized education, goal setting, and counseling sessions.
Participants were recruited from clinics, community centers, and self-referral from flyers posted at various community locations. Adults were included if they had at least 2 of the following CVD risk factors: age of >45 years for males and >55 years for females, abnormal lipids, hypertension, diabetes, body mass index ≥25 kg/m2, current smoker, poor diet (high in fat or low in fruits and vegetables), or sedentary lifestyle. Participants were excluded if they had cognitive impairment, conditions requiring a special diet or limiting engagement in physical activities, life-threatening morbidities (eg, end-stage renal disease and cancer with active treatment), were chronic substance abusers, or non-English speaking. In this study, we included 828 participants who had data on all variables of interest (eg, perceived health, depressive symptoms, and anxiety).
The study was approved by the Institutional Review Board of the University of Kentucky (10–0827-F6A). This study conforms to the principles of the Declaration of Helsinki. Eligible participants provided written, signed informed consent after receiving a detailed explanation of the study by research nurses. Participants completed questionnaires that included sociodemographic information, perceived health, and psychological states (ie, depressive symptoms and anxiety). Trained research nurses measured height, weight, blood pressure, lipid profile, and hemoglobin A1c (HbA1c).
Measures
Perceived health
The perception of health was measured with one item from the SF-36: “ in general, would you say your health is…” Participants rated their health status as excellent, very good, good, fair, or poor. For analysis, good perceived health was defined as rating health as excellent, very good, or good health, while poor perceived health was defined as rating health fair to poor.
Estimated cardiovascular disease risk
Participants’ estimated 10-year CVD risk was defined using the Framingham risk score based on age, sex, total cholesterol, high-density lipoprotein cholesterol (HDL-C), systolic blood pressure, current smoking status, diabetes, and treatment for hypertension.14 A moderate to high risk was defined as the Framingham 10-year CVD risk of 10% or higher.15
Lipid profile, including total cholesterol, triglyceride, and HDL-C, was obtained from a fingerstick blood sample using a portable lipid analyzer (Cholestech LDX, Inverness Medical, CA). Non-HDL-C was calculated by subtracting HDL-C from total cholesterol. Non-HDL-C levels are an inclusive measure of routine lipid profile and better performed to predict adverse clinical outcomes compared to other lipid measures.16 HbA1c was measured with fingerstick blood sample using a portable HbA1c blood monitor (A1C Now, BayerContour, NJ). Blood pressure was measured in the left arm of the seated participants with a mercury-column sphygmomanometer and an appropriately sized cuff based on the American Heart Association standard procedure. Height was measured with a professional grade stadiometer without shoes. Weight was measured using a calibrated electronic digital scale in light clothing. Body mass index was calculated based on body weight in kilograms divided by height in meters squared, and categorized as normal weight (18.5–24.9 kg/m2), overweight (25–29.9 kg/m2), or obese (≥30 kg/m2). Demographic information such as age and sex, medical history (eg, hypertension), and smoking status was obtained from patient interview.
Psychological states
The 9-item Patient Health Questionnaire (PHQ-9) was used to measure depressive symptoms.17 The items correspond with the diagnostic criteria for depressive disorder in the Diagnostic and Statistical Manual of Mental Disorders, 4th Edition.17 Patients were asked to rate each item on a scale from 0 (not at all) to 3 (nearly every day), with a total score ranging from 0 to 27. Using the PHQ-9, scores for depressive symptoms were categorized as follows: minimal (<5), mild (5–9), moderate (10–14), moderately severe (15–19), and severe depressive symptoms (20–27).17,18
Anxiety
The subscale of the Brief Symptom Inventory was used to measure anxiety.19 Participants were asked the extent to which they have been bothered by 6 symptoms of anxiety in the past 7 days ranging from not at all (0) to extremely (4). Total scores are the average of each item (range 0–4), with higher scores indicating higher levels of anxiety.19
Statistical analyses
Participants were classified into three health perception groups based on congruency between their level of health perception (high vs low perceived health status) and their level of estimated CVD risk grouped (moderate to high vs low CVD risk): 1) congruent; 2) pessimistically biased; and 3) optimistically biased perception. If participants’ estimated CVD risk was low and their perceived health was poor, they were classified as pessimistically biased; if their estimated CVD risk was moderate to high and their perceived health was good, they were classified as optimistically biased. If participants’ estimated CVD risk was low and their perceived health was good or their estimated CVD risk was moderate to high and their perceived health was poor, they were classified as congruent health perception.
Differences in demographic and CVD risk factors among the three health perception group were tested with chi-square test or analysis of variance (ANOVA) as appropriate. If F-statistics of ANOVA was significant, an LSD post-hoc test was done to determine the source of group differences. Multivariate multinomial logistic regression was done to examine the association between psychological states (ie, depressive symptoms and anxiety) and health perception groups, after controlling for age, gender, marital status, employment state, absence of medical insurance, body mass index, non-HDL-C, systolic blood pressure, and HbA1c. Participants with congruent health perception were the reference group. All data analyses were performed using IBM SPSS version 22.
Results
Sample characteristics
The mean age of the 828 participants was 51 years old (SD 13.6) (Table 1). The majority of the participants were female (75.4%), white (95.2%), employed (76.8%), had insurance (92.1%), and completed at least high school (64.9%). Fewer than half of the participants had triglycerides of <150 mg/dL (43.8%), HDL-C of >40 mg/dL (40%), and non-HDL-C of <130 mg/dL (31.4%). Approximately 85% of the participants were either overweight (29.1%) or obese (56.9%). On average, 47% of the participants were at a moderate to high risk for CVD development within the next 10 years based on the Framingham risk scores. More than 70% of the participants reported good to excellent health. Among the participants, 54.7% had congruent, 12.0% had pessimistically biased, and 33.3% had optimistically biased health perceptions (Table 1).
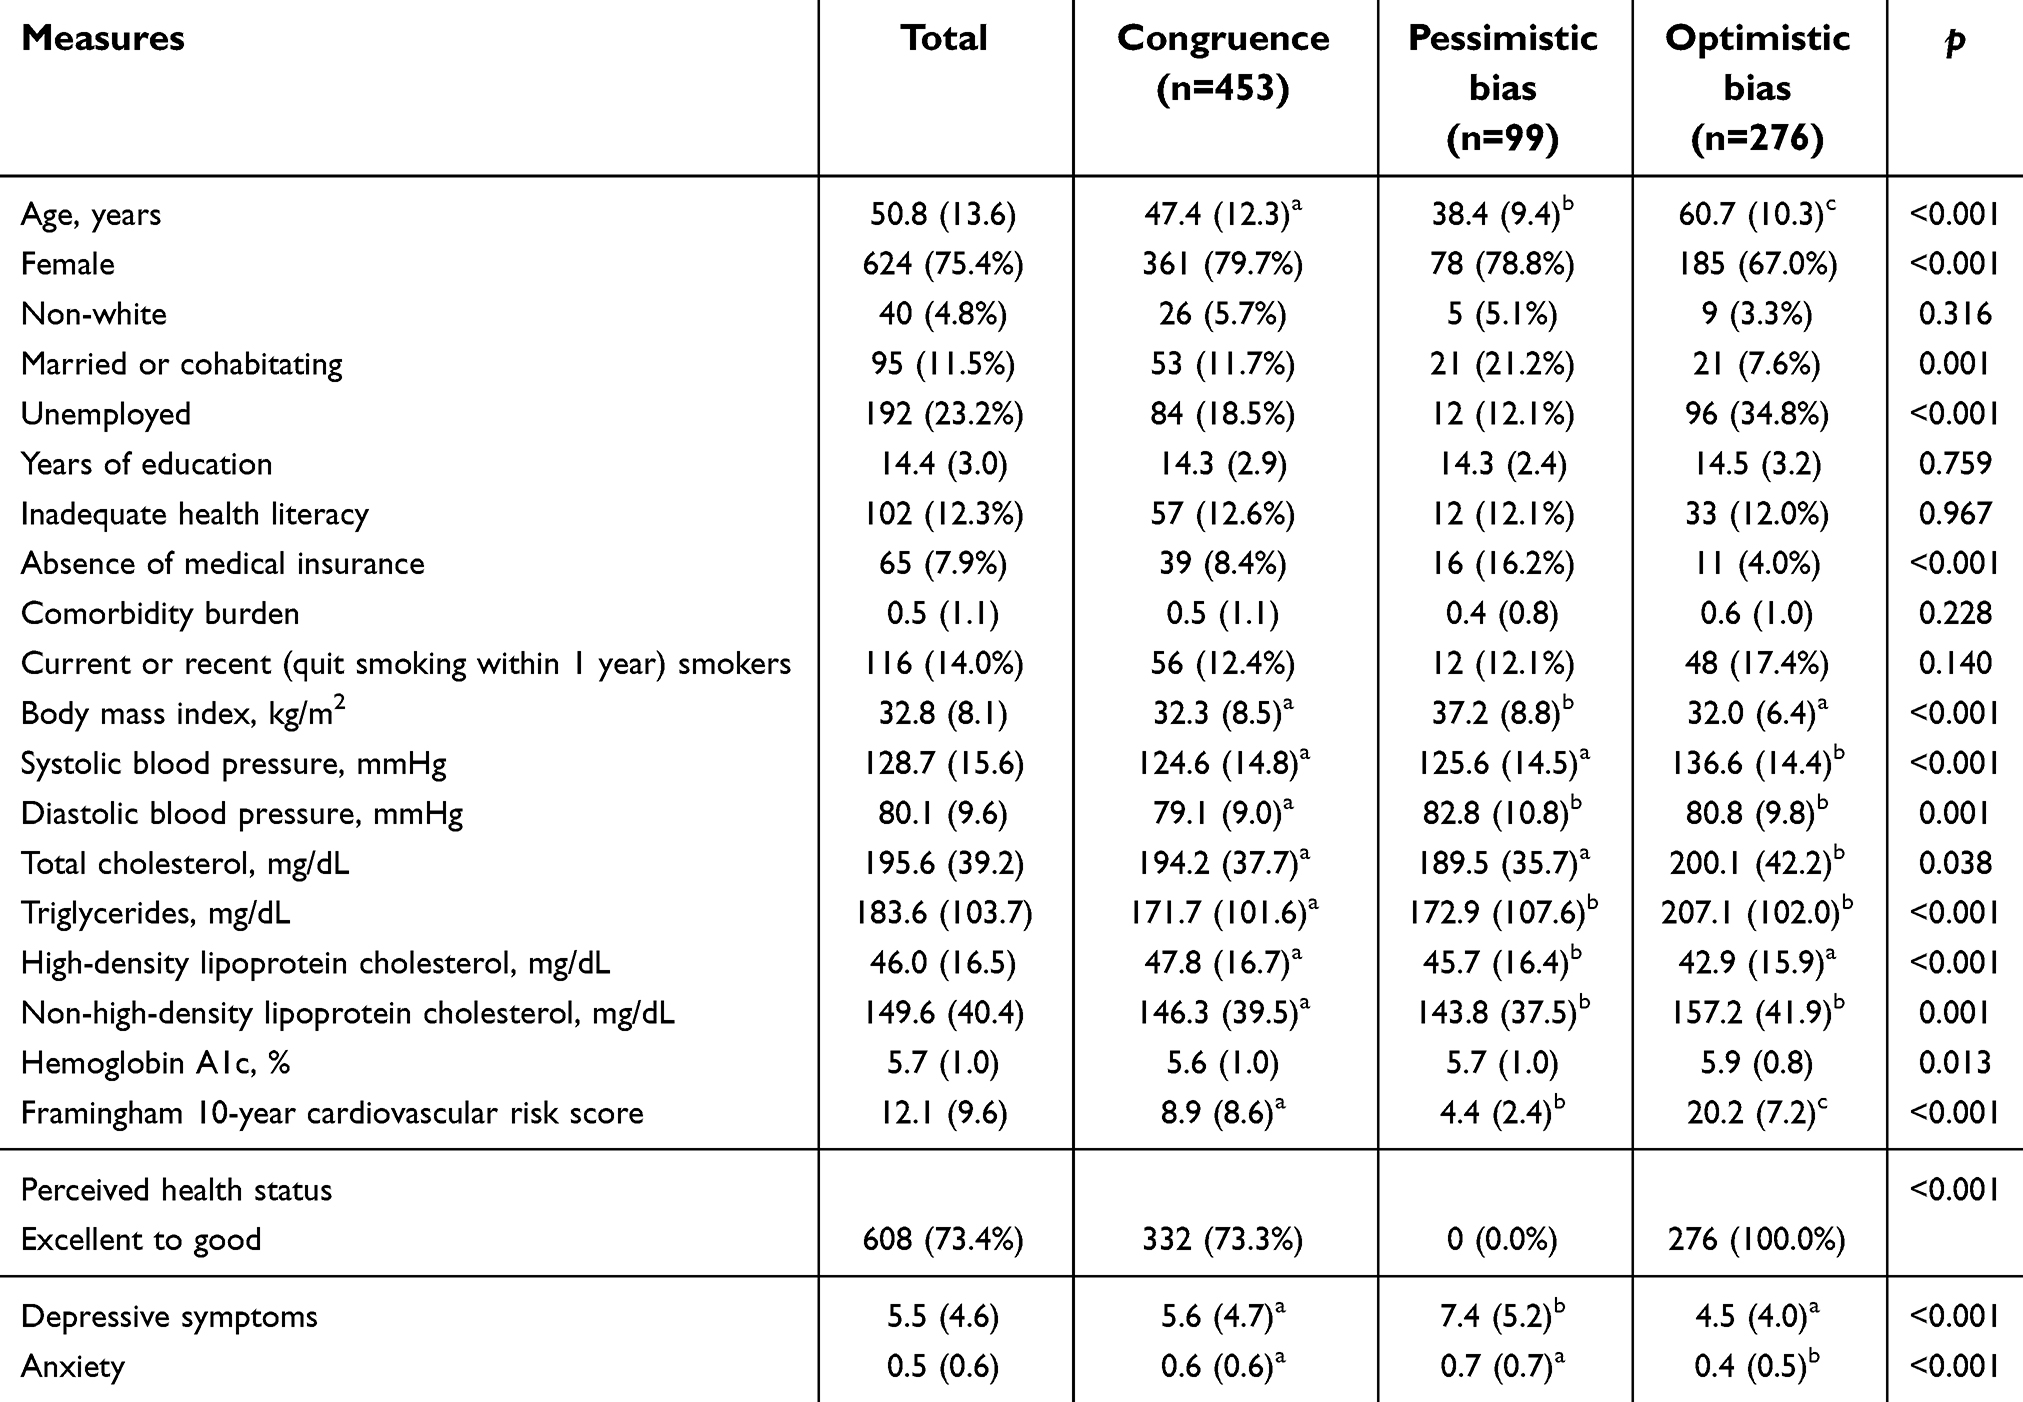 | Table 1 Sample characteristics (N=828) |
Psychological status and health perception groups
Depressive symptoms and anxiety were significantly different among the three groups of health perception (Table 1). Participants in the congruent and optimistically biased groups had lower levels of depressive symptoms compared to participants in the pessimistically biased group (p-value<0.001). With worsening depressive symptoms, the proportion of the pessimistically biased group increased while the proportion of the optimistic bias group decreased (Figure 1, p-value=0.01). Participants in the optimistically biased group experienced lower levels of anxiety than participants in the congruent and pessimistically biased groups (p-value <0.001). As anxiety scores increased, an upward trend was observed in the pessimistically biased group, and a downward trend was observed in the optimistically biased group (Figure 2, p-value =0.053).
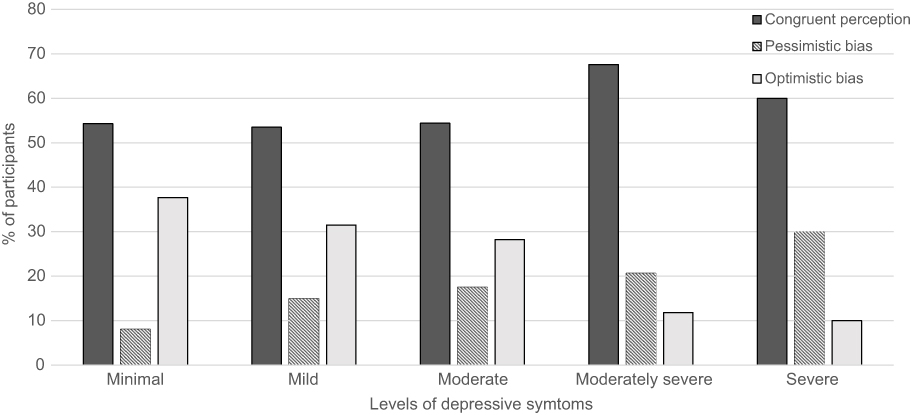 | Figure 1 Health perception by levels of depressive symptoms. |
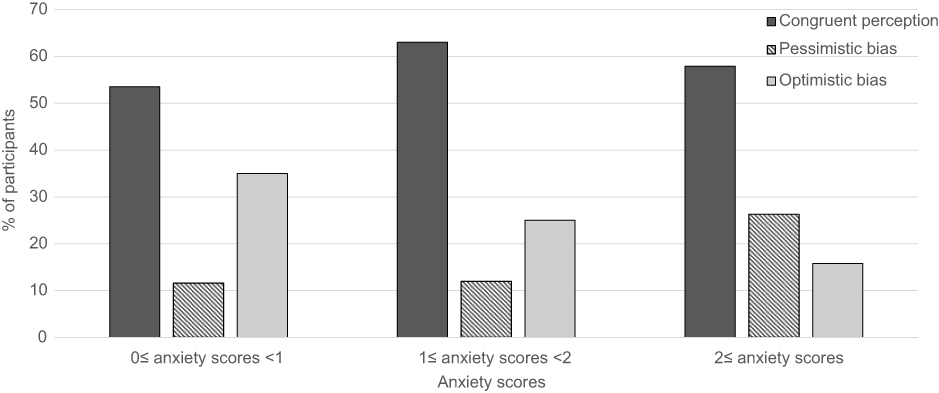 | Figure 2 Health perception by levels of anxiety. |
Association between psychological status and health perception groups
Depressive symptoms were significantly associated with pessimistic bias (p-value=0.022), but not anxiety (p-value >0.05) in the multivariate multinomial logistic regression model after controlling for demographics and CVD risk factors (Table 2). For every one-point increase in depressive symptom scores, there was a 7% increase in adjusted odds of being in the pessimistically biased group (odds ratio [OR]: 1.070, 95% confidence interval 1.010–1.133, p-value =0.022) compared with the congruent group. Among covariates included in the regression model, younger age and higher body mass index were also associated with membership in the pessimistically biased group.
Depressive symptoms or anxiety was not associated with optimistic bias after adjusting for demographics and CVD risk factors (Table 2). Among the covariates entered in the model, older age, male, being employed, higher levels of non-HDL-C, and higher systolic blood pressure were associated with the membership in the optimistically biased group.
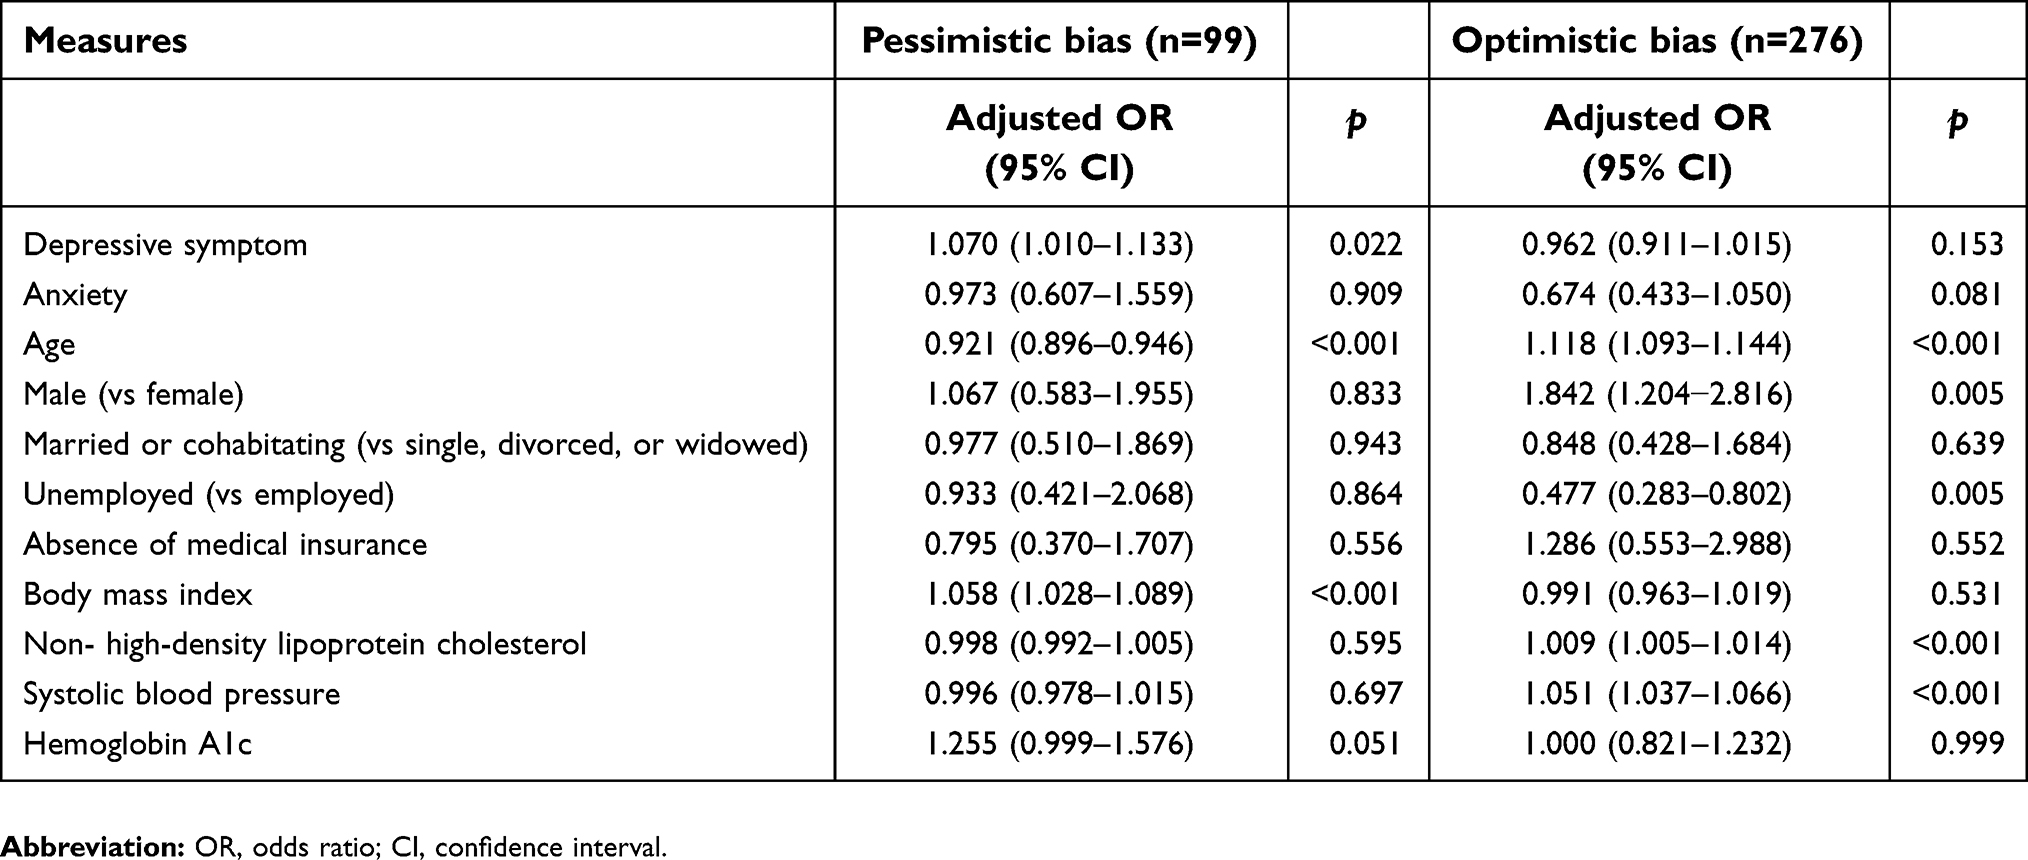 | Table 2 Predictors of having incongruent perception of health (N=828) |
Discussion
The American Heart Association has promoted 7 core health behaviors (eg, blood pressure management, weight control, healthy diet, regular physical activity, and smoking cessation) to the public in order to prevent CVD. However, adherence to the 7 core health behaviors is still not optimal.1 Because health perception has been recognized as an important factor to motivate people to adopt a healthy lifestyle, incongruent health perception compared with objectively assessed health status may contribute to suboptimal engagement in a healthy lifestyle. We found that biased health perception, that is biased in comparison with the estimated CVD risk, was prevalent among individuals who were at risk for CVD. Biased health perception was associated with depressive symptoms in our study. This finding highlights that individuals’ ability to adequately estimate their health is affected by emotional states.
Affect and cognition simultaneously influence information processing and reactions to health threats.4,20 Emotional perception of vulnerability can outweigh cognitive perception of vulnerability.10,20,21 In the study by Avis et al (1989) in which individualized heart attack risk feedback was given to improve the accuracy of perceived risk for heart attack compared to the objectively assessed risk, the intervention was effective only among individuals whose estimated risk was above average.22 The limited effect of the intervention suggests that improving knowledge of CVD risk factors is not sufficient to enhance the accuracy of assessment of disease risks if psychological states are not addressed.
We found that depressive symptoms were predictive of pessimistically biased health perception. Similarly, diabetic patients with depressive symptoms were more likely to perceive a greater risk for CVD development than those who were not depressed.11 The characteristics of depressed people (ie, ruminative thinking and stronger memory of negative experiences) may contribute to the overestimation of risks compared to the estimated risks.23,24
Unlike depressive symptoms, hypervigilance for threat-related information is a unique characteristic of anxiety.25 The association between anxiety and perceived risk for cancer and CVD has been demonstrated.7,12,26,27 Breast cancer survivors with greater levels of anxiety were more likely to overestimate their breast cancer recurrence risk compared to the estimated risks of recurrence.27 However, in this study, we did not find a significant relationship between anxiety and the congruency of health perception compared to estimated CVD risk. This may be related to the effect of anxiety on information processing that varies depending on levels of anxiety (high vs low levels).24,28 The average score of anxiety in our sample may be too low to trigger hypervigilance of illness-related information.
We found that age, male, and employment status were predictors of optimistic bias. These findings are in line with previous studies.5,7,29 Because men are less likely to be conscious of health and seek medical care compared with women,30 they may underestimate their risk for CVD. Because unemployment is predicted by poor physical health,31 it is expected that the unemployed are more likely to percceive to have poor health, which may contribute to optimal bias. .
Of the modifiable risk factors of CVD (body mass index, non-HDL, systolic blood pressure), a higher body mass index was associated with a greater likelihood of having pessimistic bias, which is in line with previous findings.9,32 The significant relationship between body mass index and pessimistic bias may be related to the well-publicized negative effects of obesity on CVD. Our finding that higher levels of non-HDL and systolic blood pressure were associated with a greater likelihood of having optimistic bias may appear to be counterintuitive. However, people are often not aware of their cholesterol or blood pressure levels,33,34 and many assume their cholesterol is in the normal range despite never having receiving such information from their healthcare providers.33 Because individuals who are optimistically biased to their health may be likely to have the false assumption that their cholesterol and blood pressure levels were optimal without knowing the accurate levels.
Researchers report that an individual’s perception of risk for CVD is frequently incongruent with their estimated risk5–7,9,22,35 using a variety of tools to measure CVD risk in diverse samples (eg, smokers and general healthy people). Our finding expands this phenomenon, prevalent incongruence between perceived and estimated CVD risk, to individuals who are at risk for CVD.
There are some limitations to be noted. We measured perceived health globally and did not use a CVD-specific measure because perceptions of CVD were not collected in the parent study. However, because CVD is an important component of health perception, global health perception takes into account individuals perception of CVD. There were other variables that were not included in our investigation because those variables were not collected in the parent study, such as knowledge of CVD. Because we recruited people who had at least two CVD risk factors, our results may not be generalizable to people who are not at risk for CVD.
Conclusion
Congruent awareness of personal risk for a chronic preventable condition is a primary first step in making the decision to adopt healthy behaviors. If people underestimate their health, they could often unnecessarily increase health care utilization. On the other hand, over-estimation of health status may lead to a reduced likelihood of implementing recommended healthy behaviors. We found that a mismatch between individual health perception and estimated CVD risk was associated with depressive symptoms. As health perception is affected by depressive symptoms, clinicians should assess depressive symptoms when exploring health perceptions and promoting individual engagement in a healthy lifestyle.
Acknowledgments
This work was supported by the Health Resources and Services Administration (D1ARH16062, D1ARH20134); the National Research Foundation of Korea grant funded by the Korea government (MEST) (2016R1A2B4008495); Research Grant funded by the Chungnam National University (2015-1794-01). Sources of funding had no involvement in any of the stages from study design to submission of the paper for publication.
Disclosure
The abstract of this paper was presented at the 2017 Scientific Sessions of the American Heart Association Conference as a poster presentation with interim findings. The poster’s abstract was published in Abstract 14485, Circulation vol 131, supplement 1:
References
1. Benjamin EJ, Muntner P, Alonso A, et al. Heart disease and stroke statistics-2019 update: a report from the American Heart Association. Circulation. 2019;139(10):e56–e66.
2. Carney RM, Freedland KE. Depression and coronary heart disease. Nat Rev Cardiol. 2017;14(3):145–155. doi:10.1038/nrcardio.2016.181
3. Rosenstock IM, Strecher VJ, Becker MH. Social-learning theory and the health belief model. Health Educ Quart. 1988;15(2):175–183. doi:10.1177/109019818801500203
4. Ferrer R, Klein WM. Risk perceptions and health behavior. Curr Opin Psychol. 2015;5:85–89. doi:10.1016/j.copsyc.2015.03.012
5. Desgraz B, Collet TH, Rodondi N, Cornuz J, Clair C. Comparison of self-perceived cardiovascular disease risk among smokers with Framingham and PROCAM scores: a cross-sectional analysis of baseline data from a randomised controlled trial. BMJ Open. 2017;7(1):e012063. doi:10.1136/bmjopen-2016-012063
6. Petr EJ, Ayers CR, Pandey A, et al. Perceived lifetime risk for cardiovascular disease (from the dallas heart study). Am J Cardiol. 2014;114(1):53–58. doi:10.1016/j.amjcard.2014.04.006
7. van der Weijden T, van Steenkiste B, Stoffers HE, Timmermans DR, Grol R. Primary prevention of cardiovascular diseases in general practice: mismatch between cardiovascular risk and patients’ risk perceptions. Med Decis Making. 2007;27(6):754–761. doi:10.1177/0272989X07305323
8. Labrie NH, Ludolph R, Schulz PJ. Investigating young women’s motivations to engage in early mammography screening in Switzerland: results of a cross-sectional study. BMC Cancer. 2017;17(1):209. doi:10.1186/s12885-017-3180-1
9. Alwan H, William J, Viswanathan B, Paccaud F, Bovet P. Perception of cardiovascular risk and comparison with actual cardiovascular risk. Eur J Cardiovasc Prev Rehabil. 2009;16(5):556–561. doi:10.1097/HJR.0b013e32832d194d
10. Klein WM, Stefanek ME. Cancer risk elicitation and communication: lessons from the psychology of risk perception. CA Cancer J Clin. 2007;57(3):147–167.
11. Allen JK, Purcell A, Szanton S, Dennison CR. Perceptions of cardiac risk among a low-income urban diabetic population. J Health Care Poor Underserved. 2010;21(1):362–370. doi:10.1353/hpu.0.0241
12. Peterson LM, Helweg-Larsen M, Volpp KG, Kimmel SE. Heart attack risk perception biases among hypertension patients: the role of educational level and worry. Psychol Health. 2012;27(6):737–751. doi:10.1080/08870446.2011.626856
13. Mudd-Martin G, Biddle MJ, Chung ML, et al. Rural Appalachian perspectives on heart health: social ecological contexts. Am J Health Behav. 2014;38(1):134–143. doi:10.5993/AJHB.38.1.14
14. D’Agostino RB
15. Grundy SM, Cleeman JI, Merz CN, et al. Implications of recent clinical trials for the national cholesterol education program adult treatment panel III guidelines. Circulation. 2004;110(2):227–239. doi:10.1161/01.CIR.0000133317.49796.0E
16. Blaha MJ, Blumenthal RS, Brinton EA, Jacobson TA. National lipid association taskforce on non HDLC. The importance of non-HDL cholesterol reporting in lipid management. J Clin Lipidol. 2008;2(4):267–273. doi:10.1016/j.jacl.2008.06.013
17. Spitzer RL, Kroenke K, Williams JB. Validation and utility of a self-report version of PRIME-MD: the PHQ primary care study. Primary care evaluation of mental disorders. Patient Health questionnaire. JAMA. 1999;282(18):1737–1744. doi:10.1001/jama.282.18.1737
18. Kroenke K, Spitzer RL, Williams JB. The PHQ-9: validity of a brief depression severity measure. J Gen Intern Med. 2001;16(9):606–613.
19. Derogatis LR, Melisaratos N. The brief symptom inventory: an introductory report. Psychol Med. 1983;13(3):595–605.
20. Slovic P, Finucane ML, Peters E, MacGregor DG. Risk as analysis and risk as feelings: some thoughts about affect, reason, risk, and rationality. Risk Anal. 2004;24(2):311–322. doi:10.1111/j.0272-4332.2004.00433.x
21. Peters E. Beyond comprehension: the role of numeracy in judgments and decisions. Curr Dir Psychol Sci. 2012;21(1):31–35. doi:10.1177/0963721411429960
22. Avis NE, Smith KW, McKinlay JB. Accuracy of perceptions of heart attack risk: what influences perceptions and can they be changed? Am J Public Health. 1989;79(12):1608–1612.
23. Mogg K, Bradbury KE, Bradley BP. Interpretation of ambiguous information in clinical depression. Behav Res Ther. 2006;44(10):1411–1419. doi:10.1016/j.brat.2005.10.008
24. Dalgleish T, Power M. Cognition and Emotion: From Order to Disorder.
25. Mathews A, MacLeod C. Cognitive approaches to emotion and emotional disorders. Annu Rev Psychol. 1994;45:25–50. doi:10.1146/annurev.ps.45.020194.000325
26. Peipins LA, McCarty F, Hawkins NA, Rodriguez JL, Scholl LE, Leadbetter S. Cognitive and affective influences on perceived risk of ovarian cancer. Psychooncology. 2015;24(3):279–286. doi:10.1002/pon.3593
27. Liu Y, Perez M, Aft RL, et al. Accuracy of perceived risk of recurrence among patients with early-stage breast cancer. Cancer Epidem Biomar. 2010;19(3):675–680. doi:10.1158/1055-9965.EPI-09-1051
28. MacLeod C, Grafton B, Notebaert L. Anxiety-linked attentional bias: is it reliable? Annu Rev Clin Psychol. 2019;15. doi:10.1146/annurev-clinpsy-050718-095505
29. Homko CJ, Zamora L, Santamore WP, Kashem A, McConnell T, Bove AA. Gender differences in cardiovascular risk factors and risk perception among individuals with diabetes. Diabetes Educ. 2010;36(3):483–488. doi:10.1177/0145721710366757
30. Vaidya V, Partha G, Karmakar M. Gender differences in utilization of preventive care services in the United States. J Womens Health (Larchmt). 2012;21(2):140–145. doi:10.1089/jwh.2011.2876
31. Virtanen P, Janlert U, Hammarstrom A. Health status and health behaviour as predictors of the occurrence of unemployment and prolonged unemployment. Public Health. 2013;127(1):46–52. doi:10.1016/j.puhe.2012.10.016
32. Winter J, Wuppermann A. Do they know what is at risk? Health risk perception among the obese. Health Econ. 2014;23(5):564–585. doi:10.1002/hec.2933
33. Goldman RE, Parker DR, Eaton CB, et al. Patients’ perceptions of cholesterol, cardiovascular disease risk, and risk communication strategies. Ann Fam Med. 2006;4(3):205–212. doi:10.1370/afm.534
34. Choi EJ, Jekal Y, Kim S, et al. Middle-aged women’s awareness of cholesterol as a risk factor: results from a national survey of Korean Middle-aged Women’s Health Awareness (KomWHA) study. Int J Nurs Stud. 2010;47(4):452–460. doi:10.1016/j.ijnurstu.2009.09.002
35. Ko Y, Boo S. Self-perceived health versus actual cardiovascular disease risks. Jpn J Nurs Sci. 2016;13(1):65–74. doi:10.1111/jjns.12087
 © 2019 The Author(s). This work is published and licensed by Dove Medical Press Limited. The full terms of this license are available at https://www.dovepress.com/terms.php and incorporate the Creative Commons Attribution - Non Commercial (unported, v3.0) License.
By accessing the work you hereby accept the Terms. Non-commercial uses of the work are permitted without any further permission from Dove Medical Press Limited, provided the work is properly attributed. For permission for commercial use of this work, please see paragraphs 4.2 and 5 of our Terms.
© 2019 The Author(s). This work is published and licensed by Dove Medical Press Limited. The full terms of this license are available at https://www.dovepress.com/terms.php and incorporate the Creative Commons Attribution - Non Commercial (unported, v3.0) License.
By accessing the work you hereby accept the Terms. Non-commercial uses of the work are permitted without any further permission from Dove Medical Press Limited, provided the work is properly attributed. For permission for commercial use of this work, please see paragraphs 4.2 and 5 of our Terms.