")
Back to Journals » Breast Cancer: Targets and Therapy » Volume 9
The regulation of steroid receptors by epigallocatechin-3-gallate in breast cancer cells
Authors Hallman K, Aleck K, Quigley M , Dwyer B , Lloyd V , Szmyd M, Dinda S
Received 30 December 2016
Accepted for publication 14 March 2017
Published 24 May 2017 Volume 2017:9 Pages 365—373
DOI https://doi.org/10.2147/BCTT.S131334
Checked for plagiarism Yes
Review by Single anonymous peer review
Peer reviewer comments 2
Editor who approved publication: Professor Pranela Rameshwar
Kelly Hallman,* Katie Aleck,* Meghan Quigley, Brigitte Dwyer, Victoria Lloyd, Monica Szmyd, Sumi Dinda
Biomedical Diagnostic and Therapeutic Sciences, School of Health Sciences, Center for Biomedical Research, Oakland University, Rochester, MI, USA
*These authors contributed equally to this work
Abstract: It has been reported that phytoestrogen epigallocatechin gallate (EGCG) suppresses cancer cell proliferation and may have antitumor properties. In this study, we analyzed the effects of EGCG on estrogen receptor α (ERα) and progesterone receptor in hormone-dependent T-47D breast cancer cells. Western blot analysis revealed EGCG induced a concentration-dependent decrease in ERα protein levels, with a 56% reduction occurring with 60 µM EGCG when compared to controls. Downregulation of ERα protein levels was observed after 24-hour co-treatment of T-47D cells with 60 µM EGCG and 10 nM 17β-estradiol (E2). The proliferative effect of E2 on cell viability was reversed when treated in combination with EGCG. In contrast, the combination of EGCG with the pure ER antagonist, ICI 182, 780, showed no further reduction in cell number as only 5% of the cells were viable after 6 days of treatment. These studies may provide further understanding of the interactions among flavonoids and steroid receptors in breast cancer cells.
Keywords: phytoestrogen, ER, PR, T-47D, antiestrogens
Introduction
Breast cancer is currently the second leading cause of cancer death for women living in the United States.1 The progression of multiple stages of development eventually results in invasive breast cancer, with one of these stages being known as ductal carcinoma in situ (DCIS). DCIS is an intraductal neoplastic proliferation of cells in the epithelium of the breast that does not invade through the basement membrane layer to the breast stroma.1–3 It is known to be preliminary to invasive breast cancer, and it has been suggested that the proliferation of DCIS is dependent on the presence of estrogen. DCIS, known as ductal carcinoma, is a form of hormone-dependent breast cancer. The T-47D cell line used in our experiments was isolated from infiltrating ductal carcinoma of the breast and is positive for both estrogen receptor (ER) and progesterone receptor (PR).1–3
The normal growth of cells and cellular proliferation are both highly regulated processes. Hormones are known to influence the structural and functional changes of the breast tissue. Therefore, hormones can also influence the growth of hormone-dependent tumors in the breast. The estrogen 17β-estradiol (E2) is known to enhance cellular division in target cells by binding to its specific protein receptor called the estrogen receptor (ERα). Previous studies from our laboratory have shown the addition of E2 to breast cancer cells causes a downregulation of the ERα and an increase in cellular proliferation.4 Phytoestrogens have been shown to bind to ER (α and β) and act as either ER antagonists or agonists.5 Some phytoestrogens have demonstrated estrogenic activity with the potential ability to act as natural selective ER modulators in breast cancer.6,7
Epigallocatechin gallate (EGCG) is the most prevalent catechin present in green tea and cocoa, and has been known to demonstrate chemopreventive action.8,9 It has been shown to possess antitumor properties and thus has the ability to suppress carcinogenesis and cancer cell proliferation.10–15 Laboratory studies suggest that consumption of green tea might be associated with a decreased risk of developing breast, skin, lung, bladder, and various other types of cancer.16 Furthermore, recent studies suggest that EGCG may specifically target cancer genes or proteins with little or no effect on normal molecules, in order to exert its anticancer effects.8,15,17 It has also been noted that EGCG may exert its anticancer effects through the activation of lymphocytes.18 Along with the demonstrated effects on ERα, the anticancer effects of EGCG have also been shown to involve PR, the target of the progesterone hormone.10 EGCG is a phytoestrogen, which has the ability to cause estrogenic or antiestrogenic effects due to its structural similarity to the steroid hormone E2. Therefore, it is important to elucidate whether EGCG’s structural similarity to the steroid hormone E2 contributes to the observed anticancer effects, and therefore involves ERα and PR-A/B. The T-47D cell line used in these studies is positive for both ER and PR. In this study, the effects of EGCG alone and in combination with hormones and antihormones were examined on cellular viability as well as expression and cytolocalization of ERα and PR protein in the hormone-dependent T-47D breast cancer cell line. The results of these studies may aid in understanding the relationship between phytoestrogens and steroid receptors in breast cancer cells.
Methods and materials
Cell culture and treatment with ligands
A breast cancer cell line, known as T-47D (ATCC, Manassas, VA, USA), was regularly cultured at 37°C with 5% CO2. T-47D cells are cultured in a medium (Roswell Park Memorial Institute medium 1640; Thermo Fisher Scientific, Waltham, MA, USA) supplemented with 10% fetal bovine serum that contains growth factors and exogenous steroids. This Roswell Park Memorial Institute medium, also known as 10% whole serum, assisted in cell growth and aided in cellular proliferation. The medium containing these growth factors was replenished every 48 hours. Once the cells reached the appropriate confluency, the medium was changed to a 5% dextran-coated charcoal-treated fetal bovine serum (DCC-FBS), which was used to deplete the cells of endogenous steroids and growth factors. This allowed the cells to be at their basal metabolic rate at the time of treatment, ensuring that the effects seen on the cells were solely due to the treatment and not anything in the culturing media. The cells were cultured in charcoal-stripped serum for 4 days. On the fourth day, 6-well plates were treated with 2 µL of ligands for 24 hours. Varying concentrations (5–60 µM) of EGCG were used in the concentration dependency studies, while hormones and antihormones were combined with 60 µM EGCG for the hormone studies.
Protein extraction and quantification
The cellular proteins were extracted by the addition of radioimmunoprecipitation assay buffer obtained from (Santa Cruz Biotechnology, Dallas, TX, USA). The cells were then centrifuged at 13,000 rpm for 15 minutes at 4°C. After centrifugation, the supernatant was separated and used to prepare a protein assay based on the Bradford method (Bio-Rad Kit, Hercules, CA, USA). The Bradford method aided in quantifying and normalizing the quantity of protein in each extracted sample.
Sodium dodecyl sulfate-polyacrylamide gel electrophoresis (SDS-PAGE) and Western blot analyses
The extracted proteins were run on an SDS-PAGE gel, which is a technique that separates the proteins by molecular weight. The protein of interest (ERα) was then isolated using Western blot analysis. In order to denature the sample to its primary structure, the protein supernatant was heated for 3 minutes at 85°C. Equal amounts of protein were loaded into a 4%–15% polyacrylamide gel. Proteins run on these gels were transferred to an Immobilon polyvinylidene fluoride membrane by the process of electroblotting. To begin probing, 5% nonfat dry milk was used as a block. The membranes were then probed with anti-ER monoclonal antibody (Santa Cruz Biotechnology). To detect the primary antibody, secondary goat-antimouse IgG2a antibody was used. The ERα-specific band was then visualized by the enhanced chemiluminescence method according to the instructions from Amersham. Actin bands were probed by antiactin (monoclonal antibody clone C4; Millipore, Bedford, MA, USA). ERα levels were normalized to protein levels of the evolutionarily conserved actin protein according to the manufacturer’s protocol. The protein bands were visualized using the Chemi-Doc imaging system (Bio-Rad).4,19
Cell viability assay
A cell viability assay shows the amount of live cells in a total population after treatments with ligands, at varying concentrations, for 6 days. The cell viability studies were cultured in 12-well plates (30,000 cells per well). The medium was replaced every 48 hours throughout the experiment. The plates were fed with 10% whole serum for 2 days. The cells were then incubated in the presence of stripped serum and ligands for 6 days and quantified on the seventh day by propidium iodide staining using the Cellometer Vision CBA software (Nexcelom Bioscience LLC, Lawrence, MA, USA).4,19
Immunofluorescence and confocal microscopy
T-47D cells were plated on cover slips in 12-well plates (30,000 cells/well) and cultured for 48 hours in 10% FBS. The cell culture medium was then changed to 5% DCC-FBS, and fresh medium was added at 2-day intervals. The cells were cultured in 5% DCC-FBS for a total of 4 days. On day 4, the ligands were suspended in 5% DCC-FBS medium, and semiconfluent cells were treated for 24 hours.
Cellular localization of ERα by immunocytochemistry: The cells were fixed on cover slips with 1% formalin in PBS, permeabilized with ice-cold acetone and methanol (50:50), and washed three times with PBS. Staining procedures were performed in a humidified chamber at room temperature. Cells were incubated in 10% goat serum (Sigma, St. Louis, MO, USA) to suppress nonspecific binding of IgG, followed by 3 hours’ incubation with anti-ERα (Santa Cruz Biotechnology) monoclonal antibody. After washing with PBS, cells were incubated for 3 hours with 1:200 dilution antimouse IgG conjugated with Cy3 (Jackson ImmunoResearch Laboratories, West Grove, PA, USA). Cover slips were washed with PBS and incubated for 2 minutes in 1 µg/mL 4′,6-diamidino-2-phenylindole (DAPI) dissolved in PBS. Cells were washed 5 times in PBS, mounted with Fluoromount-G (Electron Microscopy Sciences, Hatfield, PA, USA), and stored in the dark at 4°C. The distribution of three-dimensional fluorescent structures was analyzed using a Nikon Digital Eclipse C1 plus confocal microscope. NIS elements software (Nikon Instruments, Melville, NY, USA) was used for noise reduction and three-dimensional reconstruction of the images.19
Statistical analyses
The results are expressed as mean ± standard error of mean. Statistical significance was determined by the Kruskal–Wallis test followed by post hoc analysis using the Mann–Whitney U-test. Differences are considered significant at p<0.05. In all figures, *p<0.05, **p<0.01, and ***p<0.001. Statistical analyses were carried out using SPSS for Windows version 11.5 (SPSS Inc., Chicago, IL, USA).
Results
Effects of EGCG on ERα protein expression: concentration dependency
The results from the concentration dependency study on the levels of ERα protein are displayed in Figure 1. Cells were cultured in 5% charcoal-stripped serum for 4 days prior to treatment with 5–60 µM EGCG. Cs indicated the control, which were grown in 5% charcoal-stripped serum during the experiment. After 24 hours of treatment with varying concentrations of EGCG, a concentration-dependent downregulation of ERα protein expression was observed, as compared to the control. The results show an optimal decrease in protein expression at 60 µM EGCG with a 56% reduction, compared to untreated controls. These results suggest the effects of EGCG on breast cancer cells may be mediated via steroid receptors.
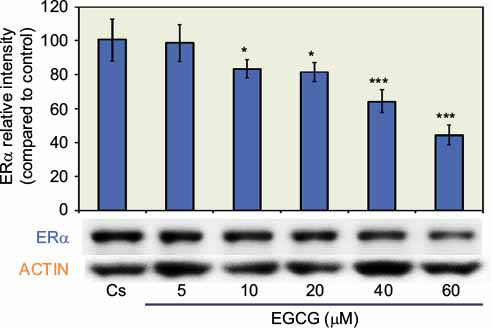 | Figure 1 Concentration-dependent effects of EGCG on ERα protein expression levels in T-47D cells. Notes: Following 24-hour treatment with 5–60 µM EGCG, T-47D cells were subjected to SDS-PAGE and Western blot analysis. The control lane, labeled Cs, represents cells grown in a medium containing 5% DCC-FBS in the absence of ligands. The relative intensity of ERα protein, compared to Cs, is displayed as the mean ± SEM. *Indicates a significant difference from the control at p<0.05, while ***indicates a significant difference at p<0.001 (Kruskal–Wallis Test followed by post hoc analysis using Mann–Whitney U-test). Three independent experiments are displayed in the representative blots. Abbreviations: EGCG, epigallocatechin gallate; ERα, estrogen receptor α; DCC-FBS, dextran-coated charcoal-treated fetal bovine serum; SEM, standard error of mean. |
Effects of EGCG on PR-A/B protein expression: concentration dependency
Figure 2 portrays expression levels of PR-A/B protein under concentration-dependent effects. The lane labeled Cs, representative of the control, was grown in 5% DCC-FBS, while 5–60 µM EGCG treatments were implemented following 4 days of T-47D cells culturing in 5% DCC-FBS. A concentration-dependent downregulation of PR-A/B protein expression, when compared to Cs, was exhibited following 24-hour treatments at varying EGCG concentrations. Results display optimal downregulation of PR-A/B expression intensity, as compared to Cs, at 60 µM EGCG with a 58% reduction. This suggests the mechanism of EGCG may involve PR along with ER.
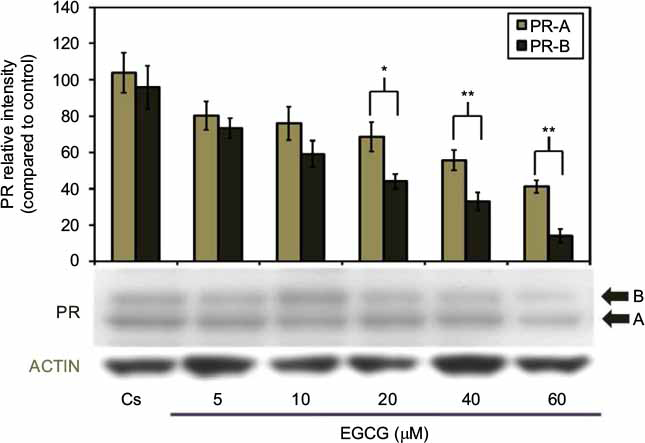 | Figure 2 Concentration-dependent effects of EGCG on PR-A/B protein expression levels in T-47D cells. Notes: T-47D cells were treated for 24 hours with 5–60 µM EGCG and then subjected to SDS-PAGE and Western blot analysis. The control lane, labeled Cs, represents cells grown in a medium containing 5% DCC-FBS in the absence of ligands. Relative intensities of PR-A/B protein, compared to Cs, are portrayed as the mean ± SEM. *Indicates a significant difference, compared to the control, at p<0.05 and **at p<0.01 (Kruskal–Wallis test followed by post hoc analysis using Mann–Whitney U-test). Three independent experiments are portrayed in the representative blots. Abbreviations: DCC-FBS, dextran-coated charcoal-treated fetal bovine serum; EGCG, epigallocatechin gallate; PR, progesterone receptor; SDS-PAGE, sodium dodecyl sulfate-polyacrylamide gel electrophoresis; SEM, standard error of mean. |
Effects of EGCG on T-47D cell viability: concentration dependency
A cell viability assay shows the amount of live cells in a population after treatment with ligands, at varying concentrations, for a 6-day duration. To determine the cellular influence of EGCG, image cytometric analysis with propidium iodide staining was utilized to quantify alterations in T-47D cell number and viability, shown in Figure 3. Propidium iodide is commonly used for identifying dead cells in a population. Cs represents the control in which the cells were grown in charcoal-stripped serum to deplete cells of endogenous steroids and growth factors. The cells were treated with 5–60 µM EGCG for 6 days prior to extraction. After 6 days of treatment, a 15%–70% reduction in T-47D cell viability was observed upon treatment with 10–60 µM EGCG, respectively. A significant decrease in cell viability was observed when 20–60 µM EGCG was used in treatment. These findings are consistent with the concentration-dependent downregulation of ERα and PR, implying a possible correlation between the effects of EGCG on steroid receptors and cell viability.
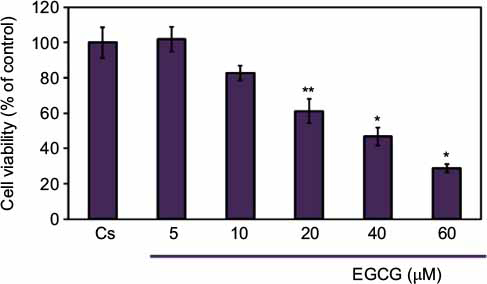 | Figure 3 Concentration-dependent effects of EGCG on T-47D cellular viability. Notes: T-47D cells were grown in 12-well plates containing approximately 30,000 cells per well. For 2 days, cells were provided 10% FBS media containing growth factors for growth. For the remaining 6 days, growth factor media was replaced with DCC-FBS media and ligands at 2-day intervals. The 6-day ligand treatments consisted of 5–60 µM EGCG, and was followed by a cell viability assay utilizing propidium iodide staining and image cytometry via the Nexcelom Cellometer Vision on the seventh day. *Denotes a significant difference, as compared to the control, at p<0.05, and **at p<0.01 (Kruskal–Wallis test followed by post hoc analysis using Mann–Whitney U-test). Three independent experiments are represented in the data. Abbreviations: DCC-FBS, dextran-coated charcoal-treated fetal bovine serum; EGCG, epigallocatechin gallate. |
Effects of EGCG, estrogens, and antiestrogens on ERα protein expression
Figure 4 displays the results of the hormone study when EGCG (60 µM) was used alone and in combination with the estrogen, E2, and the pure ER antagonist, ICI 182, 780 (ICI). Downregulation of ERα protein levels was observed after 24-hour co-treatment of T-47D cells with 60 µM EGCG and 10 nM E2, reversing the proliferative effect of solely E2 treatment. Similar effects also occurred when EGCG was used in combination with the pure ER antagonist ICI (1 µM). These observations suggest EGCG may have similarities to estrogen in regard to its mechanisms involving ERα.
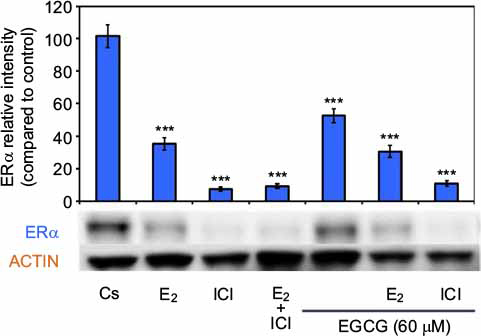 | Figure 4 Effects of estrogens and antiestrogens in combination with EGCG on ERα protein expression levels in T-47D cells. Notes: T-47D cells were treated for 24 hours, either alone or in combination, with 60 µM EGCG, 10 nM E2, and 1 µM ICI. Following treatment, SDS-PAGE and Western blot analysis of ERα protein expression levels were conducted. Relative intensities of ERα protein bands, as compared to the control, are portrayed as the mean ± SEM. ***Indicates a significant difference, in relation to the control, at p<0.001 (Kruskal–Wallis test followed by post hoc analysis using Mann–Whitney U-test). Representative blots are shown for three independent experiments. Abbreviations: DCC-FBS, dextran-coated charcoal-treated fetal bovine serum; EGCG, epigallocatechin gallate; ERα, estrogen receptor α; SDS-PAGE, sodium dodecyl sulfate-polyacrylamide gel electrophoresis; SEM, standard error of mean; E2, 17β-estradiol; ICI, ICI 182,780. |
Effects of EGCG, estrogens, and antiestrogens on PR-A/B protein expression
Hormone and antihormone study results with EGCG (60 µM) treatment, alone or in combination, with 10 nM E2 or 1 µM ICI are shown in Figure 5. Co-treatment with 60 µM EGCG and 10 nM E2 displayed decreased protein level intensity when viewed with E2 alone. Significant downregulation of PR-A/B protein expression is witnessed following combination treatment of 60 µM EGCG and ICI, as compared to the control. Therefore, the estrogen-like effects of EGCG may coincide with the downregulation of PR when EGCG is combined with the pure antiestrogen, ICI via estrogen-dependent regulated pathway.
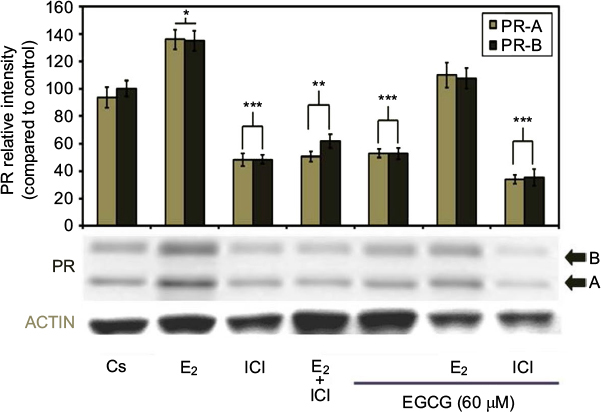 | Figure 5 Effects of estrogens and antiestrogens in combination with EGCG on PR-A/B protein expression levels in T-47D cells. Notes: T-47D cells were treated for 24 hours, either alone or in combination, with 60 µM EGCG, 10 nM E2, and 1 µM ICI. Following treatment, SDS-PAGE and Western blot analysis of PR-A/B protein expression levels were conducted. Protein band relative intensities, as compared to the control, are displayed as the mean ± SEM. ***Indicates a significant difference at p<0.001, **at p<0.01, *at p<0.05, in relation to the control (Kruskal–Wallis test followed by post hoc analysis using Mann–Whitney U-test). Representative blots are shown for three independent experiments. Abbreviations: DCC-FBS, dextran-coated charcoal-treated fetal bovine serum; EGCG, epigallocatechin gallate; PR, progesterone receptor; SDS-PAGE, sodium dodecyl sulfate-polyacrylamide gel electrophoresis; SEM, standard error of mean; E2, 17β-estradiol; ICI, ICI 182,780. |
Effects of EGCG, estrogens, and antiestrogens on T-47D cell viability
T-47D cellular viability was also assessed under conditions in which EGCG was combined with hormones and antihormones. Image cytometric analysis with propidium iodide staining was utilized to quantify alterations in T-47D cell number and viability under various hormonal treatments, shown in Figure 6. The cells were co-treated for 6 days with 60 µM EGCG and either 10 nM E2 or 1 µM ICI. E2, as stated previously, is an ER agonist; therefore, this compound induces cell proliferation and subsequent viability in the hormone-dependent T-47D cell line. EGCG in combination with E2 shows the proliferative effects of E2 in T-47D cells to be reversed and reduced to the level of the control. However, similar effects were not witnessed with co-treatments of EGCG and ICI, as this combination presents no further reduction in cellular proliferation when compared to the effect of ICI alone.
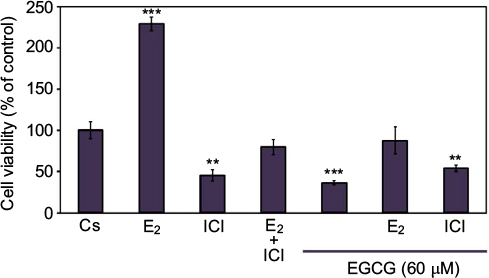 | Figure 6 Effects of estrogens and antiestrogens in combination with EGCG on T-47D cellular viability. Notes: Twelve-well plates were utilized to grow approximately 30,000 T-47D cells per well. Cells were nourished for 2 days with 10% FBS media containing growth factors, followed by 2-day intervals of DCC-FBS media and ligand treatments for the remaining 6 days. Ligand treatments included 10 nM E2, 1 µM ICI, and 60 µM EGCG, alone or in combination. Propidium iodide staining and image cytometry via Nexcelom Cellometer Vision was implemented on the seventh day to determine cell viability. **Indicates a significant difference compared to Cs at p<0.01, and ***indicates a significant difference at p<0.001 (Kruskal–Wallis test followed by post hoc analysis using Mann–Whitney U-test). The representative data are displayed from results of three independent experiments. Abbreviations: DCC-FBS, dextran-coated charcoal-treated fetal bovine serum; EGCG, epigallocatechin gallate; E2, 17β-estradiol; ICI, ICI 182,780. |
Effects of EGCG, progestins, and antiprogestins on ERα protein expression
EGCG was also used in combination with progestins and antiprogestins. Figure 7 displays the results of a hormone study when EGCG (60 µM) was used alone and in combination with the progestin, R5020, and the PR antagonist, RU486. An 81% reduction was observed on ERα protein levels after a 24-hour co-treatment of T-47D cells with 60 µM EGCG and 10 nM R5020. When used alone, RU486 was not distinctly different from the control; however, when used in combination with EGCG, RU486 exhibited a 52% decrease in expression of ERα.
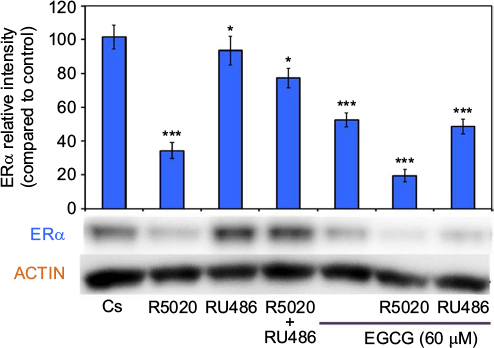 | Figure 7 Effects of progestins and antiprogestins in combination with EGCG on ERα protein expression levels in T-47D cells. Notes: Treatment of 10 nM R5020, 10 nM RU486, and 60 µM EGCG, alone or in combination, was instilled on T-47D cells for 24 hours. SDS-PAGE and Western blot analysis were performed to determine ERα protein expression levels. ERα protein band intensity, as compared to the control, are portrayed as the mean ± SEM. *Indicates a significant difference, compared to Cs, at p<0.05. ***Indicates a significant difference, in relation to the control, at p<0.001 (Kruskal–Wallis test followed by post hoc analysis using Mann–Whitney U-test). Three independent experiments are displayed in the representative blots. Abbreviations: DCC-FBS, dextran-coated charcoal-treated fetal bovine serum; EGCG, epigallocatechin gallate; ERα, estrogen receptor α; SDS-PAGE, sodium dodecyl sulfate-polyacrylamide gel electrophoresis; SEM, standard error of mean. |
Effects of EGCG, progestins, and antiprogestins on PR-A/B protein expression
The effects of EGCG treatments, either alone or in combination with the progestin, R5020, and the antiprogestin, RU486, on PR-A/B expression in T-47D cells can be observed in Figure 8. When 60 µM EGCG was combined with 10 nM R5020, significant downregulation in PR-A/B protein level expression was viewed, with a 92% reduction as compared to Cs. Similarly, the co-treatment of EGCG with the PR antagonist, 10 nM RU486, displayed significant downregulation in PR-A/B expression when compared to the control, at 70% reduction.
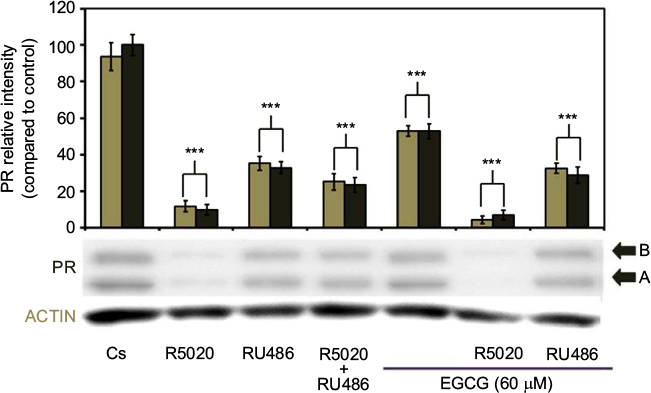 | Figure 8 Effects of progestins and antiprogestins in combination with EGCG on PR-A/B protein expression levels in T-47D cells. Notes: Twenty-four-hour treatment, either alone or in combination, with 10 nM R5020, 10 nM RU486, and 60 µM EGCG was implemented on T-47D cells. PR-A/B protein expression was determined utilizing SDS-PAGE and Western blot analysis. Relative band intensities of PR-A/B, compared to Cs, are displayed as the mean ± SEM. ***Indicates a significant difference at p<0.001, compared to the control (Kruskal–Wallis test followed by post hoc analysis using Mann–Whitney U-test). Representative blots from three independent experiments are portrayed. Abbreviations: DCC-FBS, dextran-coated charcoal-treated fetal bovine serum; EGCG, epigallocatechin gallate; PR, progesterone receptor; SDS-PAGE, sodium dodecyl sulfate-polyacrylamide gel electrophoresis; SEM, standard error of mean. |
Effects of EGCG, progestins, and antiprogestins on T-47D cell viability
Cellular viability assays were utilized to further assess the effects of EGCG in combination with progestins and antiprogestins on T-47D proliferation. Propidium iodide staining with image cytometry was applied to determine viability changes under varying treatment combinations of 60 µM EGCG, 10 nM R5020, and 10 nM RU486, displayed in Figure 9. T-47D cells treated with a combination of EGCG and R5020 did not significantly decrease the amount of viable cells but displayed values similar to those observed when cells were treated with R5020 alone. When cells were treated with EGCG and RU486, viable cells were nearly halved in comparison to the control; however, when compared to treatment of RU486 alone, no significant alterations were observed.
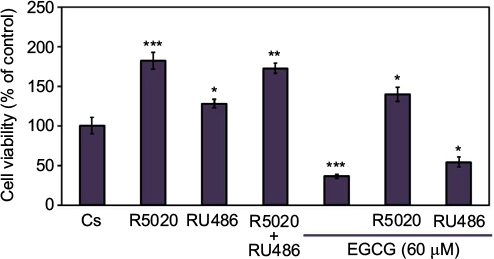 | Figure 9 Effects of progestins and antiprogestins in combination with EGCG on T-47D cellular viability. Notes: Cells were cultured with 10% FBS media containing growth factors for 2 days in 12-well plates housing approximately 30,000 T-47D cells per well. For the remaining 6 days, cells were treated at 2-day intervals with DCC-FBS media and ligands, alone or in combination, with 10 nM R5020, 10 nM RU486, and 60 µM EGCG. On the seventh day, cell viability assays were performed using propidium iodide staining and image cytometry with the Nexcelom Cellometer Vision. *Indicates a significant difference, in relation to the control, at p<0.05, while **indicates a significant difference compared to Cs at p<0.01, and ***indicates at p<0.001 (Kruskal–Wallis test followed by post hoc analysis using Mann–Whitney U-test). Three independent experiments are represented in the data results. Abbreviations: DCC-FBS, dextran-coated charcoal-treated fetal bovine serum; EGCG, epigallocatechin gallate. |
Effects of EGCG, E2, and ICI on the immunolocalization of ERα
Confocal microscopy involving immunolocalization was conducted to determine the cytolocalization of ERα protein in T-47D cells. To stain the nuclei of the cells for display in image analysis, DAPI was utilized, as shown in Figure 10. ERα protein can be seen localized in the nucleus of T-47D cells. Further displaying ERα immunofluorescence localized in the nuclei, the control group (Cs) is representative of T-47D cells grown in charcoal-treated serum. Treatment with E2 displayed increased nuclear intensity when stained for ERα protein localization. When cells were treated with 1 µM ICI, 60 µM EGCG, and combinations of EGCG with E2 and EGCG with ICI, decreased intensity of nuclear ERα staining was detected when compared to the control (Cs). The largest decrease in immunofluorescent intensity, when compared to the control, can be viewed with EGCG+ICI exposure. Images displaying the nuclei of T-47D cells via DAPI staining were merged with images stained for ERα to further portray the nuclear localization of ERα protein. The nuclear fluorescence density demonstrated by the confocal images showed correlation with protein expression determined by Western blotting analyses.
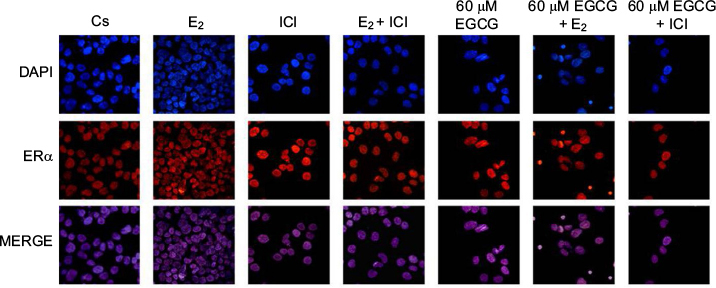 | Figure 10 Effects of EGCG on the immunolocalization of ERα in T-47D cells. Notes: Cytolocalization of cellular ERα was determined utilizing confocal microscopy involving immunofluorescence. Treatments, either alone or in combination, with 60 µM EGCG, 10 nM E2, and 1 µM ICI were implemented on T-47D cells. DAPI images, stained to display the cell nuclei, were merged with images stained for ERα localization to further demonstrate the nuclear localization of the protein ERα. Abbreviations: DAPI, diamidino-2-phenylindole; EGCG, epigallocatechin gallate; ERα, estrogen receptor α; E2, 17β-estradiol; ICI, ICI 182,780. |
Discussion
Besides skin cancer, breast cancer is the most commonly diagnosed cancer among American women, and more than half of breast cancers are positive for ER.20 The studies previously mentioned utilized the T-47D cell line due to the presence of both ER and PR. Many scientists have focused their research on ER downregulators due to increasing amounts of diagnosed hormone-dependent breast cancers.10 Studies were conducted to elucidate if the antitumor effects of EGCG are mediated via ERα and PR.
Our results demonstrated a concentration-dependent downregulation of ERα and PR protein expression as well as a substantial reduction in cell viability, with a maximal reduction occurring at 60 µM EGCG. It has been reported that higher concentrations (100–150 µM) of EGCG induced a striking increase in cell death.8 Other studies have also shown declines, of approximately 45%, in ERα levels when lower EGCG concentrations (0.1–1.0 µM) have been implemented in MCF-7 cell lines.21 Since MCF-7 is an ER-positive breast cancer cell line, the results from that study can provide further support for the effects of EGCG in the similar T-47D cells. The structure of EGCG is clearly effective in acting as an ER downregulator. Therefore, to gain further insight into possible similarities between the phytoestrogen and other known effectors of ERα and PR, the optimal concentration of EGCG (60 μM) was used in combination with hormones and antihormones, as well as progestins and antiprogestins.
The optimal concentration of EGCG (60 µM) was selected to observe the compound in combination with hormones, which have known effects on breast cancer cells. Studying the effects of EGCG at a lower concentration (60 µM) than other researchers, the phytoestrogen could be utilized in hormone combination studies to further understand its potential as a therapeutic agent. At a concentration range of 10 nM–20 µM, genistein, an isoflavonoid, inhibited cell growth in MCF-7 cells when in combination with E2; these inhibitory effects were also seen when EGCG was used with E2, which reduced the cell viability to the level of the control.22 The effects of EGCG in combination with E2 and ICI, respectively, displayed results similar to those seen when E2 and ICI were used alone in expression of both ERα and PR protein. This suggests that EGCG was unable to compete with the estrogen, E2, and the pure antagonist, ICI, for the estrogen and progestin receptors. Recently, a study was released that reported that EGCG indirectly regulates ERα via the PR.10 If the mechanism by which EGCG elicits its effects on the levels of ERα involves the PR, an alteration in these effects may be observable when EGCG is used in combination with an agonist or antagonist of PR.
Conclusion
Our conclusions contradict the results of studies that state that the ER status in breast cancer cells is not a significant factor regarding the anticancer effects of EGCG.23 There is a lack of information on the mechanism of EGCG; therefore, a clear conclusion cannot be drawn from the literature regarding the estrogenic effects of EGCG.9 The results of our studies aid in understanding the molecular mechanism between phytoestrogens and steroid receptors in breast cancer cells; however, further research is needed to elucidate this potential mechanism of EGCG.
Statement of significance
Our studies confirm the potential of EGCG as a therapeutic agent for breast cancer, based on our observations.
Acknowledgment
Funding was provided by Center of Biomedical Research and Prevention Research Center at Oakland University, Rochester, Michigan.
Disclosure
The authors report no conflicts of interest in this work.
References
Wiechmann L, Kuerer HM. The molecular journey from ductal carcinoma in situ to invasive breast cancer. Cancer. 2008;112(10):2130–2142. | ||
Vaidya Y, Vaidya P, Vaidya T. Ductal carcinoma in situ of the breast. Indian J Surg. 2015;77(2):141–146. | ||
Cowell CF, Weigelt B, Sakr RA, et al. Progression from ductal carcinoma in situ to invasive breast cancer: revisited. Mol Oncol. 2013;7(5):859–869. | ||
Siebert AE, Sanchez AL, Dinda S, Moudgil VK. Effects of estrogen metabolite 2-methoxyestradiol on tumor suppressor protein p53 and proliferation of breast cancer cells. Syst Biol Reprod Med. 2011;57(6):279–287. | ||
De Angelis M, Stossi F, Waibel M, Katzenellenbogen BS, Katzenellenbogen JA. Isocoumarins as estrogen receptor beta selective ligands: isomers of isoflavone phytoestrogens and their metabolites. Bioorg Med Chem. 2005;13(23):6529–6542. | ||
Oseni T, Patel R, Pyle J, Jordan VC. Selective estrogen receptor modulators and phytoestrogens. Planta Med. 2008;74(13):1656–1665. | ||
Wuttke W, Jarry H, Becker T, et al. Phytoestrogens: endocrine disrupters or replacement for hormone replacement therapy? Maturitas. 2003;44(Suppl 1):S9–S20. | ||
Farabegoli F, Barbi C, Lambertini E, Piva R. (-)-Epigallocatechin-3-gallate downregulates estrogen receptor alpha function in MCF-7 breast carcinoma cells. Cancer Detect Prev. 2007;31(6):499–504. | ||
Li MJ, Yin YC, Wang J, Jiang YF. Green tea compounds in breast cancer prevention and treatment. World J Clin Oncol. 2014;5(3):520–528. | ||
De Amicis F, Russo A, Avena P, et al. In vitro mechanism for downregulation of ER-α expression by epigallocatechin gallate in ER+/PR+ human breast cancer cells. Mol Nutr Food Res. 2013;57(5):840–853. | ||
Hou Z, Sang S, You H, et al. Mechanism of action of (−)-Epigallocatechin-3-Gallate: auto-oxidation–dependent inactivation of epidermal growth factor receptor and direct effects on growth inhibition in human esophageal cancer KYSE 150 cells. Cancer Res. 2005;65(17):8049–8056. | ||
Kumar N, Shibata D, Helm J, Coppola D, Malafa M. Green tea polyphenols in the prevention of colon cancer. Front Biosci. 2007;12:2309–2315. | ||
Qiao Y, Cao J, Xie L, Shi X. Cell growth inhibition and gene expression regulation by (-)-epigallocatechin-3-gallate in human cervical cancer cells. Arch Pharm Res. 2009;32(9):1309–1315. | ||
Tachibana H, Koga K, Fujimura Y, Yamada K. A receptor for green tea polyphenol EGCG. Nat Struct Mol Biol. 2004;11(4):380–381. | ||
Wang YC, Bachrach U. The specific anti-cancer activity of green tea (−)-epigallocatechin-3-gallate (EGCG). Amino Acids. 2002;22(2):131–143. | ||
Bode AM, Dong Z. Epigallocatechin 3-gallate and green tea catechins: United they work, divided they fail. Cancer Prev Res (Phila). 2009;2(6):514–517. | ||
Kanwar J, Taskeen M, Mohammad I, Huo C, Chan TH, Dou QP. Recent advances on tea polyphenols. Front Biosci (Elite Ed). 2012;4:111–131. | ||
Shoaib M, Ahmed SA. Role of natural herbs and phytochemicals to minimize tumor and economic burden in breast cancer treatment. Breast Cancer (Dove Med Press). 2016;8:241–242. | ||
Saluzzo J, Hallman KM, Aleck K, et al. The regulation of tumor suppressor protein, p53, and estrogen receptor (ERalpha) by resveratrol in breast cancer cells. Genes Cancer. 2016;7(11–12):414–425. | ||
Katzenellenbogen BS, Frasor J. Therapeutic targeting in the estrogen receptor hormonal pathway. Sem Oncol. 2004;31(Suppl 3):28–38. | ||
Zeng L, Holly JM, Perks CM. Effects of physiological levels of the green tea extract epigallocatechin-3-gallate on breast cancer cells. Front Endocrinol. 2014;5:61. | ||
Zava DT, Blen M, Duwe G. Estrogenic activity of natural and synthetic estrogens in human breast cancer cells in culture. Environ Health Perspect. 1997;105(Suppl 3):637–645. | ||
Stuart EC, Scandlyn MJ, Rosengren RJ. Role of epigallocatechin gallate (EGCG) in the treatment of breast and prostate cancer. Life Sci. 2006;79(25):2329–2336. |
 © 2017 The Author(s). This work is published and licensed by Dove Medical Press Limited. The full terms of this license are available at https://www.dovepress.com/terms.php and incorporate the Creative Commons Attribution - Non Commercial (unported, v3.0) License.
By accessing the work you hereby accept the Terms. Non-commercial uses of the work are permitted without any further permission from Dove Medical Press Limited, provided the work is properly attributed. For permission for commercial use of this work, please see paragraphs 4.2 and 5 of our Terms.
© 2017 The Author(s). This work is published and licensed by Dove Medical Press Limited. The full terms of this license are available at https://www.dovepress.com/terms.php and incorporate the Creative Commons Attribution - Non Commercial (unported, v3.0) License.
By accessing the work you hereby accept the Terms. Non-commercial uses of the work are permitted without any further permission from Dove Medical Press Limited, provided the work is properly attributed. For permission for commercial use of this work, please see paragraphs 4.2 and 5 of our Terms.