")
Back to Journals » Cancer Management and Research » Volume 15
The Ratio of Monocyte to Apolipoprotein A1 is an Independent Predictor of Breast Cancer: A Retrospective Study
Received 31 January 2023
Accepted for publication 6 May 2023
Published 15 May 2023 Volume 2023:15 Pages 423—432
DOI https://doi.org/10.2147/CMAR.S402770
Checked for plagiarism Yes
Review by Single anonymous peer review
Peer reviewer comments 3
Editor who approved publication: Professor Harikrishna Nakshatri
Zhongyuan Lin,* Changliang Luo,* Yulin Yuan
Department of Clinical Laboratory, The People’s Hospital of Guangxi Zhuang Autonomous Region, Guangxi Academy of Medical Sciences, Nanning, Guangxi Zhuang Autonomous Region, People’s Republic of China
*These authors contributed equally to this work
Correspondence: Yulin Yuan, Department of Clinical Laboratory, The People’s Hospital of Guangxi Zhuang Autonomous Region, Guangxi Academy of Medical Sciences, (No. 6 Tao Yuan Road), Nanning, Guangxi Zhuang Autonomous Region, 530021, People’s Republic of China, Email [email protected]
Objective: To explore the predictive value of the ratio of monocyte to apolipoprotein A1 (MAR) (a new index related to inflammation and lipid in breast cancer (BC)) and its relationship with clinicopathological staging.
Methods: The hematological test results of 394 patients with breast diseases, including 276 cases of BC, 118 cases of benign breast disease (BBD), and 219 healthy volunteers (HV), were retrospectively collected. The clinical value of MAR was analyzed with binary logistic regression.
Results: Using statistical software analysis, the results showed that MAR level (P< 0.001) was the largest in the BC group, followed by BBD, and the lowest in the HV group, and it was found to be an indicator to distinguish BC from BBD, also an independent risk factor for BC. The increase in MAR level showed that the risk of BC was 3.733 times higher than that of HV (P< 0.001). In addition, there was a notable difference in MAR between early, middle and late stages of BC patients (P=0.047), with the highest MAR level in late stage (0.510± 0.078) and the lowest MAR level in early stage (0.392± 0.011); the MAR level of those with tumor invasion depth of Phase 4 was the highest (0.484± 0.072), and that of Phase 1/2 was the lowest (0.379± 0.010), with a statistically significant difference (P< 0.001). MAR was positively correlated with tumor invasion depth (P< 0.001, r=0.210), that’s, the size of MAR increased when there was more deeper tumor invasion.
Conclusion: MAR is a new indicator for the auxiliary differential diagnosis of benign and malignant breast diseases, and is also an independent risk factor for BC. High-level MAR is closely related to late staging and tumor invasion depth of BC. It can be seen that MAR is a potentially valuable predictor of BC, and this is the first study to explore the clinical value of MAR in BC.
Keywords: breast cancer, breast benign disease, the ratio of monocyte to apolipoprotein A1, Monocyte, Apolipoprotein A1
Introduction
Breast cancer (BC) has become the most common malignant tumor among women in the world. In the past two decades, epidemiological reports published in different regions of the world have shown that the mortality rate of breast cancer has increased significantly.1 In 2020, there were about 2.3 million new cases of breast cancer and 685,000 deaths worldwide,2 and the number of cases is expected to reach 4.4 million in 2070.3 At the same time, breast cancer accounts for 24.5% of all cancer cases in women.2 The global burden of breast cancer is increasing rapidly, and the population with breast cancer is becoming younger and younger. Its occurrence and development are the result of multiple factors. Surgical treatment is the first choice for the clinical treatment of BC, however, the postoperative recurrence and metastasis rate are high, and the prognosis is poor. Therefore, early screening and diagnosis of breast cancer are of great clinical significance for the development of suitable treatment programs; it is urgent to investigate the biological and pathological characteristics of breast cancer, and determine more reliable hematological predictors that are closely related to the pathological characteristics of BC.
At present, the relationship between cancer-related chronic inflammation, dyslipidemia and malignant tumors has attracted attention.4,5 MAR, obtained from the ratio of monocyte count (M) to ApoA1, is a new diagnostic indicator of some chronic diseases in recent years, such as metabolic syndrome in patients with type-2 diabetes.6 Monocytes are the innate immune cells of the mononuclear phagocyte system in chronic inflammation, and have become an important regulator of cancer development and progression.7 Apolipoprotein A1 (ApoA1) is an important component of blood lipids. It has been shown that dyslipidemia can increase the risk of tumor and is closely related to the prognosis and development of diseases, such as prostate cancer, colorectal cancer and BC.8–10 The ease of collection and detection of blood cell count and blood lipid level from human venous blood samples allows timely evaluation of the patient’s condition. This study aimed to explore the clinical value of MAR, a new index related to inflammation and blood lipid in breast cancer patients, and this was the first study to evaluate the role of MAR in BC in China.
Patients and Methods
Patients
394 patients with breast diseases hospitalized in the Department of Breast and Thyroid Surgery of our hospital from 2019 to 2022 were selected. All of them underwent ultrasound-guided breast biopsies. Based on the results of pathological biopsies, patients were divided into the breast cancer group (276 cases, age 50 ± 10) and the BBD group (118 cases, age 49 ± 12). The selection criteria of patients: 1) meeting the breast cancer staging criteria of the American Joint Commission on Cancer Staging (7th Edition); 2) No anti-cancer treatment. Exclusion criteria: 1) After/post-treatment; 2) Suffering from severe infection; 3) Other tumors; 4) Suffering from diabetes and autoimmune diseases. Additionally, 219 volunteers (aged 48 ± 10 years) who had physical examination in our hospital were selected, and their basic personal information and clinical laboratory parameters were collected. The study protocol was approved by the Ethics Committee of the People’s Hospital of Guangxi Zhuang Autonomous Region (Ethics No.KY-KJT-2021-83), Guangxi Academy of Medical Sciences, (Nanning, China). All subjects were informed of the study and patient consent was obtained.
Methods
The basic personal information and pathological biopsy-related results of involved patients, including age, sex, pathological stage, depth of tumor invasion, lymph node metastasis and the presence of distant metastasis, as well as clinical laboratory parameters, including eosinophil, basophil (B), neutrophil, M, lymphocyte count, platelet count, were collected in this study. These laboratory parameters, such as total cholesterol (TC), triglyceride (TG), low-density lipoprotein cholesterol, high-density lipoprotein cholesterol, ApoA1, were tested by Sysmex (XN9000 automatic blood analyzer). Apolipoprotein B (ApoB) was determined by BECKMAN COULTER AU5800 automatic biochemical analyzer. These instruments were used after daily quality control inspections in strict accordance with operation protocols. All blood samples were collected within two weeks before the operation, during which period the patients were required to quit smoking, drinking and eat light food. NLR is the ratio of neutrophil to lymphoid cells; PLR is the ratio of platelet count to lymphocyte; NAR is the ratio of neutrophil to ApoA1; LAR is the ratio of lymphocyte to ApoA1; PAR is the ratio of platelet to ApoA1; BAR is the ratio of ApoB to ApoA1; MAR is the ratio of monocyte to ApoA1.
Statistical Analysis
In this study, Kolmogorov Smirnov was used to test the normality of data. When continuous variables conformed to normal distribution or logarithmic normal distribution after logarithmic transformation, t-test was used to evaluate the difference between the two groups, otherwise Mann Whitney U-test was used. The truncation value, area under the curve (AUC) and Youden index of each valuable variable were calculated using the receiver operating characteristic curve (ROC). Continuous variables were expressed as mean ± standard deviation (SD) or median (range), and categorical variables were expressed as frequency (percentage). Multivariate logistic regression was used to analyze the risk factors of BC. In addition, Pearson correlation/ Spearman’s rho correlation was used to analyze the correlation between the variables and the clinicopathological staging of BC. A two-tailed P value of no more than 0.05 was considered statistically significant.
Results
The information about the subjects available was retrospectively collected from the medical electronic recording system. All 394 BC patients included in this study received ultrasound-guided breast biopsies, 276 of whom were breast cancer cases. Their general information was as follows: 80 (29.0%), 123 (44.6%), 61 (22.1%), and 12 (4.3%) patients with tumor stage I, II, III, and IV, respectively; 101 (36.6%), 124 (44.9%), 38 (13.8%) and 13 (4.7%) patients had tumor invasion depth of stage 1, 2, 3 and 4, each; 13 (4.7%) patients had distant metastasis. The remaining 118 patients were diagnosed with benign breast diseases, such as breast fibroadenoma, breast cystic hyperplasia, etc.
Difference Analysis of Three Groups
Through statistical software analysis, the comparison of hematological indicators among the breast cancer group, the benign breast disease group and the healthy volunteer group showed that there were statistically significant differences in B (P=0.04), TCHO (P<0.001), TG (P=0.004), ApoA1 (P<0.001), ApoB (P<0.001), NLR (P<0.001), PLR (P<0.001), LMR (P<0.001), NAR (P=0.003), MAR (P<0.001), PAR (P<0.001), BAR (P=0.006) among the three groups (Table 1). Subsequently, the comparison between the two groups showed that B, TG, ApoA1, NLR, PLR, LMR, NAR, LAR, MAR, PAR, BAR was notably different between breast cancer and benign breast disease groups (P<0.05); There were conspicuous differences in TCHO, TG, ApoA1, ApoB, NLR, PLR, LMR, NAR, MAR, PAR between breast cancer and healthy volunteers (P<0.05). Among them, MAR level was the highest in the breast cancer group (0.40 ± 0.16), followed by benign breast disease (0.35 ± 0.13), and the lowest in the healthy volunteer group (0.30 ± 0.08), as shown in Figure 1.
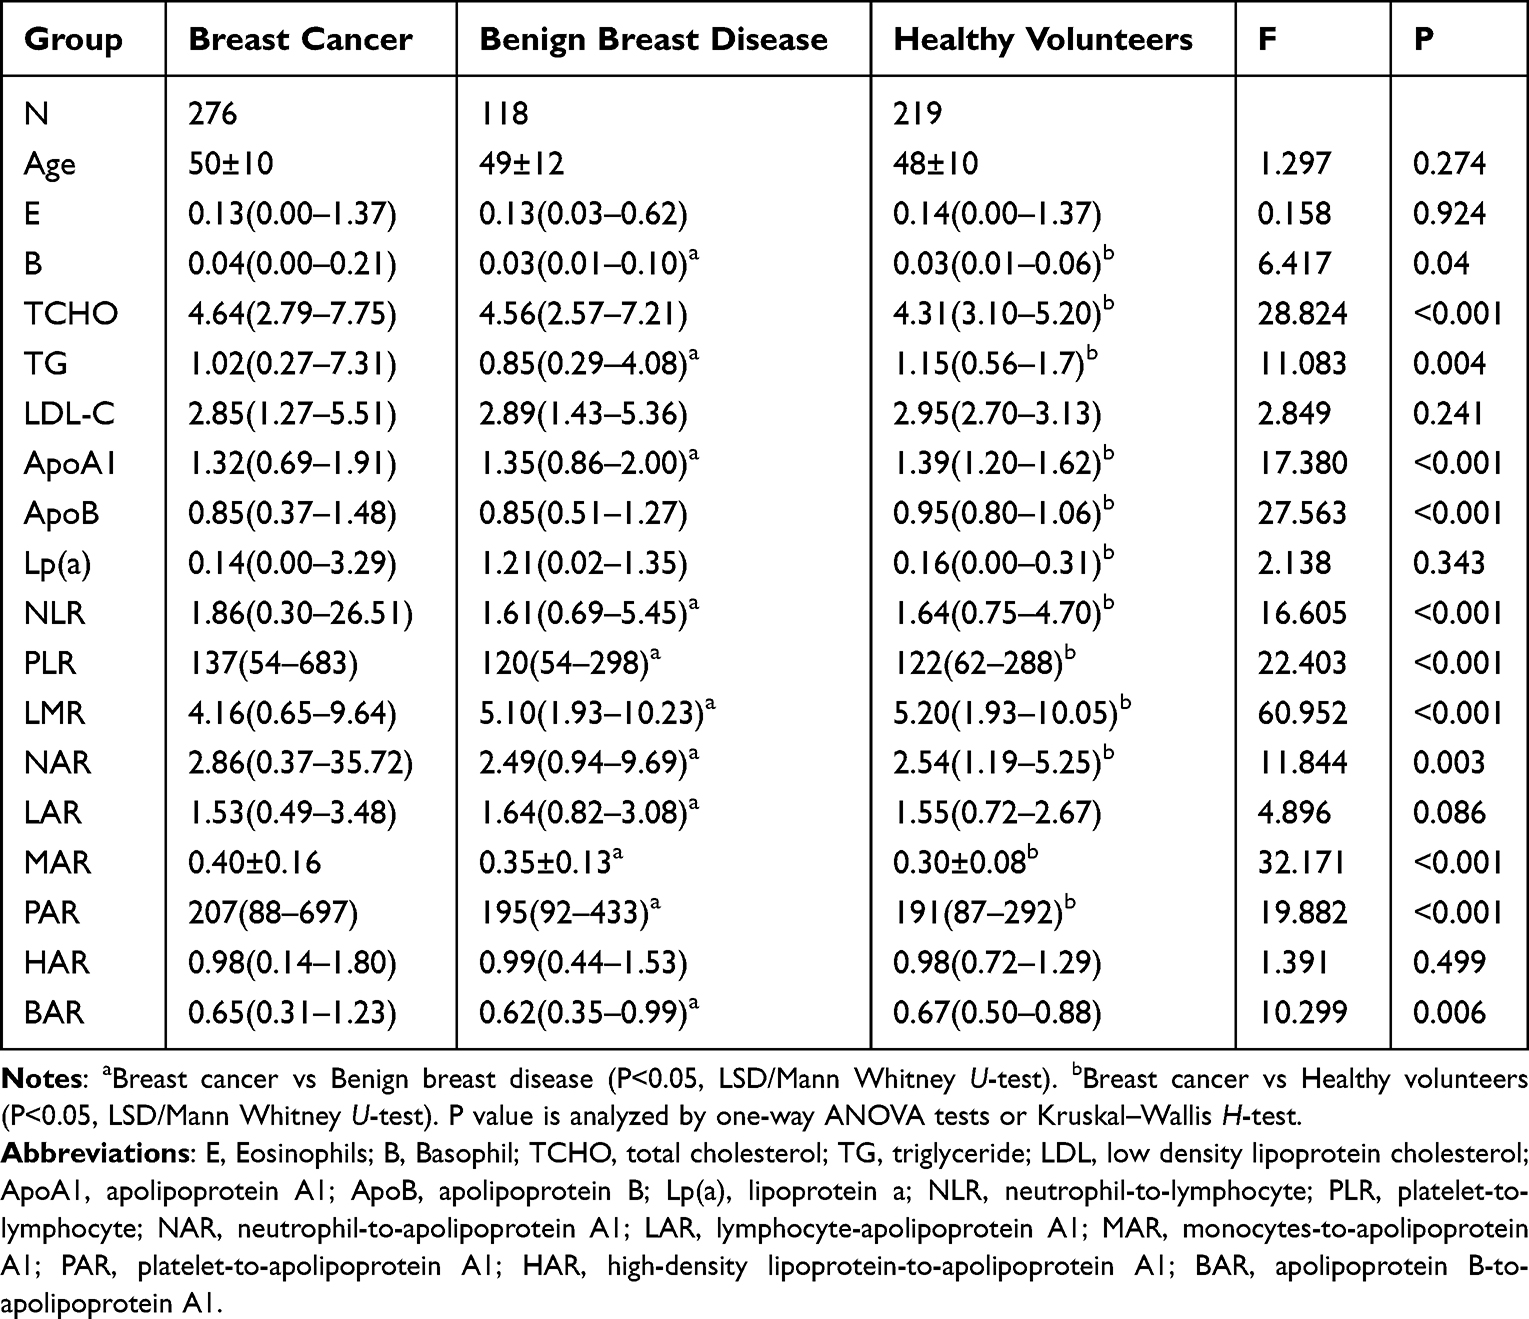 |
Table 1 Comparison of Hematological Parameters Among Patients with Breast Cancer, Those with Benign Breast Disease and Healthy Volunteers |
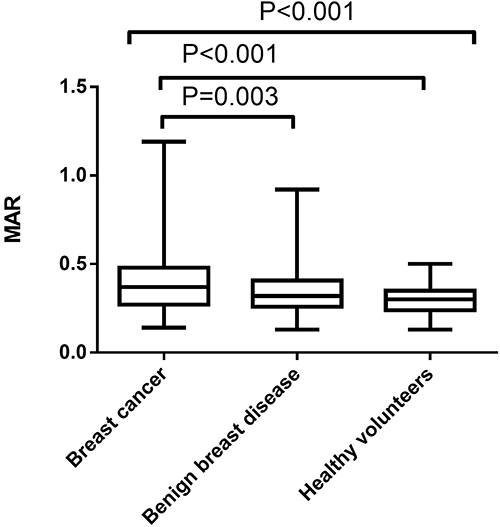 |
Figure 1 Difference of MAR among patients with breast cancer, those with benign breast disease and healthy volunteers. |
Calculation of Cut-off Value of MAR
In Table 2, by drawing the ROC of the subjects, the cut-off values and AUC of NLR, PLR, NAR, PAR, LAR, AAR, MAR were calculated. The cut-off value of MAR in breast cancer and benign breast disease groups was >0.44; the area under the curve was 0.587 (Figure 2), while the cut-off value in the breast cancer and the healthy volunteer groups was >0.37; the area under the curve was 0.683 (Figure 3).
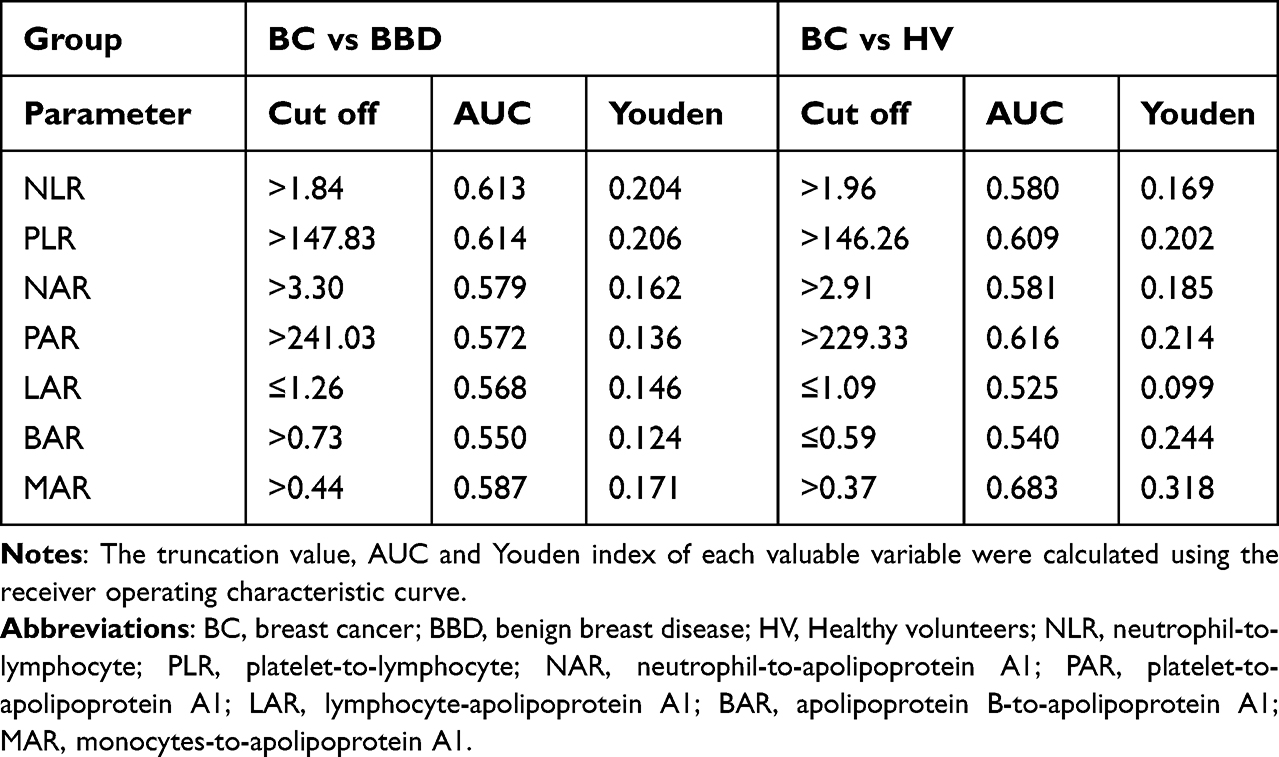 |
Table 2 Identification of Optimal Cut-off Values for Different Predictive Factors Based on the ROC Curve |
 |
Figure 2 ROC curve analysis of MAR in patients with breast cancer and those with benign breast disease. |
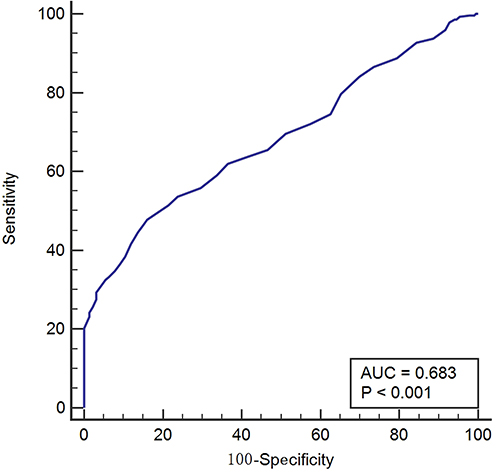 |
Figure 3 ROC curve analysis of MAR in patients with breast cancer and healthy volunteers. |
Binary Logistic Regression Analysis
As shown in Table 3, binary logistic regression analysis showed that MAR was an indicator to distinguish breast cancer from benign breast disease, and also an independent risk factor for breast cancer. The increase in MAR level demonstrated that the risk of breast cancer was 3.733 times higher than that of the healthy volunteers (P<0.001).
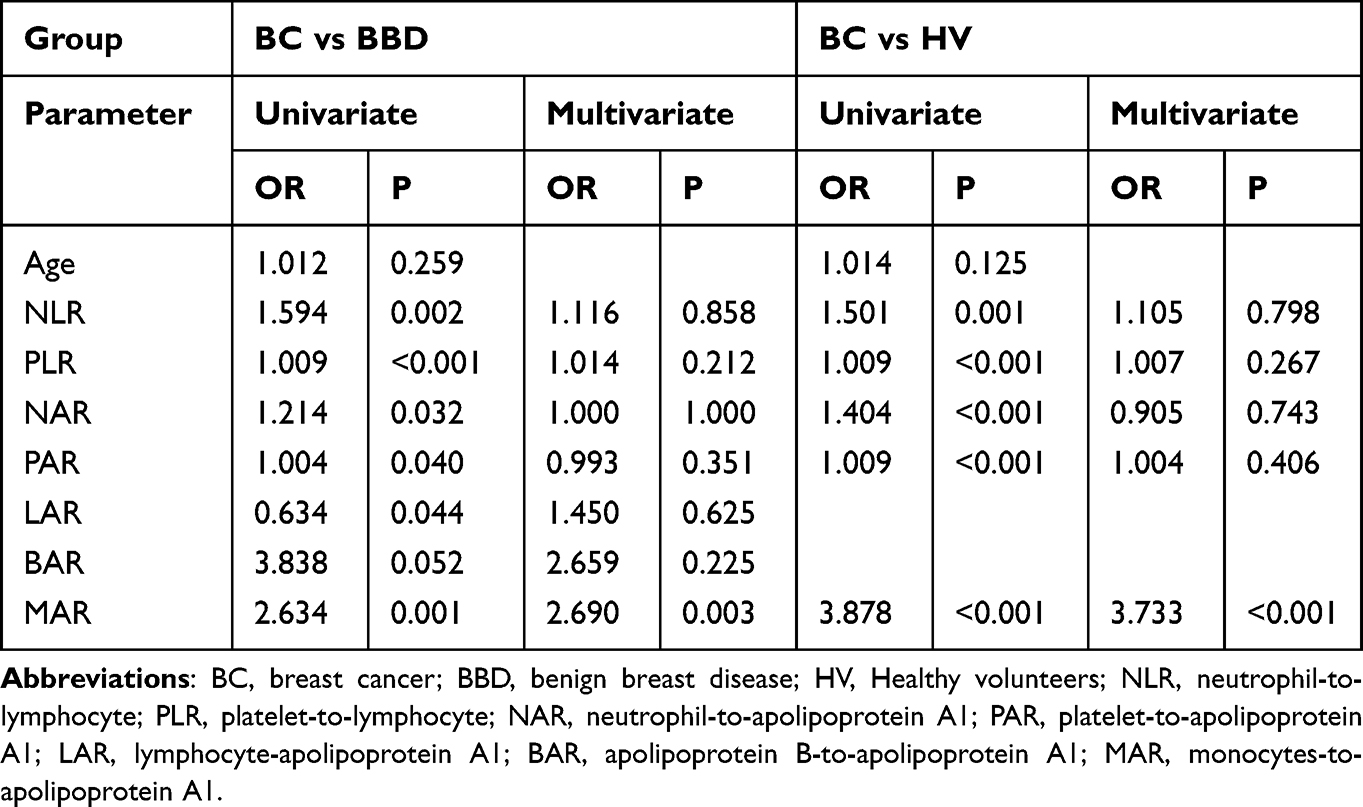 |
Table 3 The Predictive Factors of the Two Groups Identified by Univariate and Multivariate Logistic Regression |
Relationship Between MAR and Clinicopathological Staging of 276 Cases of Breast Cancer
As shown in Table 4, there was a significant difference in MAR among the early, middle and late stage of breast cancer (P=0.047, Figure 4A), with the highest MAR level in late stage (0.510 ± 0.078) and the lowest MAR level in early stage (0.392 ± 0.011). In addition, the MAR level of breast cancer patients with tumor invasion depth of phase 4 was the highest (0.484 ± 0.072), and that of breast cancer patients with tumor invasion depth of phase 1/2 was the lowest (0.379 ± 0.010), with a statistically significant difference (P<0.001, Figure 4B).
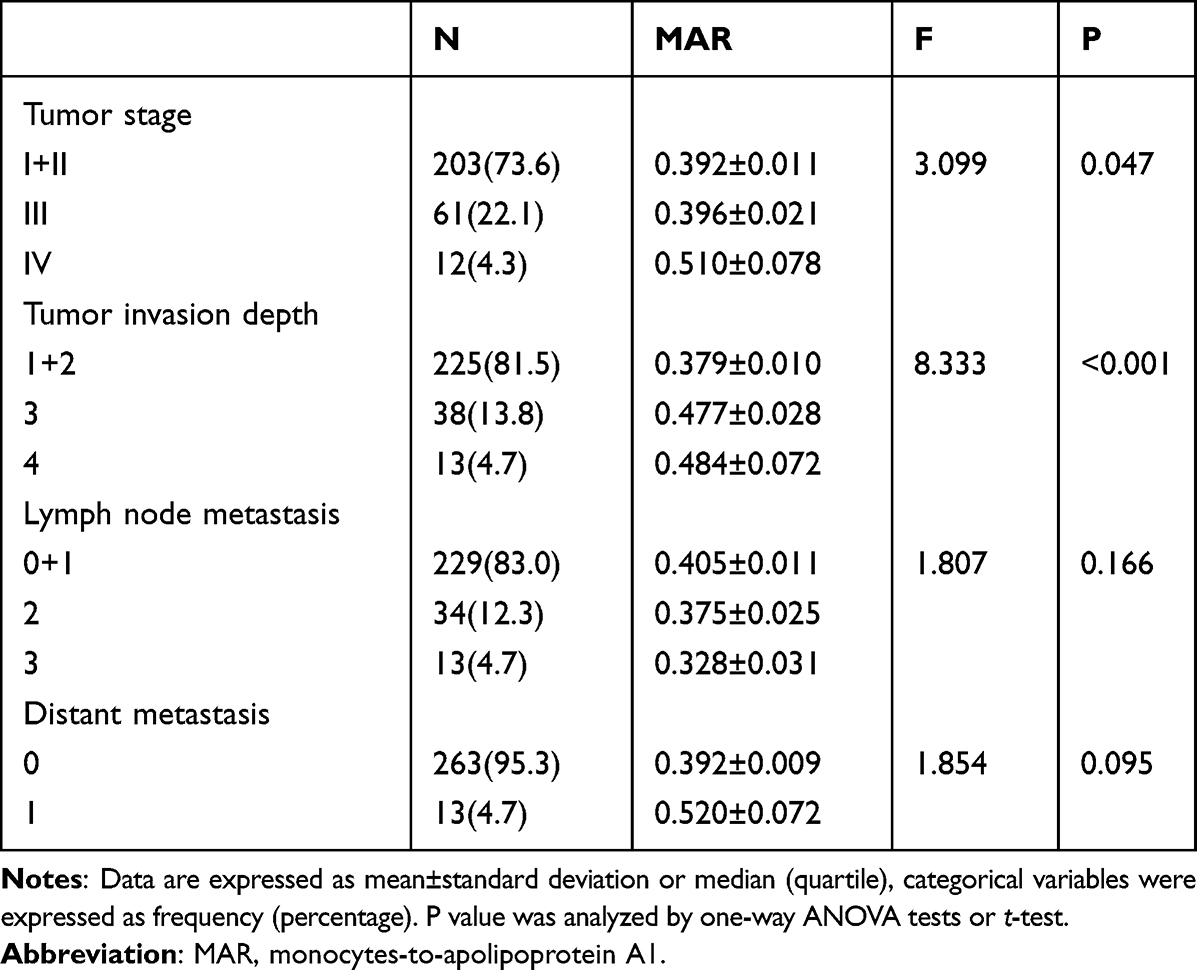 |
Table 4 Analysis of MAR and Clinicopathological Staging of Breast Cancer Patients |
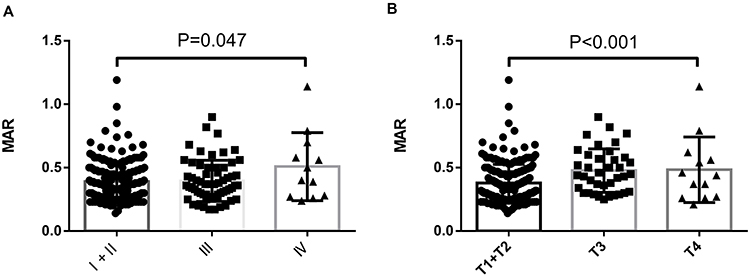 |
Figure 4 Difference of MAR in breast cancer patients with diverse tumor stage (A) and depth of invasion (B). |
In addition, as shown in Table 5, MAR was correlated with PLT (P<0.001, r=0.221), N (P<0.001, r=0.484), E (P<0.001, r=0.221), TCHO (P=0.031, r=−0.130), HDL-C (P<0.001, r=−0.350), NLR (P<0.001, r=0.400), and PLR (P<0.001, r=0.248). Importantly, MAR was positively correlated with tumor invasion depth (P<0.001, r=0.210), that’s, the size of MAR increased when there was more deeper tumor invasion.
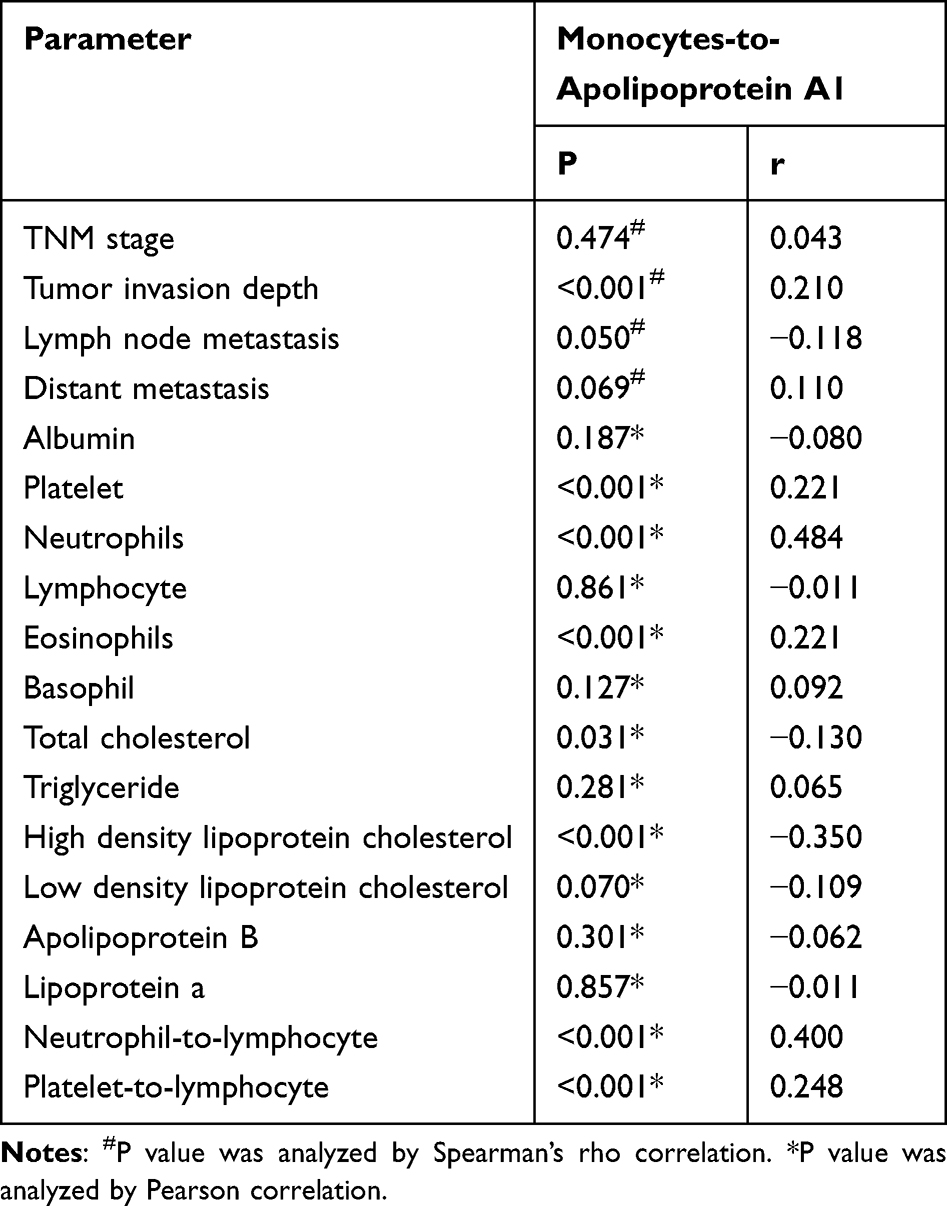 |
Table 5 Correlation Between MAR and Clinicopathological Staging and Other Parameters of Breast Cancer Patients |
Discussion
Specific metabolic processes are involved in the occurrence and development of tumors, and malignant transformation of tumor cell phenotype mainly occurs in the process of lipid metabolism.11,12 The presence of lipids in the human body mainly comes from the diet and the synthesis of liver cells. The change of the local microenvironment of tumor may cause lipid metabolism disorder.13 ApoA I is the main apolipoprotein in HDL and the largest component of ApoA family, which plays a key role in blood lipids.14 Additionally, chronic inflammation is closely related to the occurrence and development of tumors.15 Inflammation provides a good environment for oncogenesis. The continuous production of reactive oxygen species by inflammatory cells may cause oxidative stress reactions. Strong oxidative stress will lead to cell and DNA damage and the accumulation of gene mutations, inducing the occurrence and development of inflammation-related tumors.16 M is the main inflammatory cell, and MAR is derived from the ratio of M to ApoA I. Its clinical value has been preliminarily explored in patients with type-2 diabetes metabolic syndrome.6
In this study, the venous blood indicators of breast cancer, benign breast diseases and healthy volunteers were analyzed, and it was found that the level of MAR was the largest in the breast cancer group, followed by benign breast diseases, and the lowest among the healthy volunteers, suggesting that MAR can be used for the auxiliary differential diagnosis of benign and malignant breast diseases. It is speculated that the difference of MAR ratio in benign and malignant breast diseases is mediated by abnormal blood lipid and chronic inflammation in patients. It is believed that the rapid division and proliferation of tumor cells require the use of lipid biosynthesis to provide a large number of biomembrane components and organelles.17,18 Through this process, a series of oxidative signal molecules such as sphingomyelin and phosphatidylinositol are synthesized to accelerate the progression of cancer.19 This mechanism can potentially be used to explain the relationship between dyslipidemia and the progression of breast cancer.20,21 Some studies22,23 found that adipocytes from the tumor microenvironment (TME) showed less differentiation than adipocytes from the normal microenvironment, indicating that the adipose microenvironment was involved in the signal transduction pathway of breast cancer, thus contributing to tumor growth and distant metastasis.
Using binary logistic regression analysis, it was found that MAR is an independent risk factor of breast cancer, and the increased level of MAR indicated that the risk of breast cancer is 3.733 times higher than that of healthy volunteers. In addition, analysis of the pathological data of these 276 breast cancer patients showed that 1) there was a statistically significant difference in MAR among these patients in the early, middle and late stages, that is, the level of MAR in the late stage was the highest and that in the early stage was the lowest; 2) In these patients, the MAR level in phase 4 was the highest, and that in Phase 1/2 was the lowest; 3) MAR was positively correlated with tumor invasion depth, that’s, the size of MAR increased when there was more deeper tumor invasion, suggesting that MAR is closely related to the poor pathological characteristics of BC. The lipid in TME is activated and used as the main energy source and key regulator in tumor cells and related immune cells. Mononuclear cells are the main inflammatory cells in tumor stroma. Mononuclear phagocytes, composed of innate immune cells, circulate from blood flow to tissues under normal conditions. When stimulated by inflammatory signals, their number and transport speed continue to increase. They play an important role in supporting tissue homeostasis, initiating and spreading host responses to pathogens, and enhancing the immune response to excessive tissue damage.7,24,25 Recent research26 showed that tumor cells surviving in malignant tumors escape host immune defense through various methods, and reprogram anti-tumor immune response into a tumor-friendly phenotype to achieve unlimited growth and metastasis. Its high proliferation rate increases the demand for local nutrition and oxygen, aggravating the hypoxic TME wireless vicious cycle, which is also in the process of cancer occurrence and development as a result of complex interaction between TME and tumor cells.4,27
Wang et al6 believed that MAR was a risk factor for type-2 diabetes metabolic syndrome. The MAR level of diabetes patients with metabolic syndrome was lower than that of patients without metabolic syndrome, with a cutoff value of 3.95. The results of this study showed that high MAR was an independent risk factor for BC, with a cutoff value of 3.7 close to the value in the study by Wang et al, suggesting that high MAR was a risk factor for breast cancer. Li et al28 also discussed the prognostic value of MAR in patients with stage 3 nasopharyngeal carcinoma, albeit without promising results. In any case, the data in this study demonstrated that MAR is an independent risk factor for BC, and the high level of MAR is closely related to the pathological characteristics of BC, underscoring the important clinical significance of MAR in BC.
This study has some limitations. For example, most of the subjects included in this study are local residents, and some patients may have other undiagnosed diseases, which may affect the accuracy of the conclusion. Secondly, the exact mechanism of MAR in BC is still unclear.
Conclusions
In conclusion, the results of this study showed that MAR is a new indicator for the differential diagnosis of benign and malignant breast diseases, and also an independent risk factor for breast cancer. High MAR is closely related to late stages of breast cancer, deeper tumor invasion, and distant metastasis. It can be seen that MAR is a potential predictor of BC. To our knowledge, this is the first study to investigate the clinical value of MAR in BC in China. It is hoped that more research in the future will explore the exact pathogenic mechanism of BC in this direction, provide reference for the diagnosis and the treatment of BC, and contribute to the improved quality of life of patients.
Abbreviations
95% CI, 95% confidence interval; ApoA1, apolipoprotein A1; ApoB, apolipoprotein B; AUC, area under the receiver operating characteristic (ROC) curve; BAR, ApoB, apolipoprotein B-to-apolipoprotein A1; BC, breast cancer; BBD, benign breast disease; HAR, high-density lipoprotein-to-apolipoprotein A1; HDL, high density lipoprotein cholesterol; LAR, lymphocyte-apolipoprotein A1; LDL, low density lipoprotein cholesterol; Lp (a), lipoprotein a; MAR, monocytes-to-apolipoprotein A1; NAR, neutrophil-to-apolipoprotein A1; NLR, neutrophil-to-lymphocyte; PAR, platelet-to-apolipoprotein A1; PLR, platelet-to-lymphocyte; TCHO, total cholesterol; TG, triglyceride.
Data Sharing Statement
The data generated in the present study are included in the figures and tables of this article.
Ethical Approval
The study was approved by the Ethics Committee of The People’s Hospital of Guangxi Zhuang Autonomous Region, Guangxi Academy of Medical Sciences, and all the participants were orally informed and agreed.
Patient Consent for Publication
The manuscript did not contain the patient’s identity information, and all participants agreed to publish.
Acknowledgments
We highly appreciate the efforts dedicated by staffs at Department of Clinical Laboratory, The People’s Hospital of Guangxi Zhuang Autonomous Region, Guangxi Academy of Medical Sciences, Nanning, China.
Funding
There is no funding to report.
Disclosure
The authors declare that they have no conflict of interest.
References
1. Lei S, Zheng R, Zhang S, et al. Global patterns of breast cancer incidence and mortality: a population-based cancer registry data analysis from 2000 to 2020. Cancer Commun. 2021;41(11):1183–1194. doi:10.1002/cac2.12207
2. Sung H, Ferlay J, Siegel RL, et al. Global cancer statistics 2020: GLOBOCAN estimates of incidence and mortality worldwide for 36 cancers in 185 countries. CA Cancer J Clin. 2021;71(3):209–249. doi:10.3322/caac.21660
3. Soerjomataram I, Bray F. Planning for tomorrow: global cancer incidence and the role of prevention 2020–2070. Nat Rev Clin Oncol. 2021;18(10):663–672. doi:10.1038/s41571-021-00514-z
4. Pansy K, Uhl B, Krstic J, et al. Immune regulatory processes of the tumor microenvironment under malignant conditions. Int J Mol Sci. 2021;22(24):13311. doi:10.3390/ijms222413311
5. de Jesus M, Mohammed T, Singh M, et al. Etiology and management of dyslipidemia in patients with cancer. Front Cardiovasc Med. 2022;9:892335. doi:10.3389/fcvm.2022.892335
6. Wang W, Chen ZY, Guo XL, et al. Monocyte to high-density lipoprotein and apolipoprotein A1 ratios: novel indicators for metabolic syndrome in Chinese newly diagnosed type 2 diabetes. Front Endocrinol (Lausanne). 2022;13:935776. doi:10.3389/fendo.2022.935776
7. Olingy CE, Dinh HQ, Hedrick CC. Monocyte heterogeneity and functions in cancer. J Leukoc Biol. 2019;106(2):309–322. doi:10.1002/JLB.4RI0818-311R
8. Li J, Ren S, Piao HL, et al. Integration of lipidomics and transcriptomics unravels aberrant lipid metabolism and defines cholesteryl oleate as potential biomarker of prostate cancer. Sci Rep. 2016;6:20984. doi:10.1038/srep20984
9. Christensen LL, True K, Hamilton MP, et al. SNHG16 is regulated by the Wnt pathway in colorectal cancer and affects genes involved in lipid metabolism. Mol Oncol. 2016;10(8):1266–1282. doi:10.1016/j.molonc.2016.06.003
10. Merdad A, Karim S, Schulten HJ, et al. Transcriptomics profiling study of breast cancer from Kingdom of Saudi Arabia revealed altered expression of Adiponectin and Fatty Acid Binding Protein4: is lipid metabolism associated with breast cancer? BMC Genom. 2015;16(Suppl1):S11. doi:10.1186/1471-2164-16-S1-S11
11. Skotland T, Kavaliauskiene S, Sandvig K. The role of lipid species in membranes and cancer-related changes. Cancer Metastasis Rev. 2020;39(2):343–360. doi:10.1007/s10555-020-09872-z
12. Butler LM, Perone Y, Dehairs J, et al. Lipids and cancer: emerging roles in pathogenesis, diagnosis and therapeutic intervention. Adv Drug Deliv Rev. 2020;159:245–293. doi:10.1016/j.addr.2020.07.013
13. Hanahan D, Weinberg RA. Hallmarks of cancer: the next generation. Cell. 2011;144(5):646–674. doi:10.1016/j.cell.2011.02.013
14. Cochran BJ, Ong KL, Manandhar B, et al. APOA1: a protein with multiple therapeutic functions. Curr Atheroscler Rep. 2021;23(3):11. doi:10.1007/s11883-021-00906-7
15. Certo M, Tsai CH, Pucino V, et al. Lactate modulation of immune responses in inflammatory versus tumour microenvironments. Nat Rev Immunol. 2021;21(3):151–161. doi:10.1038/s41577-020-0406-2
16. Candido J, Hagemann T. Cancer-related inflammation. J Clin Immunol. 2013;33(Suppl 1):S79–84. doi:10.1007/s10875-012-9847-0
17. Giudetti AM, De Domenico S, Ragusa A, et al. A specific lipid metabolic profile is associated with the epithelial mesenchymal transition program. Biochimica Et Biophysica Acta. 2019;1864(3):344–357. doi:10.1016/j.bbalip.2018.12.011
18. Marino N, German R, Rao X, et al. Upregulation of lipid metabolism genes in the breast prior to cancer diagnosis. NPJ Breast Cancer. 2020;6:50. doi:10.1038/s41523-020-00191-8
19. Zeng Y, Ren K, Zhu X, et al. Long noncoding RNAs: advances in lipid metabolism. Adv Clin Chem. 2018;87:1–36.
20. Furuta E, Pai SK, Zhan R, et al. Fatty acid synthase gene is up-regulated by hypoxia via activation of Akt and sterol regulatory element binding protein-1. Cancer Res. 2008;68(4):1003–1011. doi:10.1158/0008-5472.CAN-07-2489
21. Lu S, Archer MC. Sp1 coordinately regulates de novo lipogenesis and proliferation in cancer cells. Int J Cancer. 2010;126(2):416–425. doi:10.1002/ijc.24761
22. Nowak C, Ärnlöv J. A Mendelian randomization study of the effects of blood lipids on breast cancer risk. Nat Commun. 2018;9(1):3957. doi:10.1038/s41467-018-06467-9
23. Wang YY, Attané C, Milhas D, et al. Mammary adipocytes stimulate breast cancer invasion through metabolic remodeling of tumor cells. JCI Insight. 2017;2(4):e87489. doi:10.1172/jci.insight.87489
24. Kim KW, Ivanov S, Williams JW. Monocyte recruitment, specification, and function in atherosclerosis. Cells. 2020;10(1). doi:10.3390/cells10010015
25. Trzebanski S, Jung S. Plasticity of monocyte development and monocyte fates. Immunol Lett. 2020;227:66–78. doi:10.1016/j.imlet.2020.07.007
26. Yu W, Lei Q, Yang L, et al. Contradictory roles of lipid metabolism in immune response within the tumor microenvironment. J Hematol Oncol. 2021;14(1):187. doi:10.1186/s13045-021-01200-4
27. Barkley D, Moncada R, Pour M, et al. Cancer cell states recur across tumor types and form specific interactions with the tumor microenvironment. Nat Genet. 2022;54(8):1192–1201. doi:10.1038/s41588-022-01141-9
28. Li J, Wu YL, Li WF, et al. Neutrophil to apolipoprotein A-I ratio as an independent indicator of locally advanced nasopharyngeal carcinoma. Laryngoscope Investig Otolaryngol. 2021;6(5):1049–1061. doi:10.1002/lio2.660
 © 2023 The Author(s). This work is published and licensed by Dove Medical Press Limited. The full terms of this license are available at https://www.dovepress.com/terms.php and incorporate the Creative Commons Attribution - Non Commercial (unported, v3.0) License.
By accessing the work you hereby accept the Terms. Non-commercial uses of the work are permitted without any further permission from Dove Medical Press Limited, provided the work is properly attributed. For permission for commercial use of this work, please see paragraphs 4.2 and 5 of our Terms.
© 2023 The Author(s). This work is published and licensed by Dove Medical Press Limited. The full terms of this license are available at https://www.dovepress.com/terms.php and incorporate the Creative Commons Attribution - Non Commercial (unported, v3.0) License.
By accessing the work you hereby accept the Terms. Non-commercial uses of the work are permitted without any further permission from Dove Medical Press Limited, provided the work is properly attributed. For permission for commercial use of this work, please see paragraphs 4.2 and 5 of our Terms.