")
Back to Journals » Eye and Brain » Volume 11
The Psychophysical Assessment of Hierarchical Magno-, Parvo- and Konio-Cellular Visual Stream Dysregulations in Migraineurs
Received 29 July 2019
Accepted for publication 8 November 2019
Published 29 November 2019 Volume 2019:11 Pages 49—62
DOI https://doi.org/10.2147/EB.S225171
Checked for plagiarism Yes
Review by Single anonymous peer review
Peer reviewer comments 2
Editor who approved publication: Professor Margaret Wong-Riley
Michael F Wesner,1 James Brazeau2
1Psychology Department, Lakehead University, Thunder Bay, Ontario P7B 5E1, Canada; 2Center for Pediatric Excellence, Ottawa, ON K2G 1W2, Canada
Correspondence: Michael F Wesner
Psychology Department, Lakehead University, 955 Oliver Road, Thunder Bay, Ontario P7B 5E1, Canada
Tel +1-807-768-0564
Email [email protected]
Introduction: Although conscious, image-forming illusions have been noted in migraine, few studies have specifically sought to collectively evaluate the role of all three parallel visual processing streams in the retinogeniculostriate pathway involved with image-forming vision and their implications in the development of migraine symptoms.
Methods: We psychophysically assessed the functionality of the inferred magnocellular (MC), parvocellular (PC), and koniocellular (KC) streams at different hierarchical loci across three clinical groups: individuals who experience migraine with aura (MA; n=13), experience migraine without aura (MWO; n=14), and Controls (n=15). Participants completed four experiments: Experiment 1 designed to assess retinal short-wavelength-sensitive (S-) cone sensitivities; Experiment 2 intended to measure postretinal temporal and spatiochromatic contrast sensitivities; Experiment 3 intended to assess postretinal spatiotemporal achromatic contrast sensitivities; and Experiment 4 designed to measure thalamocortical color discriminations along the three cone-excitation axes.
Results: S-cone deficits were revealed with greater retinal areas being affected in MA compared to MWO participants. Findings across the four experiments suggest a prominent retinal locus of dysfunction in MA (lesser in MWO) with potential feedforward compensations occurring within the KC visual stream.
Conclusion: Complex, integrative network compensations need to be factored in when considering the dysregulating influences of migraine along the visual pathway.
Keywords: migraine, S-cones, koniocellular, parvocellular, magnocellular, spatiochromatic
Plain Language Summary
Automated perimetry designed to measure the responses of short-wavelength-sensitive or S-cones (formerly referred to as “blue” cones) revealed S-cone deficits with a greater area of the retina being affected in migraineurs with aura compared to migraineurs without aura symptoms. This retinal locus of dysfunction appears to alter higher level, postretinal-associated streams involved with image-based perception, possibly as a means to compensate for the migraine-induced deficit of the retina. It is clear that complex, integrative network compensations need to be factored in when considering the dysregulating influences of migraine along the visual pathway.
Introduction
Although there is a strong consensus that migraine begins with cortical hyperexcitability followed by spreading waves of compensatory inhibition throughout the cortical surface,1 evidence also points to the trigeminovascular system and its associated subcortical and neuro-ophthalmologic manifestations as the etiological source for migraine.2–7 Whether vasogenic or neurogenic in origin, numerous studies have investigated visual pathway operations in an attempt to identify the pathogenesis of migraine through its characteristic visual symptoms such as triggers, visual snow, halos, phosphenes, paliopsia, and photophobias.7 Interestingly, many of the hallucinatory symptoms have been identified as stable geometric fortifications (ie, Kluver’s forms8) that scale out to the same hexagonally packed cortical hypercolumns of the cortex.9 From a hierarchical standpoint, this putative mapping implicates early V1 striatal functionality, although more complex illusions have also been identified with V3A and V8.10 Neuroimaging and behavioral detection and discrimination techniques using various spatiotemporal patterns, colors, forms, or tasks involving word recognition, word priming, or spatial orienting attention have also pointed to visual extrastriate cortical activity in both aura and nonaura migraineurs,11–17 while V1 processing has been implicated with neuroimaging or with psychophysical threshold measurements of spatiotemporal contrast or texture orientation.17–25 Meanwhile, automated perimetry, temporal flicker, electrooculography and evoked potential measurements have pointed either to subcortical pre-striatal deficits,26–30 or to more peripheral, retina photoreceptor dysregulation31 or ocular damage based on ischemia and vasospasmic nerve damage similar to that observed in glaucoma.32–35
Given the variety of visual deficits reported in migraineurs, it is evident that any dysregulations in the visual pathway are not uniform; rather the symptomatic expressions are probably more specific to one or more of the retinofugal parallel processing streams within the pathway: the magnocellular (MC), the parvocellular (PC), and the koniocellular (KC) stream. Pre-cortical transmission of stimulus information through these anatomically distinct, yet interrelated, streams are ultimately involved with different functional attributes. For example, the luminance-contrast sensitive MC stream involves the summation of long-wavelength-sensitive (L) and middle-wavelength-sensitive (M) cones and is usually associated with low spatial, high temporal frequency responses. By comparison, the PC stream is thought to best process high spatial, low temporal luminance and chromatic signals, with the latter transmitting opponent red-green signals derived from the differencing of L- and M-cones.36–39 Temporally modulated perimetry has revealed migraine deficiencies aligned with MC operations21,27,40,41 while periodic contrast sensitivity deficits have suggested PC stream involvement as well.22,42 Of particular interest, however, is the KC stream in which the short-wavelength-sensitive (S) cones, through their associated bipolar cells, generate S-ON signals alongside the spatially antagonistic (M+L)-OFF signals found in the bistratified retinal ganglion cells that make up the origins of the “blue-yellow” (B/Y) opponency system.43–47 Retinal S-cone functioning can be assessed using short-wavelength automated perimetry (SWAP) or “blue-on-yellow” perimetry in which short-wavelength circular “blue” targets presented along varying visual field positions are superimposed on a bright “yellow” background that saturates the rods, L- and M-cones.48,49 McKendrick, Cioffi, and Johnson33 were among the first to compare S-cone sensitivities in migraineurs and controls using SWAP, and found that 50% of their migraine patients had interictal sensitivity loss. Interestingly, these deficits were often localized to one eye, suggesting a prestriatal deficit. Subsequent perimetric evidence also points to S-cone desensitizations.29,34 These types of perimetric measurements highlight the importance of examining not only the higher pathways that are associated with migraine-induced perceptions but also the peripheral regions that drive these higher level operations, particularly within the same individual.
Selective migraine deficits have not only been noted in S-cone functionality but also postreceptorally within the KC stream in which elevated increment detection thresholds, decreased contrast sensitivity measures, impaired tritanopic discriminations, and altered suprathreshold color scaling responses to S-cone-related chromaticities have been reported.15,16,29 Although it is tempting to conclude that dysregulations of the S-cones and their associated KC projections are of primary importance when it comes to visual dysfunction in migraine, earlier research has shown that spatial-frequency-responding cells associated with the KC stream can have low-pass spatiotemporal characteristics to chromatic stimuli as well as band-pass spatiotemporal characteristics to achromatic stimuli,50 both properties that are also identified with MC and PC cells, respectively.39,51,52 These similarities could lead to misleading conclusions that are actually premised on the more dominant PC- and MC-based perceptual properties in humans. Also important is the problem of paradigm specificity in which conclusions drawn from one study may be task-specific and thus not easily generalizable to all migraine visual deficits. To our knowledge, only Shepherd15 made specific attempts to assess migraine performance deficits by running a series of experiments that facilitated the isolation of processing levels.
Modifying the spatiochromatic and spatiotemporal properties of a stimulus so that it can selectively probe the operations of the three retinogeniculostriate processing streams at different hierarchical levels within the same migraineur, and then comparing these findings to non-migraine individuals provides a comprehensive analysis of visual deficits and their pathway specificity. Certainly, when it comes to behavioral measures, even psychophysical ones, a cautionary note needs to be given with respect to the functional discreteness that is bound to the stimulus.53,54 Psychophysics never completely isolates the operations of parallel streams. However, making inferences about stream biases along with localizing hierarchical process stagings based on research design are valid ones, particularly when the metrics are contextually premised on system, and not unit-level analyses.55 In the current study, the properties of the three visual streams (MC, PC, KC) in migraineurs with aura (MA) and migraineurs without aura (MWO) were psychophysically assessed in four separate experiments. In order to target different hierarchical processing loci, we measured four different sensitivities: S-cone retinal sensitivity using the SWAP (Experiment 1), postreceptoral chromatic spatiotemporal contrast sensitivity using heterochromatic, isoluminant vertical 2-D Gabors presented steadily or counterphase flickered for maximal PC- and KC-responsivity (Experiment 2), postreceptoral achromatic spatiotemporal contrast sensitivity using heteroluminant Gabors presented steadily or counterphase flickered for maximal PC- and MC-responsivity, respectively (Experiment 3), and postreceptoral/cortical color discriminability along three cardinal chromatic axes using the Cambridge Trivector Colour Test (Experiment 4). Based on past research, we expected to find significantly more migraine-related deficits in measures that probed different hierarchical stages of the S-cone driving KC stream. The logic goes that if the pathophysiology of migraine is similar to that of glaucoma, then the vulnerable S-cones should yield the greatest deficits with the SWAP, with lesser effects showing up for early postreceptoral operations characterized by the contrast measurements and higher-end color discrimination perceptions due to cortical redundancies and gain compensations. Alternatively, if indeed migraine is strongly tied to an impairment of GABAergic inhibitory neural networks in the visual cortex,11,56 then the resultant disinhibition will compromise receptive field spatial antagonisms, thereby rendering a loss in chromatic or achromatic contrast sensitivity, with little impact on temporal sensitivity. Any extrastriate disruptions should be revealed primarily by the color discrimination task.
Finally, task specificity may be the source of the equivocal MA versus MWO findings; some researchers view MA and MWO to be subtypes of the same pathogenic mechanism in which symptomatic distinctions are based on implicit sensory cortical disruptions.57,58 We maintain the MA and MWO distinction to be aligned with extrastriate dysfunctions that may also be associated with MWO nonvisual hallucinatory experiences.1
Methods
Participants
Participants (N=37) were students with normal or corrected-to-normal vision recruited through Lakehead University courses and through posted and electronic advertisements. All were fully informed regarding the nature and procedures of the study and provided written consent. Procedures were reviewed and approved by the university Research Ethics Board.
Fifteen participants (10 female) with no history of migraine or frequent headaches served as Controls. Remaining participants were classified as either MA (n=13; female=11) or MWO (n=14; female=10) in accordance with the International Classification of Headache Disorders guidelines.59 We compared the findings of our male and female participants and found no significant gender-based chromatic functioning differences.60 In order to control for the influence of menstrual cycle, we asked all female participants to complete a modified questionnaire regarding their use of birth control and to provide information that could be used as an estimate of menstrual phase. We used the backward count method to identify mid-follicular and late luteal phases of their cycle.61 Again, our results showed no significant difference in menstrual phase across groups. Similarly, no significant differences were found for individuals taking and not taking birth control across groups.
MA participants were required to have visual aura symptoms for 3 years. Groups were approximately age-matched: Controls [M = 21.3 ± 2.87 (SD)], MA [M = 22.15 ± 6.58 (SD)] and MWO [M = 21.86 ± 3.48 (SD)]. No significant differences in Migraine-Disability-Assessment scores (MIDAS) were found between the MA [25.54 ± 41.41] and MWO [16.07 ± 13.28] groups. Collectively, the MIDAS scores indicated that the majority of participants were in the moderate to severe range of disability with comparable levels of experienced pain (0=’no pain’ to 10=’extreme’) during an average headache (MAmean = 6.61 ± 1.89; MWOmean = 6.14 ± 2.03). A series of t-tests revealed no significant differences in average lifetime duration of migraine headaches (MA: 10.5 ± 7.58 years; MWO: 9.6 ± 6.3 years), average number of headaches experienced per month (MA: 2.75 ± 2.6; MWO: 4 ± 3.46), average duration of each headache episode (MA: 5.45 ± 6.4 hrs; MWO: 9.16 ± 13.3 hrs), and average time since last headache (MA: 22.75 ± 18.82 days; MWO: 19.9 ± 9.45 days). All migraineurs were tested interictally at least 24 hrs after their last attack.
Screening Procedures
All participants had a Freiburg Visual Acuity Test (FrACT) near acuity score greater than 0.04 log MAR and none had color vision deficits (Ishihara pseudoisochromatic 24–plate edition). None of the participants had any acute or chronic eye disorders, history of glaucoma, hyper/hypotension, diabetes, or epilepsy. Also, no participants were taking any anti-migraine medication nor did they experience a migraine attack within a 48 hr period prior to testing.
Calibration
For all displays used in all of the experiments, luminance, chromatic and CRT gamma-corrections calibrations were done using a Minolta™ colorimeter (Cambridge Research Systems (CRS), Rochester, UK) and a high accuracy, multi-element array spectroradiometer (RadOMA™ GS-1253; Gamma Scientific, San Diego, California) traceable to NIST standards.
Experiment 1: Short-Wavelength Automated Periphery (SWAP)
SWAP measurements were conducted using an AP200BY Automated Perimeter (Opto-Global, Adelaide, South Australia). Participants positioned themselves on a chin-rest and monocularly viewed (through their preferred dominant eye) a stimulus bowl that covered 100° of their visual field. The background of the bowl was illuminated with a bright (100 cd/m2) 530-nm “yellow” light, thus controlling for rods and M- and L-cone inputs. Participants dark-adapted for 5 mins and then focused on a 640-nm “red” fixation point while adapting to the “yellow” background for 3 mins. Following light adaptation, participants were given a joystick and asked to indicate when they perceived the Goldmann Size V 440-nm “blue” circular target (1.72º) that was presented along 162 points across the visual field. This provided a topographical map of the participant’s retinal sensitivity to the target. The apparatus tracked pupil position using an infrared camera to ensure proper foveal fixation and target image positioning at designated retinal positions. A Blue-on-Yellow Threshold Strategy (Opto AP200 Automated Perimeter Operators Manual, vers 3.01) was used to ascertain the average S-cone sensitivity directly as 1/threshold in decibels (±1dB) per visual field position (or point) and compared them across MA, MWO and Control groups. The dB thresholds were based on participant responses to varying illuminances of the “blue” target, which had a range of 5 log apostilb units, with every log change corresponding to 10 dB. Points not perceived by the participant were assigned a negative value (−1 dB) and subtracted from all other measured points. To ensure validity, we removed any false-positive errors (ie, participants pressing the button when no stimuli are present) and false-negative errors (ie, no response when retested on an area that has been previously tested positive) at or greater than 20%.
Positional sensitivity comparisons were made across nine sections: the central, paracentral superior temporal, peripheral superior temporal, paracentral inferior temporal, peripheral inferior temporal, paracentral inferior nasal, peripheral inferior nasal, paracentral superior nasal, and peripheral superior nasal retina. Points within the central region were located at 1º (3 points) 3º (6 points) and 6º (12 points) eccentricity. For the paracentral quadrants, points were located at 10º (5 points), 15º (5 points), and 22º (6 points) eccentricity. For the peripheral quadrant, points were located at 30º (6 points), 40º (6 points), and 50º (6 points) eccentricity. Figure 1A illustrates the location of all the sectors.
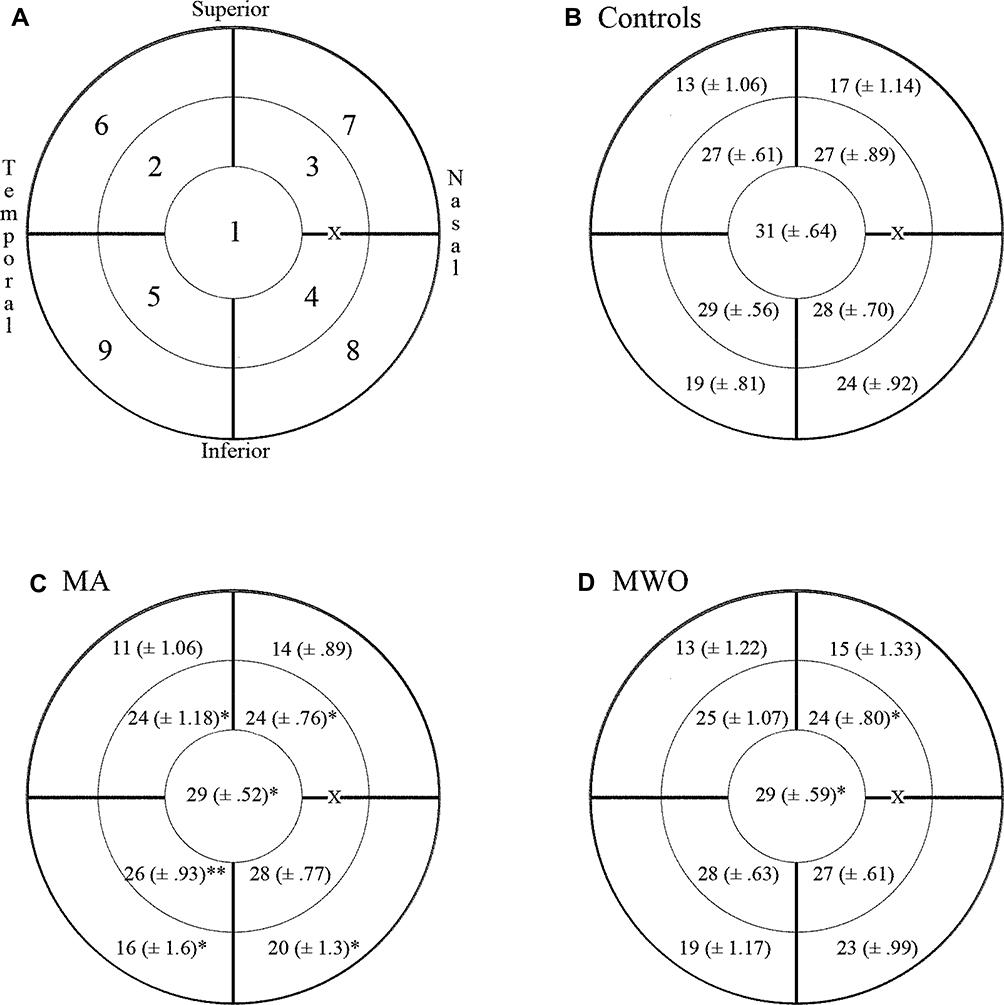 |
Figure 1 The absolute retinal sensitivity (in dB) within nine quadrants shown in (A) where 1 = Central; 2 = paracentral superior temporal; 3 = paracentral superior nasal; 4 = paracentral inferior nasal; 5 = paracentral inferior temporal; 6 = peripheral superior temporal; 7= peripheral superior nasal; 8 = peripheral inferior nasal; 9 = peripheral inferior temporal; X= Blindspot. (B) Illustrates the grand mean ± SEM for the control group. (C) Illustrates the grand mean and SEM for the migraine with aura group. (D) Illustrates the grand mean and SEM for the migraine without aura group. |
Experiment 2: Periodic Chromatic Contrast
To assess postretinal opponent sensitivities, vertical bichromatic, near isoluminant sinusoidal Gabors were presented that selectively isolated either S-(L+M) or L-M geniculate cone vectors.62 The varying “red-to-green” (R/G) or “blue-to-yellow” (B/Y) peak-to-trough modulations infer chromatic contrast functionalities of the PC and KC streams, respectively.63,64 The spatiotemporal stimuli were presented on a gamma-corrected Viewsonic G225 21-inch CRT monitor with a resolution of 1024x768 pixels at 150 Hz, driven by an NVIDIA GeForce 6600 LE graphics card on a Dell Dimension DXP051 computer with a 3.2 GHz processor. The heterochromatic sinusoids were presented at spatial frequencies of 0.5, 1.5, and 4 cycles/degree (cpd). Both 0 Hertz (Hz) steady-state presentations and 4 Hz temporal counterphase (180° peak-to-trough) modulations were used for each spatial frequency. All stimulus onset and offset presentations were convolved with a temporal gaussian envelope. For the R/G sinusoids, the peak “red” was 0.3828, 0.2846 and the trough “green” was 0.2639, 0.3772 in 1931 CIE x,y coordinates. For the B/Y sinusoids, the “blue” peak was 0.2739, 0.2263 and the “yellow” trough was 0.4280, 0.4976. The spatiochromatic contrast varied across individual linear vectors between the above CIE specified endpoints through a centered approximation of the D65 standard (0.3255, 0.3216, for the R/G modulations; 0.3132, 0.3158, for the B/Y modulations). The average luminance levels were 35.73 cd/m2 and 34.95 cd/m2 for the R/G and B/Y gratings, respectively. In terms of L-, M- and S-cone excitation, percent contrast relative to the background (C) for the endpoints in the R/G Gabor translated into CL = 7.42; CM = −14.68; CS = −0.52 for the “red” peak and CL = −6.58; CM = 13.01; CS= −19.01 for “green” trough. For the B/Y Gabor, the “blue” peak and “yellow” trough was CL = −0.01; CM = 0.02; CS= 87.99 and CL = 2.01; CM = −3.88; CS= −87.27, respectively.65
The periodic stimuli were presented binocularly with the participant positioned 75 cm from the display. Testing began after a seven-minute dark-adapt followed by 3 mins light-adapt to the D65 background. Participants were randomly assigned to complete either the R/G or B/Y presentations first. Relative chromatic contrast thresholds based on CIE distance modulation from the endpoints were assessed using a 2-AFC, two interleaved staircase procedure with maximum and minimum starting contrasts. Each grating was presented for 1 s within a 5°-dia windowed Gabor (σxy=0.8). Participants indicated with a response pad whether the Gabor appeared on the left or right side of an 18-cd/m2 “white” crosshair. Contrast varied using 0.1 logarithmic steps that required one correct response for an increase and three incorrect responses for a decrease in step size. Each staircase terminated after four practice trials and six experimental trial reversals. The geometric mean of the reversals defined chromatic contrast threshold. The inverse defined R/G and B/Y contrast sensitivities.
Experiment 3: Achromatic Luminance Contrast Sensitivity
Luminance-based contrast sensitivity measures were made using a high-resolution Nanao 9080i colour monitor driven by a 32-bit microprocessor (Texas Instruments Volante 34,020 GSP) specialized for graphics operations. The luminance range was expanded using a resistance gray-scale expander box into 32,768 monochrome levels. The spatial (0.5, 1.5 and 4.0 cpd) and temporal (0 and 4 Hz) frequencies and the spatiotemporal envelopes were the same as that used with the chromatic contrast experiment. Prior to testing, participants dark-adapted for 7 mins, followed by 3 mins of light adapt to a spatial averaged 13.6 cd/m2 “gray” background. Maximum luminance values for the gratings were 20.2 cd/m2 for the peak and 10.3 cd/m2 for the trough. The psychophysical procedure was the same as in Experiment 3. Again, we assumed the steadily presented high spatial frequencies preferentially activated the luminance-based (L+M) PC streams, and the lower spatial-frequency Gabors presented in counterphase temporal flicker optimally activated the MC stream.55
Experiment 4: Cambridge Colour Test
The Cambridge Trivector Colour Test [Cambridge Research Systems (CRS), Rochester, UK] measures color discrimination sensitivity along the three cardinal protan, deutan or tritan trivector axes,66 and has been used to assess KC and PC stream irregularities in other disorders such as Parkinson’s disease.67 Norms for this test have been shown to be reliable and valid.68 The test stimuli were presented on a 309-cm distanced, 22-inch Mitsubishi Diamond Pro 2070 monitor powered by a CRS ViSaGe stimulus generator with 14-bit resolution per color channel at a 200 Hz frame rate. Landolt C-shaped rings (7.6° o.d.; 3.81° i.d.) were presented within random luminance noise and composed of isoluminant chromatic dots that varied from the background along one of the three trivector axes based on CIE 1976 (u’ v’) color space coordinates (See Figure 5). Participants indicated the location of the 1° “C” gap at one of four (up, down, left, right) possible positions using a 4-button infrared response box. To identify the position of the gap, participants were forced to use one of the three cardinal chromatic differences. The trivector test measures color discrimination thresholds specific to the three-cone fundamentals associated with “red-green” (PC) and “blue-yellow” (KC) streams.66,69
Results
Experiment 1: Short-Wavelength Automated Perimetry (SWAP)
In order to analyze the differences in specific SWAP quadrants across groups, a mixed-design ANOVA with Group (MA, MWO, Control) as the between-subject factor and the nine SWAP quadrants as the within-subject factor was run on S-cone sensitivity (in dB) as the dependent variable. Based on Wilks’ criterion, a significant multivariate Group effect was found, F (18, 60) = 2.47, p = 0.005, partial η2 = 0.42. Planned between-Group contrasts within each quadrant were assessed through simple-effect analyses. Results indicated a significant difference between Control and MA in the following quadrants: central (p = 0.01), paracentral superior nasal (p = 0.02), paracentral superior temporal (p = 0.038), paracentral inferior temporal (p = 0.002), peripheral inferior nasal (p = 0.013), and peripheral inferior temporal (p = 0.041). Significant differences between Control and MWO were identified for only the central (p = 0.045) and paracentral superior nasal (p = 0.014) quadrants. Control, MA and MWO group quadrant means ± SEM are presented in Figure 1B–D, respectively.
An ANOVA also revealed a significant group effect, F (4, 68) = 4.55, p = 0.04, partial η2 = 0.135, on the overall average dB levels. Planned comparisons revealed significant differences between MA and Control (p = 0.03).
Experiment 2: Chromatic Spatial Contrast Sensitivity
The difference in contrast sensitivity as a function of Group and temporal modulation (steady 0 Hz, temporally modulated 4 Hz) were examined for the two chromatic contrast conditions (R/G, B/Y) in two separate ANOVAs. With respect to the R/G contrasts, no significant findings were obtained. R/G contrast sensitivity plots are shown in Figure 2. For clarity, all contrast sensitivity data are fitted with a double exponential function.70
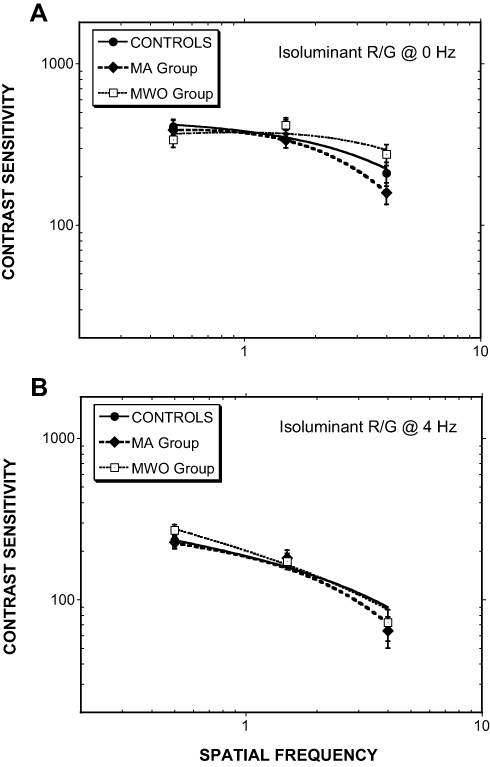 |
Figure 2 Isoluminant R/G contrast sensitivity as a function of spatial frequency for (A) steadily presented Gabors and (B) Gabors counterphase flickered at 4 Hz. (MA= Migraine with aura, MWO= Migraine without aura; Error bars = ±1.0 SEM). |
In terms of the B/Y contrasts, significant Group differences were found for the steady, 0-Hz presentations F (6, 74) = 3.731, p= 0.001, partial η2 = 0.247 (see Figure 3, upper panel a). Planned comparisons for this analysis identified significant differences between MA and Control for stimuli at 0.5 cpd (p = 0.022), 1.5 cpd (p = 0.008), and 5 cpd (p = 0.04). Interestingly, post hoc analyses revealed lowered MA sensitivities for the mid- to high-spatial frequencies, but improved sensitivity at the low 0.5 cpd frequency. For the MWO group, the only significant difference from Control was at 1.5 cpd (p = 0.003). For the temporally modulated (4 Hz) B/Y stimuli, no significant differences were observed across groups (see Figure 3, lower panel b).
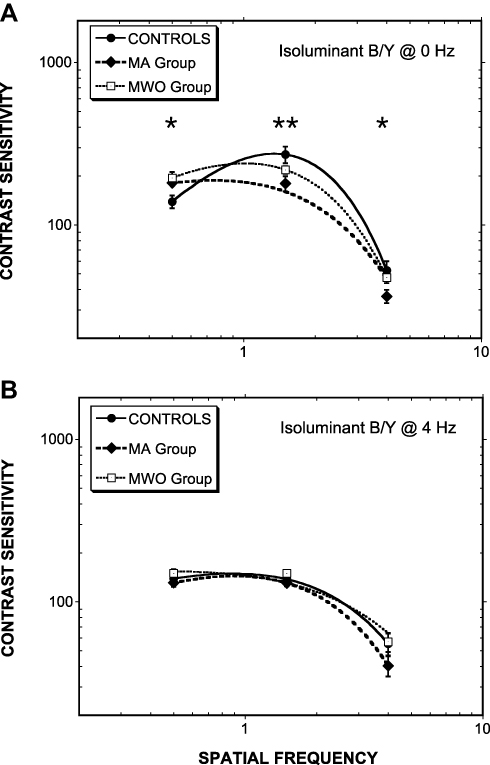 |
Figure 3 As Figure 2 except for B/Y isoluminant contrasts. For (A) steadily presented Gabors and (B) Gabors counterphase flickered at 4 Hz. In panel a, Controls cf. MA (*p<0.05; **p<0.01). Note: MA > Controls at 0.5 cpd; MA < Controls at 4 cpd. |
Experiment 3: Achromatic Contrast Sensitivity
Similar to the chromatic contrast sensitivity analysis, separate ANOVAs were used to investigate Group differences for stable (0 Hz) and temporally modulated (4 Hz) stimuli. A significant difference was found for the 0-Hz condition, F(6,74)= 3.40, p= 0.004, partial η2 = 0.221, with planned contrasts showing a significant difference between the MWO and Control groups at 0.5 cpd (p = 0.04) and 4 cpd (p = 0.009). Spatial and spatiotemporal contrast sensitivity plots are shown in Figure 4, panels a and b, respectively.
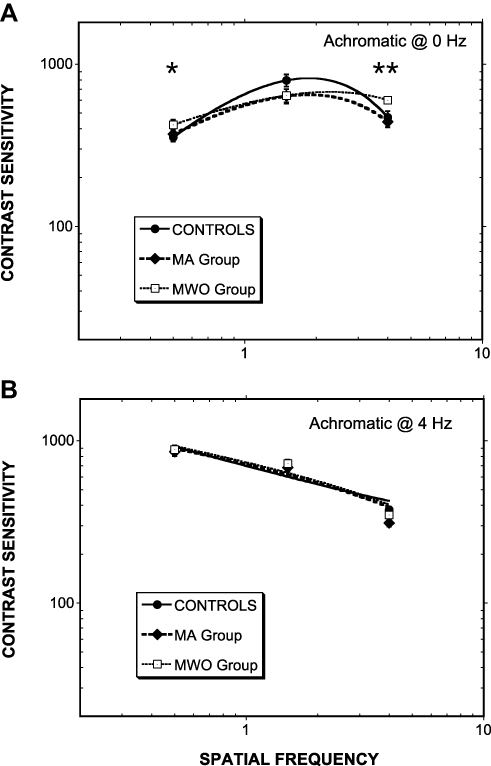 |
Figure 4 As Figure 2 except for achromatic contrasts. For (A) steadily presented Gabors and (B) Gabors counterphase flickered at 4 Hz. In panel a, Controls cf. MWO (*p<0.05; **p<0.01). Note: MWO > Controls at 0.5 cpd; MWO < Controls at 4 cpd. |
Experiment 4: Cambridge Colour Test
Color discrimination thresholds along the trivector axes did not show any significant differences across groups. However, a marginal effect was noted along the tritan confusion line for the MA group [t(23) = 1.846, p = 0.078]. We also created MacAdam discrimination ellipses based on eight vectors initiated within CIE u’ v’ colour space. Ellipse data were analyzed with Kruskal-Wallis H-tests which showed no significant group differences (p > 0.05); however, a strong negative correlation for the MA group was identified between the color discrimination along the tritan line and the SWAP measures, Spearman’s r(7) = −0.782, p < 0.01 suggesting that with lower retinal S-cone sensitivity comes greater perceived color discriminability along the tritan vector. The mean and standard error of the measure for each group are listed in Table 1 and depicted in Figure 5.
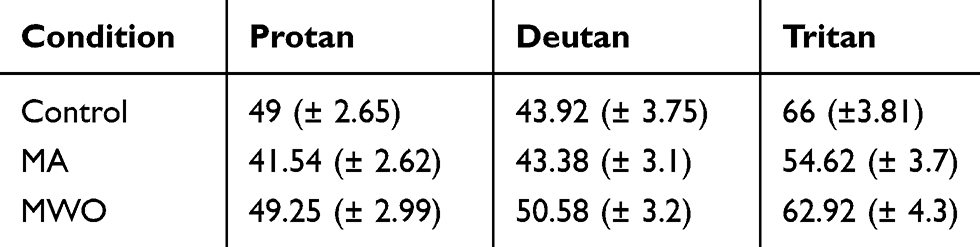 |
Table 1 Excursion Distances Along the Trivector Confusion Lines (Cambridge Colour Test™) |
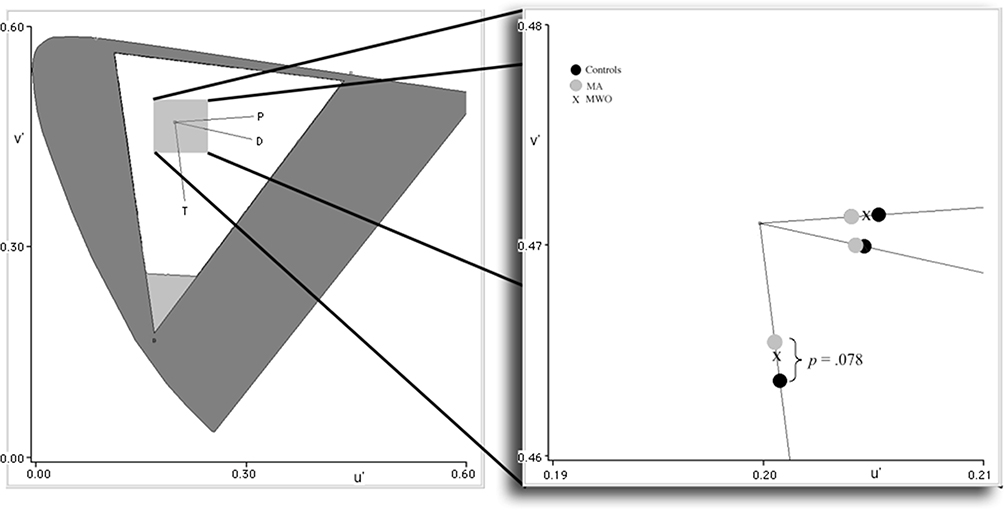 |
Figure 5 CIE 1976 (u’ v’) color space with trivector confusion lines. Lines converge at the neutral background origin (u’= 0.1977, v’=0.4689). Distances from the origin represent color discriminability along protan (P), deutan (D), and tritan (T) confusion lines. Threshold points are shown in the enlargement color space to the right. The further away from the origin, the greater the just noticeable difference between the color of the Landolt “C” and the background necessary to identify the orientation of the “C” gap (ie, lower discriminability). |
Discussion
Both perimetric and psychophysical measurements were used to assess the properties of the three visual streams in individuals with migraine. Results from our SWAP measurements in Experiment 1 identified significantly reduced sensitivity across much of the MA-group visual field suggesting reduced S-cone sensitivity throughout central and peripheral regions of the retina. Hypersensitivities were also observed with the MWO group, although this occurred in fewer quadrants. These results suggest that S-cone retinal deficits are most pronounced in MA and are consistent with earlier SWAP studies that reported S-cone deficits in periods between headache attacks.34,40–42 However, unlike these studies, we found far more obvious deficits, possibly because we used direct average values that were not influenced by a potentially compromised normalized population. Furthermore, specific analyses of the retinal quadrants provided additional information that suggests a more widespread MA deficiency than previously reported,33 including the central, paracentral and the inferior peripheral regions of the retina. This points away from SWAP topographies that are more characteristic of glaucomatous ocular fluid dynamics71,72 and supports an overall disruption of the S-cones throughout the retina mosaic. The nature of S-cone abnormalities has been linked to glaucoma-like damage due to ocular vascular dysregulation within the eye, which would initially affect the disease-vulnerable S-cone system.34,42,73 Cortical blood flow is certainly diminished during migraine attacks,74 and vascular dysregulation has been shown to extend to peripheral locations such as the fingers of migraine patients.75 Therefore, it is possible that ischemic, hypoxic, or vasospasmic damage may occur within the retina due to this dysregulation. However, Harle et al76 have challenged this proposition, by noting that most S-cone deficits are primarily neural in nature. Also, functional changes associated with postreceptoral S-cone contrast tend to be independent of non-neural factors.77
In Experiment 2, heterochromatic isoluminant Gabors were presented to selectively assess PC (R/G) and KC (B/Y) stream operations at the postreceptoral, chromatic opponency level. The contrast sensitivity measures showed no apparent differences with stimuli that preferentially activated the PC stream. No significant differences were found between groups for any of the spatial frequencies tested, whether temporally modulated at 4 Hz or not. On the other hand, the B/Y chromatic contrast stimuli that probed KC stream operations revealed that the MA group had significantly reduced sensitivity compared to Control with the steadily presented 1.5 and 4.0 cpd Gabor presentations, but enhanced sensitivity when presented with the lowest 0.5 cpd Gabor. This surprising turnaround may be a reflection of the low-pass properties identified with magno-type KC cells that are still driven by S-cones50 compared to the bandpass properties of PC cells putatively driven by an L-, M- and an S-cone luminance gain system.52 It is possible that with lowered S-cone retinal output in MA individuals comes a decrease in low-frequency B/Y sensitivity that is dominated by ventral KC operators, while with higher spatial frequencies comes a more pronounced L- and M-cone contribution due to the diminution of S-cone antagonism. In effect, this can produce a greater signal weight for the “yellow” and therefore augment PC-type luminance signals for cortical interpretation despite the near isoluminance of the Gabor.78
This possible balancing act between KC and PC functioning was further examined in Experiment 3, in which luminance-based Gabors that optimally activated PC or MC streams were presented; however, no significant static or temporal differences at any spatial frequency were identified with the MA group. Compared to the Control, only non-aura migraineurs showed significant increases in sensitivity with the 0.5-cpd steady Gabors and significant decreases in sensitivity with the 4.0-cpd steady Gabors (See Figure 4A). Why this frequency-dependent reversal in sensitivity, especially with luminance gratings, remains unclear unless the MWO condition somehow selectively dysregulates both PC and MC systems similar to what was described above with the KC subsystems in MA. However, any involvement with MC should have been revealed as sensitivity shifts with the 4-Hz achromatic presentations, which showed no such effect.
The specific lack of PC- and MC-contrast deficits, particularly with our R/G and achromatic conditions, differs from studies that have found equivalent deficits across PC and MC streams.21 This may be due to several factors. First, it is possible that studies that have identified MC deficits were actually derived from disrupted ventral KC and not MC cells,43 although all temporally modulated stimuli in our study including B/Y temporal modulation produced no significant group effects questioning the role of a selective ventral KC dysregulation. Second, the majority of studies that have identified MC migraine effects used temporally modulated perimetry that measures visual field flicker thresholds41 and this technique does not necessarily involve postreceptoral spatial or temporal contrast processing. Third, our sample of migraine sufferers had a lower mean age than those of most other studies, which means that our participants had also been suffering from headaches for a shorter period of time. As such, the deficits associated with the MC, and to a lesser extent the PC, stream could be a senescent or lifetime duration factor.
Results from the Cambridge Colour Test provided some interesting results, although the mean differences across groups failed to reach statistical significance. Discriminability along the tritan axis for MA versus Controls approached significance (p = 0.078); however, the direction of this difference was opposite of what we expected, with the MA group showing improved discrimination sensitivity as compared to Controls (ie, smaller chromatic threshold differences, or just noticeable differences, between the Landolt “C” and background; see Figure 5). This was further evinced by the significant negative correlation we found between the MA group Cambridge Test and SWAP data. The overall MA S-cone deficits found with SWAP should have instigated longer, not shorter, discriminability distances along the tritan confusion line. This apparent contradiction may be due to differences in a functional converging hierarchy where postreceptoral color differences are based not so much on specific cone output, but on opponent channels derived by the sums and differences of cone outputs. This means that stimulus chromaticities that are modulated along one of the three cardinal axes may be perimetrically and psychophysically separable but are still intercorrelated when it comes to higher-level color discrimination by means of a mutually inclusive weighted L- and M-cone gain operation52,79 that is compensating for the S-cone deficiencies, possibly at the level of the ganglion cell or LGN.80–82 Further evidence for this proposition stems from the fact that excursions from the neutral point along the protan and deutan lines were also shortest for the MA participants, albeit not statistically different from the other groups. Similarly unlike SWAP, the Cambridge Color Test relies on converging properties of a large amount of cones across various regions of the retina. Although SWAP sensitivity was reduced in MA, some peripheral quadrants of the retina still remained normal. Postreceptoral color discrimination is less based on cone numbers, and more on complex interconnected neural connections of large variegated cell types.83 The summation of subsensitive and normally sensitive early receptive fields could potentially lead to increased color discrimination capabilities in the MA group, again, based on neural convergence properties.
The nature and functional impact of S-cone deficits in migraineurs and the associated KC stream require further exploration. It is apparent that integrative network complexities need to be factored in when considering the dysregulating influences of migraine on the visual pathway and its resultant perceptions–illusory or otherwise.
Our SWAP results are in general agreement with previous studies that have identified a pre-striatal retinal locus of dysfunction in migraine S-cone functionality.29,40,42 However, whereas other studies have identified these deficits in specific hemifields, our analysis suggests that MA deficits exist across large areas of the retina, including both central and peripheral locations. MWO individuals tended to have slightly lower and less widespread subsensitivities, suggesting that although similar, there is a unique property of MA that may cause additional stress to the visual system.
Postreceptorally, our contrast measurements showed that MA individuals have a sensitivity deficit when presented with B/Y Gabors at KC peak and higher frequencies, but a surprising reduction at the lower 0.5-cpd KC frequency band (Figure 3A). This hints at a possible role for the magno-type ventral KC cells in the LGN, which are more involved with the motion aspects of vision and nonimage forming functions within the superior colliculus, including reflexive control of eye moments. However, such a ventral enhancement should have been apparent when MA participants viewed the temporally modulated B/Y Gabors. Instead, this condition produced very little group separation. Interestingly, the middle KC layers (between the PC layers of the LGN) are thought to be more involved with S-(L+M) or “y-b” opponency with direct projections to V1 blobs,43,50 and indeed the diminished output of S-cones in MA individuals appears to have influenced the mid-to-high frequency sensitivity range in our steady, B/Y contrast condition. MWO participants also showed a strange sensitivity enhancement at low achromatic spatial frequencies but diminishment at high frequencies. However, as already noted with the MA group, this predictor of MC involvement did not reveal itself when the MWO participants were presented with any of the 4-Hz spatiotemporal stimulus conditions.
With the higher-ordered trivector color task, it became clear that the S-cone subsensitivities identified in SWAP did not extend to color discrimination performance, which instead revealed a heightened discriminability along the tritan confusion line for the MA group. We propose that this may be due to a higher-level pathway compensation possibly involving PC inputs.
Researchers have suggested that the broad cortical dysfunction, cortical spreading depression, is one of the key pathophysiological differences between MA and MWO. It, therefore, remains reasonable to assume that this may be why some of our experimental tasks tended to differentiate MA from MWO performances. Having said this, however, our results also show, from a hierarchical neural perspective, that retinal S-cone deficiencies precede postretinal abnormalities with the latter seeming to compensate for the former dysregulation.
Our findings have to be viewed with some caveats in mind. The participants were young adults with lifetime duration of migraine headaches of about 10 years. Whether the same results would be obtained with an older sample with a longer history of migraine remains to be seen. Also, although we found no gender differences, there were more females participating in this study. Future work needs to ascertain if similar findings hold across sexes.
In summary, the integration of perimetric and higher-end psychophysical measures represents an improved method for identifying the locus of migraine-related visual deficits and the potential processing links of these levels of operation. Future studies should seek to continue to combine these methods, as well as integrate physiological or brain imaging techniques to further our understanding of migraine and its associated spatiotemporal neural events. Finally, there is a definite need for longitudinal neuro- and psychometric analysis across pre(post)-ictal, ictal and interictal periods of migraine to further assess the progression of cortical spreading depression with putative hierarchical visual disruptions or deficits. Such studies would help identify whether deficits exist prior to the onset of migraine headaches, or whether they are the result of migraines themselves with a dependency on the duration and/or frequency of the disorder.
Ethics or Institutional Review Board Approval
This study adhered to the principles of the Canadian Institute of Health Research (CIHR), the Natural Sciences and Engineering Research Council of Canada (NSERC) and the Social Sciences and Humanities Research Council of Canada (SSHRC) Tri-Council Policy Statement (TCPS2) regarding ethical conduct for research involving humans. Procedures were reviewed and approved by the Lakehead University Research Ethics Board (REB Project # 035 07-08). All participants were fully informed regarding the nature and procedures of the study and provided written consent. This research was conducted in accordance with the Declaration of Helsinki.
Acknowledgements
We would like to thank Nicola Stevens, Robbie Servais, and Lisa Miller for their research assistance in data collection.
Disclosure
Dr Michael F. Wesner report grants from Canada Foundation for Innovation, during the conduct of the study. The authors report no other conflicts of interest in this work.
References
1. Bhaskar S, Saeidi K, Borhani P, et al. Recent progress in migraine pathophysiology: role of cortical spreading depression and magnetic resonance imaging. Eur J Neurosci. 2013;38(11):3540–3551. doi:10.1111/ejn.2013.38.issue-11
2. Dodick DW, Gargus JJ. Why migraines strike. Sci Am. 2008;299(2):56–63. doi:10.1038/scientificamerican0808-56
3. Egilius LH, Spierings MD. Pathogenesis of the migraine attack. Clin J Pain. 2003;19(4):255–262. doi:10.1097/00002508-200307000-00009
4. Moskowitz MA. Basic mechanisms in vascular headache. Neurol Clin. 1990;8(4):801–815. doi:10.1016/S0733-8619(18)30318-9
5. Sandrini G, Cecchini AP, Hristova SI, et al. Neurophysiology of migraine. J Headache Pain. 2001;2:S67–S71. doi:10.1007/s101940170013
6. Battelli L, Black KR, Wray SH. Transcranial magnetic stimulation of visual area V5 in migraine. Neurology. 2002;58(7):1066–1069. doi:10.1212/WNL.58.7.1066
7. Schwartz DP, Robbins MS. Primary headache disorders and neuro-ophthalmologic manifestations. Eye Brain. 2012;4:49–61. doi:10.2147/EB.S21841
8. Klüver H. Mescal and Mechanisms of Hallucinations. Chicago, IL: University of Chicago Press; 1966.
9. Richards W. The fortification illusions of migraines. Sci Am. 1971;224(5):88–96. doi:10.1038/scientificamerican0571-88
10. Billock VA, Tsou BH. Elementary visual hallucinations and their relationships to neural pattern-forming mechanisms. Psychol Bull. 2012;138(4):744–774. doi:10.1037/a0027580
11. Chronicle EP, Pearson AJ, Mulleners WM. Objective assessment of cortical excitability in migraine with and without aura. Cephalalgia. 2006;26:801–808. doi:10.1111/j.1468-2982.2006.01144.x
12. de Marinis M, Rinalduzzi S, Accornero N. Impairment in color perception in migraine with and without aura. Headache. 2007;47(6):895–904. doi:10.1111/hed.2007.47.issue-6
13. Ditchfield J, McKendrick A, Badcock DR. Processing of global form and motion in migraineurs. Vis Res. 2006;46:141–148. doi:10.1016/j.visres.2005.09.014
14. Mickleborough MJ, Truong G, Handy TC. Top-down control of visual cortex in migraine populations. Neuropsychologia. 2011;49(5):1006–1015. doi:10.1016/j.neuropsychologia.2011.01.033
15. Shepherd AJ. Colour vision in migraine: selective deficits for S-cone discriminations. Cephalalgia. 2005;25:412–423. doi:10.1111/j.1468-2982.2004.00831.x
16. Shepherd AJ. Local and global motion after-effects are both enhanced in migraine, and the underlying mechanisms differ across cortical areas. Brain. 2006b;129(7):1833–1843. doi:10.1093/brain/awl124
17. Wray SH, Mijovic-Prelec D, Kosslyn SM. Visual processing in migraineurs. Brain. 1995;118(Pt 1):25–35. doi:10.1093/brain/118.1.25
18. Gerwig M, Niehaus L, Kastrup O, et al. Visual cortex excitability in migraine evaluated by single and paired magnetic stimuli. Headache. 2005;45(10):1394–1399. doi:10.1111/j.1526-4610.2005.00272.x
19. Huang J, DeLano M, Cao Y. Visual cortical inhibitory function in migraine is not generally impaired: evidence from a combined psychophysical test with an fMRI study. Cephalalgia. 2006;26:554–560. doi:10.1111/j.1468-2982.2006.01067.x
20. McColl SL, Wilkinson F. Visual contrast gain control in migraine: measures of visual cortical excitability and inhibition. Cephalalgia. 2000;20:74–84. doi:10.1046/j.1468-2982.2000.00033.x
21. McKendrick AM, Badcock DR. Contrast-processing dysfunction in both magnocellular and parvocellular pathways in migraineurs with or without aura. Invest Ophthalmol Vis Sci. 2003;44(1):442–448. doi:10.1167/iovs.02-0630
22. McKendrick AM, Sampson GP. Low spatial frequency contrast sensitivity in migraine are not visual pathway selective. Cephalalgia. 2009;29:539–549. doi:10.1111/j.1468-2982.2008.01817.x
23. Palmer JE, Chronicle EP, Rolan P, et al. Cortical hyperexcitability is cortical under-inhibition: evidence from a novel functional test of migraine patients. Cephalalgia. 2000;20:525–532. doi:10.1046/j.1468-2982.2000.00075.x
24. Shibata K, Yamane K, Otuka K, et al. Abnormal visual processing in migraine with aura: a study of steady-state visual evoked potentials. J Neurol Sci. 2008;271:119–126. doi:10.1016/j.jns.2008.04.004
25. Wilkinson F, Crotogino J. Orientation discrimination thresholds in migraine: a measure of visual cortical inhibition. Cephalalgia. 2000;20:57–66. doi:10.1046/j.1468-2982.2000.00017.x
26. Coleston DM, Chronicle E, Ruddock KH, et al. Precortical dysfunction of spatial and temporal visual processing in migraine. J Neurol Neurosurg Psychiatry. 1994;57(10):1208–1211. doi:10.1136/jnnp.57.10.1208
27. McKendrick AM, Vingrys AJ, Badcock DR, et al. Visual field losses in subjects with migraine headaches. Invest Ophthalmol Vis Sci. 2000;41(5):1239–1247.
28. Oelkers R, Grosser K, Lang E, et al. Visual evoked potentials in migraine patients: alterations depend on pattern spatial frequency. Brain. 1999;122(6):1147–1155. doi:10.1093/brain/122.6.1147
29. Tibber MS, Shepherd AJ. Transient tritanopia in migraine: evidence for a large-field retinal abnormality in blue-yellow opponent pathways. Invest Ophthalmol Vis Sci. 2006;47(11):5125–5131. doi:10.1167/iovs.06-0393
30. Wieser T, Wolff R, Hoffmann KP, et al. Persistent ocular motor disturbances in migraine without aura. Neurol Sci. 2004;25(1):8–12. doi:10.1007/s10072-004-0218-6
31. Noseda R, Bernstein CA, Nir RR, et al. Migraine photophobia originating in cone-driven retinal pathways. Brain. 2016;139(7):1971–1986. doi:10.1093/brain/aww119
32. Aleci C, Liboni W. Perceptive aspects of visual aura. Neurol Sci. 2009;30:447–452. doi:10.1007/s10072-009-0137-4
33. McKendrick AM, Cioffi GA, Johnson CA. Short-wavelength sensitivity deficits in patients with migraine. Arch Ophthalmol. 2002;120(2):154–161. doi:10.1001/archopht.120.2.154
34. Yenice Ö, Temel A, Incili B, Tuncer N. Short-wavelength automated perimetry in patients with migraine. Graefes Arch Clin Exp Ophthalmol. 2006;244(5):589–595. doi:10.1007/s00417-005-0083-7
35. Wang JJ, Mitchell P, Smith W. Is there an association between migraine headache and open-angle glaucoma? Findings from the blue mountains eye study. Ophthalmology. 1997;104(10):1714–1719. doi:10.1016/S0161-6420(97)30075-X
36. Derrington AM, Krauskopf J, Lennie P. Chromatic mechanisms in lateral geniculate nucleus of macaque. J Physiol. 1984;357:241–265. doi:10.1113/jphysiol.1984.sp015499
37. Kelly DH. Retinal inhomogeneity. I. Spatiotemporal contrast sensitivity. J Opt Soc Am A. 1984;1(1):107–113. doi:10.1364/JOSAA.1.000107
38. McKeefry DJ, Murray IJ, Kulikowski JJ. Red-green and blue-yellow mechanisms are matched in sensitivity for temporal and spatial modulation. Vis Res. 2001;41:245–255. doi:10.1016/S0042-6989(00)00247-9
39. Pokorny J, Smith VC. Psychophysical signatures associated with magnocellular and parvocellular pathway contrast gain. J Opt Soc Am A. 1997;14(9):2477–2486. doi:10.1364/JOSAA.14.002477
40. McKendrick AM, Badcock DR. Decreased visual field sensitivity measured 1 day, then 1 week, after migraine. Invest Ophthalmol Vis Sci. 2004a;45(4):1061–1070. doi:10.1167/iovs.03-0936
41. McKendrick AM, Badcock DR. An analysis of the factors associated with visual field deficits measured with flickering stimuli in-between migraine. Cephalalgia. 2004b;24:389–397. doi:10.1111/j.1468-2982.2004.00682.x
42. Ö Y, Onal S, Incili B, et al. Assessment of spatial-contrast function and short-wavelength sensitivity deficits in patients with migraine. Eye. 2007;21:218–223. doi:10.1038/sj.eye.6702251
43. Calkins DJ. Seeing with S cones. Prog Retin Eye Res. 2001;20(3):255–287. doi:10.1016/S1350-9462(00)00026-4
44. Dacey DM. Primate Retina: cell types, circuits and color opponency. Prog Retin Eye Res. 1999;18(6):737–763. doi:10.1016/S1350-9462(98)00013-5
45. Dacey DM, Lee BB. The ‘blue-on’ opponent pathway in primate retina originates from a distinct bistratified ganglion cell type. Nature. 1994;367:731–735. doi:10.1038/367731a0
46. Martin PR, White AJ, Goodchild AK, et al. Evidence that blue-on cells are part of the third geniculocortical pathway in primates. Eur J Neurosci. 1997;9(7):1536–1541. doi:10.1111/j.1460-9568.1997.tb01509.x
47. Mullen KT, Sankeralli MJ. Evidence for the stochastic independence of the blue-yellow, red-green and luminance detection mechanisms revealed by subthreshold summation. Vis Res. 1999;39:733–745. doi:10.1016/S0042-6989(98)00137-0
48. Sample PA. Short-wavelength automated perimetry: it’s role in the clinic and for understanding ganglion cell function. Prog Retin Eye Res. 2000;19(4):369–383. doi:10.1016/S1350-9462(00)00001-X
49. Polo V, Abecia E, Pablo LE, et al. Short-wavelength automated perimetry and retinal nerve fiber layer evaluation in suspected cases of glaucoma. Arch Ophthalmol. 1998;116(10):1295–1298. doi:10.1001/archopht.116.10.1295
50. Hendry SHC, Reid RC. The koniocellular pathway in primate vision. Annu Rev Neurosci. 2000;23:127–153. doi:10.1146/annurev.neuro.23.1.127
51. Leonova A, Pokorny J, Smith VC. Spatial frequency processing in inferred PC- and MC-pathways. Vis Res. 2003;43:2133–2139. doi:10.1016/S0042-6989(03)00333-X
52. Stockman A, Langendörfer M, Sharpe LT. Human short-wavelength-sensitive cone light adaptation. J Vis. 2007;7(3):1–17. doi:10.1167/7.3.4
53. Skottun BC, Skoyles JR. Contrast sensitivity and magnocellular functioning in schizophrenia. Vis Res. 2007;47:2923–2933. doi:10.1016/j.visres.2007.07.016
54. Skottun BC. A few words on differentiating magno- and parvocellular contributions to vision on the basis of temporal frequency. Neurosci Biobehav R. 2016;71:756–760. doi:10.1016/j.neubiorev.2016.10.016
55. Lalor EC, Foxe JJ. Reply to Skottun & Skoyles. On interpreting responses to low contrast stimuli in terms of magnocellular activity – A few remarks. Vis Res. 2010;(2010(50):991–994. doi:10.1016/j.visres.2009.12.001
56. Mulleners WM, Chronicle EP, Palmer JE, et al. Suppression of perception in migraine: evidence for reduced inhibition in the visual cortex. Neurology. 2001;56(2):178–183. doi:10.1212/WNL.56.2.178
57. Coppola G, Francesco P, Schoenen J. Habituation and migraine. Neurobiol Learn Mem. 2009;92(2):249–259. doi:10.1016/j.nlm.2008.07.006
58. Purdy RA. Migraine with and without aura share the same pathogenic mechanisms. Neurol Sci. 2008;29(Suppl 1):S44–S46. doi:10.1007/s10072-008-0885-6
59. International Headache Society (IHS). The international classification of headache disorders, 3rd Edition. Cephalalgia. 2013;33:629–808. doi:10.1177/0333102413485658
60. Njemanze PC. Gender-related differences in physiologic color space: a functional transcranial Doppler (fTCD) study. Exp Transl Stroke Med. 2011;3(1):1–8. doi:10.1186/2040-7378-3-1
61. Oinonen KA, Mazmanian D. Facial symmetry detection ability changes across the menstrual cycle. Biol Psychol. 2007;75(2):136–145. doi:10.1016/j.biopsycho.2007.01.003
62. De Valois RL, De Valois KK, Switkes E, et al. Hue scaling of isoluminant and cone-specific lights. Vis Res. 1997;37:885–897. doi:10.1016/S0042-6989(96)00234-9
63. Hardy JL, Delahunt PB, Okajima K, et al. Senescence of spatial chromatic contrast sensitivity. I. Detection under conditions controlling for optical factors. J Opt Soc Am A. 2005;22(1):49–59. doi:10.1364/JOSAA.22.000049
64. Delahunt PB, Hardy JL, Okajima K, et al. Senescence of spatial chromatic contrast sensitivity. II. Matching under natural viewing conditions. J Opt Soc Am A. 2005;22(1):60–67. doi:10.1364/JOSAA.22.000060
65. Cole GR, Hine T. Computation of cone contrasts for color vision research. Behav Res Meth Ins C. 1992;24(1):22–27. doi:10.3758/BF03203465
66. Mollon JD, Regan BC. Cambridge Colour Test Handbook (Vers. 1.1). Cambridge Research Systems, Ltd; 2000.
67. Silva MF, Faria P, Regateiro FS, et al. Independent patterns of damage within magno, parvo- and koniocellular pathways in Parkinson’s disease. Brain. 2005;128(10):2260–2271. doi:10.1093/brain/awh581
68. Ventura DF, Silveira LCL, Rodrigues AR, et al. Preliminary norms for the Cambridge colour test. In: Mollon JD, Pokorny JK, Knoblauch K, editors. Normal and Defective Colour Vision. Oxford, UK: Oxford University Press; 2003:331–339.
69. Regan BC, Reffin JP, Mollon JD. Luminance noise and the rapid determination of discrimination ellipses in colour deficiency. Vis Res. 1994;34:1279–1299. doi:10.1016/0042-6989(94)90203-8
70. Movshon JA, Kiorpes L. Analysis of the development of spatial contrast sensitivity in monkey and human infants. J Opt Soc Am A. 1988;5(12):2166–2172.
71. Landers J, Sharma A, Goldberg I, Graham S. Topography of the frequency doubling perimetry visual field compared with that of short wavelength and achromatic automated perimetry visual fields. Br J Ophthalmol. 2006;90:70–74. doi:10.1136/bjo.2005.071266
72. Larena C, Milla E, Bitrian E. Prognosis value of the topography of the glaucoma perimetry defect. Invest Ophthalmol Vis Sci. 2008;49(13):1105. doi:10.1167/iovs.07-0624
73. McKendrick AM, Sampson GP, Walland MJ, Badcock DR. Contrast sensitivity changes due to glaucoma and normal aging: low spatial frequency losses in both magnocellular and parvocellular pathways. Invest Ophthalmol Vis Sci. 2007;48(5):2115–2122. doi:10.1167/iovs.06-1208
74. Olesen J, Friberg L, Olsen TS, et al. Timing and topography of cerebral blood flow, aura, and headache during migraine attacks. Ann Neurol. 1990;28(6):791–798. doi:10.1002/(ISSN)1531-8249
75. Hegyalijai T, Meienberg O, Dubler B, et al. Cold-induced acral vasospasm in migraine as assessed by nailfold video-microscopy: prevalence and response to migraine prophylaxis. Angiology. 1997;48:445–449. doi:10.1177/000331979704800407
76. Harle DE, Shepherd AJ, Evans BJ. Visual stimuli are common triggers of migraine and are associated with pattern glare. Headache. 2006;46(9):1431–1440. doi:10.1111/j.1526-4610.2006.00585.x
77. Swanson WH. S-cone spatial contrast sensitivity can be independent of pre-receptoral factors. Vis Res. 1996;36:3549–3555. doi:10.1016/0042-6989(96)00047-8
78. Ripamonti C, Woo WL, Crowther E, et al. The S-cone contribution to luminance depends on the M- and L-cone adaptation levels: silent surrounds? J Vis. 2009;9(3):1–16. doi:10.1167/9.3.10
79. Gunther KL, Dobkins KR. Independence of mechanisms tuned along cardinal and non-cardinal axes of color space: evidence from factor analysis. Vis Res. 2003;43:683–696. doi:10.1016/S0042-6989(02)00689-2
80. De Valois RL, Cottaris NP, Elfar SD, et al. Some transformations of color information from lateral geniculate nucleus to striate cortex. Proc Natl Acad Sci USA. 2000;97(9):4997–5002. doi:10.1073/pnas.97.9.4997
81. Lee BB, Valberg A, Tigwell DA, Tryti J. An account of responses of spectrally opponent neurones in the macaque lateral geniculate nucleus to successive contrast. Proc R Soc Lond B Biol Sci. 1987;230(1260):293–314.
82. Lennie P, Movshon JA. Coding of color and form in the geniculostriate visual pathway. J Opt Soc Am A. 2005;22(10):2013–2033. doi:10.1364/JOSAA.22.002013
83. Conway BR, Chatterjee S, Field GD, et al. Advances in color science: from retina to behavior. J Neurosci. 2010;30(45):14955–14963. doi:10.1523/JNEUROSCI.4348-10.2010
 © 2019 The Author(s). This work is published and licensed by Dove Medical Press Limited. The full terms of this license are available at https://www.dovepress.com/terms.php and incorporate the Creative Commons Attribution - Non Commercial (unported, v3.0) License.
By accessing the work you hereby accept the Terms. Non-commercial uses of the work are permitted without any further permission from Dove Medical Press Limited, provided the work is properly attributed. For permission for commercial use of this work, please see paragraphs 4.2 and 5 of our Terms.
© 2019 The Author(s). This work is published and licensed by Dove Medical Press Limited. The full terms of this license are available at https://www.dovepress.com/terms.php and incorporate the Creative Commons Attribution - Non Commercial (unported, v3.0) License.
By accessing the work you hereby accept the Terms. Non-commercial uses of the work are permitted without any further permission from Dove Medical Press Limited, provided the work is properly attributed. For permission for commercial use of this work, please see paragraphs 4.2 and 5 of our Terms.