")
Back to Journals » Diabetes, Metabolic Syndrome and Obesity » Volume 14
The Psychometric Properties of General Adherence Scale in Chinese (GAS-C) in Patients with Type 2 Diabetes Using Insulin
Authors Shi Z, Chang J, Ma X, Yin F, Ma M, Li W, Zhu B, Ai Z, Zhao X
Received 13 October 2020
Accepted for publication 8 February 2021
Published 22 February 2021 Volume 2021:14 Pages 801—811
DOI https://doi.org/10.2147/DMSO.S286153
Checked for plagiarism Yes
Review by Single anonymous peer review
Peer reviewer comments 2
Editor who approved publication: Prof. Dr. Juei-Tang Cheng
Zhidao Shi,1,* Jingzhi Chang,2,* Xiquan Ma,3 Feiyan Yin,1 Min Ma,4 Wentian Li,4 Binggen Zhu,1 ZiSheng Ai,1,5 Xudong Zhao1
1Shanghai Pudong New Area Mental Health Center, Tongji University School of Medicine, Shanghai, People’s Republic of China; 2Department of Preventive Medicine, School of Public Health, Jiamusi University, Jiamusi, Heilongjiang Province, People’s Republic of China; 3Department of Psychosomatic Medicine, Shanghai East Hospital, Tongji University School of Medicine, Shanghai, People’s Republic of China; 4Clinical Psychology Department, Wuhan Mental Health Center, Tongji Medical College of Huazhong University of Science & Technology, Wuhan, Hubei Province, People’s Republic of China; 5Department of Medical Statistics, Tongji University School of Medicine, Shanghai, People’s Republic of China
*These authors contributed equally to this work
Correspondence: Zhidao Shi; Xudong Zhao
Shanghai Pudong New Area Mental Health Center, Tongji University School of Medicine, 165 San-Lin Road, Shanghai, 200124, People’s Republic of China
; Email [email protected]; [email protected]
Purpose: Translate General Adherence Scale (GAS) into Chinese and test its psychometric properties in middle-aged and elderly type 2 diabetes (T2D) patients using insulin in the Han people of urban China.
Subjects and Methods: We translated the GAS into Chinese and established General Adherence Scale in Chinese (GAS-C). 136 T2D subjects were selected for testing GAS-C’s reliability and validity, of which 100 study subjects were retested with GAS-C two weeks later. The other 200 T2D subjects were selected for performing Confirmatory Factor Analysis(CFA). The ceiling effect and floor effect of GAS-C data were checked.
Results: No data was lost in our research. In exploratory factor analysis(EFA), the Kaiser-Meyer-Olkin measure of sampling adequacy (KMO) =0.899, Bartlett’s Test’s χ2=611.821 (df=10 p< 0.001). The communalities of the items were between 0.740 and 0.862; The values of Measure of Sampling Adequacy (MSA) were between 0.883 and 0.945. All five items entered the factor analysis process. A common factor was extracted, and it could explain 81.403% of the total variance. CFA validated the.one-factor model was good fits with the data of GAS-C (Ratio of Chi-square to Degrees of Freedom (CMIN/DF)=2.032, Goodness of Fit Index (GFI) =0.981, Comparative Fit Index (CFI) =0.996, Tucker–Lewis Index (TLI) =0.992, Root Mean Square Residual (RMR) =0.011, Root Mean Square Error of Approximation (RMSEA) =0.072). Correlation analysis was performed between GAS-C and MMAS-8 to calculate the criterion-related validity (r=0.542 p< 0.001). The internal consistency reliability α=0.942, Intraclass Correlation Coefficient (ICC)= 0.941 (95% CI 0.924– 0.955). The correlation coefficient r of the test-retest reliability was 0.772 (p< 0.001). Spearman-Brown coefficient of split-half was 0.939. There was no floor effect and ceiling effect on the data.
Conclusion: GAS-C has good reliability and validity. It can be used for general adherence studies of middle-aged and elderly type 2 diabetic patients using insulin in the Han people of Chinese cities.
Keywords: general adherence, type 2 diabetes, reliability, validity, revised scale, scale
Introduction
China has one of the highest rates of diabetes in the world. Research data in 2013 showed that the prevalence rate of diabetes in China was about 11.6%, and the prevalence rate of Pre-diabetes’ prevalence rate was approximately 50.1%, which meant that about 113.9 million Chinese were suffering from diabetes and about 493.4 million Chinese were pre-diabetic.1,2 China is under tremendous pressure in the prevention and treatment of diabetes.
Studies have found that non-adherence in T2D patients is more common.3 Unless severe life-threatening complications occur, T2D patients’ adherence is more likely to be lower than other chronic diseases.4 A 2003 World Health Organization report showed that in developed countries, the treatment adherence of patients with T2D is only about 50%,5 In a longitudinal, large sample study, only 39.6% of patients with T2D were still following their doctor’s advice to take medicine after 24 months.6 Adherence was 62% in patients who used insulin for a long time.7
Patients with T2D have poor adherence and are prone to various acute and chronic complications, increasing hospitalization and death risk and imposing a huge economic burden on families and society.8,9 A 2011 study conducted in Hangzhou, China, found that the average annual hospitalization cost for patients with T2D complications was $2000–3466.10 A 2018 survey conducted in multiple locations in China found that the median average cost per hospitalization for people with T2D with or without health insurance was $1552 and $1490, respectively.11 A 2019 study of non-hospitalized T2D patients in the Chinese community found that the average direct medical burden for these patients was $682 a year, compared to $922 for those over the age of 70.12
Poor adherence to glucose management programs is the main reason for long-term unsatisfactory glycemic control in diabetic patients.13 For patients with T2D, it is essential to improve their adherence. Therefore, we need to conduct active research on adherence of patients with T2D and propose effective interventions based on the research results. T2D, patients need to follow their healthcare professionals’ advice in several areas, including healthy lifestyle, regular monitoring, taking or injecting medications, physical therapy, and preventing various acute and chronic complications.14,15 Therefore, we can assess the patient’s adherence as a whole.
To date, Chinese researchers have conducted more studies on medication adherence in T2D patients. However, there is a lack of scientifically validated research tools to assess T2D patients’ general adherence in China. The General Adherence Scale (GAS) is a useful standardized measurement tool for studying general adherence in patients with chronic diseases, which was developed by DiMatteo and Hays. In the famous medical outcome study (MOS) undertaken by Rand Corporation of America, GAS was used to assess chronic patients’ general adherence to heart disease, hypertension, and diabetes.16 Many studies have proven that the scale is simple, easy to use, and has a good measuring effect, which can be applied to the study of adherence of patients such as T2D.17–19 Therefore, we decided to revise the General Adherence Scale in Chinese (GAS-C) and select middle-aged and elderly Chinese patients with T2D as the research objects to evaluate the GAS-C’s reliability and validity.
Materials and Methods
The study consists of two parts:
study A: translating GAS into Chinese and testing its reliability and validity to form a Chinese version of GAS-C;
study B: performing a confirmatory factor analysis (CFA) of GAS-C.
This study was conducted in accordance with the Declaration of Helsinki. Before the research was carried out, we reported the research plan to the Ethics Committee of the Shanghai Pudong New Area Mental Health Center. After the committee’s review and approval (the approval number: 2,017,009), the study began. This study was conducted from May 2018 to september 2020 in the diabetes wards of several general hospitals in Haicheng City, Liaoning Province, China. Data collection began after the hospitalized T2D patient’s vital signs stabilized.
Participants
The inclusion criteria of the study subjects were:
- patients with T2D who meet the WHO diagnostic criteria for diabetes,
- use insulin to treat T2D for at least 4 weeks,
- aged 45 to 74 years,
- Han people who had been living in the survey site for at least five consecutive years at the time of the survey,
- voluntary participation.
Subjects were excluded from this study if they met the following exclusion criteria:
- those who were seriously ill and unable to complete the study. Including the current acute complications of diabetes, life-threatening medical conditions in the acute phase of other diseases other than diabetes, such as severe stroke, myocardial infarction or active malignancy, and terminal illness with a life expectancy less than 2 years (per health care provider or patient report).
- those who had a disturbance of consciousness (Glasgow coma score lower than 15) and cognitive impairment (According to the Chinese “Mini-mental state examination” scoring standard: illiteracy, more than 14 points: primary school educational level, more than 19 points; middle school educational level and above: more than 24 points.).
- those who were drug dependent or suffered from various severe mental illnesses (Including schizophrenia, schizotypal and delusional disorders; severe depressive episode; schizoaffective disorders; other mental disorders due to brain damage and dysfunction and to physical disease)
Finally, 136 subjects with T2D were included in the study A. Based on the N:q rule of 10–20 subjects per parameter, the 136 subjects for the five-item GAS questionnaire were sufficiency.20,21 Study B contained 200 subjects, which meets CFA’s requirements for sample size.22
Instruments
General Information Questionnaire
It consisted of some items about socio-demographic information of the subjects’ current treatment status and glycosylated hemoglobin level.
GAS
GAS was developed by DiMatteo and Hays, consists of five items, which is used to assess the overall tendency of patients with chronic diseases to comply with doctor’s recommendations in the last four weeks.23,24 The response format of GAS is a six-point Likert scale, ranging from “None of the time” (1) to “All of the time” (6). Items 1 and 3 of the GAS were reverse coded. The total score of the scale is from 6 to 30. The GAS scale has one dimension, and its internal consistency reliability is acceptable (α=0.78). The correlation coefficient r of the test-retest reliability two years later is 0.41.25 In this study, it will be revised in Chinese.
MMAS-8
MMAS-8 was developed by Morisky and is mainly used to investigate medication adherence of patients with chronic diseases. The scale contains eight items, and the total score is the sum of the scores of each item.26 The MMAS-8 is a reliable and valid tool used to test whether patients comply with doctor’s orders to take their medications.27,28 In this study, MMAS-8 was used under license to assess the criterion-related validity of the GAS-C.
Translation and Adaptation of the Scale
We contact the developer of GAS at first. After obtaining the developer’s permission, we started to revise the Chinese version of GAS.23,25 We integrated the cross-culture revision method recommended by experts to revise GAS in Chinese.29,30 We divide the process of translation and adaptation of GAS into (1) initial pre-translation, (2) summary of expert committee recommendations, (3) back-translation, (4) re-suggestions by expert committees, (5) content validity evaluation, (6) pre-testing and cognitive interviews (7) establishment of the final version of GAS-C.31
Initial Pre-Translation
First, two experts who are bilingual in Chinese and English (one bilingual expert is a team member who is familiar with the research, the other is a professor in the Department of English) translated GAS from English to Chinese back-to-back, resulting in two Chinese drafts of the scale.
Summary of Expert Committee Recommendations
Two bilingual experts were asked to work with the research team members to compare and analyze the two initial drafts. Then, we integrated out one initial Chinese draft of the scale.
Back-Translation
Two other bilingual experts whose native language is English back-to-back translated the prepared initial Chinese draft back into English to form two back-translated English scales.
Re-Suggestions by Expert Committees
One epidemiologist and four bilingual experts mentioned above were asked to meet with the research team members. They compared and analyzed the original English version of the scale, two draft English to Chinese versions, one integrated initial Chinese draft, and the two back-translated versions to finalize the initial Chinese version of GAS.
Content Validity Evaluation
Six physicians working on diabetes wards were invited to evaluate the content validity of the GAS-C. A four-point Likert scale was used to examine the degree of correlation between each item and GAS-C’s measurement objectives. A pre-test would be conducted after content validity meets the evaluation criteria.
Pre-Testing and Cognitive Interviews
Subsequently, among the inpatients in the diabetes ward of a general hospital, 15 patients with T2D who met the research criteria were selected for the prediction test. After the patients filled out the initial Chinese version of GAS, the researchers conducted a cognitive interview to investigate the comprehensibility and conceptual equivalence of the text in the questionnaire, find the problem, and make adjustments in time.
Establishment of the Final Version of GAS-C
There was no ambiguity in the subjects’ understanding of the initial Chinese version of the scale during the interview. The scale was filled in smoothly. The initial version could better reflect the original author’s intention, so it was decided to determine the initial Chinese version as the final Chinese version of the GAS.
Data Collection
A public health intern, as the investigator, introduced the study to the hospitalized patients at the bedside and asked them if they would like to participate in the study, if the inpatients agreed to participate and met the subjects criteria, then enter the study. The questionnaire was completed the day before the subject was discharged from the hospital. The subject was asked to sign an informed consent form before filling out the questionnaire. If the subject is illiterate or visually impaired, the questionnaire will be read aloud to him or her. After the subjects had answered according to his or her own judgment, the investigator would fill in the questionnaire instead of the subjects. During the questioning process, the investigator tried to be as calm, objective, non-intrusive as possible. After completing the questionnaire, the investigator asked if the subjects was willing to fill out the GAS questionnaire once more two weeks later. We randomly selected 100 subjects who agreed to be retested and surveyed them again using the GAS-C two weeks later when they returned to the clinic for a follow-up visit.
Statistical Analysis
Except for the use of AMOS 23.0 in the confirmatory factor analysis (CFA), the rest of the data analysis was performed using the SPSS 23.0. The subjects’ socio-demographic information was described by mean and standard deviation, frequency, percentage. Continuous variables were expressed as mean± standard deviation (SD), while categorical variables were expressed as counts and percentages. P<0.05 is a statistically significant difference.
Item Analysis
To test the appropriateness of each item of GAS-C and decide to keep or delete an item, we conducted an item analysis on the scale, used homogeneity test and other methods to screen the item. There are four retention criteria. If (1) statistics the correlation between each item and the total score, if the difference test P≥0.05 or the correlation coefficient r<0.4, delete the item,32 (2) In factor analysis, if the communalities of an item was less than 0.4, the item would be deleted,21 (3) If the Measure of Sampling Adequacy (MSA) of a certain item ≥0.5, it means that the item could be included in the factor analysis process, otherwise it would be deleted,33 (4) If the value of the internal consistency coefficient α of the scale increases after deleting a specific item, then the item will be removed.31
Validity Analysis
We analyzed the content validity, construct validity, and criterion-related validity of GAS-C. According to the content validity measurement method proposed by Lynn,34 six doctors working in the diabetes ward were invited to evaluate the content validity of the initial GAS-C. One researcher introduced the concept of general adherence and the purpose of this study to the six physicians before scoring. When all physicians reported that they had understood, the researcher invited them to read the five items of the GAS-C in turn and to judge the degree of correlation between each item and the measurement objectives of GAS-C. The scoring method is a four-point Likert response. 1= not relevant to 4= very relevant. After scoring, the item-level content validity index (I-CVI) and the scale-level content validity index (S-CVI) were calculated. S-CVI was calculated using the S-CVI/Ave method, that is, calculated the average of I-CVI for each item. According to Lynn’s content validity standards, if the number of experts is ≥6, those items with I-CVI ≥0.78 can be retained.34 Under Polit’s recommendation, when the S-CVI/Ave≥0.9, the scale-level content validity is acceptable.35
An exploratory factor analysis (EFA) was conducted to test the construct validity of the GAS-C. If the Kaiser-Meyer-Olkin measure of sampling adequacy (KMO)≥0.70,33 and the difference of Bartlett’s Test of Sphericity Approx is statistically significant (p<0.05),36 the GAS-C as a whole is judged to be suitable for factor analysis.37 If the Measure of Sampling Adequacy (MSA) of an item≥ 0.5 indicates that the item could be included in the factor analysis process, otherwise, it would be deleted.33 We chose the principal component analysis (PCA) combined with the Varimax orthogonal rotation method to analyze our data. The Kaiser’s eigenvalue>1 principle was used to extract common factors.38 Factors with Initial Eigenvalues greater than one were retained.37 At the same time, we used the scree test to assist our judgment, observed scree plot, and visually judged the number of extracted factors.39
In conducting the confirmatory factor analysis (CFA), we used the following criteria to assess the goodness of the model. Ratio of chi-square to degrees of freedom (CMIN/df)<5; goodness of fit index (GFI), Tucker–Lewis index (TLI), comparative fit index (CFI) value >0.9; root mean square residual (RMR)<0.05; root mean square error of approximation (RMSEA) got a value of 0.08 or less, it would imply that the model was good fits with the data.40–42
We analyzed the correlation between GAS-C and MMAS-8 to test the criterion-related validity of GAS-C. If the Pearson correlation coefficient r is statistically significant and greater than 0.4, the criterion-related validity is acceptable.43
Reliability Analysis
We evaluated the reliability of GAS-C by analyzing internal consistency reliability, intraclass correlation coefficient (ICC), test-retest reliability. The Cronbach’s alpha value judged the internal consistency reliability of the GAS-C. If Cronbach’s alpha value is more than or equal to 0.70, the scale’s internal consistency reliability is appropriate.31 The GAS-C has five items. The folded-in-half items are unequal in length, so we calculated the unequal length Spearman-Brown coefficient. The judgment standard is the same as that of Cronbach’s alpha value, which is greater than or equal to 0.7 is good.31
Cicchetti suggests that an ICC is good between 0.6 and 0.74, and more than or equal to 0.75 is excellent.44,45 We accepted the suggestion. The Pearson correlation coefficient r of test-retest reliability ≥0.7 is acceptable.32,46
Ceiling Effect and Floor Effect
We also examined the data for the ceiling effect and floor effect to see if there was any response bias. The ceiling effect means the percentage of subjects achieving the maximum score on an item exceeded 15%. Similarly, The floor effect means the percentage of subjects achieving the minimum score on an item exceeded 15%.47
Results
A total of 336 T2D patients were collected, from which 200 were randomly selected as Subject B for the CFA in Study B and the remaining 136 as Subject A for the reliability and validity analysis of the GAS-C in Study A. There was no missing data. Table 1 records the characteristics of the subjects.
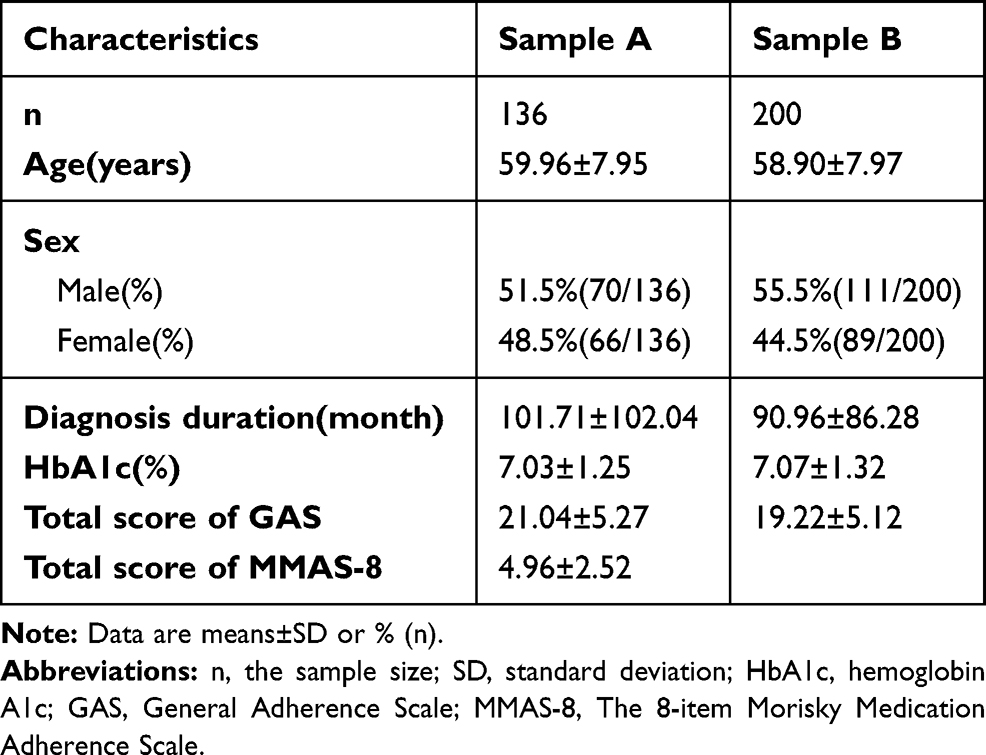 |
Table 1 General Characteristics of the Participants in Sample A and B |
Item Analysis
As seen in the item analysis (Table 2), the correlation coefficient r between each item score and the total scale score was Between 0.861 and 0.926, all greater than or equal to 0.4, and the differences were statistically significant (p<0.01). In factor analysis, the items’ communalities were between 0.740 and 0.862, all higher than 0.4. The five items’ MSA values were between 0.883 and 0.945, all greater than 0.5, indicating that the five items in the scale were all suitable for entering the factor analysis process.In the reliability analysis, the internal consistency reliability α of the GAS-C was 0.942. Each time an attempt was made to delete an item in turn, the alpha value decreases accordingly. We ended up keeping all the items.
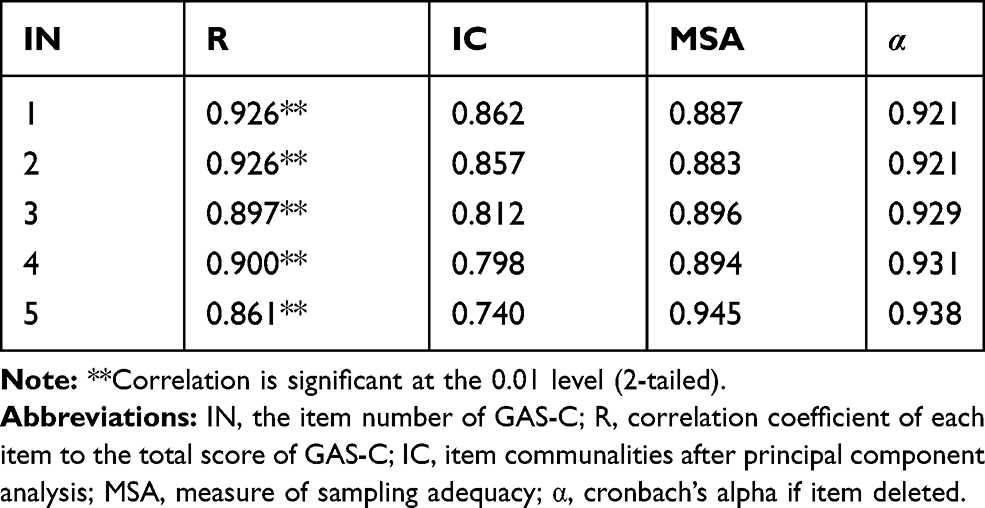 |
Table 2 Summary of Item Analysis of GAS |
Validity Analysis
Content Validity
The calculation results of content validity showed that the I-CVI of the five items were between 0.83 and 1, all higher than 0.78, and the S-CVI/Ave of GAS-C was 0.94. They all met the criteria for judging content validity.34 GAS-C has good content validity (Table 3).
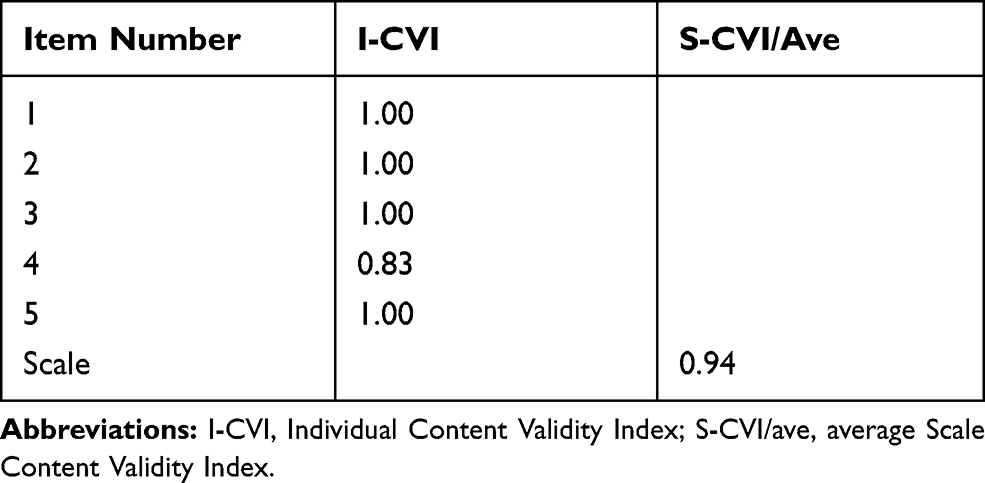 |
Table 3 I-CVI and S-CVI of GAS |
Result of Constructing Validity
We carried out an EFA to test the construct validity of the GAS-C (Table 4). We chose PCA combined with the Varimax orthogonal rotation method to analyze our data. KMO value was equal to 0.899≥0.7. The difference of Bartlett’s Test had Statistical significance (p<0.05). The Chi-square value was equal to 611.821, and the degree of freedom (df) was 10 (p<0.001). These results indicated that there were common factors among the variables, and GAS-C was suitable for factor analysis.33,36 The communalities of the items were between 0.740 and 0.862, all greater than or equal to 0.4. The MSA values were between 0.883 and 0.945, all greater than or equal to 0.5. Five items in the scale were suitable for the factor analysis process. A common factor was extracted by applying the Kaiser’s eigenvalue-over-one principle. It could explain 81.403% of the total variance. The Initial Eigenvalues was 4.070. Factor loadings of items of GAS-C range from 0.860 to 0.929. It is also clear from the scree plot that it is more appropriate to extract a common factor (Figure 1).
 |
Table 4 Summary of Exploratory Factor Analysis |
 |
Figure 1 Scree plot. Notes:Only one factor have a Kaiser’s eigenvalue ≥1; extraction method, principal component analysis. |
We used confirmatory factor analysis to validate the one-dimensionalproperties of GAS-C. CFA analysis showed that χ2= 10.161, df=5, CMIN/DF=2.032<5; GFI =0.981, CFI =0.996, TLI =0.992, their values all greater than 0.9; the RMR =0.011<0.05, and the RMSEA =0.072. All the fit indexes indicated that the one-factormodel was good fits with the data of GAS-C. Standardized factor loadings ranged between 0.88 for item 5 and 0.95 for item 2 (Figure 2).
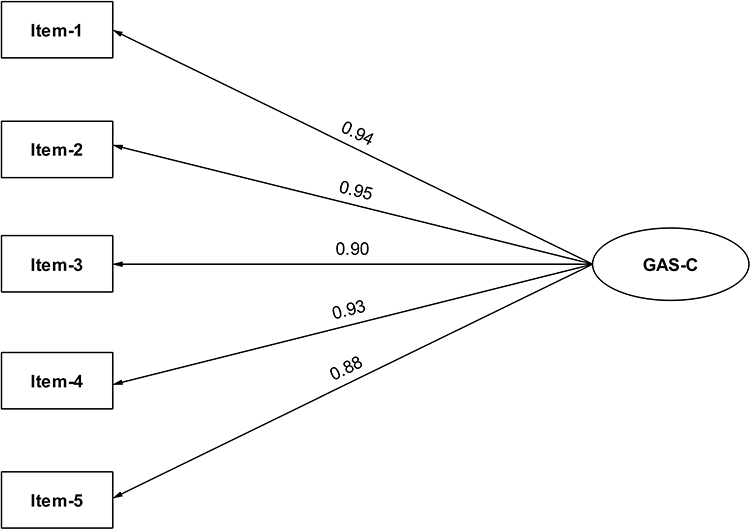 |
Figure 2 Path diagram for GAS-C’s CFA. Abbreviations: CFA, confirmatory factor analysis; GAS-C, General Adherence Scale in Chinese. |
Criterion-RelatedValidity
To understand GAS-C’s criterion-related validity, we performed a Pearson correlation analysis between GAS-C and MMAS-8. We found that the correlation coefficients r=0.542>0.4, p<0.001, which indicates that the criterion-related validity of GAS-C is acceptable.43
Reliability Analysis
Internal consistency refers to the extent that all items in a scale contribute positively towards measuring the same construct. Cronbach’s alpha is the most common measure for assessing reliability and determining the items’ internal consistency in a scale32 A higher Cronbach’s alpha coefficient means a higher homogeneity between items examining the scale’s same dimension. The Cronbach’s alpha reliability coefficient was 0.942≥0.7, which means the GAS-C’s internal consistency reliability is ideal.31 GAS-C’s ICC was 0.941 (95% CI 0.924–0.955). Based on Cicchetti’s criteria, the ICC is excellent.44 Two weeks later, we used GAS-C to measured 100 subjects again. The correlation coefficient r for the total GAS-C score obtained from the pre and post measurements was 0.772 p< 0.001. The test-retest reliability of GAS-C is acceptable.43 The split-half method applies to reliability measures for those scales which assume unidimensionality of the construct. We chose the Spearman-Brown method to calculate the split-half reliability of the GAS-C. The GAS-C five items were randomly divided into two unequal parts by SPSS statistical software, with the first half containing items 1, 2, and 3 and the second half containing items 4 and 5. The correlation coefficient between the first half and the second half was 0.880. The unequal Spearman-Brown coefficient value was 0.939 ≥ 0.7, which indicates that the GAS-C’s split-half reliability was good.31
Ceiling Effect and Floor Effect
No one in this survey had the lowest total GAS-C score of 5. There was no floor effect on the data. Out of 136 subjects, 20 subjects achieved a maximum total score of 30, which was 14.71% of all people less than the 15% ceiling effect criterion. The data did not have ceiling effect too.47 The subjects had little to no response bias in this survey.
Discussion
Poor adherence to glucose management programs is the main reason for long-term unsatisfactory glycemic control in diabetic patients.13 Although there are a variety of effective measures to control blood glucose in T2D patients, only patients with good adherence can benefit from it. Therefore, it is necessary to carry out scientific research to improve adherence in T2D patients. The adherence of T2D patients is a kind of general adherence. In addition to the adherence of taking medicine, it also includes a healthy lifestyle, regular monitoring of blood glucose, injection of drugs, physical therapy, and the prevention and treatment of chronic complications.15 There is currently no research tool available in China that can measure general adherence in T2D patients. Therefore, we revised the GAS and hope that the GAS-C could be used for adherence studies in Chinese T2D patients.
After translation, back-translation, content validity evaluation, pre-experimentation, and cognitive interviews, we finalized the GAS. During the pre-test, the measured subjects gave positive comments about the comprehensibility and convenience of the questionnaire.
GAS-C also has good content validity. EFA revealed that the GAS-C is one-dimensional, which is the same as the scale structure of the original GAS, and CFA further supported this conclusion. The correlation coefficient r for the criterion-related validity of GAS-C is 0.542, which is relatively modest. Because the MMSA-8 scale selected in this study is mainly used to measure the patient’s medication adherence, and the adherence of GAS refers to general adherence throughout the prevention, treatment, and health care of patients. General adherence is related to and distinct from medication adherence. Medication adherence is a part of general adherence, which may explain why GAS and MMSA-8 are related, but the correlation is not too high.
The Cronbach’s Alpha of the original GAS was 0.78 in the baseline, and it was 0.79 for the two-year follow-up.25 The Cronbach’s Alpha of GAS in the other two studies were 0.81 and 0.87, respectively.16,48 It reached 0.942 in this study, indicating that both the original GAS and the GAS-C had good internal consistency reliability. However, because these studies selected entirely different subjects, so there is little comparability between their alpha values. The correlation coefficient r of GAS’s test-retest reliability still reached 0.41 two years later,16 and the r of GAS-C’s test-retest reliability was 0.772 after two weeks. Since two years and two weeks are not comparable, it remains to be seen whether our revised scale continues to be stable after two years. If conditions permit, we will conduct further research on this issue in two years. In this study, we also analyzed the ICC and split-half reliability of GAS-C. The results were satisfactory, indicating that overall, the reliability of GAS-C is nice.
Non-adherence is more common in people with diabetes.4 How to improve the adherence of T2D patients and how to control their blood glucose better is still a common challenge for medical professionals. It is necessary to research T2D patients’ adherence in various aspects to get out of this dilemma. For example, further understanding the reasons for the occurrence of non-adherence behavior and the manifestation of non-adherence behavior, as well as to grade the degree of non-adherence of patients, and then to develop a reasonable and effective intervention method to address the problems identified.
An essential point in researching adherence is that the researcher should insist on using scientific and useful research tools to draw more credible conclusions. Since GAS uses a self-assessment format for subjects, the subjects are likely to miss valid information by making subjective judgments. For example, a male patient with T2D has to rely on taking medications to control his blood sugar better. He has proper daily adherence with his doctor’s instructions to maintain a healthy lifestyle, control diet, and exercise, but he often forgets to take medication, leading to poor glycemic control. When he fills in a self-assessment questionnaire such as GAS, the patient may think that he is following the doctor’s advice in all aspects except taking medication, so he will likely make a very positive evaluation of his adherence. As another example, a male T2D patient with poor adherence develops severe life-threatening complications and is currently forced to inject insulin strictly as prescribed by his physician. Although his blood glucose control is perfect after using insulin, he still has various prejudices about using insulin. He is unwilling to use it if left to his own choice. How do we assess his adherence objectively, despite his blood glucose meeting the goal of treatment?
So far, there is still no clear conclusion about whether using subjective self-assessment questionnaires or relying on objective clinical indicators such as glycated hemoglobin value can truly reflect patient’s adherence. Researchers may need to conduct more research and discuss it.
Strengths
GAS is widely used, but as far as we know, this is the first revised Chinese version of GAS. This study’s research objectives and the inclusion and exclusion criteria of the research subjects are relatively clear. The sample size of this study met the requirements of the revised scale and structural equation model. Due to the efforts of the investigators, there was no missing data from the survey. GAS-C has relatively good reliability and validity, CFA also verify the goodness of the GAS-C model. All of the above are the strengths of this study.
Limitations
There are several shortcomings in this study. Firstly, the selection of the subjects was not representative enough. China is a multi-ethnic country. Not only are lifestyles and dietary structures very different among ethnic groups, but the proportion of T2D patients also varies.2 This study only selected the urban Han population as the research object. Whether GAS-C can be applied to T2D patients of other ethnic groups needs further research.
Secondly, there were limitations in the age selection of the study subjects. The age range of the subjects in this study was 45–74 years old. Since the onset of T2D patients in China is increasingly showing a tendency to be younger,49 more attention should be paid to the study of adherence in adolescent or pre-adult T2D patients.50 For convenience sampling, the study did not include adolescent or pre-adult study subjects, which is another deficiency. We will further expand the subject’s age range to make up for this deficiency in the future.
Another shortcoming of this study is that the GAS is used to evaluate a patient’s compliance with physician recommendations within the last four weeks. But subject to the conditions we had to collect data measuring the retest reliability only after two weeks, despite the precautions we have taken, which might happen with the Hawthorne effect and social desirability bias. We do not know the long-term prediction effect of GAS-C on the adherence of T2D patients. We cannot answer whether those T2D patients who showed high scores in the GAS-C test would have a better blood sugar control result. We will solve these problems in the future.
Conclusion
We revised the Chinese version of GAS, which has superior reliability and validity. The scale is one-dimensional and has five items. It can be applied to the Han people’s general adherence study of middle-aged and elderly type 2 diabetes patients using insulin in urban China.
Acknowledgments
We would like to thank Ms. Hongyan Chen and the doctors from the diabetes department of the hospitals of Hai Cheng City for their help during the conduct of this study and pay tribute to them.
Funding
This study was funded by a project grant from The Pudong New District Health Commission (PW2017A-29). With additional support from The Outstanding Clinical Discipline Project of Shanghai Pudong (Grant No. PWYgy2018-10). Additional fundings were received from The Key Undergraduate Course Project of Shanghai Education Commission (201965).
Disclosure
The authors report no conflicts of interest in this work. Use of the ©MMAS is protected by US copyright and registered trademark laws. Permission for use is required. A license agreement is available from: MMAR, LLC., Donald E. Morisky, 294 Lindura Court, Las Vegas, NV 89138-4632; [email protected].
References
1. Xu Y, Wang L, He J, et al. Prevalence and control of diabetes in Chinese adults. JAMA. 2013;310(9):948–959. doi:10.1001/jama.2013.168118
2. Wang L, Gao P, Zhang M, et al. Prevalence and ethnic pattern of diabetes and prediabetes in China in 2013. JAMA. 2017;317(24):2515–2523. doi:10.1001/jama.2017.7596
3. King DE, Mainous AR, Carnemolla M, Everett CJ. Adherence to healthy lifestyle habits in US adults, 1988–2006. Am J Med. 2009;122(6):528–534. doi:10.1016/j.amjmed.2008.11.013
4. Geisel-Marbaise S, Stummer H. Diabetes adherence—does gender matter? J Public Health. 2010;18(3):219–226. doi:10.1007/s10389-009-0305-2
5. Sabaté E, Sabaté E. Adherence to Long-Term Therapies: Evidence for Action. World Health Organization; 2003.
6. Karter AJ, Parker MM, Moffet HH, Ahmed AT, Schmittdiel JA, Selby JV. New prescription medication gaps: a comprehensive measure of adherence to new prescriptions. Health Serv Res. 2009;44(5 Pt 1):1640–1661. doi:10.1111/j.1475-6773.2009.00989.x
7. Cramer JA. A systematic review of adherence with medications for diabetes. Diabetes Care. 2004;27(5):1218–1224. doi:10.2337/diacare.27.5.1218
8. Ho PM, Rumsfeld JS, Masoudi FA, et al. Effect of medication nonadherence on hospitalization and mortality among patients with diabetes mellitus. Arch Intern Med. 2006;166(17):1836–1841. doi:10.1001/archinte.166.17.1836
9. Menzin J, Korn JR, Cohen J, et al. Relationship between glycemic control and diabetes-related hospital costs in patients with type 1 or type 2 diabetes mellitus. J Manag Care Pharm. 2010;16(4):264–275. doi:10.18553/jmcp.2010.16.4.264
10. Mao W, Yip CW, Chen W. Complications of diabetes in China: health system and economic implications. Bmc Public Health. 2019;19(1):269. doi:10.1186/s12889-019-6569-8
11. Yang C, Huang Z, Sun K, Hu Y, Bao X. Comparing the economic burden of type 2 diabetes mellitus patients with and without medical insurance: a cross-sectional study in China. Med Sci Monit. 2018;24:3098–3102. doi:10.12659/MSM.907909
12. Wenlan D, Qinglin L, Lei W, Haidi W, Fan M. Direct economic burden of type 2 diabetes mellitus and its influencing factors among community patients. Chin J Public Health. 2019;35(11):1457–1460.
13. Johnson SB. Methodological issues in diabetes research: measuring adherence. Diabetes Care. 1992;15(11):1658–1667. doi:10.2337/diacare.15.11.1658
14. Haynes RB, Taylor DW, Sackett DL. Compliance in Health Care. Baltimore: Johns Hopkins University Press; 1979.
15. Diabetes Branch Of Chinese Medical Association. Guidelines for the prevention and control of type 2 diabetes in China (2017 Edition). Chin J Pract Intern Med. 2018;38(4):292–344.
16. DiMatteo MR, Hays RD, Sherbourne CD. Adherence to cancer regimens: implications for treating the older patient. Oncology. 1992;6(2 Suppl):50–57.
17. Bizub DM. Do Motivational Readiness to Change and Self-Efficacy Affect Treatment Adherence Among People with Type 2 Diabetes? Fordham University; 2004.
18. Aazami S, Mozafari M, Poorabdollah H. Insulin-related outcomes (satisfaction, pain, and adherence) among type II diabetes patients switched from syringe to insulin pen. Bali Med J. 2018;7(3):678–681.
19. Akbarnataj K, Hassanzadeh R, Dousti Y, Fakhri M, Shirafkan A. Effectiveness of information-motivation and behavioral skills (IMB) model on adherence of recommended treatment regimens in patients with type 2 diabetes. Nurs Dev Health. 2015;6(1):27–37.
20. Jackson DL. Revisiting sample size and number of parameter estimates: some support for the N:q Hypothesis. Struct Equ Modeling. 2003;10(1):128–141. doi:10.1207/S15328007SEM1001_6
21. Costello A, Osborne J. Best practices in exploratory factor analysis: four recommendations for getting the most from your analysis. Pract Assess Res. 2005;10:Article 7.
22. Kline RB. Principles and Practice of Structural Equation Modeling.
23. Hays RD. The medical outcomes study (mos) measures of patient adherence. Available from: https://www.rand.org/content/dam/rand/www/external/health/surveys_tools/mos/mos_adherence_survey.pdf.
24. Holstad MM, Foster V, Diiorio C, McCarty F, Teplinskiy I. An examination of the psychometric properties of the antiretroviral general adherence scale (AGAS) in two samples of HIV-infected individuals. J Assoc Nurses AIDS Care. 2010;21(2):162–172. doi:10.1016/j.jana.2009.08.002
25. Sherbourne CD, Hays RD, Ordway L, DiMatteo MR, Kravitz RL. Antecedents of adherence to medical recommendations: results from the medical outcomes study. J Behav Med. 1992;15(5):447–468. doi:10.1007/BF00844941
26. Morisky DE, Ang A, Krousel-Wood M, Ward HJ. Predictive validity of a medication adherence measure in an outpatient setting. J Clin Hypertens. 2008;10(5):348–354. doi:10.1111/j.1751-7176.2008.07572.x
27. Berlowitz DR, Foy CG, Kazis LE, et al. Effect of intensive blood-pressure treatment on patient-reported outcomes. New Engl J Med. 2017;377(8):733–744. doi:10.1056/NEJMoa1611179
28. Bress AP, Bellows BK, King JB. Cost-effectiveness of intensive versus standard blood-pressure control. New Engl J Med. 2017;377(8):745–755. doi:10.1056/NEJMsa1616035
29. World Health Organization. Process of translation and adaptation of instruments. Available from: https://www.who.int/substance_abuse/research_tools/translation/en/.
30. Guillemin F, Bombardier C, Beaton D. Cross-cultural adaptation of health-related quality of life measures: literature review and proposed guidelines. J Clin Epidemiol. 1993;46(12):1417–1432. doi:10.1016/0895-4356(93)90142-N
31. DeVellis RF. Scale Development: Theory and Applications.
32. Nunnally JC, Bernstein IH. Psychometric Theory.
33. Kaiser HF, Little Jiffy RJ, Mark I. Little Jiffy, Mark Iv. Educ Psychol Meas. 1974;34(1):111–117. doi:10.1177/001316447403400115
34. Lynn MR. Determination and quantification of content validity. Nurs Res. 1986;35(6):382–385. doi:10.1097/00006199-198611000-00017
35. Polit DF, Beck CT. The content validity index: are you sure you know what’s being reported? Critique and recommendations. Res Nurs Health. 2006;29(5):489–497. doi:10.1002/nur.20147
36. Bartlett MS. Tests of significance in factor analysis. Br J Math Stat Psychol. 1950;3(2):77–85. doi:10.1111/j.2044-8317.1950.tb00285.x
37. Hair JF, Black WC, Babin BJ, Anderson RE. Multivariate Data Analysis.
38. Kaiser HF. The application of electronic computers to factor analysis. Educ Psychol Meas. 1960;20(1):141–151. doi:10.1177/001316446002000116
39. Cattell RB. The scree test for the number of factors. Multivar Behav Res. 1966;1(2):245–276. doi:10.1207/s15327906mbr0102_10
40. Hoyle RH. Structural Equation Modeling Concepts, Issues, and Applications. Thousand Oaks: SAGE Publications, Inc; 1995.
41. Bentler PM. Comparative Fit Indexes in Structural Models. US: American Psychological Association; 1990:238–246.
42. Carmines EG. Analyzing models with unobserved variables. Curr Opin Environ. 1981;80.
43. Kaplan RM, Saccuzzo DP. Psychological Testing: Principles, Applications, and Issues.
44. Cicchetti DV, Sparrow SA. Developing criteria for establishing interrater reliability of specific items: applications to assessment of adaptive behavior. Am J Ment Defic. 1981;86(2):127–137.
45. Fleiss JL, Cohen J. The equivalence of weighted kappa and the intraclass correlation coefficient as measures of reliability. Educ Psychol Meas. 1973;33(3):613–619. doi:10.1177/001316447303300309
46. Michalos AC. Encyclopedia of Quality of Life and Well-Being Research. Springer Netherlands Dordrecht; 2014.
47. Terwee CB, Bot SD, de Boer MR, et al. Quality criteria were proposed for measurement properties of health status questionnaires. J Clin Epidemiol. 2007;60(1):34–42. doi:10.1016/j.jclinepi.2006.03.012
48. Jerant A, DiMatteo R, Arnsten J, Moore-Hill M, Franks P. Self-report adherence measures in chronic illness: retest reliability and predictive validity. Med Care. 2008;46(11):1134–1139. doi:10.1097/MLR.0b013e31817924e4
49. Yang W. Epidemiology and trends in diabetes in China. Sci Sin. 2018;48(8):812–819. doi:10.1360/N052018-00005
50. Chan JCN, Malik V, Jia W, et al. Diabetes in Asia: epidemiology, risk factors, and pathophysiology. JAMA. 2009;301(20):2129–2140. doi:10.1001/jama.2009.726
 © 2021 The Author(s). This work is published and licensed by Dove Medical Press Limited. The full terms of this license are available at https://www.dovepress.com/terms.php and incorporate the Creative Commons Attribution - Non Commercial (unported, v3.0) License.
By accessing the work you hereby accept the Terms. Non-commercial uses of the work are permitted without any further permission from Dove Medical Press Limited, provided the work is properly attributed. For permission for commercial use of this work, please see paragraphs 4.2 and 5 of our Terms.
© 2021 The Author(s). This work is published and licensed by Dove Medical Press Limited. The full terms of this license are available at https://www.dovepress.com/terms.php and incorporate the Creative Commons Attribution - Non Commercial (unported, v3.0) License.
By accessing the work you hereby accept the Terms. Non-commercial uses of the work are permitted without any further permission from Dove Medical Press Limited, provided the work is properly attributed. For permission for commercial use of this work, please see paragraphs 4.2 and 5 of our Terms.