")
Back to Journals » Cancer Management and Research » Volume 11
The prognostic value of the postoperative serum CEA levels/preoperative serum CEA levels ratio in colorectal cancer patients with high preoperative serum CEA levels
Authors Xie HL, Gong YZ , Kuang JA, Gao F , Tang SY, Gan JL
Received 26 April 2019
Accepted for publication 19 July 2019
Published 7 August 2019 Volume 2019:11 Pages 7499—7511
DOI https://doi.org/10.2147/CMAR.S213580
Checked for plagiarism Yes
Review by Single anonymous peer review
Peer reviewer comments 2
Editor who approved publication: Dr Sanjeev K. Srivastava
Hai-Lun Xie,1,* Yi-Zhen Gong,1,* Jia-An Kuang,1 Feng Gao,1 Shuang-Yi Tang,2 Jia-Liang Gan1
1Department of Colorectal Anal Surgery, The First Affiliated Hospital of Guangxi Medical University, Nanning, Guangxi, People’s Republic of China; 2Department of Pharmacy, The First Affiliated Hospital of Guangxi Medical University, Nanning, Guangxi, People’s Republic of China
*These authors contributed equally to this work
Purpose: This study aimed to assess the prognostic value of the postoperative serum carcinoembryonic antigen (CEA) levels/preoperative serum CEA levels ratio (CEA ratio) in colorectal cancer (CRC) patients with high preoperative serum CEA levels and to identify the optimal prognostic cutoff value.
Patients and methods: The medical records of 187 CRC patients in a single center who underwent surgery between September 2012 and September 2014 were retrospectively reviewed. CEA ratio was defined as the ratio between the postoperative serum CEA and preoperative serum CEA. The optimal cutoff values for the CEA ratio were determined by time-dependent receiver operating characteristic (ROC) curve analyses. The Chi-square test or Fisher’s exact probability test were used to test the correlation between CEA ratio and clinicopathological characteristics. Univariate, multivariate, and subgroup Cox proportional hazards analysis were used to identify independent prognostic factors. Kaplan–Meier method was used for establishing survival curves.
Results: The median follow-up time was 62 months (range 3–88 months). The optimal CEA ratio cutoff value closely related to disease-free survival was 0.295. In the Chi-square test, the CEA ratio was associated with pN stage (p=0.003) and postoperative CEA (p<0.001). In the multivariate analysis, the CEA ratio was an independent prognostic factor for disease-free survival (p=0.003, HR 2.300 [95% CI: 1.326–3.988]) and cancer-special survival (p=0.003, HR 2.525 [95% CI: 1.381–4.614]). The CEA ratio reflected the prognosis of CRC patients more accurately than postoperative CEA levels alone, and the CEA ratio of 0.295 was more likely to reflect the prognosis than other cutoff values.
Conclusion: The CEA ratio is a simple and useful tool for further forecasting the prognosis of CRC patients with high preoperative CEA levels and may help develop strategies for the postoperative treatment of CRC patients.
Keywords: colorectal cancer, prognosis, CEA ratio, high preoperative CEA levels
Introduction
Colorectal cancer (CRC) is the third most common malignant tumor, and its mortality rate ranks second worldwide. There were over 1.8 million new CRC diagnoses worldwide in 2018, with an estimated 881,000 deaths.1 In China, CRC is the fifth most common malignant tumor, and its mortality ranks fourth. The incidence of the disease continues to increase.2 Despite the significant benefits of many treatment procedures, including surgery, neoadjuvant radiotherapy, and adjuvant chemotherapy, the long-term survival rate of advanced CRC remains unsatisfactory, with a 5-year survival rate of less than 12%.3–5 Therefore, further research is required to identify prognostic indicators that better assess CRC survival and tumor progression.
The carcinoembryonic antigen (CEA) is one of the most commonly used prognostic factors for CRC.6,7 Many studies have indicated that preoperative serum CEA level is important for prognosing patients with CRC and found that high preoperative serum CEA level is an independent risk factor for prognosis.8–12 However, Konishi et al showed that patients with high preoperative CEA levels can normalize after resection of the primary tumor, and their prognosis was consistent with normal preoperative CEA patients.6,13–15 These findings suggest that other factors are needed to aid prognostication in CRC patients with high preoperative CEA levels.
Recently, some studies hypothesized that the post/preoperative serum CEA ratio could predict the prognosis of CRC patients. The CEA ratio reflects the prognosis through changes in serum CEA levels after treatment, which can correct other diseases or factors affecting serum CEA levels.7,16,17 However, most of those investigations studied specific TNM stages, and the relationship between the CEA ratio and the prognosis of CRC patients with high preoperative CEA levels remains unclear. In the study, for the first time, we aimed to investigate the prognostic value of the CEA ratio in CRC patients with high preoperative CEA levels.
Materials and methods
Study design
This is a retrospective study from a single center.
Study population
The medical records of 670 CRC patients who underwent surgery at the Department of Colorectal Anal Surgery at the First Affiliated Hospital of Guangxi Medical University (Guangxi, China) between September 2012 and September 2014 were retrospectively reviewed. Cases were selected according to the following inclusion criteria: 1) histopathological diagnosis of colon or rectal cancer, 2) complete clinical pathology report and postoperative follow-up data, and 3) complete data of preoperative and postoperative serum CEA levels. Cases were excluded according to the following criteria: 1) patients died due to non-CRC-related means, 2) patients had normal preoperative serum CEA levels, 3) patients underwent palliative surgery, and 4) refusal to sign informed consent to process biological specimens.
Collection of preoperative and postoperative serum CEA levels, and baseline clinicopathological characteristics
Preoperative fasting venous blood (4 mL) was collected on the second day following admission. Postoperative fasting venous blood (4 mL) was collected on or after the 30th day following surgery. Blood samples were centrifuged within 1 hr of collection. Serum that could not be analyzed within 6 hrs was stored at −20°C. Preoperative and postoperative serum CEA levels were measured using a chemiluminescence immunoassay with the Elecsys 2010 Immunoassay Analyzer (Roche Diagnostics, Risch-Rotkreuz, Switzerland). The following concentrations were considered to indicate positive expression: preoperative serum CEA levels ≥5 ng/mL, postoperative serum CEA levels ≥5 ng/mL. The CEA ratio was calculated using the preoperative and postoperative blood serum CEA laboratory data by the following formula: CEA ratio=postoperative serum CEA levels/preoperative serum CEA levels. The clinicopathological characteristics examined were gender, age, pT stage, pN stage, metastasis, tumor location, perineural/vascular invasion, pathological type, differentiation, operation method, and postoperative chemoradiotherapy.
Survival follow-up
According to the AJCC guidelines, patients were followed-up with primarily by telephone and outpatient clinics based on informed patient knowledge. Follow-up examinations included blood tests such as serum tumor biomarkers, as well as image diagnostics, including X-rays, positron emission tomography, computed tomography, and periodic colonoscopy. The end of the follow-up period was June 25, 2019. The censored data for disease-free survival (DFS) were defined as the data from patients who had no recurrence and metastasis after operation at the end of the follow-up deadline. DFS was defined as the time from resection of the cancer to recurrence, metastasis, or the censored time. The censored data for cancer-special survival (CSS) were defined as the data from patients who were alive at the end of the follow-up deadline. CSS was defined as the time from resection of the CRC to death from CRC or the censored time. Poor prognosis was defined as patients had recurrence and metastasis or died of CRC during follow-up, good prognosis was defined as patients had no recurrence and metastasis and were alive during follow-up.
Statistical analyses
The time-dependent receiver operating characteristic (ROC) curve analysis and area under the ROC curve (AUC) were used to evaluate the feasibility of using the CEA ratio as a predictor of DFS, and the optimal prognosis cutoff value for the CEA ratio was obtained by Youden index.18 We used the time-dependent ROC analysis production website, Cutoff Finder (http://molpath.charite.de/cutoff/index.jsp), which considered the censored survival time.19 The Chi-square test or Fisher’s exact test was used to test the correlation between the CEA ratio and clinicopathologic characteristics. The survival curve was estimated by the Kaplan–Meier method, and statistical differences were examined using a log-rank test. Univariate, multivariate, and subgroup survival analysis were performed using the likelihood ratio test of the Cox proportional hazards model. The nomograms for predicting DFS and CSS were established by using Cox proportional hazards model. A probability (p) value of <0.05 (two-sided) was considered statistically significant. All statistical analyses were performed using IBM SPSS Statistics for Windows, version 24.0 (IBM Corp, Armonk, NY, USA) and R Version 3.5.3 (https://www.r-project.org/).
Results
Patients, clinicopathologic characteristics
This study included medical records of 670 CRC patients. One hundred and forty-eight patients were excluded due to the lack of postoperative serum CEA data, 24 patients underwent palliative surgery, 7 patients died of non-CRC-related means, and 304 patients had normal preoperative serum CEA levels. In total, the medical records of 187 CRC patients were retrospectively reviewed. The median follow-up time was 62 months (the follow-up period was 3–88 months). The process of case inclusion and exclusion in this study is shown in Figure 1.
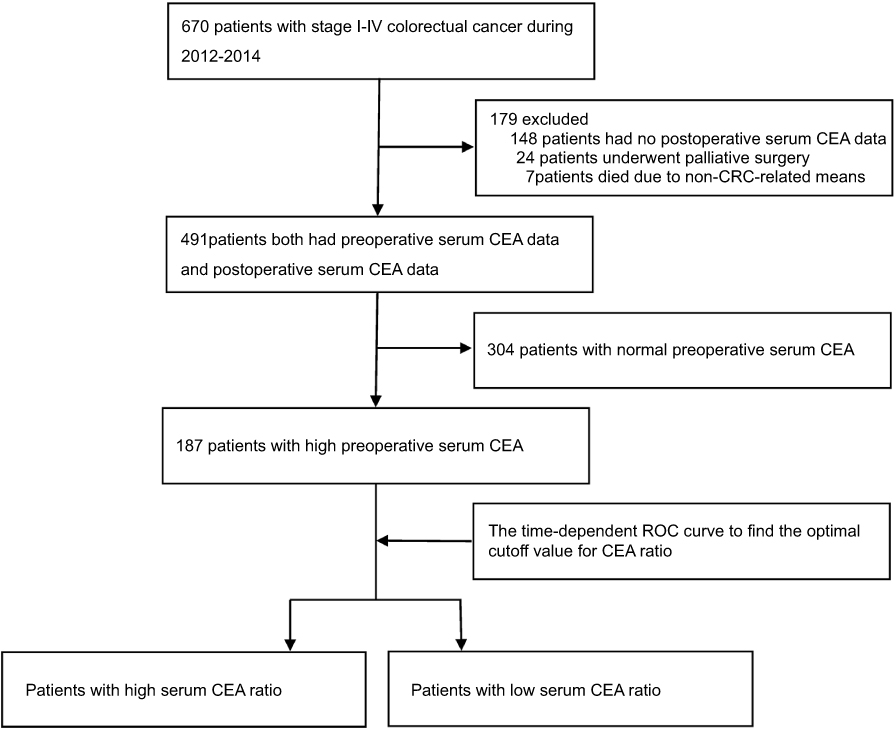 |
Figure 1 The process of case inclusion and exclusion in this study. |
A total of 74 female patients and 113 male patients were analyzed. The pathological diagnoses included 97 patients with rectum and 90 patients with colon. The tumor staging of the patients included 18 patients with TNM Stage I, 59 patients with TNM Stage II, 86 patients with TNM Stage III, and 24 patients with TNM Stage IV. The types of surgery were as follows: open operation in 97 patients, laparoscopic operation in 90 patients. Only 126 patients received postoperative chemoradiotherapy (Table 1).
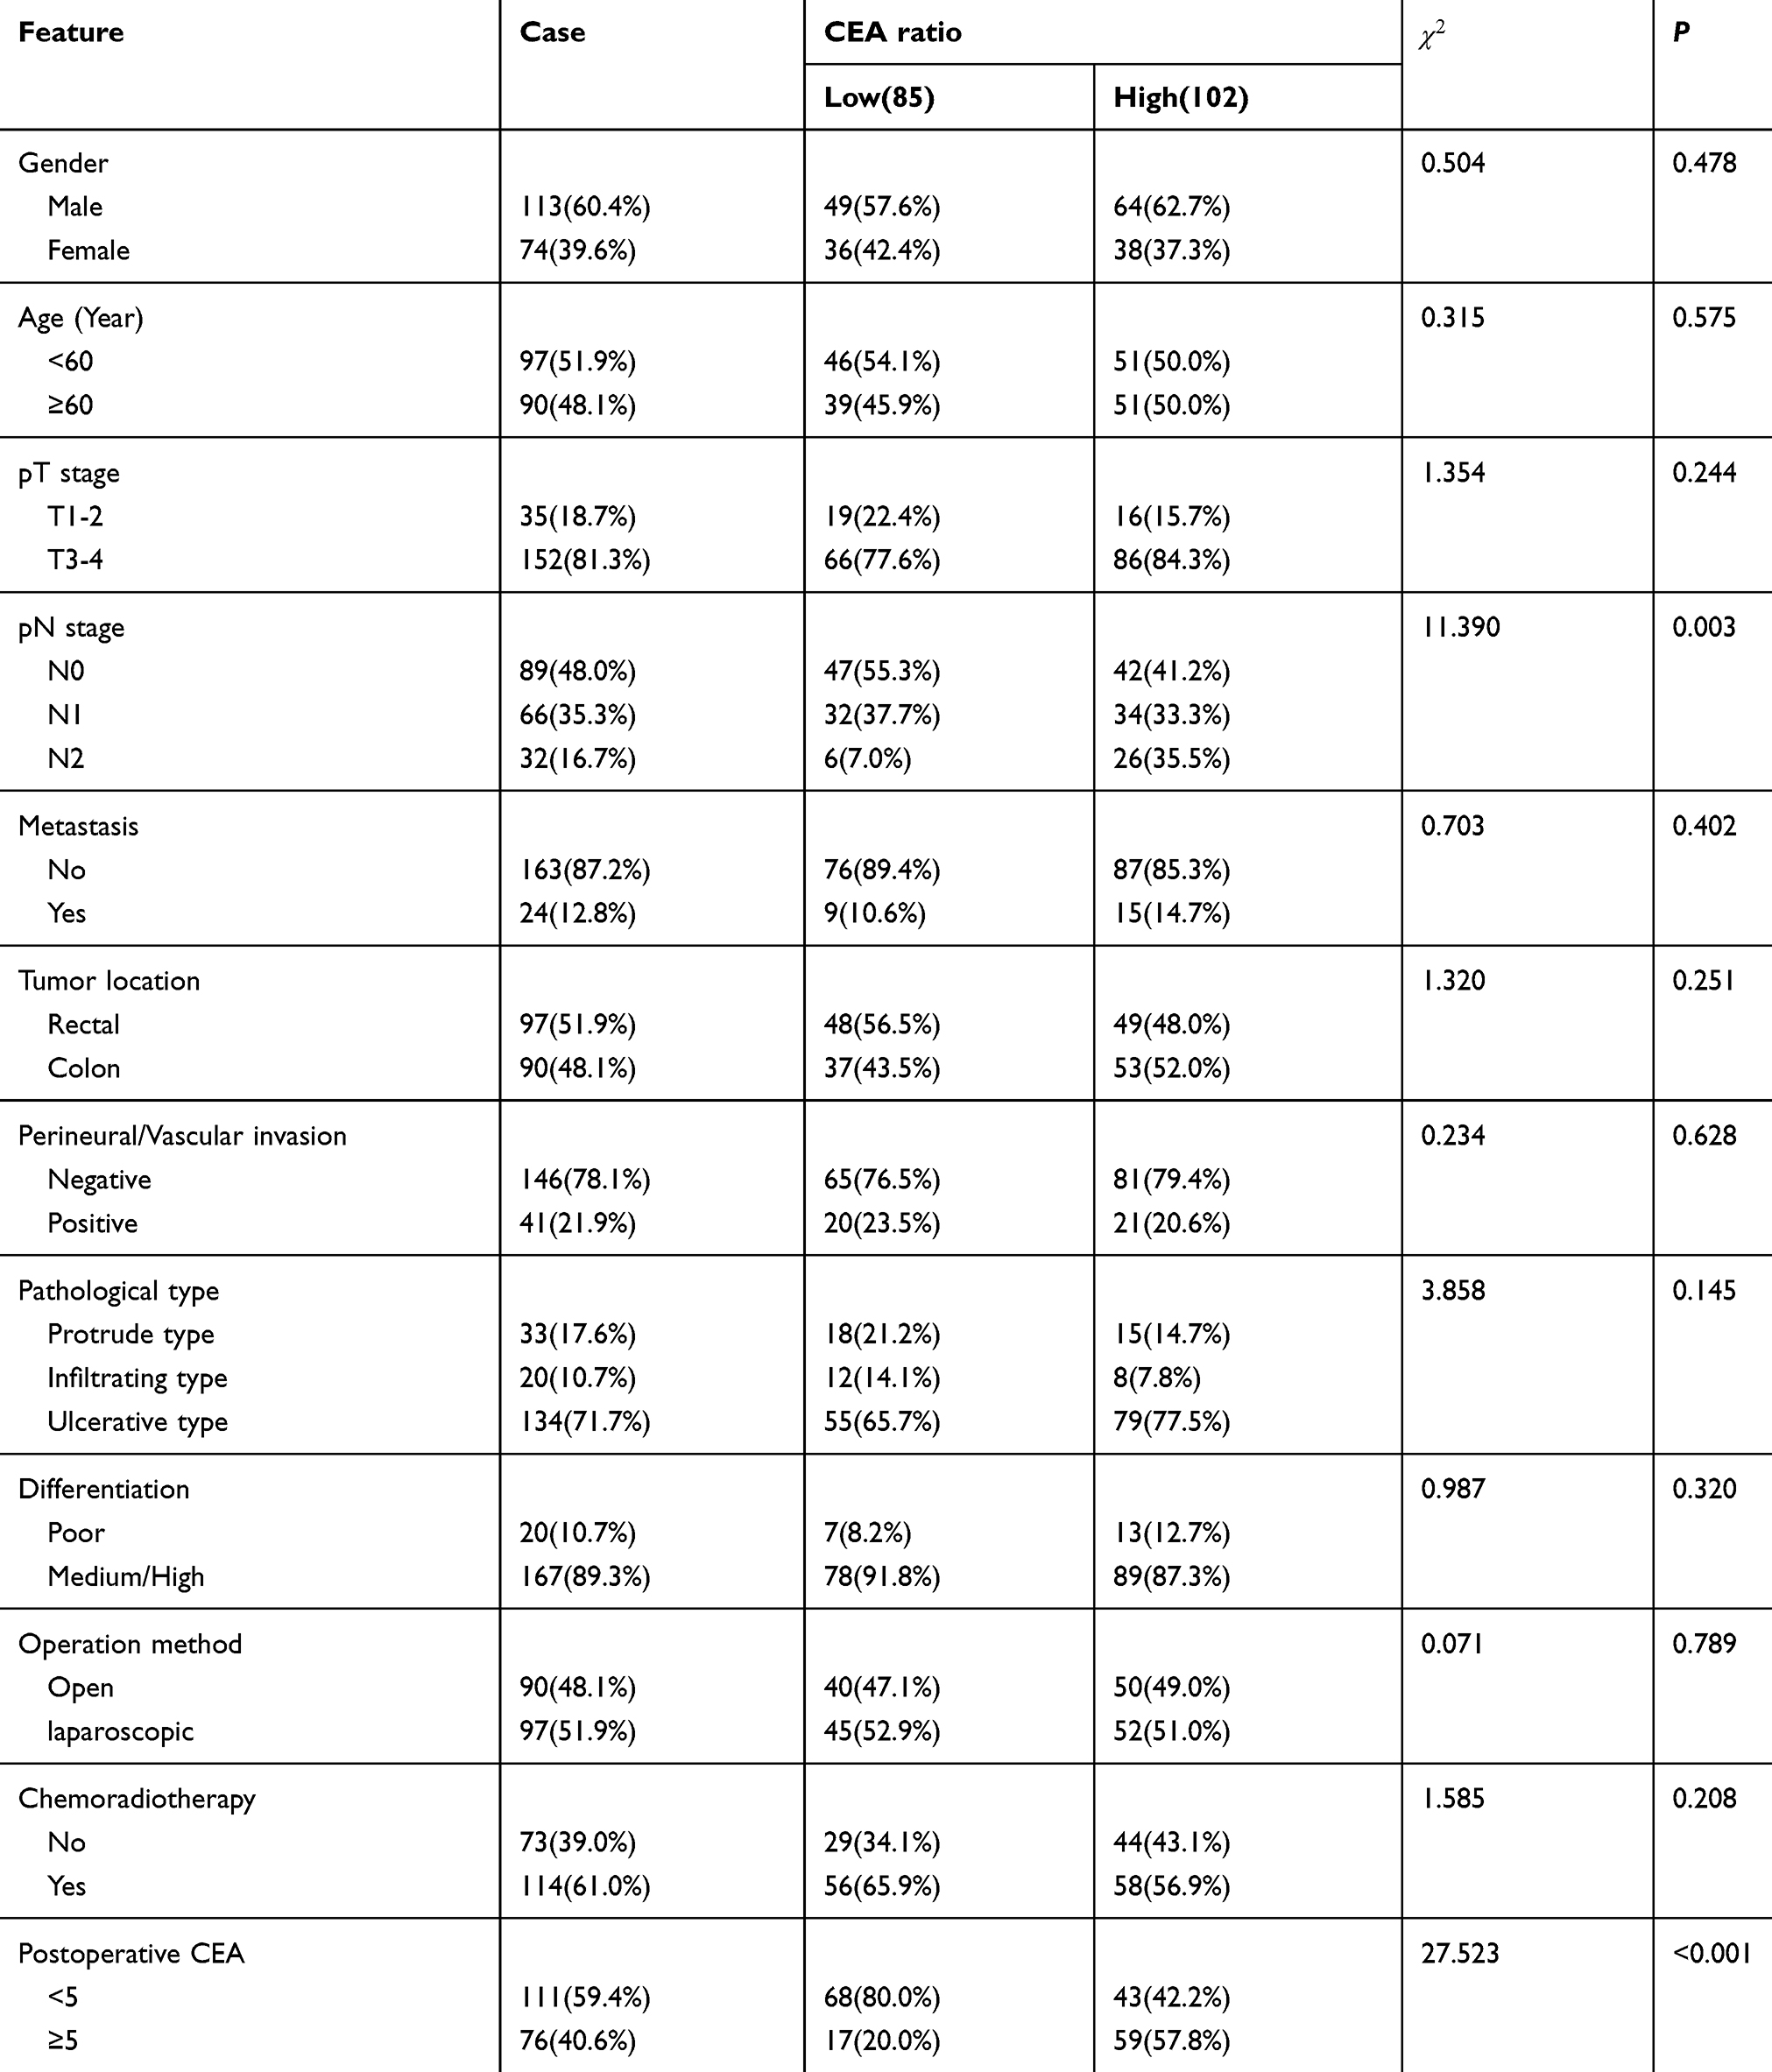 |
Table 1 Comparison of baseline clinicopathological characteristics based on CEA ratio |
Optimal cutoff value for CEA ratio associated with DFS
To determine the optimal CEA ratio cutoff value for predicting DFS, we imported the CEA ratios, survival conditions, and survival times into the Cutoff Finder website for time-dependent ROC curve analysis, the event for estimating the time-dependent ROC curve analysis is recurrence and metastasis or death. The AUC value was 0.68 and the optimal cutoff point for the CEA ratio was 0.295, with a sensitivity of 70.4%, a specificity of 56.6%, and an accuracy of 68.0% (Figure 2). CRC patients were then divided into high CEA ratio group and low CEA ratio group.
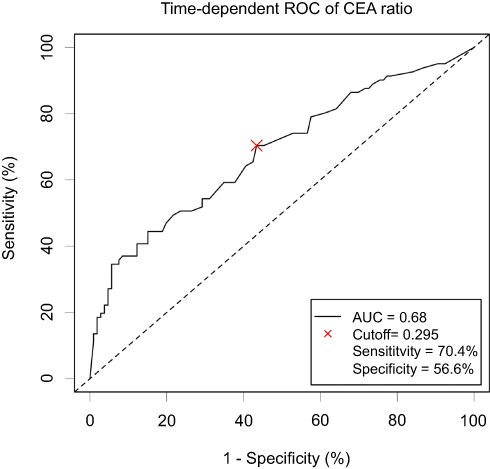 |
Figure 2 Time-dependent receiver operating characteristic (ROC) curve of CEA ratio in CRC patients with high preoperative serum CEA. |
The correlation between CEA ratio and clinicopathologic characteristics
The Chi-square test or Fisher’s exact test was used to test the correlation between the CEA ratio and Clinicopathologic characteristics, including gender, age, pT stage, pN stage, metastasis, tumor location, perineural/venous invasion, pathologic type, differentiation, operation method, postoperative chemoradiotherapy, and postoperative CEA level. The CEA ratio was related to pN stage (X2=11.390, P=0.003) and postoperative CEA (X2=27.523, p<0.001) (Table 1).
Univariate, multivariate, and subgroup analysis of the CEA ratio in CRC patients
In univariate analyses, pN stage (p<0.016), metastasis (p<0.001), perineural/vascular invasion (P=0.004), postoperative CEA level (p=0.001), and CEA ratio (p=0.001) were associated with DFS; pN stage (p<0.029), metastasis (p<0.001), perineural/vascular invasion (P=0.019), postoperative CEA level (p=0.001), and CEA ratio (p<0.001) were associated with CSS. In the multivariate analysis, pN stage (p=0.016), metastasis (p<0.001), and CEA ratio (p=0.003) were independent prognostic factors for DFS; pN stage (p=0.029), metastasis (p<0.001), and CEA ratio (p=0.003) were independent prognostic factors for CSS (Table 2). The analysis of 12 subgroups of DFS was identified statistical significance in the subgroups of male, age <60, T3–T4 stage, N0 stage, no metastasis, rectal cancer, positive and negative perineural/venous invasion, ulcerative type, poor and medium/high differentiation, laparoscopy operation, chemoradiotherapy, and normal postoperative CEA levels (Figure 3A). The analysis of 12 subgroups of CSS was identified statistical significance in the subgroups of male, age <60, T3–T4 stage, N0 stage, no metastasis, positive and negative perineural/venous invasion, ulcerative type, poor and medium/high differentiation, open and laparoscopy operation, chemoradiotherapy, and normal postoperative CEA levels (Figure 3B).
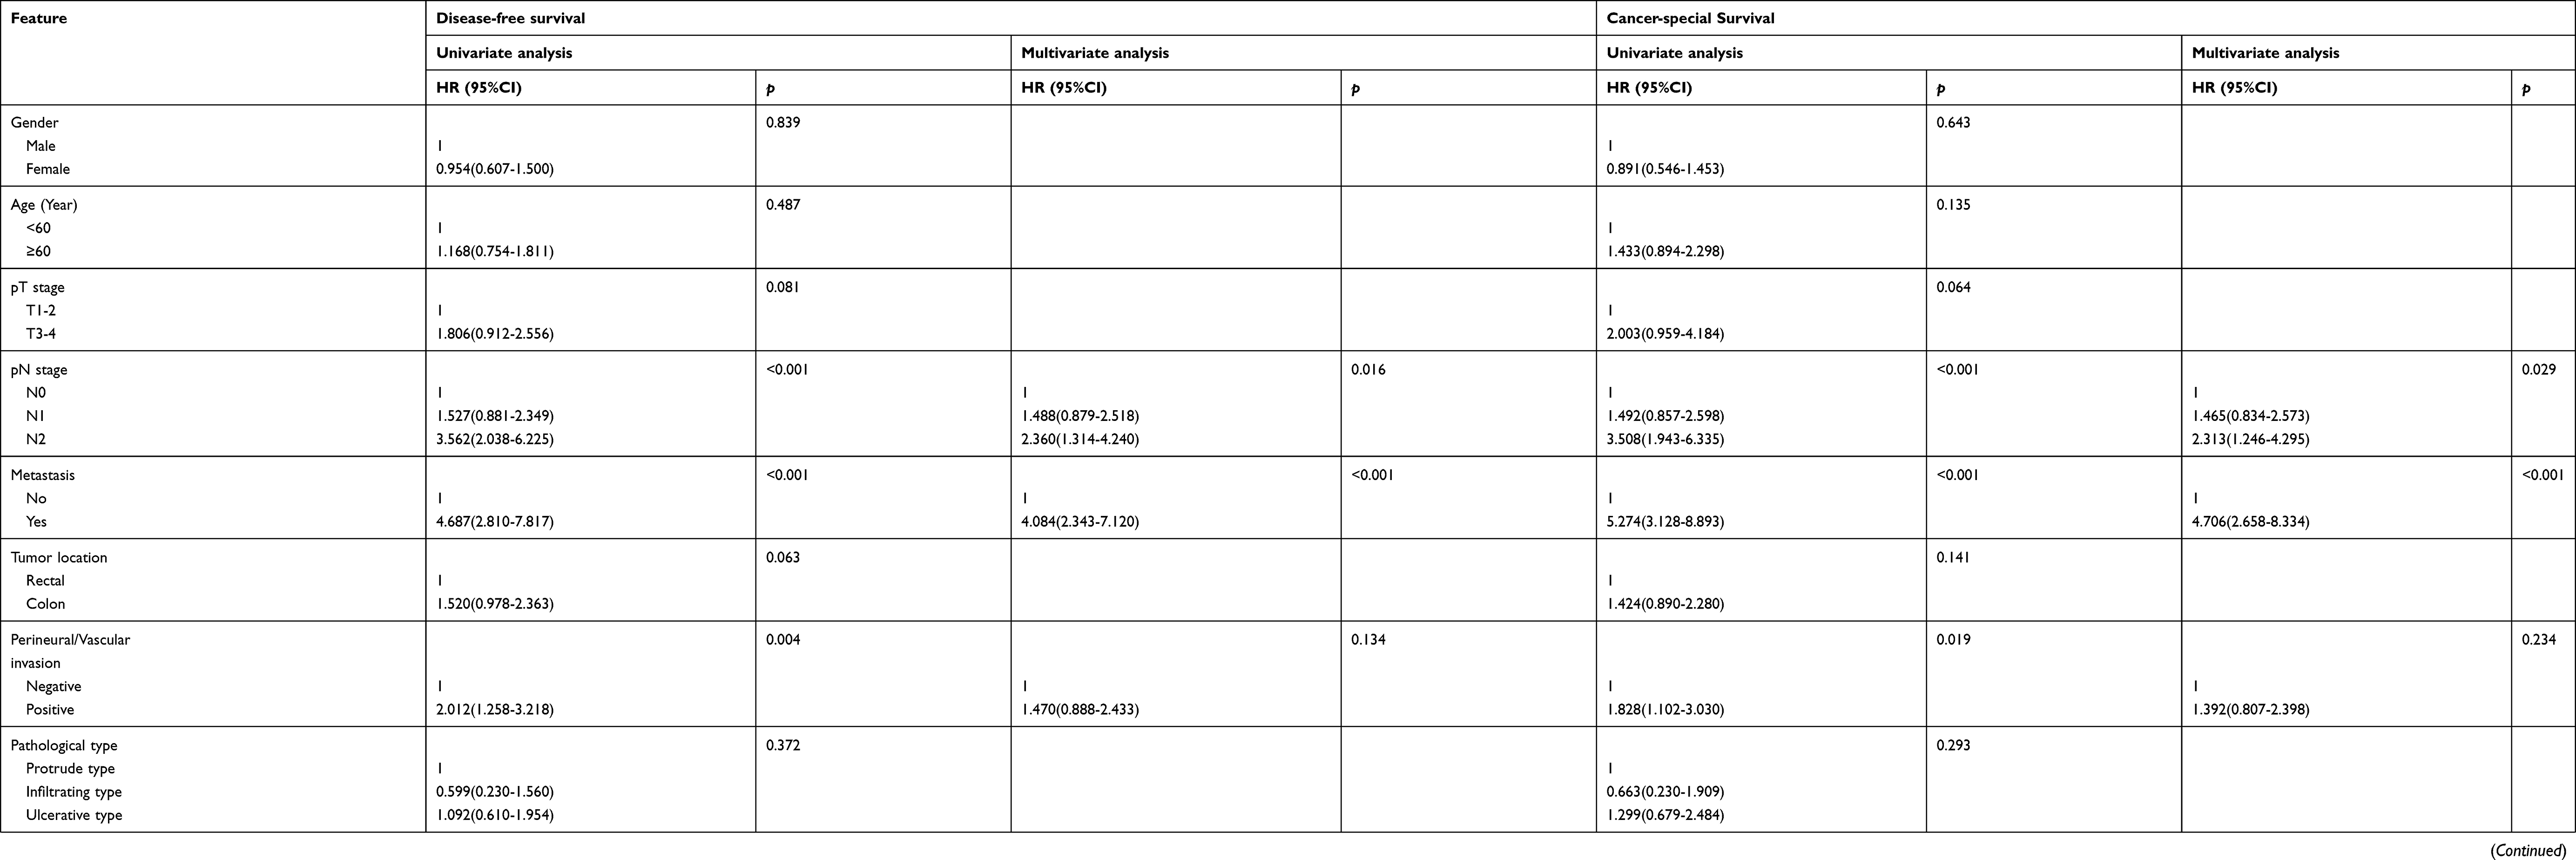 |
Table 2 Univariate and multivariate survival analyses of clinicopathological covariates in CRC patients |
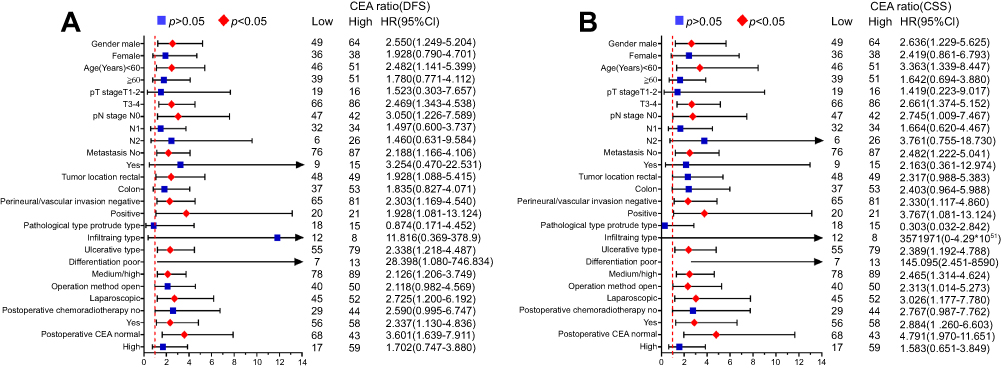 |
Figure 3 Subgroup multivariate analysis of CEA ratio on each baseline feature in DFS (A), CSS (B). Abbreviations: DFS, disease-free survival; CSS, cancer-special survival. |
Comparison of the CEA ratio to postoperative CEA level
A total of 76 (40.7%) patients had postoperative CEA level ≥5 ng/mL, of which only 44 patients had a poor prognosis, and prediction value of DFS is as follows: the sensitivity, the specificity, and the accuracy were 54.3% (44/81), 69.8% (74/106), and 63.1% (118/187), respectively. While the CEA ratio was used to judge the prognosis, the sensitivity, specificity, and accuracy could reach 70.4% (57/81), 57.5% (61/106), and 63.1% (118/187), respectively. We also compared the CEA ratio survival curves based on the postoperative CEA level and found that the CEA ratio influenced the DFS and CSS in the postoperative CEA level (<5 ng/mL) group (Figure 4A,C), but no in postoperative CEA level group (≥5 ng/mL) group (Figure 4B,D).
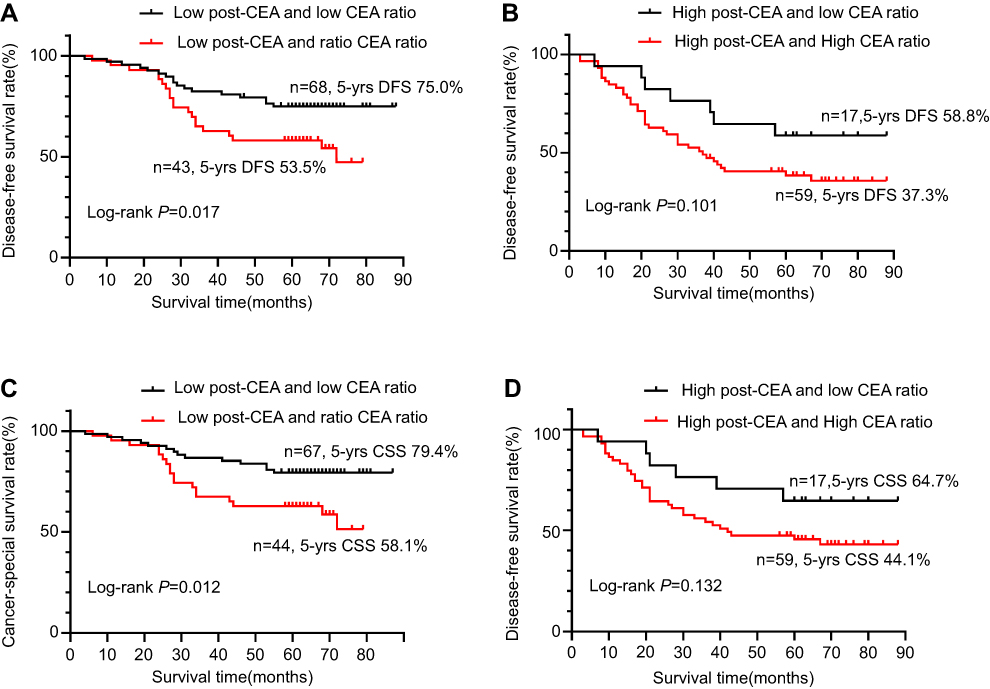 |
Figure 4 Comparison of the CEA ratio survival curves based on postoperative CEA level. Notes: (A) Kaplan–Meier curves of DFS in low postoperative CEA level patients. (B) Kaplan–Meier curves of DFS in high postoperative CEA level patients. (C) Kaplan–Meier curves of CSS in low postoperative CEA level patients. (D) Kaplan–Meier curves of CSS in high postoperative CEA level patients.Abbreviations: DFS, disease-free survival; CSS, cancer-special survival. |
Kaplan–Meier curve for the CEA ratio in each TNM stage
In the TNM I stage and TNM IV stage, no significant difference in survival curve was observed (no show). In the TNM II stage, patients with a high CEA ratio had significantly poorer DFS (p=0.012), compared to patients with low CEA ratio, the survival rates among patients with high or low CEA ratio were 57.7% and 84.8%, respectively (Figure 5A); while patients with a high CEA ratio had not significantly poorer CSS (p=0.054), compared to patients with low CEA ratio, the survival rates among patients with high or low CEA ratio were 65.4% and 84.8%, respectively (Figure 5D). In the TNM III stage, high CEA ratio patients also had significantly poorer DFS (p=0.014) and CSS (p=0.011), compared to patients with low CEA ratio, the survival rates among those patients with high or low CEA ratio were 41.8%, 49.1% and 67.7%, 77.4%, respectively (Figure 5B,E). Among all TNM stages, high CEA ratio patients had significantly poorer DFS (p<0.001) and CSS (p<0.001) than low CEA ratio patients, the survival rates of patients with high or low CEA ratio were 44.1%, 50.0% and 71.8%, 76.5%, respectively (Figure 5C,F).
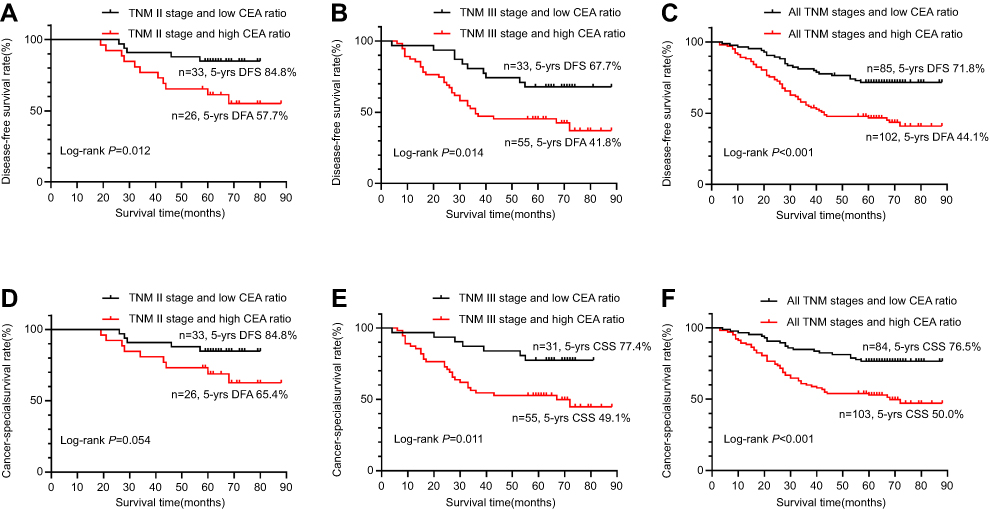 |
Figure 5 Comparisons of Kaplan–Meier curves of DFS and CSS between two groups (High CEA ratio; Low CEA ratio) in each TNM stage. Notes: (A) Kaplan–Meier curves of DFS in TNM II stage patients. (B) Kaplan–Meier curves of DFS in TNM III stage patients. (C) Kaplan–Meier curves of DFS in all TNM stages patients. (D) Kaplan–Meier curves of CSS in TNM II stage patients. (E) Kaplan–Meier curves of CSS in TNM III stage patients. (F) Kaplan–Meier curves of CSS in all TNM stage patients.Abbreviations: DFS, disease-free survival; CSS, cancer-special survival. |
Comparison of the optimal CEA ratio cutoff value
To determine the optimal CEA ratio cutoff value for the prognosis of CRC patients with high preoperative serum CEA levels, we assessed cutoff values of 0.1, 0.295, 0.5, and 1. Those cutoffs were compared for their sensitivities, specificities, and accuracies. We found that a cutoff value of 0.1 had the highest sensitivity, but low specificity and accuracy. Cutoff values of 0.5 and 1 had high specificities and accuracies, but low sensitivities. Thus, a cutoff of 0.295 was also assessed and exhibited high sensitivity, specificity, and accuracy. Furthermore, we compared the effects of different cutoff values on survival curve at each TNM stage. We found that a cutoff value of 0.1 failed to reach statistical significance in any stage. The cutoff value of 0.5 was significant in stage II of DFS and was significant in stage II and stage III of CSS. The cutoff value of 1 was significant in Stages III of DFS and CSS (Table 3).
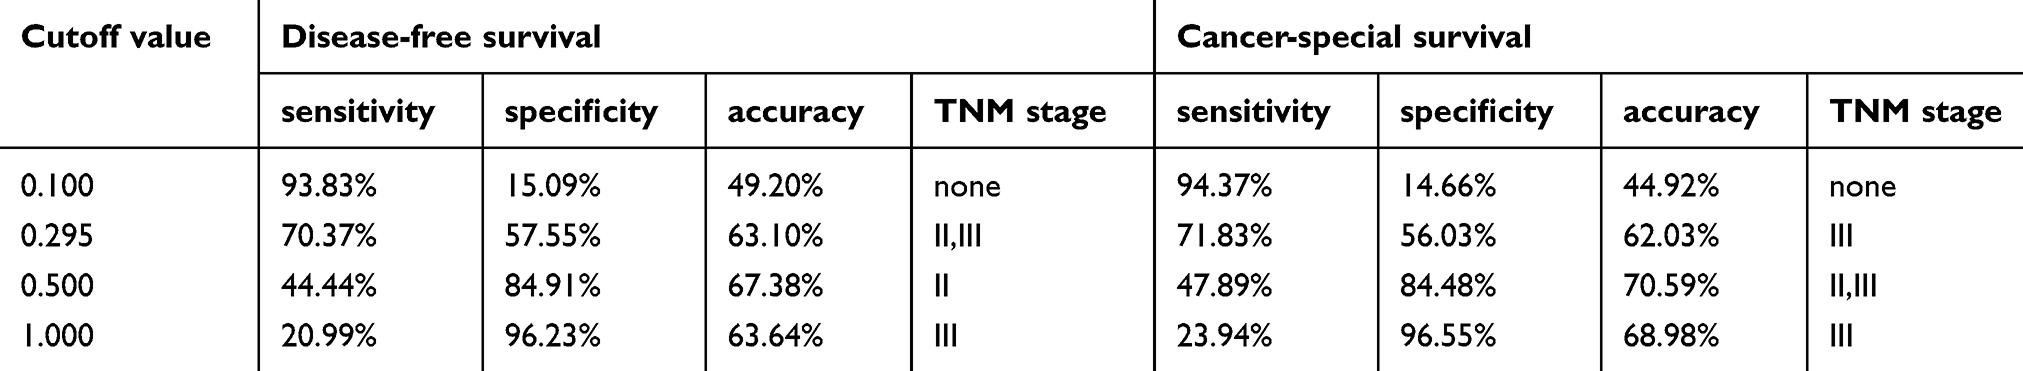 |
Table 3 Comparison of cutoff values of CEA ratio |
Development of the nomogram
Two nomograms were employed to evaluate the relationship between CEA ratio and medical rank in CRC (Figure 6). After adjustment with the Cox proportional hazards model, only CEA ratio, N stage, and metastasis were entered the risk model. The points against each factor could be counted, and the DFS and CSS of 1–5 years can also be predicted.
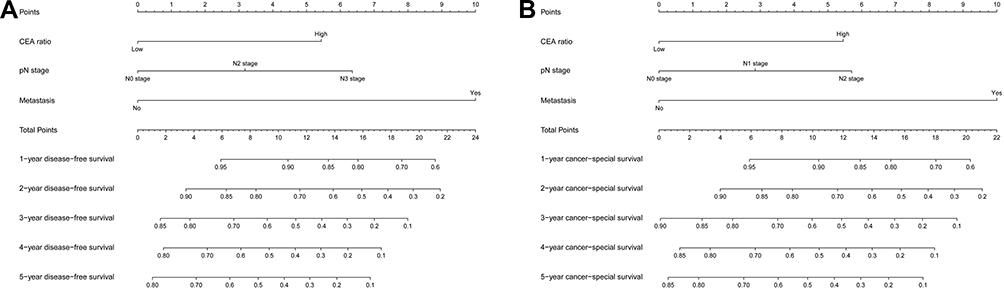 |
Figure 6 Development of the nomogram.Notes: The nomogram can provide individual patients with a probability of 1–5 years disease-free survival (A) and cancer-special survival (B) based on the sum of the scores for each variable predicted at the bottom scale.Abbreviations: DFS, disease-free survival; CSS, cancer-special survival. |
Discussion
The serum CEA level is one of the most commonly used serum tests to evaluate the prognosis of CRC patients.6 However, serum CEA is not specific to the diagnosis of colorectal tumors. Only about 40–50% of the CRC patients have positive serum CEA levels before surgery.20–22 In addition, the CEA levels of patients with long-term smoking habits, cardiovascular disease, gynecological disease, and other diseases are also frequently elevated.23,24 Thus, the base level of preoperative CEA secreted by each CRC patient is different and not all patients with high preoperative CEA levels have a poor prognosis. To further reflect the prognosis of patients with high preoperative CEA levels, we introduced the CEA ratio factor because it covers preoperative and postoperative serum CEA levels. Thus, the difference in individual CEA concentrations can be corrected. We also studied the prognostic value of the CEA ratio in normal preoperative CEA patients but found that CEA ratio was only applicable to high preoperative CEA patients, which is consistent with previous research.25 This finding may be due to the fact that not all colorectal tumors secrete high levels of CEA, and may also secrete other tumor markers such as CA199, CA724, CA125. High preoperative CEA CRC can be considered as a high-CEA secretion type, of which the changes in CEA level can reflect the degree of residual tumor cells in the body. If the surgical removal of the tumor is complete, there is no source of CEA production and the CEA ratio decreases with its metabolic clearance rate. However, if residual tumor cells remain following surgery, the CEA ratio will not normalize.26–28 For normal preoperative CEA patients, the ratio of other tumor markers may be more accurate than the CEA ratio.
Multiple previous studies demonstrated that preoperative and postoperative CEA levels influence predictions of the prognosis of CRC patients following surgery. However, the independent risk factors for prognosis remain controversial.8–12,29–31 In this study, we found that the CEA ratio and postoperative CEA levels were both associated with prognosis; however, only the CEA ratio was an independent prognostic factor for DFS and CSS. We believe that the CEA ratio can dynamically show CEA changes in patients undergoing surgery and demonstrate disease prognosis more accurately than preoperative and postoperative serum CEA levels. We also compared the CEA ratio to postoperative CEA levels in CRC patients with high preoperative CEA levels. In 40.6% of the patients, postoperative CEA levels did not return to normal, which was mainly observed in late tumor stages. In 59.4% of the patients, postoperative CEA levels decreased to normal, which was mainly observed in early tumor stages. The CEA ratio could improve predictive prognosis efficiency than postoperative CEA levels in terms of sensitivity, specificity, and accuracy. We further found that CEA ratio also can be used as a prognostic indicator for patients with normal postoperative CEA by Kaplan–Meier survival curve and subgroup multivariate analysis. Although monitoring postoperative CEA levels can aid prognosis to some extent, the CEA ratio can furtherly find some poor prognosis patients whose postoperative CEA levels had been decreased to normal.
Studies calculated the CEA half-life at 3–7 days.27,32–34 It is generally thought that tumor markers in blood require more than 5–6 half-lives before they are eliminated, and thus, if surgical resection is successful, high levels of CEA should return to normal within 2–4 weeks after surgery.16,35 Therefore, peripheral blood samples for postoperative serum CEA assessments were obtained on or after the 30th day following surgery in this study.
TNM stage is considered to be the best predictor of prognosis in CRC, but prognosis at the same stage is often different, suggesting that different factors must be assessed to predict prognosis.36 We compared the survival curves of CEA ratios at each TNM stage. High CEA ratio patients demonstrated significantly poorer prognosis in the TNM II Stage, TNM III Stage, and all TNM Stage. Those results suggest that the CEA ratio can be used as a supplement to TNM stage.
Although there is no recognized optimal critical value for the CEA ratio, Beastall et al hypothesized that compared to the level of tumor markers before treatment, >50% was ineffective, 10–50% was improved, and <10% was effective. Reductions to the reference range were considered significant.37 However, recent studies also suggested that the optimal cutoff value for the CEA ratio was 0.5 or 1 for the prognosis of postoperative patients with CRC.7,16 In this study, we assessed the CEA ratio cutoffs of 0.1, 0.352, 0.5, and 1. Those values were compared for their sensitivities, specificities, and accuracies. The higher cutoff points such as 0.5 and 1 have higher specificity and accuracy, but lower sensitivity, and the lower cutoff points such as 0.1 have higher sensitivity, but lower specificity and accuracy, while the cutoff points of 0.295 have a more appropriate sensitivity, specificity, and accuracy. In comparing the survival curves of different cutoff values at each TNM stage, we found using the lower cutoff points such as 0.295, 0.5 may predict the prognosis of early stage cancer.
We also constructed two nomograms, showing that the contribution of T stage and metastasis was increased with advancing stage, and the CEA ratio also contributes significantly to the time-dependent survival percentage. Comparing these risk-related factors, the effects of N stage and metastasis are greater than the CEA ratio. By applying this model, we could forecast the time-related survival percentage. Patients with lower total number of points have a much better survival rate than those with higher total number of points.
There are several limitations in our research. This retrospective study is a single cohort study that is based on the limited data available now. Therefore, it is necessary to expand the sample from self-validation in the future or further validate our point of view through horizontal multi-center data.
Conclusion
The CEA ratio is a simple and useful tool for further forecasting prognosis of CRC patients with high preoperative CEA levels and may help develop strategies for the postoperative treatment of CRC patients.
Ethics statement
The study protocol was conducted in accordance with the Declaration of Helsinki and was approved by the Hospital Ethics Committee of the First Affiliated Hospital of Guangxi Medical University, Guangxi, China - approval number: 2019(KY-E-022). All patients signed informed consent for collection and analysis of biological specimens.
Disclosure
The authors report no conflicts of interest in this work.
References
1. Bray F, Ferlay J, Soerjomataram I, Siegel RL, Torre LA, Jemal A. Global cancer statistics 2018: GLOBOCAN estimates of incidence and mortality worldwide for 36 cancers in 185 countries. CA Cancer J Clin. 2018;68(6):394–424. doi:10.3322/caac.21492
2. Chen W, Zheng R, Baade PD, et al. Cancer statistics in China, 2015. CA Cancer J Clin. 2016;66(2):115–132. doi:10.3322/caac.21338
3. Siegel R, DeSantis C, Jemal A. Colorectal cancer statistics, 2014. CA Cancer J Clin. 2014;64(2):104–117. doi:10.3322/caac.21220
4. Benson AB, Venook AP, Al-Hawary MM, et al. NCCN guidelines insights: colon cancer, version 2.2018. J Natl Compr Canc Netw. 2018;16(4):359–369. doi:10.6004/jnccn.2018.0021
5. Siegel R, DeSantis C, Virgo K, et al. Cancer treatment and survivorship statistics, 2012. CA Cancer J Clin. 2012;62(4):220–241. doi:10.3322/caac.21149
6. Lin J-K, Lin -C-C, Yang S-H, et al. Early postoperative CEA level is a better prognostic indicator than is preoperative CEA level in predicting prognosis of patients with curable colorectal cancer. Int J Colorectal Dis. 2011;26(9):1135–1141. doi:10.1007/s00384-011-1209-5
7. Hotta T, Takifuji K, Yokoyama S, et al. Impact of the post/preoperative serum CEA ratio on the survival of patients with rectal cancer. Surg Today. 2014;44(11):2106–2115. doi:10.1007/s00595-014-0852-1
8. Lalosevic MS, Stankovic S, Stojkovic M, et al. Can preoperative CEA and CA19-9 serum concentrations suggest metastatic disease in colorectal cancer patients? Hell J Nucl Med. 2017;20:41–45. doi:10.1967/s002449910505
9. Becerra AZ, Probst CP, Tejani MA, et al. Evaluating the prognostic role of elevated preoperative carcinoembryonic antigen levels in colon cancer patients: results from the national cancer database. Ann Surg Oncol. 2016;23(5):1554–1561. doi:10.1245/s10434-015-5014-1
10. Kim CG, Ahn JB, Jung M, et al. Preoperative serum carcinoembryonic antigen level as a prognostic factor for recurrence and survival after curative resection followed by adjuvant chemotherapy in stage III colon cancer. Ann Surg Oncol. 2017;24(1):227–235. doi:10.1245/s10434-016-5613-5
11. Borda A, Prieto C, Jiménez J, Vila J, Zozaya JM, Borda F. Valor pronóstico pretratamiento del antígeno carcinoembrionario en el cáncer colorrectal operado. ¿Es útil en todos los estadios del tumor? Gastroenterología y Hepatología. 2016;39(3):191–198. doi:10.1016/j.gastrohep.2015.05.002
12. Giessen-Jung C, Nagel D, Glas M, et al. Preoperative serum markers for individual patient prognosis in stage I-III colon cancer. Tumour Biol. 2015;36(10):7897–7906. doi:10.1007/s13277-015-3522-z
13. Konishi T, Shimada Y, Hsu M, et al. Association of preoperative and postoperative serum carcinoembryonic antigen and colon cancer outcome. JAMA Oncol. 2018;4(3):309–315. doi:10.1001/jamaoncol.2017.4420
14. Kim JY, Kim NK, Sohn SK, et al. Prognostic value of postoperative CEA clearance in rectal cancer patients with high preoperative CEA levels. Ann Surg Oncol. 2009;16(10):2771–2778. doi:10.1245/s10434-009-0651-x
15. Tsai HL, Huang CW, Chen CW, Yeh YS, Ma CJ, Wang JY. Survival in resected stage II colorectal cancer is dependent on tumor depth, vascular invasion, postoperative CEA level, and the number of examined lymph nodes. World J Surg. 2016;40(4):1002–1009. doi:10.1007/s00268-015-3331-y
16. Woo J, Kim J, Park I, et al. Perioperative serum carcinoembryonic antigen ratio is a prognostic indicator in patients with stage II colorectal cancer. Ann Coloproctol. 2018;34(1):4–10. doi:10.3393/ac.2018.34.1.4
17. Sun Z, Wang F, Zhou Q, et al. Pre-operative to post-operative serum carcinoembryonic antigen ratio is a prognostic indicator in colorectal cancer. Oncotarget. 2017;8(33):54672.
18. Akobeng AK. Understanding diagnostic tests 3: receiver operating characteristic curves. Acta Paediatr. 2007;96(5):644–647. doi:10.1111/j.1651-2227.2006.00178.x
19. Budczies J, Klauschen F, Sinn BV, et al. Cutoff finder: a comprehensive and straightforward web application enabling rapid biomarker cutoff optimization. PLoS One. 2012;7(12):e51862. doi:10.1371/journal.pone.0051862
20. Huang E-Y, Chang J-C, Chen H-H, Hsu C-Y, Hsu H-C, Wu K-L. Carcinoembryonic antigen as a marker of radioresistance in colorectal cancer: a potential role of macrophages. BMC Cancer. 2018;18(1):321. doi:10.1186/s12885-018-4242-8
21. Chen T, Yu L, Li B, et al. Elevated preoperative carcinoembryonic antigen and vascular endothelial growth factor predict shorter survival in patients with sigmoid colon carcinoma. Clin Lab. 2017;63(3):445–451. doi:10.7754/Clin.Lab.2016.160720
22. Huang S-C, Huang S-F, Chen Y-T, et al. Overexpression of MutL homolog 1 and MutS homolog 2 proteins have reversed prognostic implications for stage Iق│ôII colon cancer patients. Biomed J. 2017;40(1):39–48. doi:10.1016/j.bj.2017.01.004
23. Liska V, Treska V, Skalicky T, et al. Evaluation of tumor markers and their impact on prognosis in gallbladder, bile duct and cholangiocellular carcinomasق│ôA pilot study. Anticancer Res. 2017;37(4):2003–2009. doi:10.21873/anticanres.11544
24. Qiao Y-F, Chen C-G, Yue J, Ma M-Q, Ma Z, Yu Z-T. Prognostic significance of preoperative and postoperative CK19 and CEA mRNA levels in peripheral blood of patients with gastric cardia cancer. World J Gastroenterol. 2017;23(8):1424. doi:10.3748/wjg.v23.i8.1424
25. Lee WS, Baek JH, Kim KK, Park YH. The prognostic significant of percentage drop in serum CEA post curative resection for colon cancer. Surg Oncol. 2012;21(1):45–51. doi:10.1016/j.suronc.2010.10.003
26. Tomita M, Ayabe T, Chosa E, Nakamura K. Postoperative serum CEA level is a more significant prognostic factor than post/preoperative serum CEA ratio in non-small cell cancer patients. Asian Pac J Cancer Prev. 2015;16(17):7809–7812. doi:10.7314/apjcp.2015.16.17.7809
27. Park YA, Lee KY, Kim NK, Baik SH, Sohn SK, Cho CW. Prognostic effect of perioperative change of serum carcinoembryonic antigen level: a useful tool for detection of systemic recurrence in rectal cancer. Ann Surg Oncol. 2006;13(5):645–650. doi:10.1245/ASO.2006.03.090
28. Wang JY, Lu CY, Chu KS, et al. Prognostic significance of pre- and postoperative serum carcinoembryonic antigen levels in patients with colorectal cancer. Eur Surg Res. 2007;39(4):245–250. doi:10.1159/000101952
29. Jeong S, Nam TK, Jeong JU, et al. Postoperative carcinoembryonic antigen level has a prognostic value for distant metastasis and survival in rectal cancer patients who receive preoperative chemoradiotherapy and curative surgery: a retrospective multi-institutional analysis. Clin Exp Metastasis. 2016;33(8):809–816. doi:10.1007/s10585-016-9818-6
30. Bhatti I, Patel M, Dennison AR, Thomas MW, Garcea G. Utility of postoperative CEA for surveillance of recurrence after resection of primary colorectal cancer. Int J Surg. 2015;16:123–128. doi:10.1016/j.ijsu.2015.03.002
31. Araujo RLC, Gönen M, Allen P, et al. Positive postoperative CEA is a strong predictor of recurrence for patients after resection for colorectal liver metastases. Ann Surg Oncol. 2015;22(9):3087–3093. doi:10.1245/s10434-014-4358-2
32. Yakabe T, Nakafusa Y, Sumi K, et al. Clinical significance of CEA and CA19-9 in postoperative follow-up of colorectal cancer. Ann Surg Oncol. 2010;17(9):2349–2356. doi:10.1245/s10434-010-1004-5
33. Ito K, Hibi K, Ando H, et al. Usefulness of analytical CEA doubling time and half-life time for overlooked synchronous metastases in colorectal carcinoma. Jpn J Clin Oncol. 2002;32(2):54–58. doi:10.1093/jjco/hyf011
34. Choi JS, Min JS. Significance of postoperative serum level of carcinoembryonic antigen (CEA) and actual half life of CEA in colorectal cancer patients. Yonsei Med J. 1997;38(1):1–7. doi:10.3349/ymj.1997.38.1.1
35. Rapellino M, Piantino P, Pecchio F, et al. Disappearance curves of tumor markers after radical surgery. Int J Biol Markers. 1994;9(1):33–37.
36. Lea D, Håland S, Hagland HR, Søreide K. Accuracy of TNM staging in colorectal cancer: a review of current culprits, the modern role of morphology and stepping-stones for improvements in the molecular era. Scand J Gastroenterol. 2014;49(10):1153–1163. doi:10.3109/00365521.2014.950692
37. Beastall G, Cook B, Rustin G, Jennings J. A review of the role of established tumour markers. Ann Clin Biochem. 1991;28(1):5–18. doi:10.1177/000456329102800102
 © 2019 The Author(s). This work is published and licensed by Dove Medical Press Limited. The full terms of this license are available at https://www.dovepress.com/terms.php and incorporate the Creative Commons Attribution - Non Commercial (unported, v3.0) License.
By accessing the work you hereby accept the Terms. Non-commercial uses of the work are permitted without any further permission from Dove Medical Press Limited, provided the work is properly attributed. For permission for commercial use of this work, please see paragraphs 4.2 and 5 of our Terms.
© 2019 The Author(s). This work is published and licensed by Dove Medical Press Limited. The full terms of this license are available at https://www.dovepress.com/terms.php and incorporate the Creative Commons Attribution - Non Commercial (unported, v3.0) License.
By accessing the work you hereby accept the Terms. Non-commercial uses of the work are permitted without any further permission from Dove Medical Press Limited, provided the work is properly attributed. For permission for commercial use of this work, please see paragraphs 4.2 and 5 of our Terms.