")
Back to Journals » Cancer Management and Research » Volume 11
The Prognostic Value Of Lymph Node Ratio In Patients With N2 Stage Lung Squamous Cell Carcinoma: A Nomogram And Heat Map Approach
Authors Bi G , Lu T , Yao G, Bian Y, Zhao M, Huang Y, Zhang Y, Xue L, Zhan C , Fan H
Received 21 May 2019
Accepted for publication 28 September 2019
Published 6 November 2019 Volume 2019:11 Pages 9427—9437
DOI https://doi.org/10.2147/CMAR.S216532
Checked for plagiarism Yes
Review by Single anonymous peer review
Peer reviewer comments 2
Editor who approved publication: Dr Antonella D'Anneo
Guoshu Bi,* Tao Lu,* Guangyu Yao, Yunyi Bian, Mengnan Zhao, Yiwei Huang, Yi Zhang, Liang Xue, Cheng Zhan, Hong Fan
Department of Thoracic Surgery, Zhongshan Hospital, Fudan University, Shanghai 200032, People’s Republic of China
*These authors contributed equally to this work
Correspondence: Hong Fan; Cheng Zhan
Zhongshan Hospital, No. 180 Fenglin Road, Xuhui District, Shanghai 200032, People’s Republic of China
Tel +86 139 1689 7139
Fax +86 21 6404 1990 Ext 2915
Email [email protected]; [email protected]
Background: Lymph node ratio (LNR), defined as the ratio of the number of positive lymph nodes to the total of all resected nodes, has been reported to be a predictor of survival of patients with several types of cancer. However, the prognostic value of LNR and other factors in patients with resected N2 stage lung squamous cell carcinoma has never been considered.
Methods: Data from 1778 patients with resected N2 stage lung squamous cell carcinoma were obtained from the Surveillance, Epidemiology, and End Results (SEER) database. The optimal cutoff value of LNR was identified by X-tile. A multivariable Cox model and corresponding nomogram were constructed to predict overall survival (OS) and cancer-specific survival (CSS). Both the cutoff value of LNR and the model were further validated in 146 similar patients treated in Zhongshan Hospital. Heat maps were created to visualize the distribution of LNR and the number of positive lymph nodes with the predicted survival probabilities.
Results: The optimal cutoff value for LNR was identified as 0.42. Multivariable analysis showed that age, sex, tumor laterality, type of surgery, T stage, chemotherapy and LNR were independently correlated with OS. Harrell’s C-index of the nomogram (0.64) was significantly higher than the index of the T stage-based model (0.54). Calibration curves showed good agreement between predicted and observed survival probabilities. The robustness of the model was also demonstrated by external validation.
Conclusion: LNR less than 0.42 was associated with improved OS and CSS for patients with resected N2 stage lung squamous cell carcinoma.
Keywords: lymph node ratio, N2 stage lung squamous cell carcinoma, prognostic model, nomogram, heatmap
Introduction
Lung cancer is the most common cancer worldwide and the leading cause of cancer death in men and women (18.4% of the total cancer deaths), accounting for an estimated 2,093,876 new cases (11.6% of the total cases) in 2015 alone.1 Following adenocarcinoma, lung squamous cell carcinoma is currently the second most common subtype of lung cancer.2 A great number of non-small cell lung cancer (NSCLC) patients were diagnosed after the malignancies had metastasized to lymph nodes. Meanwhile, the benefit of postoperative radiotherapy among patients at different N stages remains controversial. A previous meta-analysis suggested a detrimental effect of postoperative radiotherapy.3 However, this study was conducted about 3 decades ago, and the conclusion of which was felt to be related to the cardiac and pulmonary toxicity from the radiotherapy (RT) itself. In light of the significant advances in radiotherapy delivery over the last several decades, several studies have suggested that patients with N2 disease might benefit from postoperative radiotherapy.4,5 Relevant randomized controlled trials are still ongoing.6 To identify the patients with N2 NSCLC who might benefit from postoperative radiotherapy, several model for nodal assessment have been proposed to predict the survival outcome including overall survival (OS) and cancer-specific survival (CSS) of whom. These models have incorporated the number of positive lymph nodes,7 N stages, lymph node ratio and log odds of positive lymph node ratio (LODDS, calculated as log(number of positive lymph nodes+0.5)/(number of negative lymph nodes+0.5)).8 Lymph node ratio (LNR), defined as the ratio of the number of positive lymph nodes to the total number of resected nodes, has been reported to be an independent factor associated with the prognosis of NSCLC or lung adenocarcinoma alone,9–13 but few studies have been published focusing on its prognostic value in lung squamous cell carcinoma, the second common subtype of NSCLC following lung adenocarcinoma. Therefore, we sought to identify the potential prognostic value of LNR in combination with several other demographic and clinicopathological factors in N2 lung squamous cell carcinoma resection patients. A nomogram and heat maps were established and validated in our study.
Methods
Patients
This study was approved by the Ethics Committee of Zhongshan Hospital, Fudan University, China (B2019–082). For the external validation cohort, the requirement for written informed consent was waived by the Ethics Committee for this retrospective study because of its retrospective nature. Patients included in this study were assigned to training cohorts and validation cohorts according to the source of data. The data of patients in training cohorts were retrieved from the Surveillance, Epidemiology, and End Results (SEER) public database. SEER data (Incidence—SEER 18 Regs Custom Data with additional treatment fields, Nov 2018 Sub, 1975—2016 varying) were obtained via SEER*Stat software (version 8.4.5; http://seer. cancer.gov/seerstat/). The diagnosis of lung cancer was defined by the ICD for Oncology, Version 3 (ICD-O-3), and histopathological types were defined using ICD-O-3 His/Behave, malignant. We primarily obtained and analyzed the data of lung squamous cell carcinoma (8052/3, 8070/3, 8071/3, 8072/3, 8073/3, 8074/3, 8083/3, 8084/3). Patients diagnosed with lung squamous cell carcinoma from 2004 to 2016 were included if they were N2M0 stage and had received documented lobectomy or pneumonectomy. We excluded patients whose key information including tumor size, surgery type and the total number of lymph nodes resected was vague and unreliable.
Patients who underwent lobectomy or pneumonectomy and systematic lymph node resection for lung squamous cell carcinoma between 2005 and 2015 in the Department of Thoracic Surgery, Zhongshan Hospital, Fudan University were primarily selected for the validation cohort. Patients with adenosquamous carcinoma, sub-lobar resection or with unknown/obscure follow-up times or vital status were excluded to minimize the effect of potential heterogeneity. Finally, 146 patients diagnosed as N2M0 disease were enrolled in our study. All pulmonary resections were performed by board-certified thoracic surgeons in Zhongshan Hospital, and resected tumors and lymph node specimens were all labeled in the operating theater and reviewed by two qualified pathologists to determine their differentiation grade. The grade, or the degree of differentiation, was determined by how closely the tumor cells resemble the parent tissue (organ of origin). Well-differentiated tumor cells closely resemble the tissue from the organ of origin. Moderately and Poorly differentiated tumor cells are disorganized and abnormal looking; they bear moderate or little resemblance to the tissue from the organ of origin. Undifferentiated tumor cells have no resemblance to the origin tissue. These similarities/differences are based on the combination of pattern (architecture), cytology and nuclear features. The pathological stages of the patients in both SEER database and our institution were updated according to the 8th edition of the American Joint Committee on Cancer criteria.14 Patients’ postoperative data were collected annually by outpatient follow-up and phone call.
Demographic And Clinicopathological Information
Patients’ demographic and clinicopathological information, including sex, age at diagnosis, year of surgery, perioperative chemotherapy and postoperative radiotherapy, type of surgery, pathological T stage, neoplastic grading of differentiation, tumor laterality, tumor size, total number of resected lymph nodes and pathologically confirmed positive lymph nodes, were retrieved from the SEER database for the training cohort and from the medical record system of Zhongshan Hospital for the validation cohort. OS was defined as the interval between the date of surgery and the last follow-up or the date of death from any cause. Cancer-specific survival (CSS) was calculated from the date of surgery to the time of death caused by the tumor. LNR was calculated as the ratio between the number of positive lymph nodes and the total number of harvested lymph nodes.
Statistical Analysis
A description and comparison of the baseline characteristics of the patients from the training (SEER) and validation cohorts was conducted in which categorical variables were compared by the chi-square test and Fisher’s exact test when appropriate. Age at diagnosis was divided into three groups: ≤60, 60~70 and >70. The LNR was dichotomized with the X-tile model based on the maximal chi-square value when a series of log rank tests were conducted.15,16 Kaplan-Meier survival curves and log rank tests were used to compare the OS and CSS between different groups of patients. Moreover, we performed univariable and multivariable Cox proportional hazards regression analysis in the training cohort to identify and assess the independent impact of potential prognostic factors on OS and CSS. The factors were selected for the multivariable Cox model through a forward stepwise method using the likelihood ratio test with the Akaike Information Criterion (AIC) as a stopping rule for the best model fit with smallest number of covariates. A nomogram was established based on the final multivariable Cox model, where the 1-, 3- and 5-year survival probabilities could be easily predicted by summing up the points assigned to each respective variable. An 1800 bootstrap resample was conducted in the training cohort for the internal validation of the model, while the validation cohort from Zhongshan hospital provided the external validation. Harrell’s Concordance Index (C-index) was calculated to evaluate the discriminatory ability of the Cox model and nomogram,17 and calibration plots were generated by comparing the expected and observed 1-, 3- and 5-year survival probabilities. In addition, heat maps were created to visualize the distribution of LNR and the number of positive lymph nodes with the corresponding survival probabilities predicted from the Cox model and nomogram. The statistical tests were all two-sided and the results of all survival models are presented as hazard ratios (HR) with corresponding 95% confidence intervals (95% CI). All data analyses were performed with Stata (version 13.0, Stata Corp, College Station, TX, USA) and R (version 3.5.3; R Foundation for Statistical Computing, Vienna, Austria).
Results
Patients Characteristics
Demographic and clinicopathological characteristics of the population in the training cohort (n = 1778) and validation cohort (n = 146) are shown in Table 1. The selection schema for patients in the SEER database is provided in Figure 1. The median patient age at diagnosis was 67 years (range 24~89) in the training cohort and 60 years (range 23~86) in the validation cohort. Positive nodal metastasis was found in all 1,924 patients from the two cohorts. The average number of resected lymph nodes was 14.0 (range 1~88) in the training cohort and 20.3 (range 4~44) in the validation group, whereas the median number of resected positive lymph nodes was 2 (range 1~33) in the training cohort and 3 (range 1~17) in the validation cohorts. Compared with the training cohort, the patients included in the validation group were less likely to receive adjuvant therapy (p<0.001 for both chemotherapy and radiotherapy) and pneumonectomy (p=0.013). In addition, the T stage distribution was more advanced in the validation cohort (p<0.001). No difference was observed in differentiation grade and laterality between the 2 cohorts (p=0.306 for grade and 0.052 for laterality).
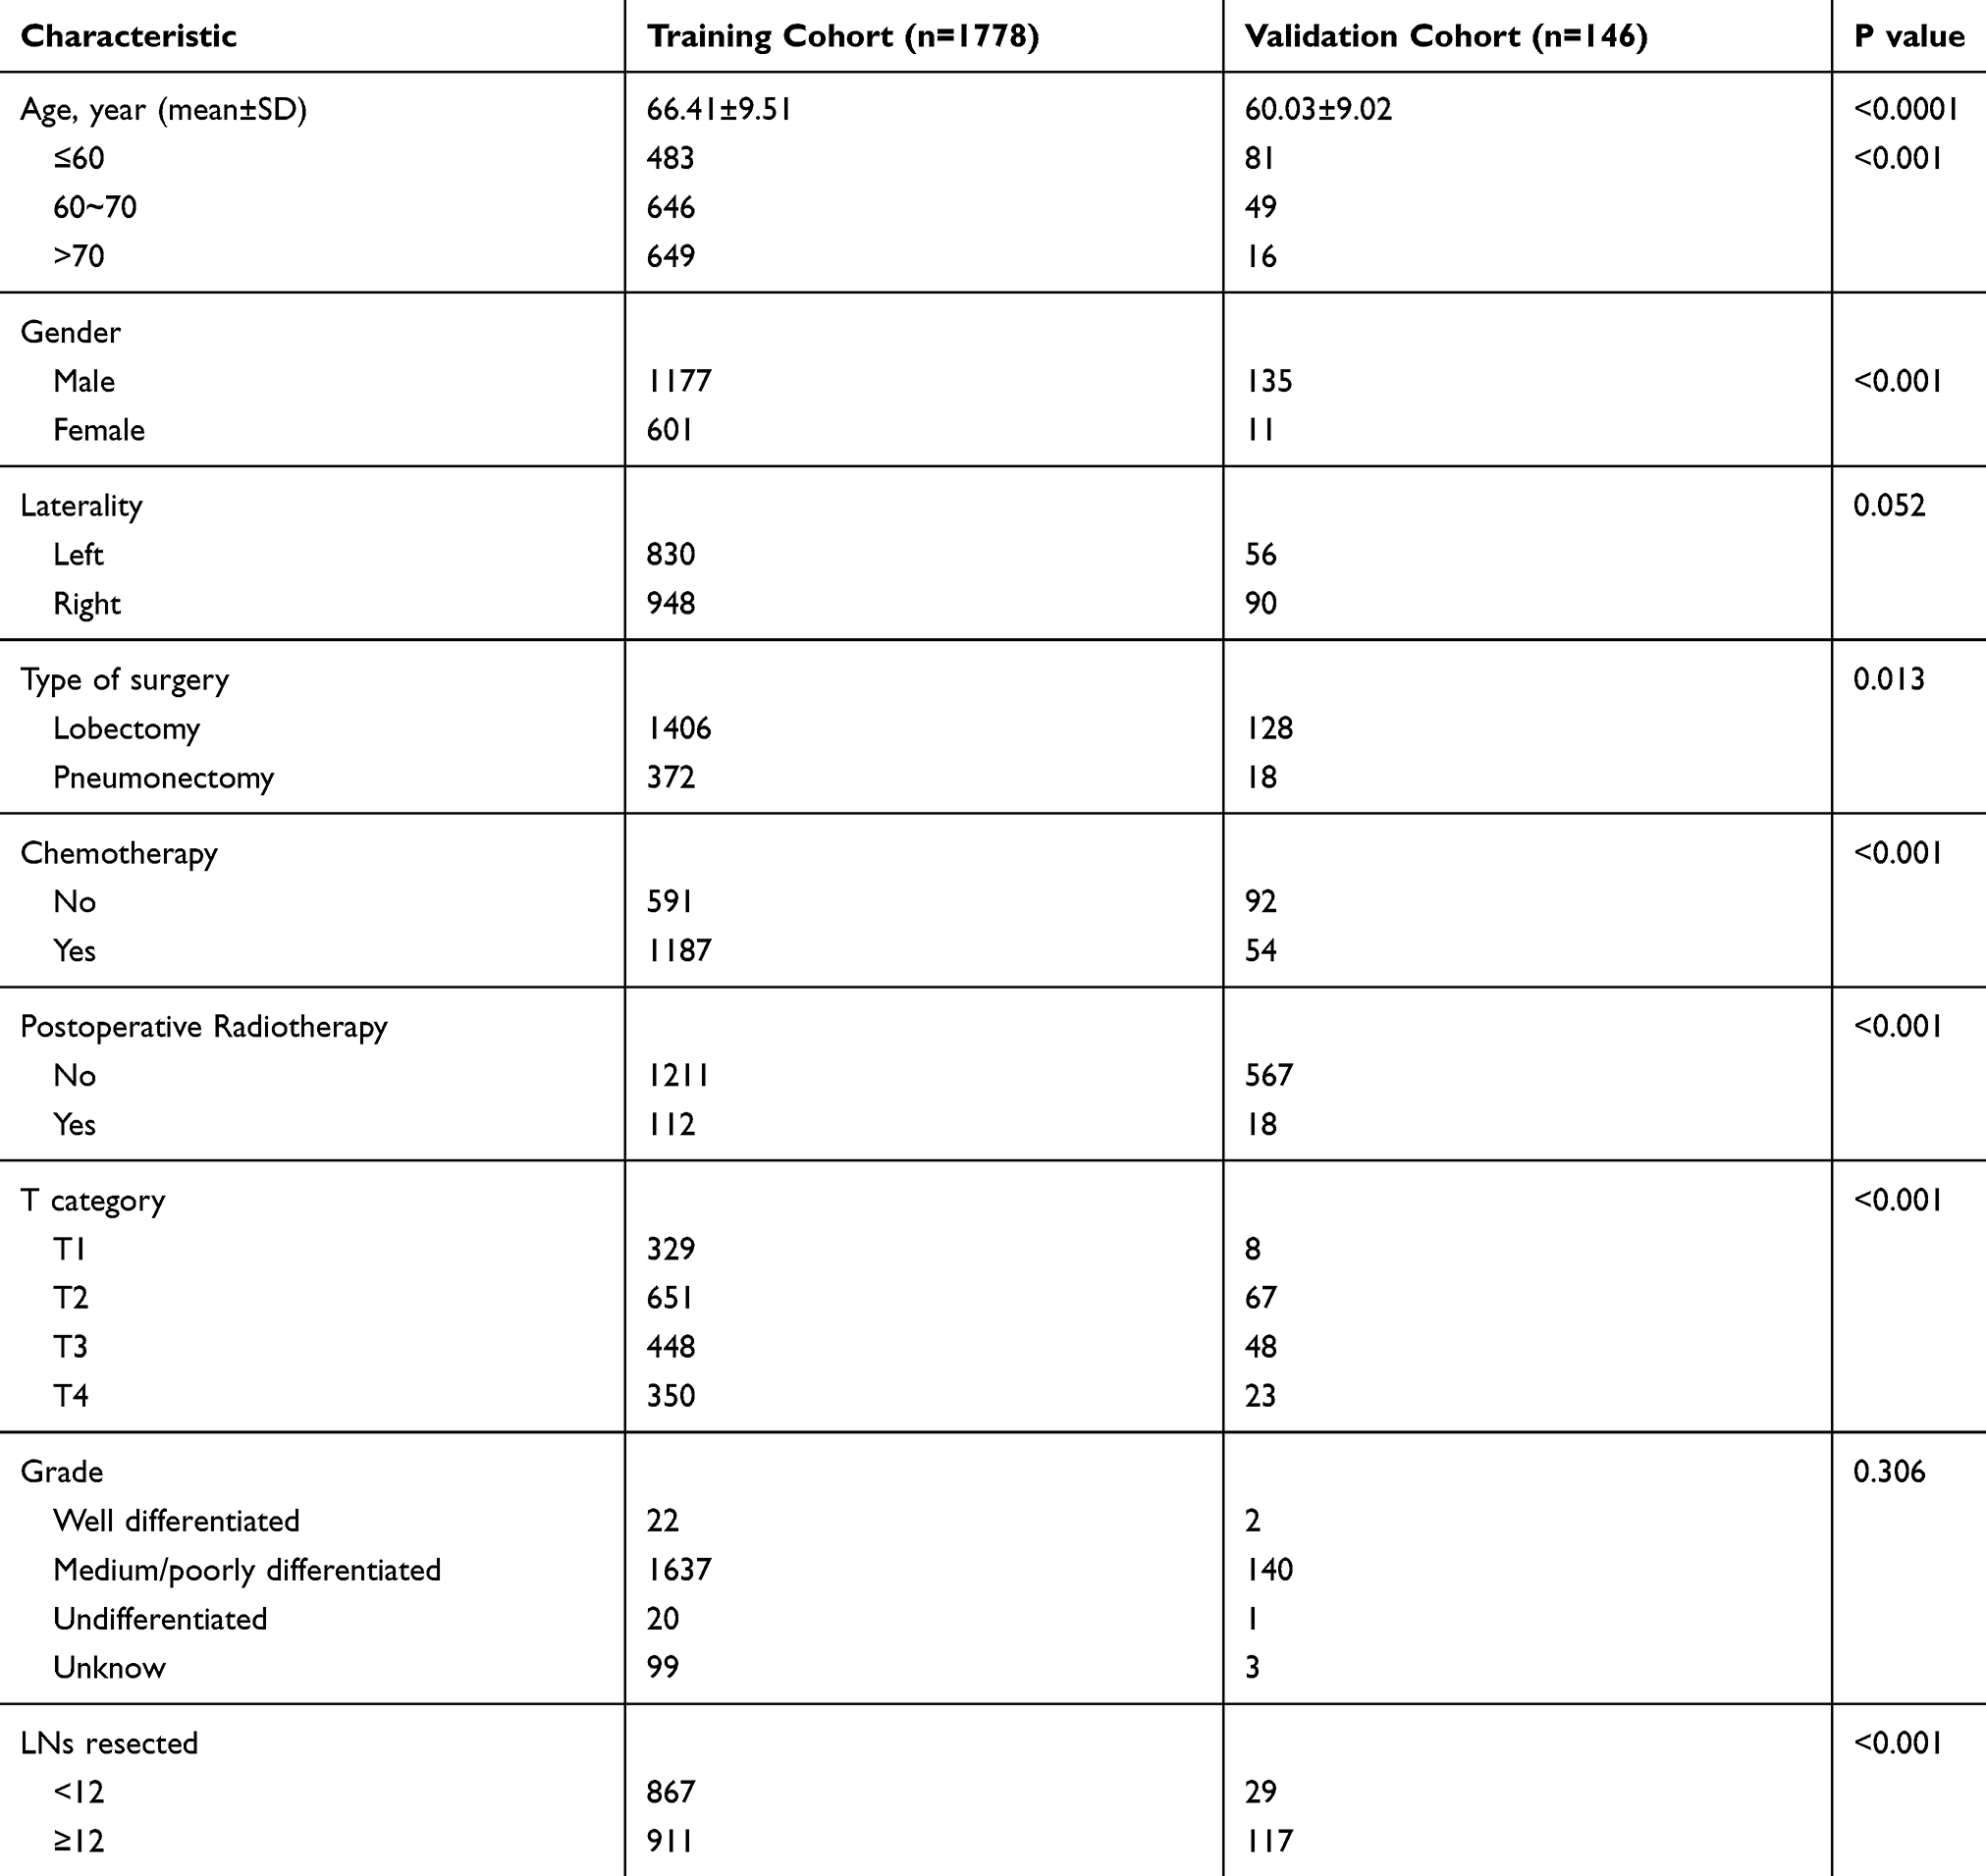 |
Table 1 Demographic And Clinicopathological Characteristics Of The Patients In The Training Cohort And Validation Cohort |
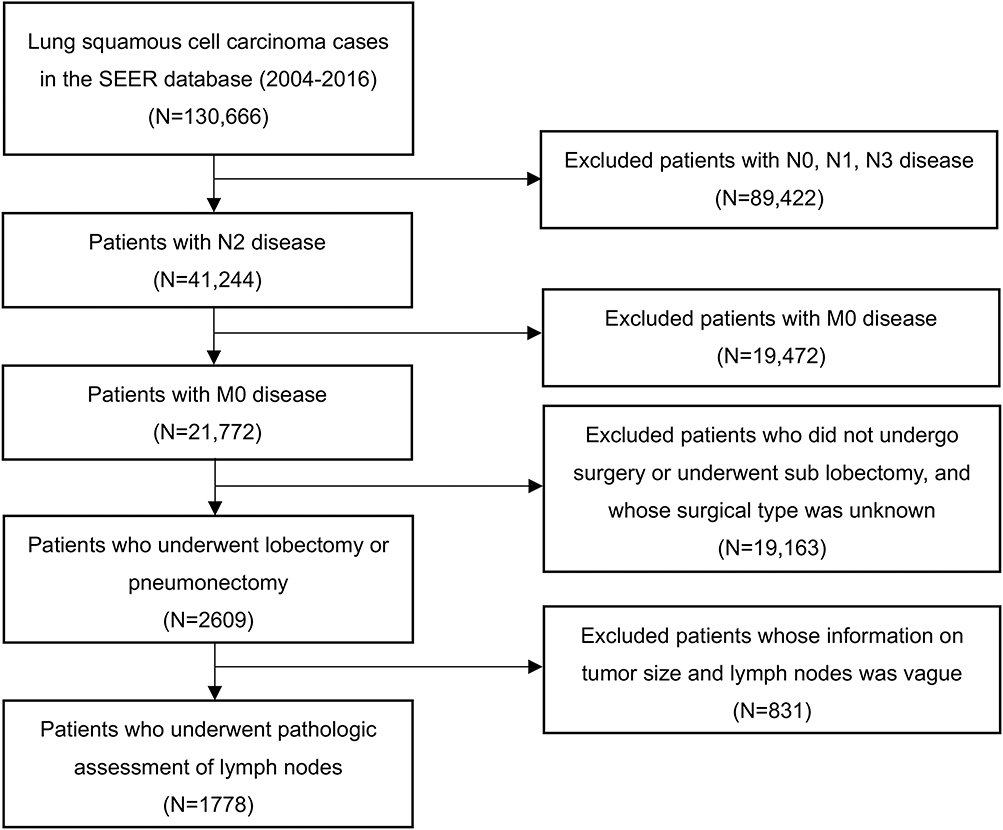 |
Figure 1 Selection of patients included in the study. |
Cutoff Value For LNR And Survival Analysis
In the training group, patients had 1-, 3- and 5-year survival rates of 67.2%, 32.6% and 19.1%, respectively. In the validation group, patients had 1-, 3- and 5-year survival rates of 82.9%, 30.8% and 16.4%, respectively. The optimal cutoff value for LNR as a continuous variable was 0.42 in the training cohort as determined using X-tile software based on the maximal χ2 score for the log rank test. We next stratified the patients in both cohorts into two categories, LNR >0.42 and LNR ≤0.42, to determine the prognostic value of LNR on OS and CSS. As shown in Figure 2A-D, patients with LNR >0.42 had significantly worse OS and CSS than patients with LNR ≤0.42 in both training and validation cohorts (log-rank P<0.05).
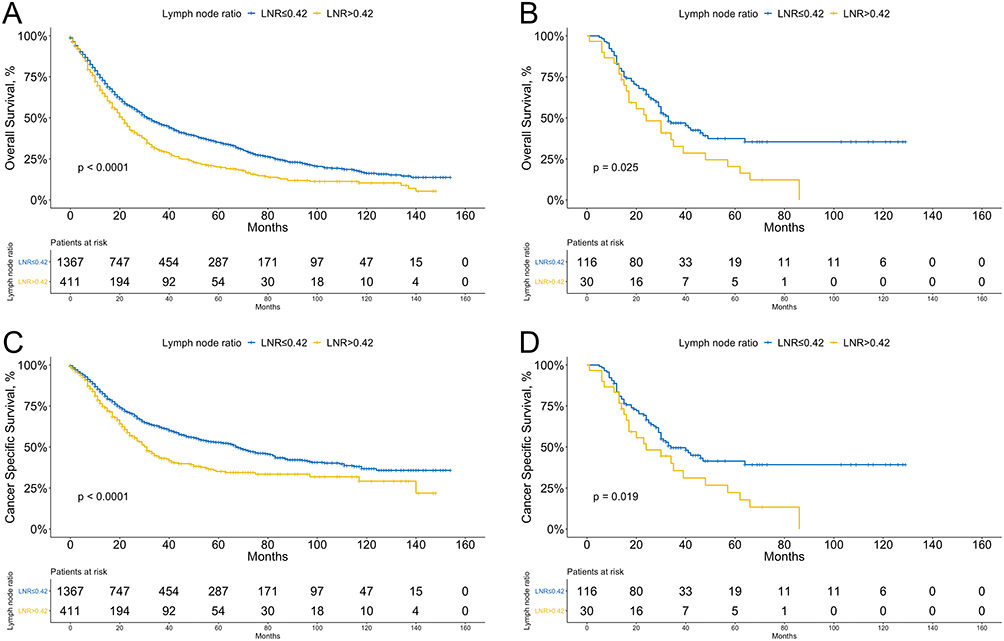 |
Figure 2 Kaplan-Meier curves of overall survival (A) and cancer specific survival (C) stratified by lymph node ratio (LNR) in the training cohort; overall survival (B) and cancer specific survival (D) stratified by LNR in the validation cohort. |
Next, we performed several subgroup analyses on the recipients of postoperative radiotherapy in the high and low LNR groups; however, radiotherapy was not an independent prognostic factor in the whole population and was removed in the stepwise selection. As shown in Figure 3B, in the training cohort, recipients of postoperative radiotherapy had a better prognosis among patients with LNR >0.42, whereas no significant difference was observed in the survival curves between the two subgroups in the low LNR group (Figure 3A). However, in the validation cohorts, because of the limited sample size, we did not analyze the association between postoperative radiotherapy and overall survival with the Kaplan-Meier method.
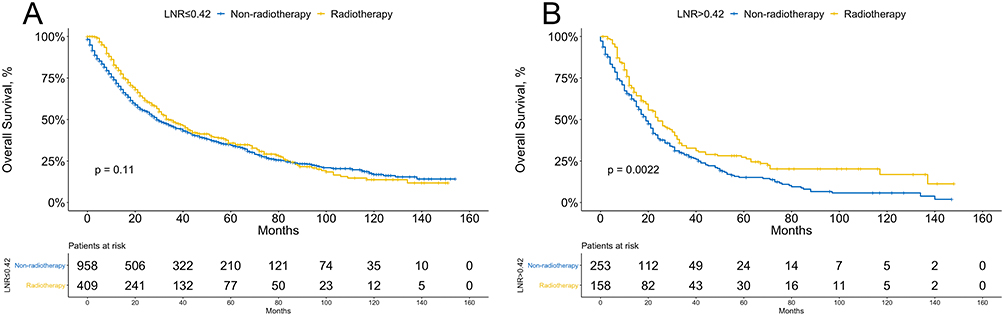 |
Figure 3 Overall survival according to the recipient of postoperative radiotherapy in patients with lower (≤0.42, A) and higher (>0.42, B) LNR. |
Cox Regression Models And Survival-Associated Factors
We performed univariable and multivariable analysis to assess the prognostic value of a series of clinical and pathological factors in the training cohort, and the results of the Cox proportional hazards regression model are shown in Table 2. For OS, univariable analysis showed that age, sex, type of surgery, T stage, postoperative radiotherapy, laterality, chemotherapy and LNR were significant prognostic factors. In multivariable analysis, all of the above factors except for radiotherapy remained independently associated with OS. As for CSS, only laterality, type of surgery, chemotherapy, T stage and LNR showed a significant difference.
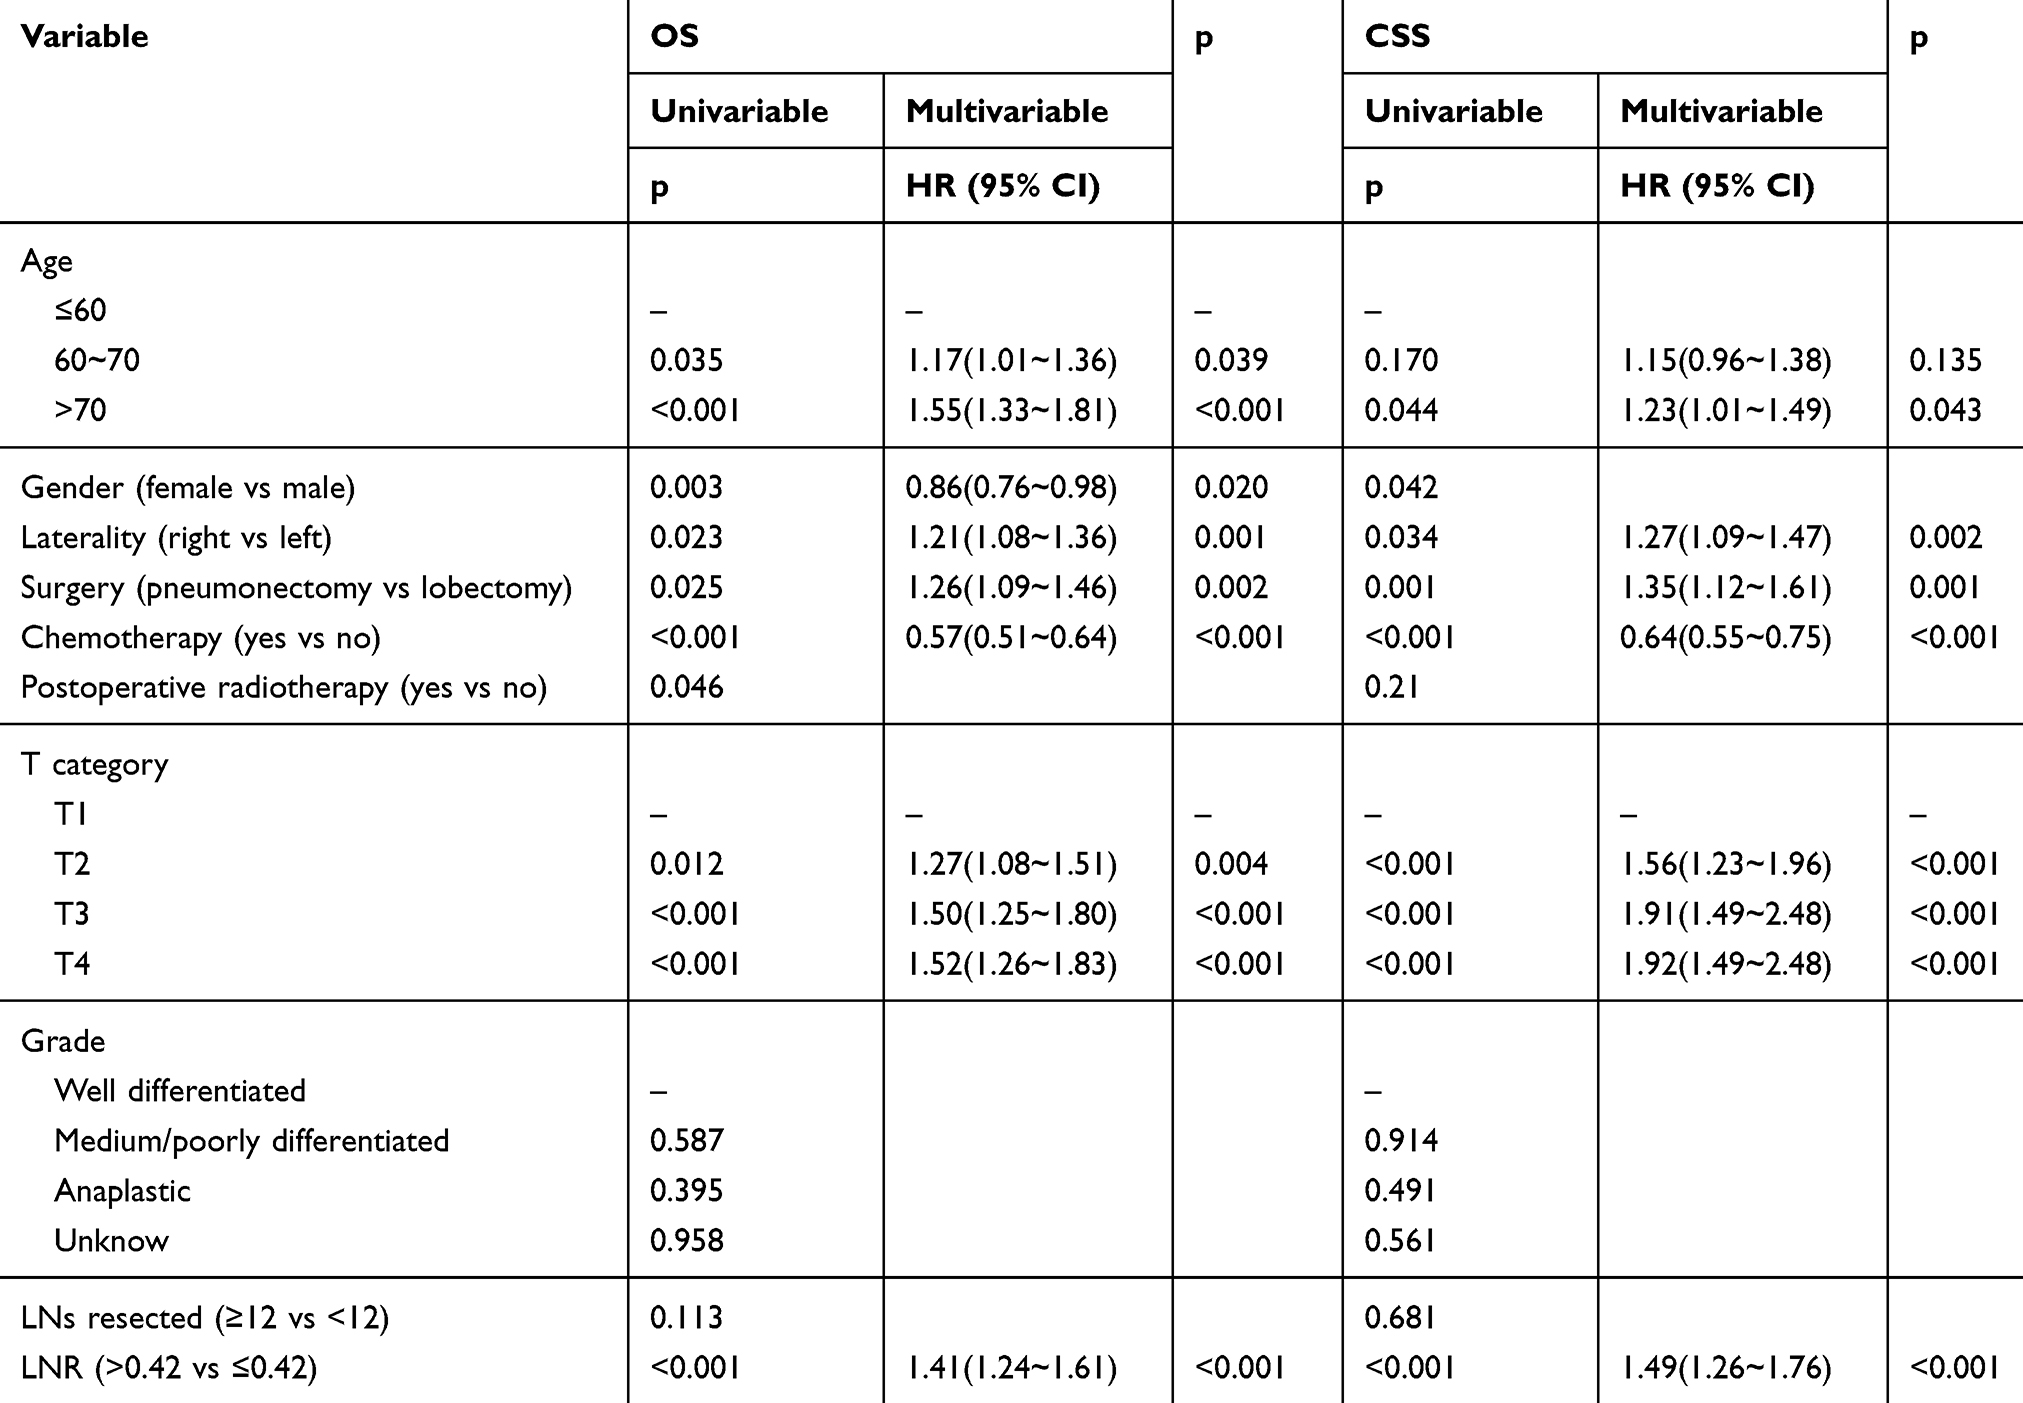 |
Table 2 Univariate And Multivariate Analysis Of Prognostic Factors Potentially Correlated With OS And CSS Of Patients With Resected N2 Stage Lung Squamous Cell Carcinoma In The Training Cohort |
Construction, Calibration And Validation Of The Nomogram
A nomogram incorporating prognostic factors remaining after forward stepwise selection in the training cohort was constructed on the basis of the Cox proportional hazards regression model described above. As shown in Figure 4, the nomogram illustrated how chemotherapy made the largest contribution to overall survival, followed in descending order by age, T stage, LNR, type of surgery, laterality and sex. Each category of these variables was assigned a score on the points scale. By calculating the total score of one patient and locating it on the total points scale, a line drawn straight down to the 1-, 3- and 5-year overall survival probability scales enabled us to easily determine the survival probabilities for each survival duration. Moreover, we applied this nomogram to the training cohort and validation cohort for internal and external validations. As depicted in Figure 5A-F, the calibration plots showed great agreement between the nomogram-predicted and actual survival probabilities in the training and validation cohorts, respectively, although the nomogram for these predictions is not provided here. We also calculated Harrell’s Concordance index (C-index) to assess the discriminatory power of the nomogram. In the training cohort, the C-index was significantly higher than the index for the model based on T stage (0.64, 95% CI=0.63~0.66 vs 0.54, 95% CI=0.53~0.56). In the validation cohorts, Harrell’s C-index was also significantly higher than the index for the T stage-based model (0.67, 95% CI=0.61~0.73 vs 0.54, 95% CI=0.48~0.60). A similar result was obtained for CSS.
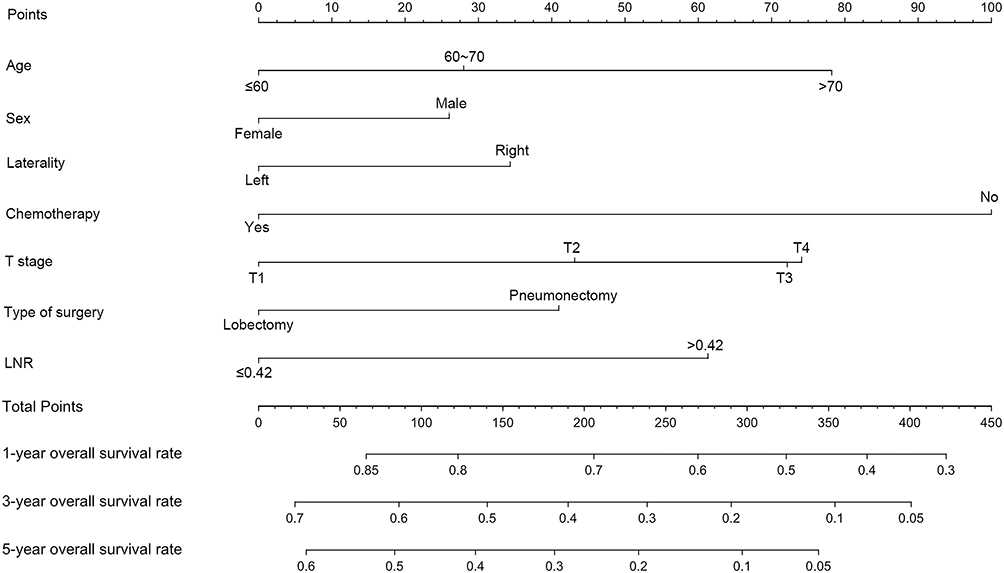 |
Figure 4 Nomogram for patients with resected N2 stage lung squamous carcinoma derived from the training cohort. After summing up the total score and locating it on the Total Points scale, a line drawn straight down to the 1-, 3-, 5-year Survival scale shows the survival probability at each time points. |
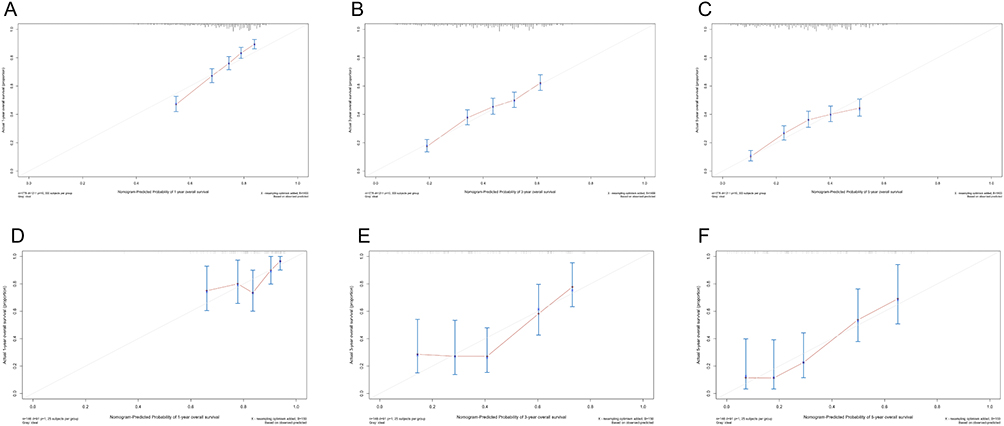 |
Figure 5 Calibration curves for 1-, 3-, 5-year survival probabilities in the training cohort (A, B, C) and in the external validation cohort (D, E, F). Nomogram-predicted survival is plotted on the x axis and observed survival on the y axis. The vertical bars at the top represent the frequency of the predicted probability of survival. A plot along the 45-degree gray line indicates a perfect calibration model where the predicted probabilities are identical to the actual proportions. |
Heat Maps Based On The Nomogram
To visualize the variation trend of nomogram-predicted survival possibilities as the LNR changed continuously, we created a series of heat maps to demonstrate the association of the combination of LNR (as a continuous variable) and the number of positive lymph nodes with the predicted 1-, 3- and 5-year survival possibilities based on the Cox model and nomogram in the training cohort. Red regions indicate relatively better overall survival and cancer-specific survival possibilities, while the regions in blue designated worse survival. As shown in Figure 6A-F, the proportion of red declines and the blue region grows with the increase of LNR and the number of positive lymph nodes.
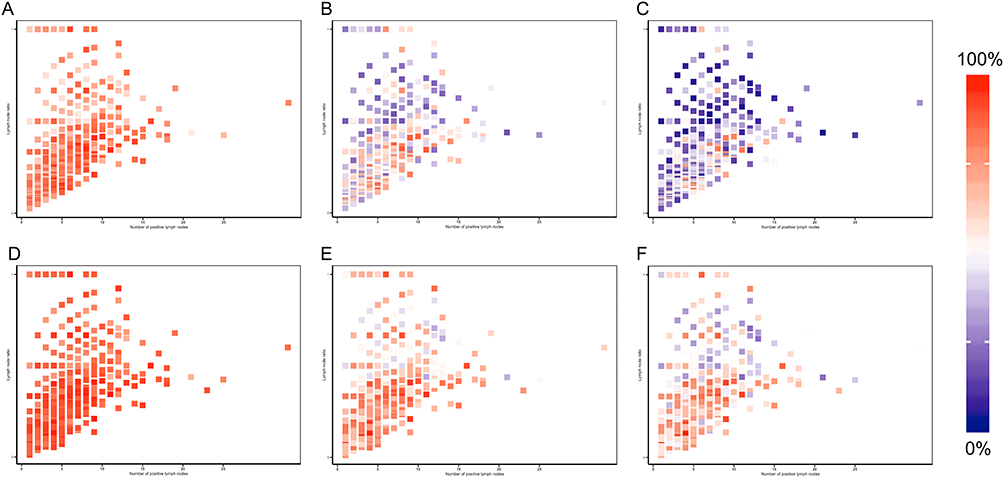 |
Figure 6 Heatmaps of the number of positive lymph node (x axis) and lymph node ratio (y axis) corresponding to 1-, 3-, 5-year overall survival probabilities (A, B, C) and cancer specific survival (D, E, F). |
Discussion
In this large population-based study, we developed a prognostic model with corresponding nomogram and heat maps to estimate OS and CSS for patients with resected N2 stage lung squamous cell carcinoma. We also demonstrated the superiority of the model over the model based on T stages only, as highlighted by the significantly higher Harrell’s C-index and the agreement between nomogram-predicted and actual survival in the calibration plots.
For years, the involvement of regional lymph nodes in malignancies has been considered as one of the most important prognostic factors. In addition to conventional N stage, new single identifiable parameters incorporating other information pertaining to these regional lymph nodes such as the exact number of positive and negative lymph nodes, or the total number of lymph nodes removed, have become the focus in recent years. Compared with only N stages or the number of positive metastatic lymph nodes, LNR helped to adjust the confounding effects of the total number of resected lymph nodes during operation when measuring the spread of malignancies. The ratio remains stable if both the number of positive lymph nodes and total nodes increase. Therefore, LNR is well-known for its ability to predict survival, as suggested in studies on papillary thyroid,18 breast,19 gallbladder20 and Merkel cell carcinoma.21 Deng et al developed a simple clinical prognostic scoring model incorporating LNR with a cutoff point of 0.31 to predict the survival of patients with resected N2 NSCLC and postoperative radiotherapy; the training set of 2329 patients and the validation set of 183 patients both suggest the robustness and feasibility of the prognostic value of LNR.9 A similar prognostic model, integrating smoking status, surgery type, chemotherapy, TNM stage, LNR and LODDS, was published by Zhao et al for patients with lung adenocarcinoma.8 However, few reports have explored the prognostic value of LNR in patients with N2 stage lung squamous cell carcinoma, and no easy-to-apply prognostic tools like nomograms or heat maps have been published to help estimate the survival of these patients and guide the therapeutic regime. In the current study, we found that the patients with an LNR >0.42 were more likely to have poor survival, which requires close follow-up while taking other clinicopathological factors into consideration. The optimal LNR cutoff point of 0.42, identified by X-tile, was similar to the results suggested by previous studies, which ranged from 0.31 to 0.5. 8,9,22,23
However, several drawbacks of LNR still exist. Wang et al proposed an interesting question: Does patient A with 4 positive lymph nodes out of 4 lymph nodes harvested have the same prognosis as patient B with 20 positive lymph nodes out of 20 lymph nodes harvested? Intuitively, patient A has a better prognosis than patient B, but the LNR here fails to provide a good answer since the LNR for both patients is equal to 1.24 On the other hand, LODDS [calculated as log(number of positive lymph nodes+0.5)/(number of negative lymph nodes+0.5)] could overcome this difficulty and make the distinct between the same LNR (LODDS = 0.95 for patient 1, 1.61 for patient 2, and LNR = 1 for both of them), by taking the exact number of negative lymph nodes into consideration and adjusting the ratio by adding 0.5 in both numerator and denominator. Nevertheless, the study by Zhao et al showed that LNR and LODDS had almost the same ability to predict survival for lung adenocarcinoma according to the AIC and Harrell’s C index.8 Both LNR and LODDS cannot perfectly predict the survival for NSCLC patients since there still is not a consensus on how many lymph nodes to resect would it be enough. Many studies have focused on this topic and it still needs further proving.25,26
As shown in the nomogram, we found that older age, males, pneumonectomy, tumor on the right side, no recipient of chemotherapy, more advanced T stage and higher LNR were independently associated with poor survival in patients with resected N2 stage lung squamous cell carcinoma. These findings are mostly consistent with previous literature.8,27 Furthermore, we found no significant associations between survival and grade, postoperative radiotherapy or total number of surgical resected lymph nodes in the whole training cohort. Overall, the contribution of chemotherapy to postoperative survival was the greatest, and our subgroup analysis showed that chemotherapy was significantly associated with better OS in both the high and low LNR group (data not shown). This is in agreement with the Clinical Practice Guideline given by the National Comprehensive Cancer Network, in which adjuvant chemotherapy is regularly recommended for N2 stage NSCLC.28 Notably, the choice of lobectomy or pneumonectomy also impacts prognosis significantly. The correlation between surgery type and survival has remained controversial in patients with NSCLC. However, several studies suggest that sleeve lobectomy offers low morbidity and mortality and better long-term survival for NSCLC patients, as lobectomy preserves much more pulmonary tissue than pneumonectomy.29,30
As the indications for perioperative therapy based on TNM stage stratifications are still controversial, further exploration beyond this system is still warranted. Therefore, we did subgroup analysis and found that patients with LNR >0.42 would benefit more from postoperative adjuvant therapy in comparison with those with lower LNR. Possible explanations may involve two aspects: on the one hand, the risk of locoregional recurrence may be higher in those with a high LNR and may define a group in whom the benefit of postoperative radiotherapy outweighs the toxicity; on the other hand, the LNR might serve as a marker of the body’s immune system and tumor-host interaction, resulting in the value of LNR as a predictor of radiotherapy benefit.13,31 We might consider more aggressive and precise radiotherapy in patients with a higher LNR as a new indicator for tailoring treatment.
The major strength of this study is that the heat maps enabled us to identify the correlation between the model-predicted survival rates and the combination of LNR and positive lymph nodes. The varying trend of 1-, 3- and 5-year survival probabilities could be easily visualized by the segregation of blue blocks when LNR and the number of metastatic lymph nodes increase separately or together. To our knowledge, this is the first study to combine the nomogram and heat maps to quantitively investigate the prognostic value of LNR and other coefficients.
The major limitation of this study is its retrospective nature. Moreover, as a single-center study, our study failed to validate the model in a larger cohort, limiting the representativeness and generalizability of our nomogram. In addition, several demographic and clinicopathological characters were not strictly balanced in the training and validation cohorts. Furthermore, our model was limited by failure to incorporate some of the more recognized prognostic factors such as neoadjuvant chemotherapy and complications like diabetes or hypertension which are not contained in the SEER database. Further efforts on the collection and incorporation of more relevant variables are needed to improve this prognostic model.
We are confident that our population-based model integrating the LNR will help predict the survival outcomes and facilitate clinical counseling for patients with resected N2 stage lung squamous cell carcinoma.
Conclusions
Our study demonstrated that lower LNR was associated with improved OS and CSS for patients with resected N2 stage lung squamous cell carcinoma, and the combined use of the nomogram and heat maps integrating LNR as a prognostic factor facilitates more precise estimates by clinicians of patient survival. Further prospective research in this area is needed to validate our findings.
Ethics And Informed Consent
Because of the retrospective nature of this study, the informed consent was waived by the institutional review board of the Fudan University Zhongshan Hospital. We declared that the privacy of patients enrolled in this study was protected as the medical records and follow-up data were completely anonymized and maintained with confidentiality, and that this study was conducted in accordance with the principles of the Declaration of Helsinki.
Acknowledgments
We thank International Science Editing for editing this manuscript. Funding was provided by Science and Technology Commission of Shanghai Municipality (No. 17ZR1405200).
Disclosure
The authors report no conflicts of interest in this work.
References
1. Bray F, Ferlay J, Soerjomataram I, Siegel RL, Torre LA, Jemal A. Global cancer statistics 2018: GLOBOCAN estimates of incidence and mortality worldwide for 36 cancers in 185 countries. CA Cancer J Clin. 2018;68(6):394–424.
2. Barta JA, Powell CA, Wisnivesky JP. Global epidemiology of lung cancert. Ann Glob Health. 2019;85(1):505–516.
3. PORT Meta-analysis Trialists Group. Postoperative radiotherapy in non- small-cell lung cancer: systematic review and meta-analysis of individual patient data from nine randomised controlled trials. Lancet. 1998;352:257–263.
4. Lally BE, Zelterman D, Colasanto JM, Haffty BG, Detterbeck FC, Wilson LD. Postoperative radiotherapy for stage II or III non-small-cell lung ca cer using the surveillance, epidemiology, and end results database. J Clin Oncol. 2006;24:2998–3006. doi:10.1200/JCO.2005.04.6110
5. Douillard JY, Rosell R, De Lena M, Riggi M, Hurteloup P, Mahe MA. Adjuvant Navelbine International Trialist Association. Impact of post- operative radiation therapy on survival in patients with complete resec- tion and stage I, II, or IIIA non-small-cell lung cancer treated with adjuvant chemotherapy: the adjuvant Navelbine International Trialist Association (ANITA) randomized trial. Int J Radiat Oncol Biol Phys. 2008;72:695–701.
6. Burdett S, Rydzewska L, Tierney J, et al. Postoperative radiotherapy for non-small cell lung cancer. Cochrane Database Syst Rev. 2016;(10):CD002142.
7. Katsumata S, Aokage K, Ishii G, et al. Prognostic impact of the number of metastatic lymph nodes on the eighth edition of the TNM classification of non-small cell lung cancer. J Thorac Oncol. 2019;14(8):1408–1418
8. Zhao Y, Li G, Zheng D, et al. The prognostic value of lymph node ratio and log odds of positive lymph nodes in patients with lung adenocarcinoma. J Thorac Cardiovasc Surg. 2017;153(3):702–709.e1. doi:10.1016/j.jtcvs.2016.11.053
9. Deng W, Xu T, Xu Y, et al. Survival patterns for patients with resected N2 non-small cell lung cancer and postoperative radiotherapy: a prognostic scoring model and heat map approach. J Thorac Oncol. 2018;13:1–7.
10. Wang C-L, Li Y, Yue D-S, Zhang L-M, Zhang Z-F, Sun B-S. Value of the metastatic lymph node ratio for predicting the prognosis of non-small-cell lung cancer patients. World J Surg. 2011;36(2):455–462.
11. Chiappetta M, Leuzzi G, Sperduti I, et al. Lymph-node ratio predicts survival among the different stages of non-small-cell lung cancer: a multicentre analysis†. Eur J Cardiothorac Surg. 2018;55(3):405–412.
12. Taylor MD, LaPar DJ, Thomas CJ, et al. Lymph node ratio predicts recurrence and survival after r0 resection for non-small cell lung cancer. Ann Thorac Surg. 2013;96(4):1163–1170.
13. Urban D, Bar J, Solomon B, Ball D. David ball MBBS MF. lymph node ratio may predict the benefit of postoperative radiotherapy in non-small-cell lung cancer. J Thorac Oncol. 2013;8(7):940–946.
14. Detterbeck FC. The eighth edition TNM stage classification for lung cancer: what does it mean on main street? J Thorac Cardiovasc Surg. 2018;155(1):356–359.
15. Camp RL, Dolled-Filhart M, Rimm DL. X-tile: a new bio-informatics tool for biomarker assessment and outcome-based cut-point optimization. Clin Cancer Res. 2004;10(21):7252–7259.
16. Qian K, Sun W, Guo K, et al. The number and ratio of positive lymph nodes are independent prognostic factors for patients with major salivary gland cancer: results from the surveillance, epidemiology, and end results dataset. Eur J Surg Oncol. 2018;45(6):1025–1032
17. Harrell FEJ, Lee KL, Mark DB. Multivariable prognostic models: issues in developing models, evaluating assumptions and adequacy, and measuring and reducing errors. Stat Med. 1996;15(4):361–387.
18. Kim HI, Kim K, Park SY, et al. Refining the eighth edition AJCC TNM classification and prognostic groups for papillary thyroid cancer with lateral nodal metastasis. Oral Oncol. 2018;78:80–86.
19. Wen J, Yang Y, Liu P, et al. Development and validation of a nomogram for predicting survival on the base of modified lymph node ratio in breast cancer patients. Breast. 2017;33:14–22.
20. Amini N, Kim Y, Wilson A, et al. Prognostic implications of lymph node status for patients with gallbladder cancer: a multi-institutional study. Ann Surg Oncol. 2016;23(9):3016–3023.
21. Cheraghlou S, Agogo GO, Girardi M. Evaluation of lymph node ratio association with long-term patient survival after surgery for node-positive merkel cell carcinoma. JAMA Dermatol. 2019;155:1–9.
22. Jonnalagadda S, Arcinega J, Smith C, Wisnivesky JP. Validation of the lymph node ratio as a prognostic factor in patients with N1 nonsmall cell lung cancer. Cancer. 2011;117(20):4724–4731.
23. Nwogu CE, Groman A, Fahey D, et al. Number of lymph nodes and metastatic lymph node ratio are associated with survival in lung cancer. Ann Thorac Surg. 2012;93(5):1614–1620.
24. Wang J, Hassett JM, Dayton MT, Kulaylat MN. The prognostic superiority of log odds of positive lymph nodes in stage III colon cancer. J Gastrointest Surg. 2008;12(10):1790–1796.
25. Stiles BM, Mao J, Harrison S, et al. Extent of lymphadenectomy is associated with oncological efficacy of sublobar resection for lung cancer ≤2 cm. J Thorac Cardiovasc Surg. 2019;157(6):2454–2465.e1. doi:10.1016/j.jtcvs.2019.01.136
26. Ludwig MS, Goodman M, Miller DL, Johnstone PA. Postoperative survival and the number of lymph nodes sampled during resection of node-negative non-small cell lung cancer. Chest. 2005;128(3):1545–1550.
27. Zeng Y, Mayne N, Yang C-FJ, et al. A nomogram for predicting cancer-specific survival of TNM 8th edition stage I non-small-cell lung cancer. Ann Surg Oncol. 2019;26:1–10.
28. Ettinger DS, Aisner DL, Wood DE, et al. NCCN guidelines insights: non–small cell lung cancer, version 5.2018. J Natl Compr Canc Netw. 2018;16(7):807–821.
29. Shi W, Zhang W, Sun H, Shao Y. Sleeve lobectomy versus pneumonectomy for non-small cell lung cancer: a meta-analysis. World J Surg Oncol. 2012;10:265.
30. Deslauriers J, Gregoire J, Jacques LF, Piraux M, Guojin L, Lacasse Y. Sleeve lobectomy versus pneumonectomy for lung cancer: a comparative analysis of survival and sites or recurrences. Ann Thorac Surg. 2004;77(4):1152–1156.
31. Demaria S, Formenti SC. Role of T lymphocytes in tumor response to radiotherapy. Front Oncol. 2012;2:95.
 © 2019 The Author(s). This work is published and licensed by Dove Medical Press Limited. The full terms of this license are available at https://www.dovepress.com/terms.php and incorporate the Creative Commons Attribution - Non Commercial (unported, v3.0) License.
By accessing the work you hereby accept the Terms. Non-commercial uses of the work are permitted without any further permission from Dove Medical Press Limited, provided the work is properly attributed. For permission for commercial use of this work, please see paragraphs 4.2 and 5 of our Terms.
© 2019 The Author(s). This work is published and licensed by Dove Medical Press Limited. The full terms of this license are available at https://www.dovepress.com/terms.php and incorporate the Creative Commons Attribution - Non Commercial (unported, v3.0) License.
By accessing the work you hereby accept the Terms. Non-commercial uses of the work are permitted without any further permission from Dove Medical Press Limited, provided the work is properly attributed. For permission for commercial use of this work, please see paragraphs 4.2 and 5 of our Terms.