")
Back to Journals » OncoTargets and Therapy » Volume 12
The prognostic value of LINC01296 in pan-cancers and the molecular regulatory mechanism in hepatocellular carcinoma: a comprehensive study based on data mining, bioinformatics, and in vitro validation
Authors Liang C, Zhang Y, Zhang Y, Li R, Wang Z, Wei Z, Guo J
Received 18 February 2019
Accepted for publication 21 June 2019
Published 19 July 2019 Volume 2019:12 Pages 5861—5885
DOI https://doi.org/10.2147/OTT.S205853
Checked for plagiarism Yes
Review by Single anonymous peer review
Peer reviewer comments 2
Editor who approved publication: Dr William C. Cho
This paper has been retracted
Chaojie Liang,* Yongping Zhang,* Yu Zhang, Ruihuan Li, Zhimin Wang, Zhigang Wei, Jiansheng Guo
Department of General Surgery, First Hospital/First Clinical College of Shanxi Medical University, Taiyuan, Shanxi 030001, People’s Republic of China
*These authors contributed equally to this work
Background and aims: This study aimed to clarify the prognostic role of LINC01296 in various cancers, and to evaluate its effect on proliferation, metastasis, and the cell cycle in hepatocellular carcinoma (HCC) by data mining, bioinformatics, and in vitro validation.
Methods: The prognostic role of LINC01296 in cancer patients was assessed by searching the PubMed, Embase, Web of Science, and Gene Expression Omnibus databases and calculating pooled hazard ratios (HRs) with 95% confidence intervals (CIs); this prognostic role was also evaluated using The Cancer Genome Atlas (TCGA). We detected LINC01296 expression in HCC cell lines, and lentivirus-mediated small interfering RNAs were used to silence LINC01296 in MHCC97H and Hep3B cells to explore the role of LINC01296 in cell proliferation, metastasis, and cell cycle progression with in vitro validation and bioinformatics.
Results: The results indicated that LINC01296 overexpression was associated with poor overall survival (OS) and disease-free survival (DFS) in various cancers; however, LINC01296 expression was not associated with recurrence-free survival (RFS). Similar results were found with TCGA, which showed that LINC01296 expression was associated with the pathologic stage, tumor size, and differentiation in Asian cancer patients. Additionally, bioinformatics analysis revealed expression of 394 related genes, which indicated that LINC01296 could be involved in the tumorigenesis and progression of HCC. In vitro gene silencing experiments indicated that LINC01296 downregulation repressed cell proliferation, cell cycle progression, and the metastatic potential of HCC through the regulation of BUB1, CCNA2, and CDK1 expression.
Conclusion: This study demonstrated that LINC01296 expression is related to poor OS and DFS in a variety of cancer types and that LINC01296 has an oncogenic role in HCC.
Keywords: LINC01296, lncRNA, cancers, HCC, bioinformatics
Introduction
GLOBOCAN 2015 reported that 1,410,000 new cases of cancer occurred worldwide, for which there were 820,000 cancer-related deaths, and in China in 2015, an estimated 42.9 million new cancer cases occurred, for which there were 28.1 million cancer-related deaths.1 With the development of medical technologies, cancer treatments have markedly improved; however, cancer prognoses remain poor, for which the lack of specific biomarkers for the early diagnosis of cancer is a primary cause.2 Development of these biomarkers is especially needed for hepatocellular carcinoma (HCC) prognoses.3,4 In 2015, 460, 000 new cases were diagnosed worldwide, which resulted in 422, 000 cancer-related deaths in China.1,5 Diagnosing HCC is difficult during early disease; therefore, finding specific biomarkers to help diagnose HCC and other cancers early and to explore the molecular mechanisms behind their actions has become a popular topic of oncologic research studies.6,7
Long non-coding RNA (lncRNA) is an RNA that is more than 200 bp long, does not encode proteins, and was once considered to have no specific biologic function (transcriptional garbage).8 In recent years, an increasing number of studies have demonstrated that lncRNAs are closely associated with cancer progression and development, including proliferation, apoptosis, invasion, and metastasis.9–11 Moreover, a few studies have also demonstrated that lncRNA expression is associated with cancer prognoses, which suggests that lncRNA could be used as an early cancer detection biomarker for patients with a variety of cancer types.12–16
LINC01296, which is located at chromosome 14q11.2, has been shown to be dysregulated in several tumors, such as esophageal carcinoma (ESCC),17 osteosarcoma (OSC),18 gastric cancer (GC),19 and pancreatic ductal adenocarcinoma (PADC),20 and has been shown to have an oncogenic role in cancer. Wang et al.17 reported that LINC01296 promoted ESCC cell proliferation, migration, and invasion, and Jiang et al.21 found that LINC01296 was associated with poor prognoses and could promote breast cancer tumorigenesis. In addition, because several studies regarding LINC01296 were limited by sample size and discrete outcomes, we performed a meta-analysis that included published articles and the Gene Expression Omnibus (GEO) to explore the prognostic value of LINC01296 in cancer patients. We also explored its prognostic value using The Cancer Genome Atlas (TCGA) to examine different cancer types. To date, the role of LINC01296 in HCC is also unknown, and therefore, we identified related genes using the Multi Experiment Matrix and lncRNA-related protein-coding genes (PCGs) to explore LINC01296 mechanisms using GO, KEGG, and Protein-Protein interaction (PPI) analyses. Next, we performed Cell Counting Kit-8 (CCK-8) and colony formation assays, and cell cycle analyses to assess the regulatory mechanism of LINC01296 in HCC cell lines.
Materials and methods
Data acquisition, search strategy, and study selection
LINC01296 microarray data were extracted from GEO profiles (http://www.ncbi.nlm.nih.gov/geoprofiles/) and GEO datasets (http://www.ncbi.nlm.nih.gov/gds/), collecting only the GPL570 platform (Affymetrix Human Genome U133 Plus 2.0 Array, HG-U133_Plus_2) that can minimize impacts on heterogeneity in later analyses, with the search date set to September 2018. We searched the following words: “cancer,” “carcinoma,” “neoplasm,” “lncRNA,” and “LINC01296.” We also searched published articles from PubMed, Embase, and the Web of Science, and set the search date to September 15, 2018. The search items were: “LINC01296,” “long non-coding RNA” or “lncRNA,” “cancer” or “carcinoma,” “tumor” or “neoplasm,” and “prognosis” or “survival.”
The inclusion criteria were: (1) LINC01296 expression in human tissues that could be calculated or identified; (2) the association between LINC01296 and overall survival (OS), disease-free survival (DFS), or recurrence-free survival (RFS) was reported or could be determined; and (3) the hazard ratios (HR) for survival data with 95% confidence intervals (95% CI) were provided or could be calculated with survival curves.
The exclusion criteria were: (1) Studies using non-human subjects; (2) case reports, letters, editorials, conference reports, and laboratory articles; (3) data for which hazard ratios (HRs) could not be calculated; and (4) repeated studies.
Data extraction and quality assessment
Two authors (C.L. and Y. Z.) searched and assessed the studies independently according to the following criteria: the first author, year of publication, country, cut-off value, number of cases, and survival data, which were included in the extracted data. Newcastle-Ottawa-Scale criteria were used to assess the study qualities when the NOS score was six or higher, and we considered these articles to be high quality; otherwise, we determined them to be low-quality.
For the GEO database, OS, DFS, RFS, survival outcome, follow-up, cut-off values, and HR values with a 95% CI was extracted.
Public data and tools
We performed this study according to the publication guidelines, which were provided by TCGA (https://cancergenome.nih.gov). The TCGA data portal (https://portal.gdc.cancer.gov) and UCSC Xena project (https://xena.ucsc.edu) was used to extract the clinical data and RNAseqV2. GEPIA software was used to analyze the data.22 One-way ANOVA was performed to analyze the differential expression, and the Kaplan-Meier method was used to calculate the survival data and the log-rank test; the HR and 95% CI is shown in the Kaplan-Meier curve figures.
Linc01296-related genes in HCC
To determine genes related to LINC01296 in HCC, the Multi Experiment Matrix (http://biit.cs.ut.ee/mem/) and lncRNA-related PCGs were determined using the R software package, which used two-sided Pearson correlation coefficients and the z-test. The PCGs positively or negatively correlated with LINC01296 were considered to be lncRNA-related PCGs (Pearson correlation >0.30 and P-value <1.00E-11). Herein, we took the intersection of the two as the target genes using R software.
Prospective mechanisms and functions of linc01296-related genes
The molecular mechanisms and biologic functions of potential LINC01296 targets in HCC were identified by enrichment analysis and pathway annotations. Gene ontology (GO) and Kyoto Encyclopedia of Genes and Genomes (KEGG) pathway enrichment analyses were performed using the R program package by DAVID ( https://david.ncifcrf.gov/summary.jsp, version 6.8) and the KOBAS website (http://kobas.cbi.pku.edu.cn/, version 3.0).23,24 Cytoscape 3.0 software25 (http://www.cytoscape.org/) and Biological Network Gene Ontology (BINGO) plugins were responsible for the GO network. In addition, each biological process was represented by a node; a bigger node indicated that more genes were participating in a biological process, and a deeper color indicated a smaller P-value regarding the biological process. If the nodes had colors other than white, it indicated statistical significance (P<0.05).
Protein-protein interaction network construction
PPI network analysis was performed at the STRING website26, and Cytoscape 3.0 software (http://www.cytoscape.org/) with MCODE was used to select hub genes.
Cell culture
We used HepG2, Huh-7, and BEL-7402 cell lines obtained from the Cell Bank of the Shanghai Institute of Biochemistry & Cell Biology (Shanghai, China), MHCC97H and SMCC7721 cell lines obtained from the Cell Bank of the Zhongshan Hospital of Fudan University (Shanghai, China), and Hep3B and LO-2 cell lines obtained from the Cancer Hospital of the Chinese Academy of Medical Sciences (Beijing, China). Cells were maintained in Dulbecco’s modified Eagle’s medium (DMEM) supplemented with 10% fetal bovine serum (Gibco, Waltham, MA USA), 100 U/ml penicillin, and 100 μg/ml streptomycin (Invitrogen, Carlsbad, CA, USA) in 5% CO2 at 37 °C.
Quantitative real-time polymerase chain reaction (qrt-pcr)
TRIzol reagent (Life Technologies, Carlsbad, CA, USA) was used to extract the total RNA from cultured cells or tissues. The expression of LINC0196 and other genes was measured using qRT-PCR, for which the TaqMan Reverse Transcription kit and TaqMan Universal PCR Master Mix (Thermo Fisher Scientific, Inc.) were used according to the manufacturer’s instructions (Applied Biosystems, Foster City, CA, USA). Glyceraldehyde-3-phosphate dehydrogenase (GAPDH) expression was used as an internal control. Real-time PCR was repeated in triplicate (Applied Biosystems). The CT difference between the internal control and the target gene is presented as −ΔCT. ΔΔCT is the difference between the ΔCT values of paired specimens. 2ΔΔCT indicates the exponential value of ΔCT, and this value indicates a change in expression.
Sirna and cell transfection assay
For transient transfections, the LINC01296 negative control (LINC01296-NC), si-LINC01296-1# (5′-GGCUGGAGAAUAUUUCCUATTTT-3′), and si-LINC01296-2# (5′-CUGAAACAUAUUCCGUGGUTT-3′) were used. Six-well plates were used to culture cells in complete growth media until the cell density reached 80%. Then, the cells were transfected with siRNA-LINC01296 and NC siRNA using Lipofectamine 2000 transfection reagent (Thermo Fisher Scientific) according to the manufacturer’s instructions. The transfected cells were harvested for qRT-PCR analyses after 48 hrs.
Cell proliferation, transwell invasion, and wound healing assays
Transfected MHCC97-H or Hep 3B cells were seeded into 96-well plates, and cell proliferation was measured at 1, 2, 3, and 4 days using the CCK-8 assay (Dojindo, Kumamoto, Japan) according to the manufacturer’s instructions. Transwell chambers (8-μm pore size; Millipore) contained Matrigel (BD Biosciences, San Jose, CA, USA) and were used to measure cellular invasion. Briefly, 600 μl of complete media was added to the bottom chamber. The transfected cells were suspended in a serum-free medium, and 200 μl (4×10⁴ cells) of this cell suspension was added to the upper chamber. After 24 h, the cells on the top of the membrane were removed with a cotton swab. The cells on the bottom of the membrane were fixed in 95% ethanol, and 4 g/L of crystal violet was used to stain the cells. The cells that had adhered to the bottom of the membrane were counted in five selected fields at random using 200× magnification. The wound healing assay was performed by adding cells with 90% confluence to six-well plates and incubating overnight to allow the cells to adhere. A wound was created along the center of each well by making a scratch in the cell layer with the tip of a 200-μL pipette. The wells were then washed twice with phosphate-buffered saline (PBS) to remove loose cells, and fresh media was added. At 0 and 24 h, photographs were taken to assess cell migration into the wound. Each experiment was repeated three times.
Western blot analysis
We separated equal amounts of protein with 10% sodium dodecyl sulfate-polyacrylamide gel electrophoresis (SDS-PAGE) and then transferred the protein to polyvinylidene fluoride (PVDF) membranes (Millipore, Bedford, MA, USA). Non-specific protein interactions were blocked with incubation in 3% non-fat milk and Tris-buffered saline with Tween-20 (TBST) at 37 °C for 30 min. Subsequently, the membranes were incubated for 2 h at room temperature with antibodies against CCNA2 (1:1000, Abcam, Cambridge, UK), anti-BUB1 (1:1000, Abcam, Cambridge, UK), anti-CDK1 (Abcam, Cambridge, UK), and anti-GAPDH (Abcam, Cambridge, UK). Following antibody incubations, membranes were incubated with an HRP-conjugated secondary antibody. GAPDH was used as the endogenous control. The target protein bands were visualized. We applied an enhanced chemiluminescence (ECL) reagent kit (Millipore) to visualize target protein bands and exposed the membrane to an X-ray film (Fuji).
Statistical analysis
Pooled odds ratios (ORs) and HRs with 95% confidence intervals (CIs) were calculated using STATA 14.2 software (StataCorp LLC., College Station, TX, USA). The Kaplan-Meier curve survival data in the reviewed articles were extracted with Engauge Digitizer 10.0 software. LINC01296 and OS or DFS (RFS) associations were evaluated with fixed- or random-effects models when I2 was >50% or <50%. The HR was considered to be statistically significant if the 95% CI did not overlap 1. We determined publication bias with funnel plots and Begg’s test, and the source of heterogeneity and the stability of results were assessed using sensitivity and subgroup analyses. GraphPad Prism 6 (GraphPad Software, La Jolla, USA) and SPSS 16.0 (IBM, NY, USA) software were used to perform statistical analyses. A Student’s t-test was conducted to determine the difference between two different groups, and the Kruskal–Wallis H test was used to estimate the relationship among three or more groups. All experiments were performed in triplicate, the data are presented as the mean ± standard error of the mean (SEM), and a P<0.05 was considered statistically significant.
Results
Study identification and characteristics
As shown in Figure 1, the published articles and GEO databases, including a total of seven articles17,19,20,21,27,28,29 and 718 patients, were assessed in this meta-analysis. Publications from 2015 to 2018 were included in the study. The sample sizes ranged from 55 to 221, all studies were from China, all studies were of high quality according to the NOS scores, and the characteristics of these studies are summarized in Table 1.
 |
Figure 1 Flow diagram indicating the study selection process. |
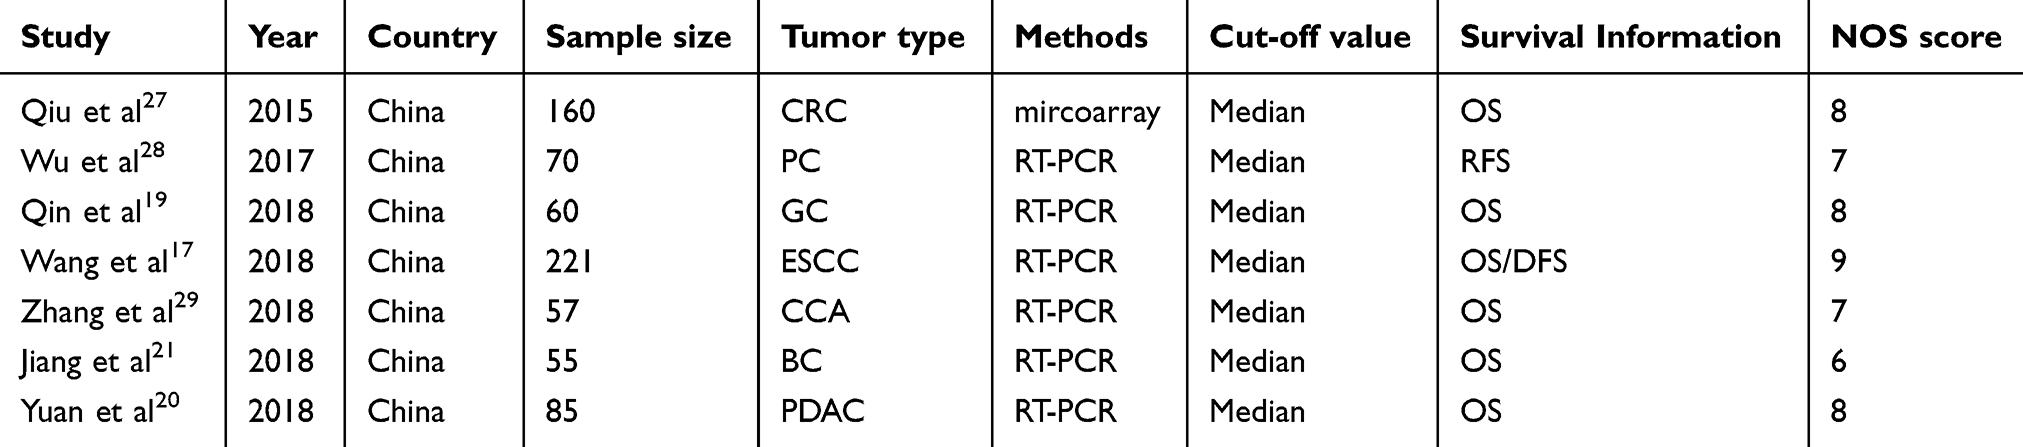 |
Table 1 Characteristics of published articles in the meta-analysis |
As shown in Table 2, 19 GEO databases with 2264 patients were included in this meta-analysis for overall survival (OS), 10 GEO databases with 1568 patients were included for disease-free survival (DFS), and 9 GEO studies with 887 patients were included for recurrence-free survival (RFS). Eleven studies from the USA, 14 studies from Western countries, and six studies from Asia were included in the meta-analysis. Nine different tumor types were included in the meta-analysis, including lung cancer (n=8), colon cancer (n=7), breast cancer (n=7), ovarian cancer (n=3), diffuse large B-cell lymphoma (DLBCL, n=1), chronic lymphocytic leukemia (CLL, n=1), glioblastoma (GBM, n=1), meningioma (n=1), and melanoma (n=1). The characteristics are summarized in Tables 2 and 3.
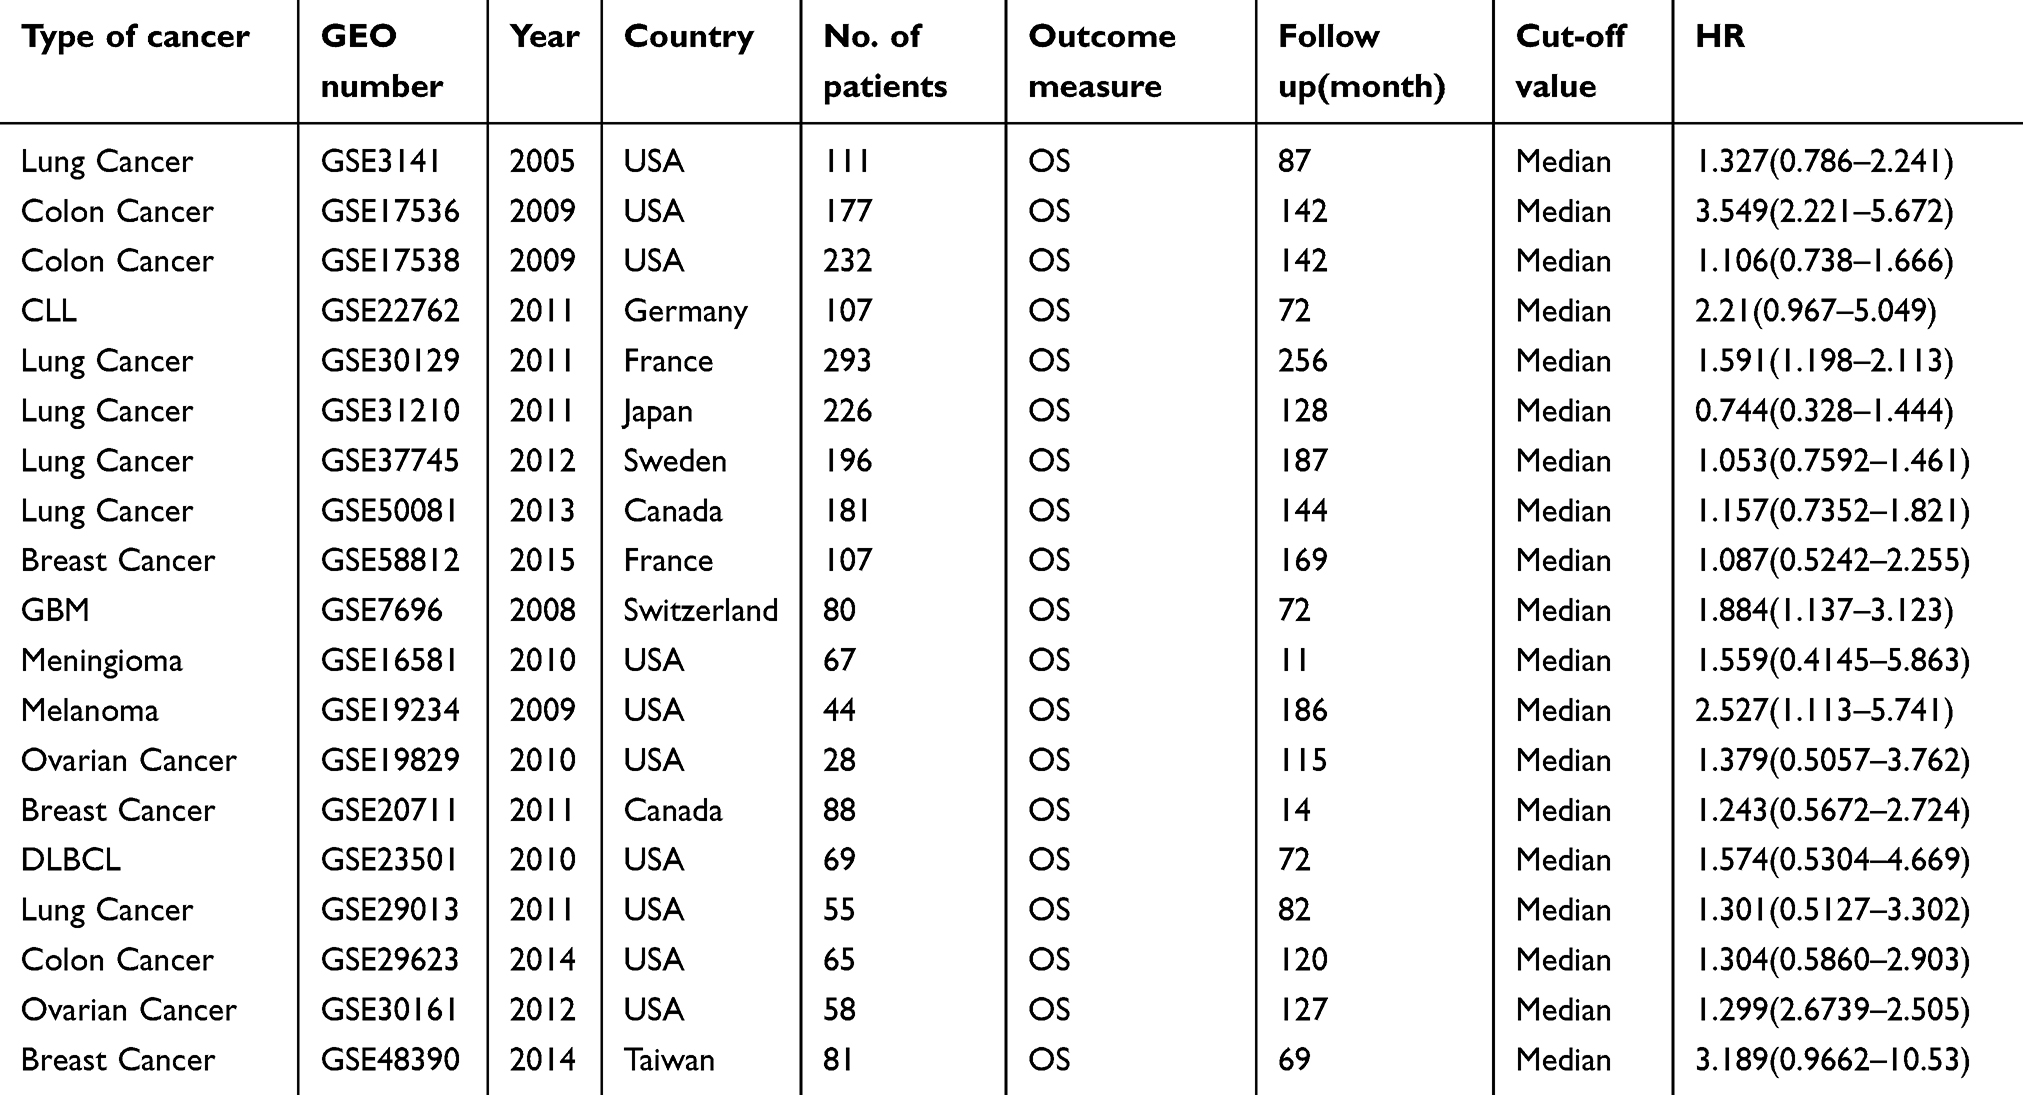 |
Table 2 OS characteristics of studies based on affymetrix human genome U133 Plus 2.0 |
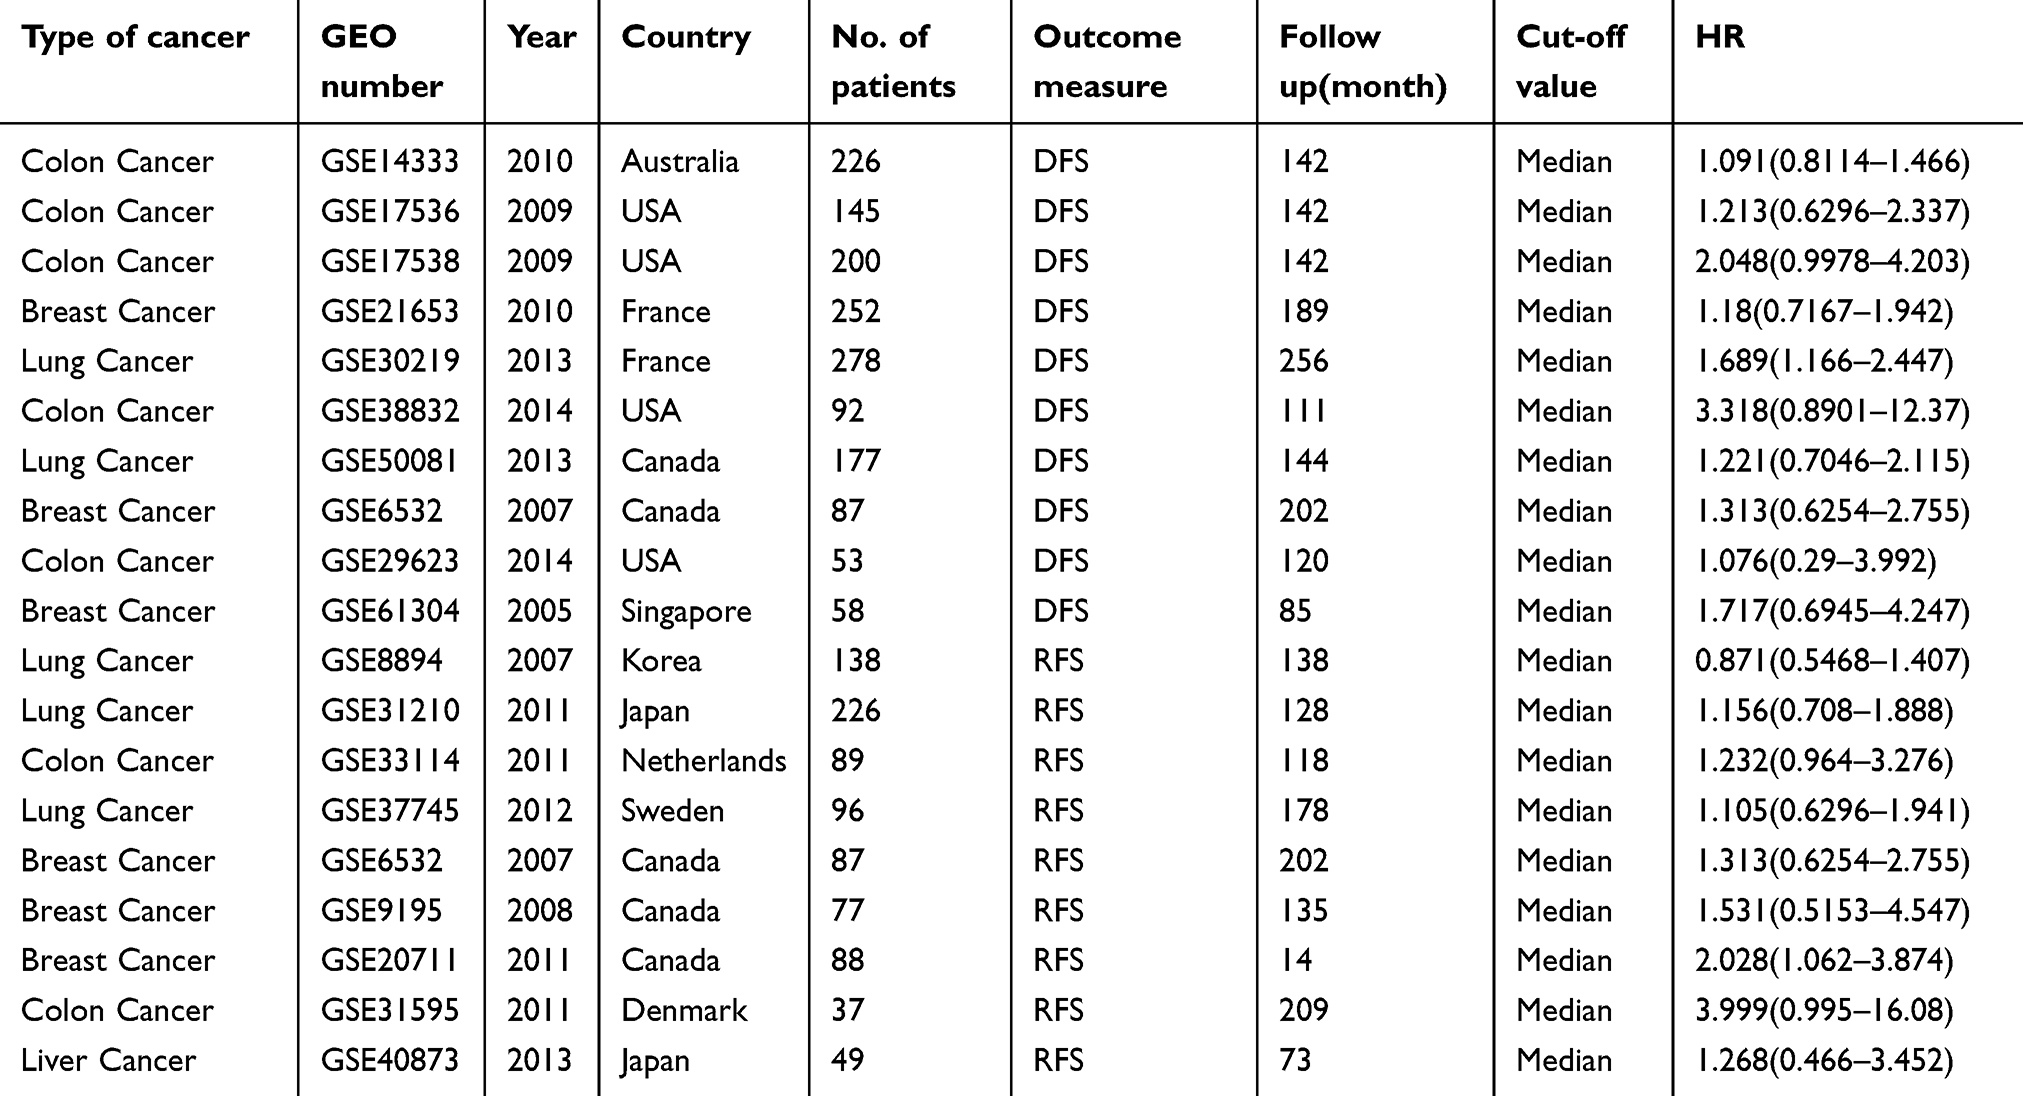 |
Table 3 DFS and RFS characteristics of studies based on affymetrix human genome U133 Plus2.0 |
The association between LINC01296 and the overall survival rate
As shown in Figure 2, 25 studies included 2903 patients with OS recorded according to different LINC01296 expression levels. The fixed-effect model was performed, as there was no significant heterogeneity, and the pooled HRs indicated that the high LINC01296 expression correlated with poor survival (HR=1.33, 95% CI=1.17, 1.50, P<0.01, fixed effect, Figure 2).
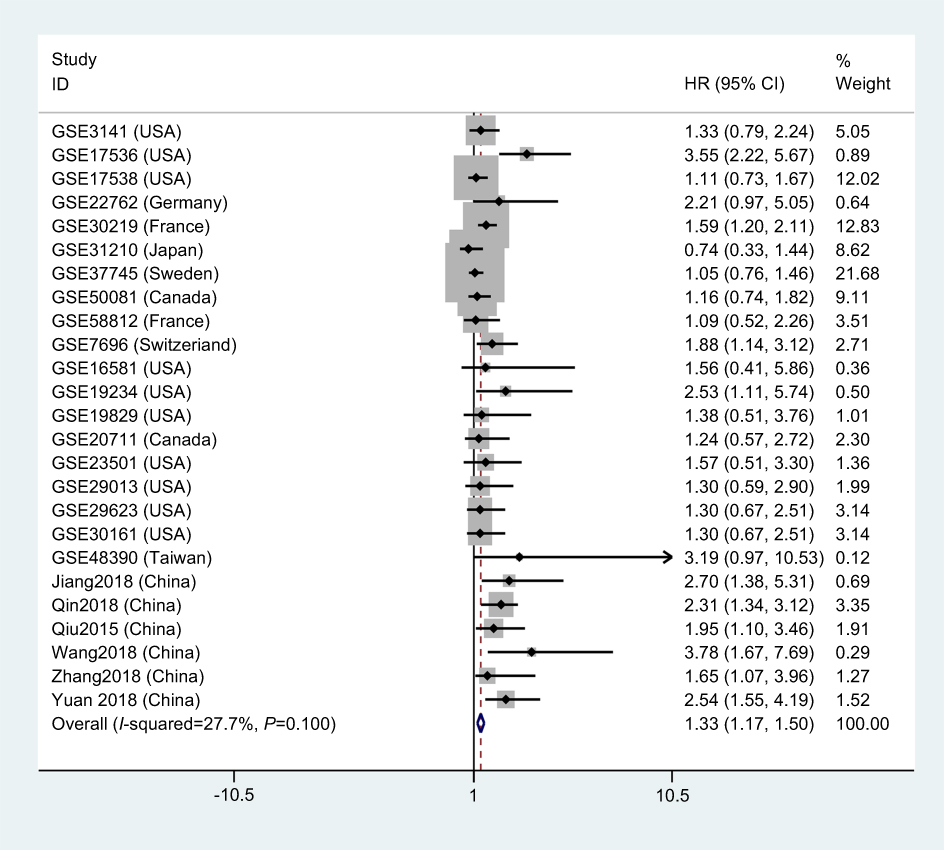 |
Figure 2 A forest plot of studies that evaluates the relationship between LINC01296 expression and overall survival (OS). |
Next, we performed subgroup analyses according to the data source, land region, cancer type, and sample size to analyze the source of heterogeneity, as shown in Figure 3 and Table 4. For studies evaluating OS with different data sources, the pooled HRs indicated that increased LINC01296 expression could estimate the worst outcomes of the published articles (high: low: HR=2.26, 95% CI=1.72, 2.80, P<0.05, Figure 3A). The subgroup analysis indicated that similar results were obtained for all of the regions examined (USA, high: low: HR=1.33, 95% CI=1.03, 1.64, P<0.05, Figure 3B), (Western, high: low: HR=1.27, 95% CI=1.04, 1.49, P<0.05, Figure 3B), (Asia, high: low: HR=1.53, 95% CI=1.14, 1.91, P<0.05, Figure 3B). Interestingly, when we performed subgroup analyses based on the tumor type, increased LINC01296 expression was related to poor OS only in tumors of the digestive (high: low: HR=1.95, 95% CI=1.35, 2.55, P<0.05, Figure 3C) and nervous systems (high: low: HR=1.94, 95% CI=1.07, 2.80, P<0.05, Figure 3C); however, LINC01296 expression was not related to OS in tumors of the respiratory tracts, female reproductive systems, and a few other tumor types, which indicated that LINC01296 expression could have different roles in various cancers. Additionally, the subgroup analysis broken down by sample size showed that both subgroups exhibited similar results (Figure 3D). Also, the subgroup heterogeneity analysis was significant in the Asian and digestive system groups, which indicated that the OS heterogeneity could be caused by tumor type and land region.
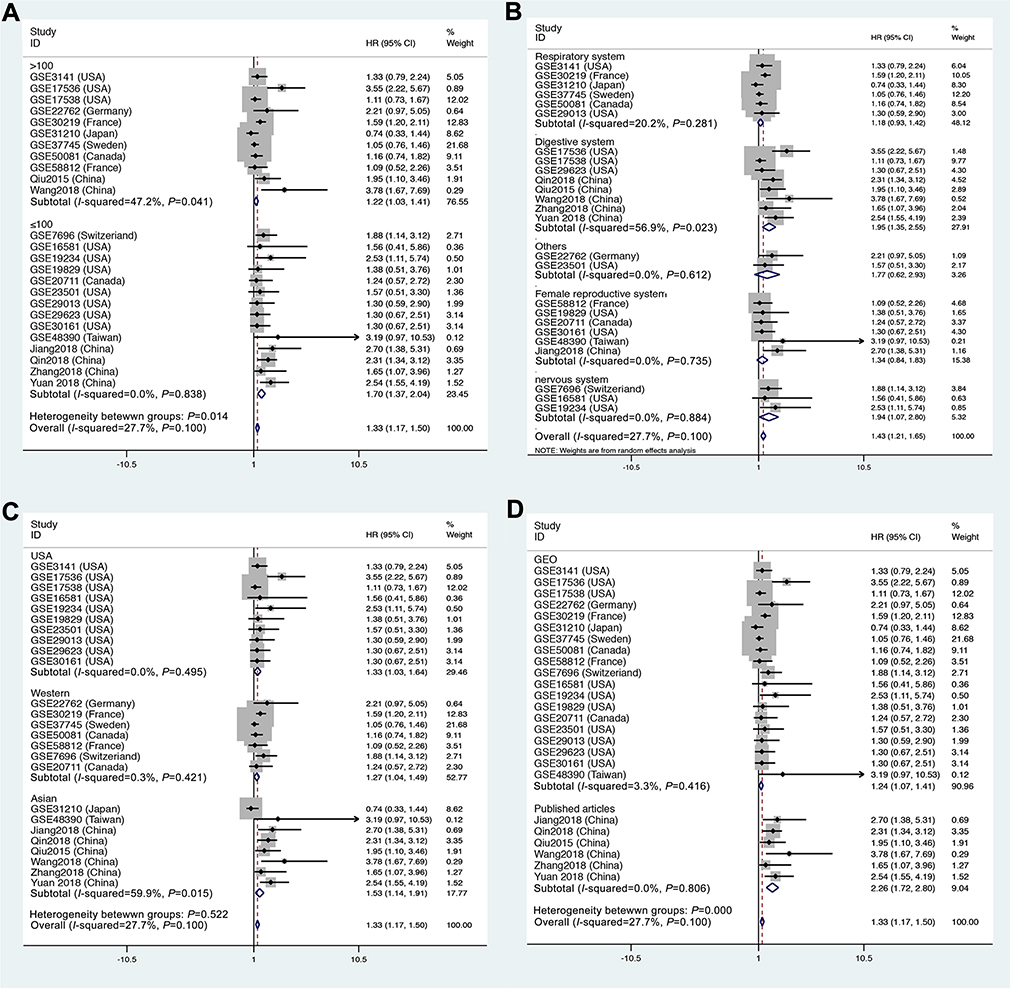 |
Figure 3 Forest plots of the overall survival (OS) subgroup analysis: subgroup analysis by (A) sample size, (B) tumor type, (C) land region, and (D) source. |
 |
Table 4 Subgroup analysis of overall survival by data source, region, tumor type, sample size |
We also performed a sensitivity analysis (Figure 4A) and Begg’s test (Figure 4B, p=0.455) to explore the robustness of the pooled results and publication bias. The analyses indicated that the results were reliable, and there was no publication bias.
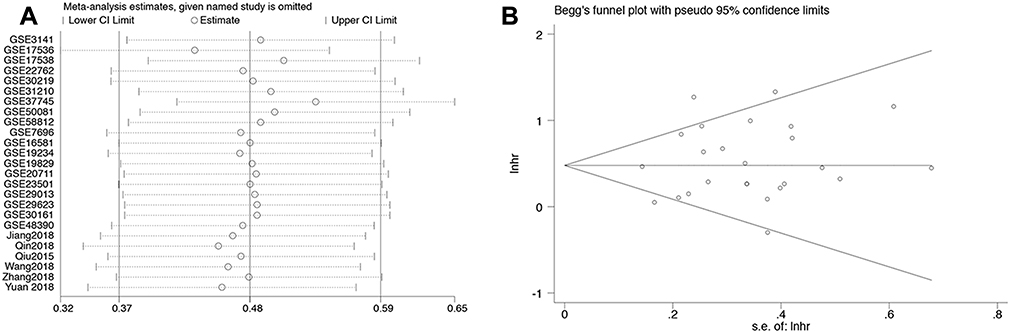 |
Figure 4 (A) A Begg’s publication bias plot and (B) sensitivity analysis for overall survival. |
Association between LINC01296 and the disease-free (recurrence-free) survival rate
We also assessed the relationship between LINC01296 expression and the disease-free rate (DFS). Eleven studies containing 1889 patients were included in this meta-analysis, and the pooled results indicated that the expression of LINC01296 was related to poor DFS (high: low: HR=1.25, 95% CI=1.03, 1.48, p<0.05, Figure 5A). However, ten studies with 957 patients showed that LINC01296 expression and recurrence-free survival rate (RFS) were not significantly associated (high: low: HR=1.10, 95% CI=0.83, 1.37, p<0.05, Figure 5B). Additionally, the sensitivity analysis (Figure 5C and D) indicated that the results were reliable and that there was no publication bias (Figure 5E and F).
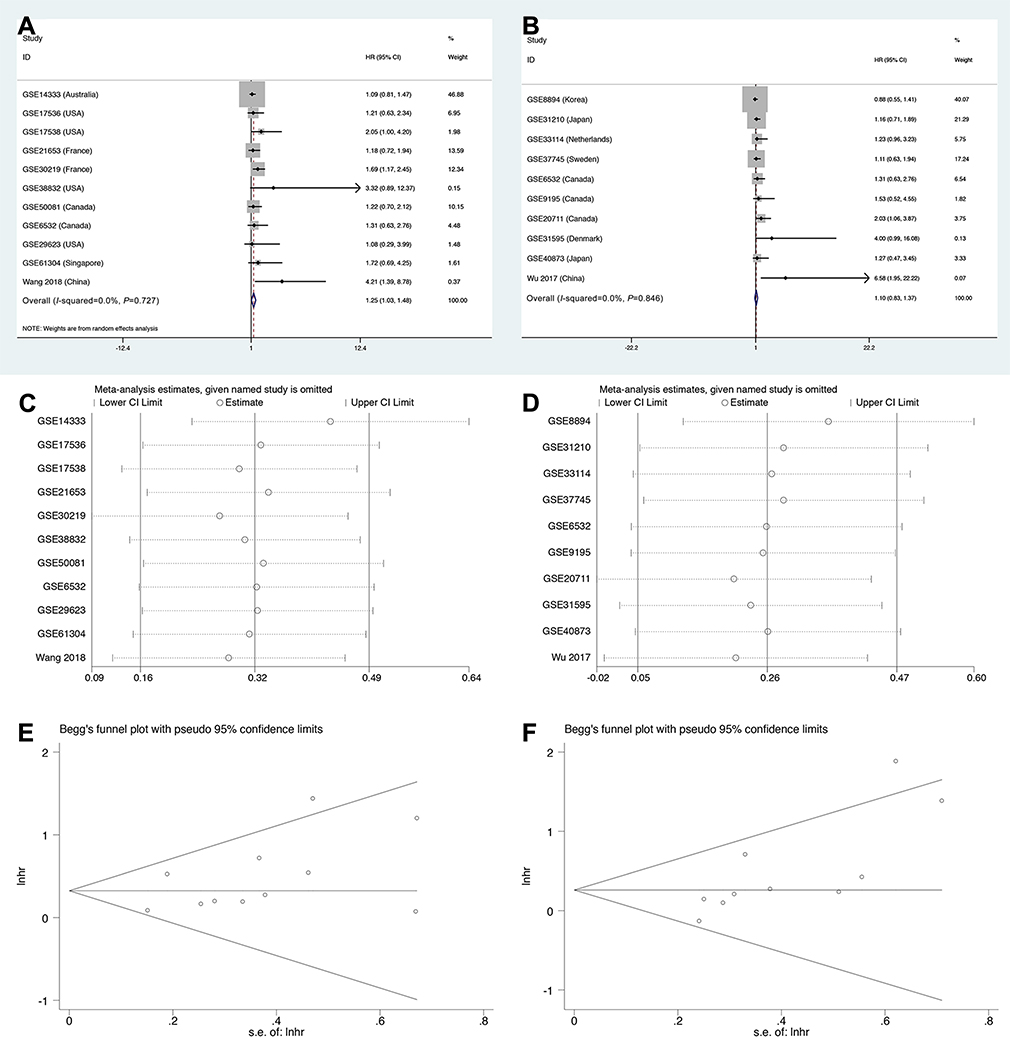 |
Figure 5 Forest plots, sensitivity, and Begg’s publication bias plots regarding studies where the relationship between LINC01296 expression and (A, C, E) disease-free survival (DFS) rates, and (B, D, F) recurrence-free survival were investigated. |
Validation of the cancer genome atlas dataset results
Next, we examined LINC01296 expression in all cancer types in the TCGA dataset. As shown in Figure 6A, LINC01296 was also overexpressed in bladder urothelial carcinoma (BLCA), head and neck squamous cell carcinoma (HNBC), cholangiocarcinoma (CHOL), esophageal carcinoma (ESCA), kidney renal clear cell carcinoma (KIRC), lung adenocarcinoma (LUAD), stomach adenocarcinoma (STAD), liver hepatocellular carcinoma (LIHC), lung squamous cell carcinoma (LUSC), and uterine corpus endometrial carcinoma (UCEC) with a |log2FC| cutoff >1, and a q-value <0.01. We merged the expression data and DFS data of several cancer types including digestive, respiratory, female reproductive, blood, and urinary systems with a total of 9502 patients that were divided into high- or low-expressing groups according to LINC01296 expression. The results indicated that LINC01296 expression was correlated with poor OS (Figure 6B) and DFS (Figure 6C).
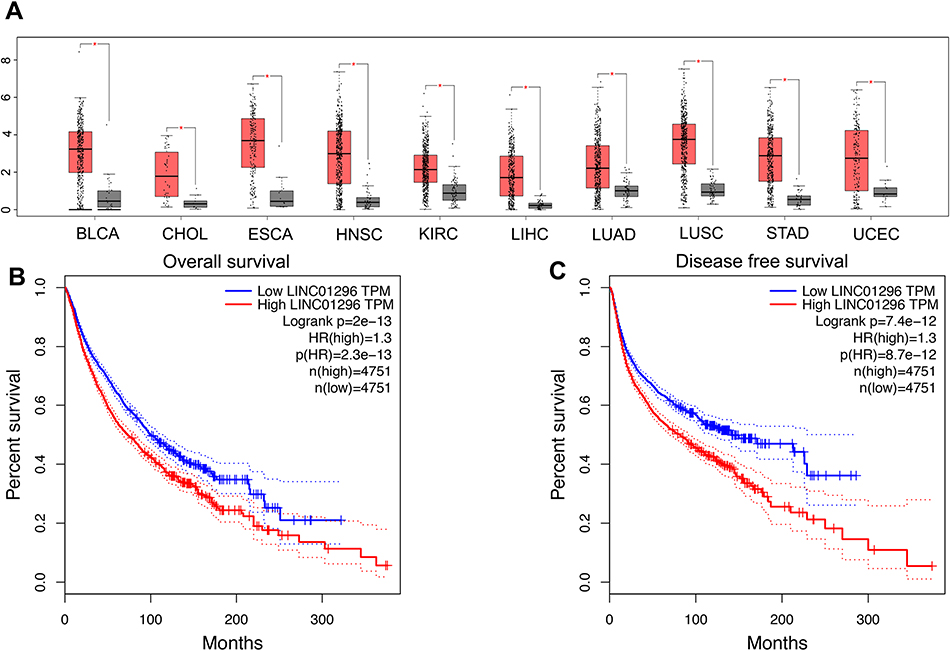 |
Figure 6 Validation of LINC01296 expression in The Cancer Genome Atlas (TCGA) cohort. (A). LINC01296 expression in bladder urothelial carcinoma (BLCA), cholangiocarcinoma (CHOL), esophageal carcinoma (ESCA), head and neck squamous cell carcinoma (HNBC), liver hepatocellular carcinoma (LIHC), lung adenocarcinoma (LUAD), kidney renal clear cell carcinoma (KIRC), lung squamous cell carcinoma (LUSC), stomach adenocarcinoma (STAD), and uterine corpus endometrial carcinoma (UCEC). “*” indicates a log2FC value >1 and a P-value <0.01 in the TCGA cohort. (B) Overall survival plots of LINC01296 expression in the TCGA cohort (n=9502, log-rank P<0.01). (C) Disease-free survival plots of LINC01296 expression in the TCGA cohort (n=9502, log-rank P<0.01). |
We also explored the prognostic role of LINC01296 in different tumor types. As shown in Figure S1, LINC01296 expression was associated with poor OS in gastrointestinal (GI) (Figure S1A), hepatobiliary and pancreatic (Figure S1C), urinary (Figure S1E), female reproductive (Figure S1G), and head and neck (Figure S1I) cancers; however, LINC01296 expression was not correlated with OS in cancers of the respiratory tract (Figure S1K). LINC01296 expression also indicated poor DFS in GI (Figure S1B), urinary (Figure S1F), female reproductive (Figure S1I), and head and neck (Figure S1J) cancers; however, LINC01296 expression was not related to DFS in hepatobiliary, pancreatic (Figure S1D), and respiratory tumors (Figure S1L).
The clinicopathologic significance of LINC01296 in hepatocellular carcinoma
Several studies have examined LINC01296 expression in cancer. In the current study, we assessed the prognostic role of LINC01296 in various tumors. Because the underlying mechanism of LINC01296 in HCC has not been identified, we explored the clinicopathologic significance of LINC01296 in HCC based on the TCGA database and elucidated its functions using bioinformatics and in vitro validation.
First, we analyzed the relationships between LINC01296 expression and the clinicopathologic characteristics of HCC in the TCGA database. As shown in Table 5, LINC01296 was overexpressed in tumor tissues compared with normal tissues. Next, we divided LINC01296 expression into high and low groups according to the median expression. However, the results showed that LINC01296 expression was not related to gender, age, pathologic stage, tumor size, or differentiation grade.
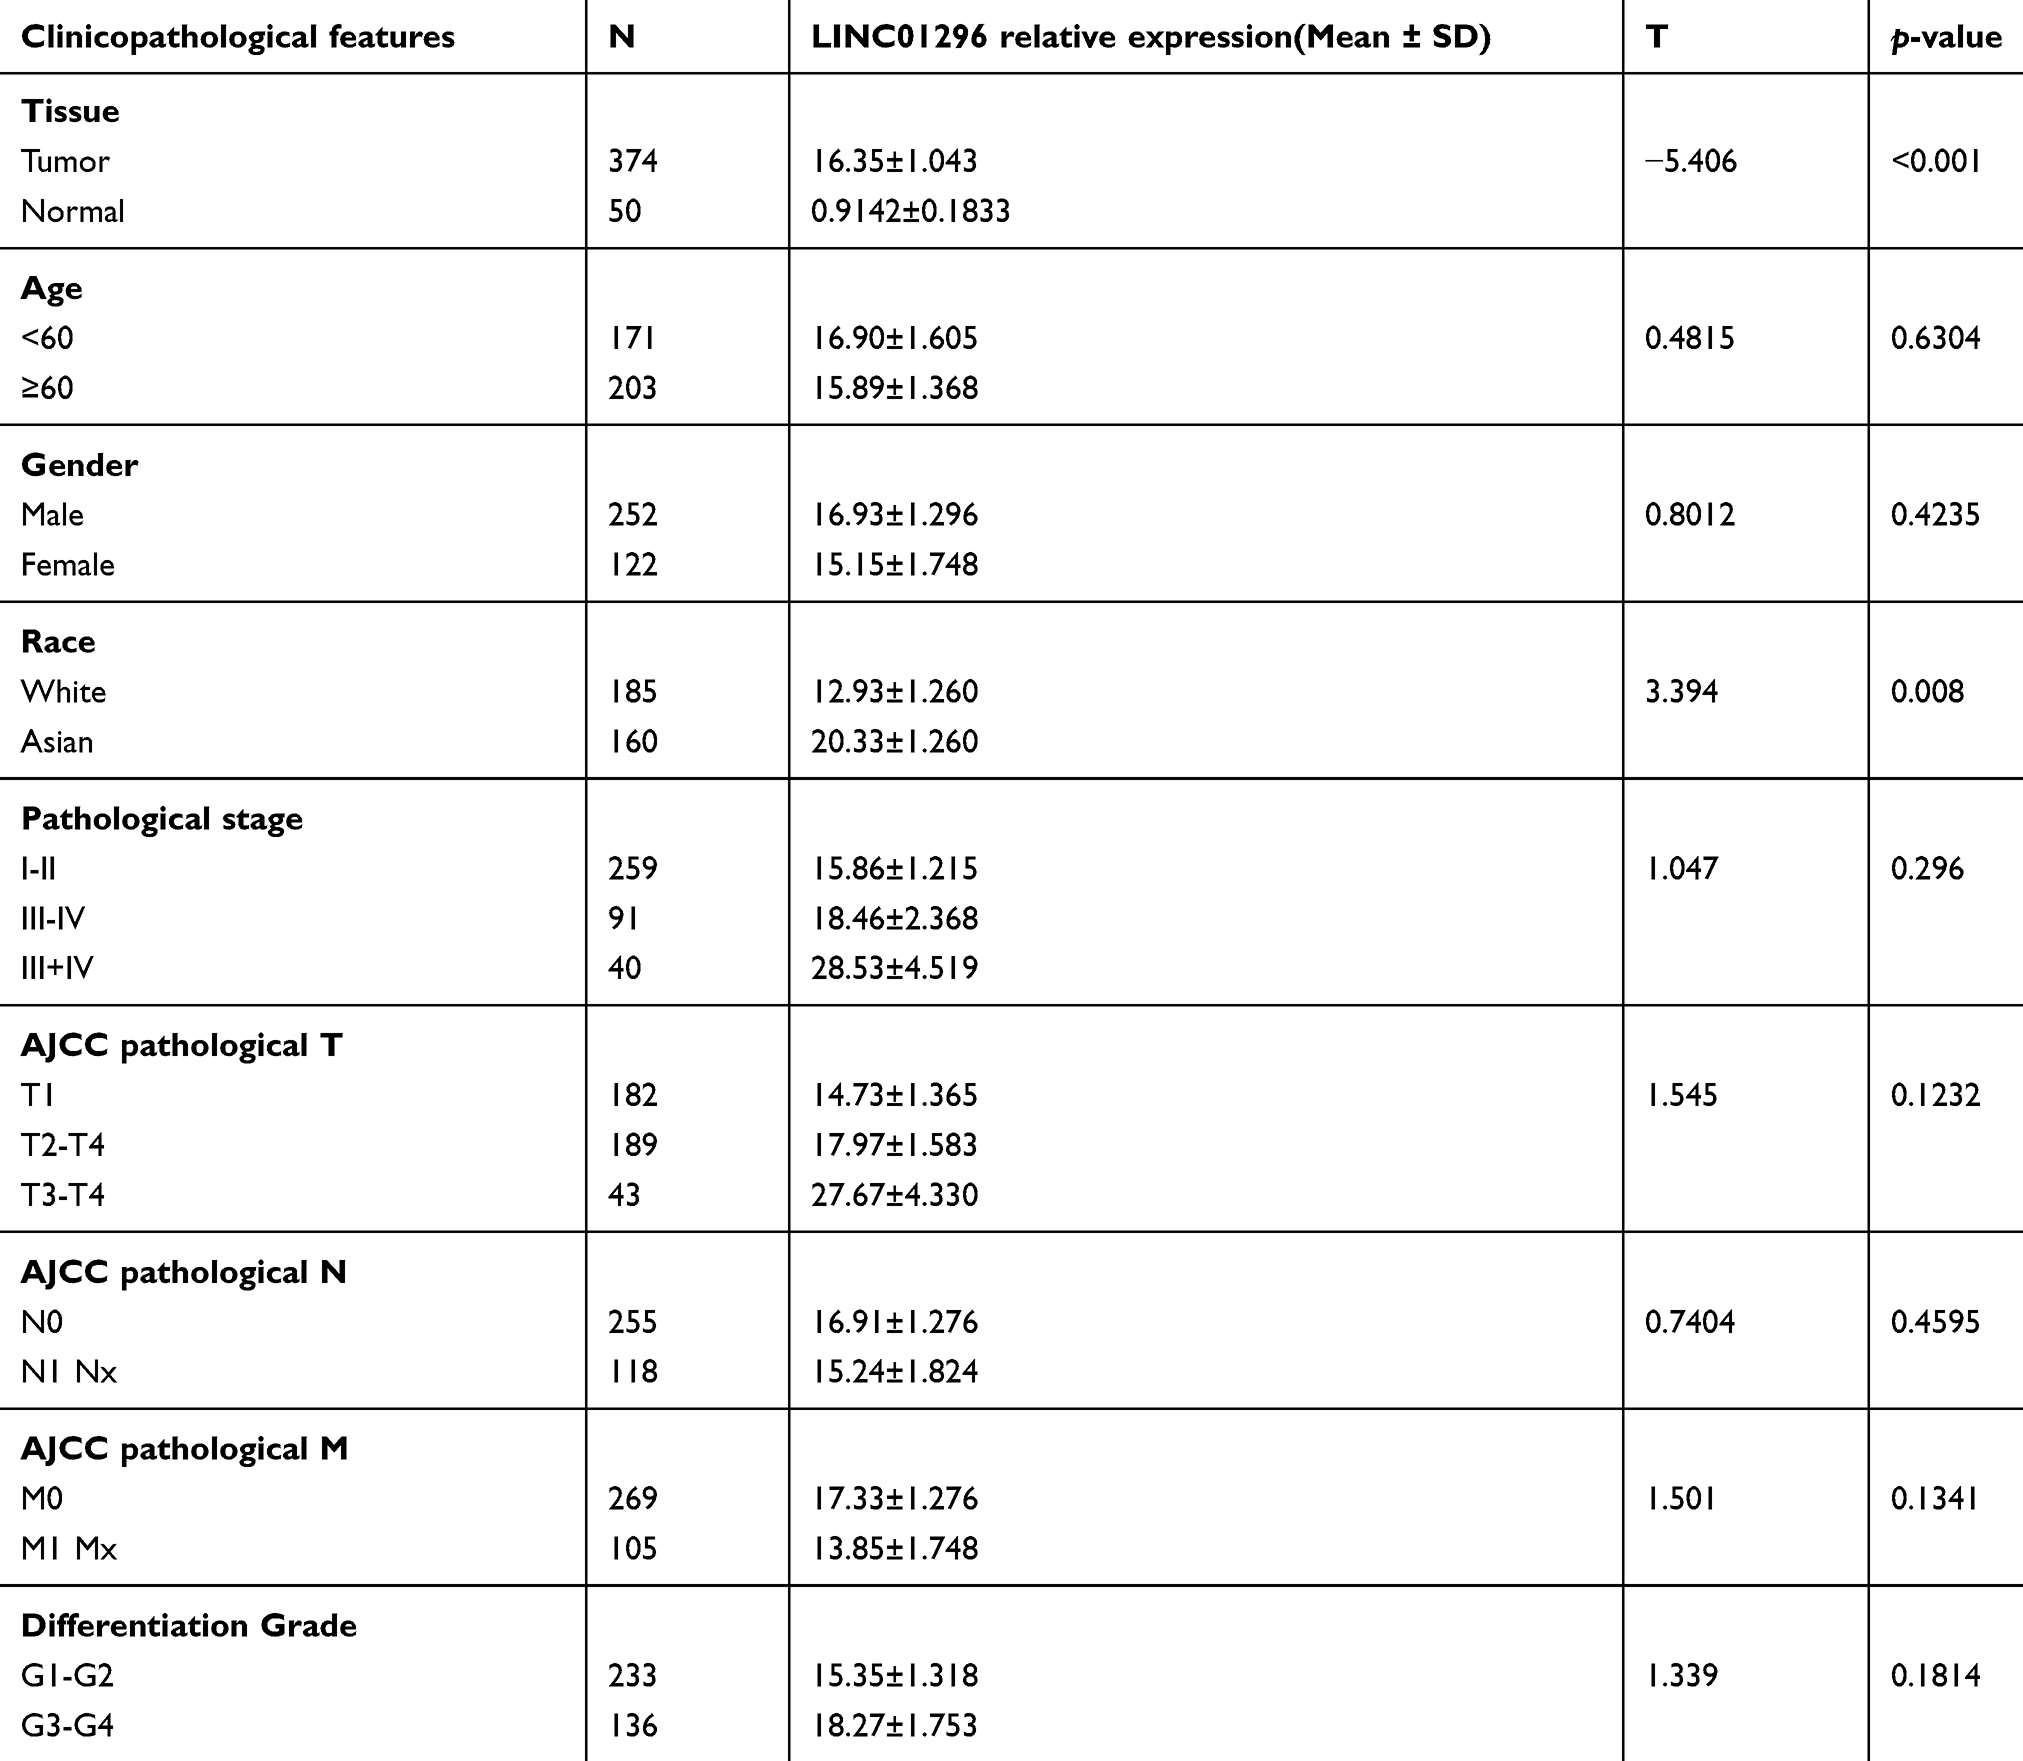 |
Table 5 Expression of LINC01296 and clinicopathological parameters in HCC |
Identification of linc01296-related genes in hepatocellular carcinoma with GO enrichments, KEGG pathway analyses, and protein-protein interaction (PPI) networks
To explore the potential LINC01296 mechanisms involved in HCC, we used two independent programs that could identify LINC01296-related genes, including the Multi Experiment Matrix (MEM) and lncRNA-related protein-coding genes (corlncRNA) using the R software package. There were 1128 LINC01296-related genes in the Multi Experiment Matrix when we set the score at 10−8, and the number of corlncRNAs was 1804. The Venn diagram is shown in Figure 7A, which shows that it was noted that 394 genes were LINC01296-related genes in HCC.
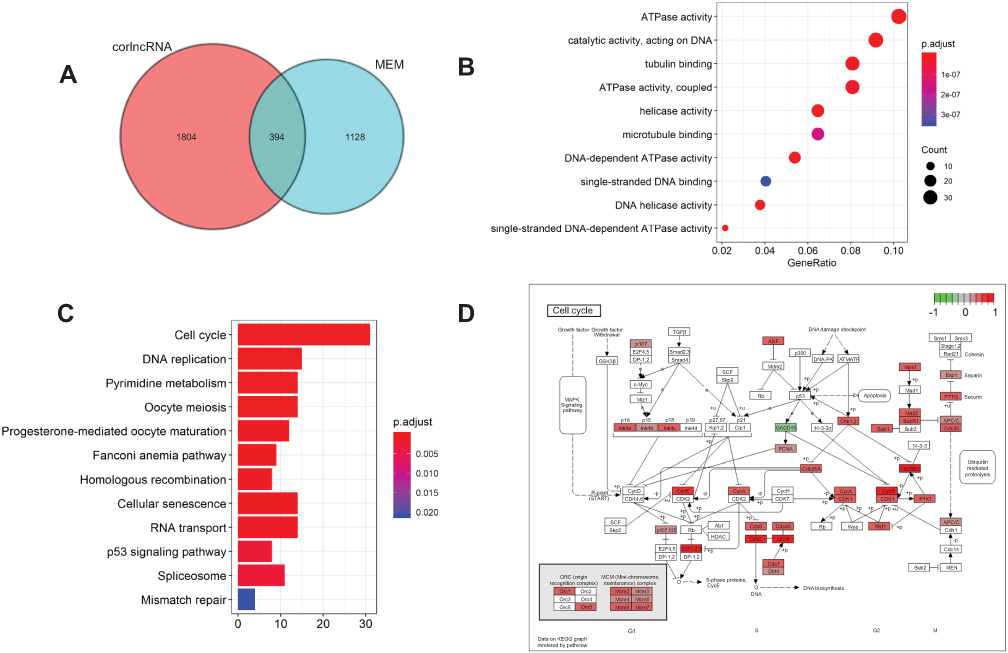 |
Figure 7 The enriched annotation pathway analysis of potential genes targeted by LINC01296 in HCC. (A) A Venn diagram that shows overlap between the number of predicted target genes using the Multi Experiment Matrix (MEM) and lncRNA-related protein-coding genes (corlncRNA) and the R software package. (B) The significantly enriched annotation of the Gene Ontology (GO) categories. (C) The significantly enriched annotation of the KEGG pathway analysis. (D) The KEGG pathway map illustrating the cell cycle signaling pathway in humans as determined with the DAVID 6.8 database (https://david.ncifc rf.gov/). |
We performed GO analysis using the R software package based on DAVID (https://david.ncifcrf.gov/summary.jsp, version 6.8), where ten of the most significant biologic processes are summarized as having ATPase- and DNA-related functions (Table 6 and Figure 7B). Next, we conducted KEGG pathway analyses, and the ten most significant signaling pathways were identified that included cell cycle, DNA replication, and the p53 signaling pathway (Table 7 and Figure 7C). The most enriched signaling pathway was the KEGG pathway of the cell cycle, and related genes are shown in Figure 7D.
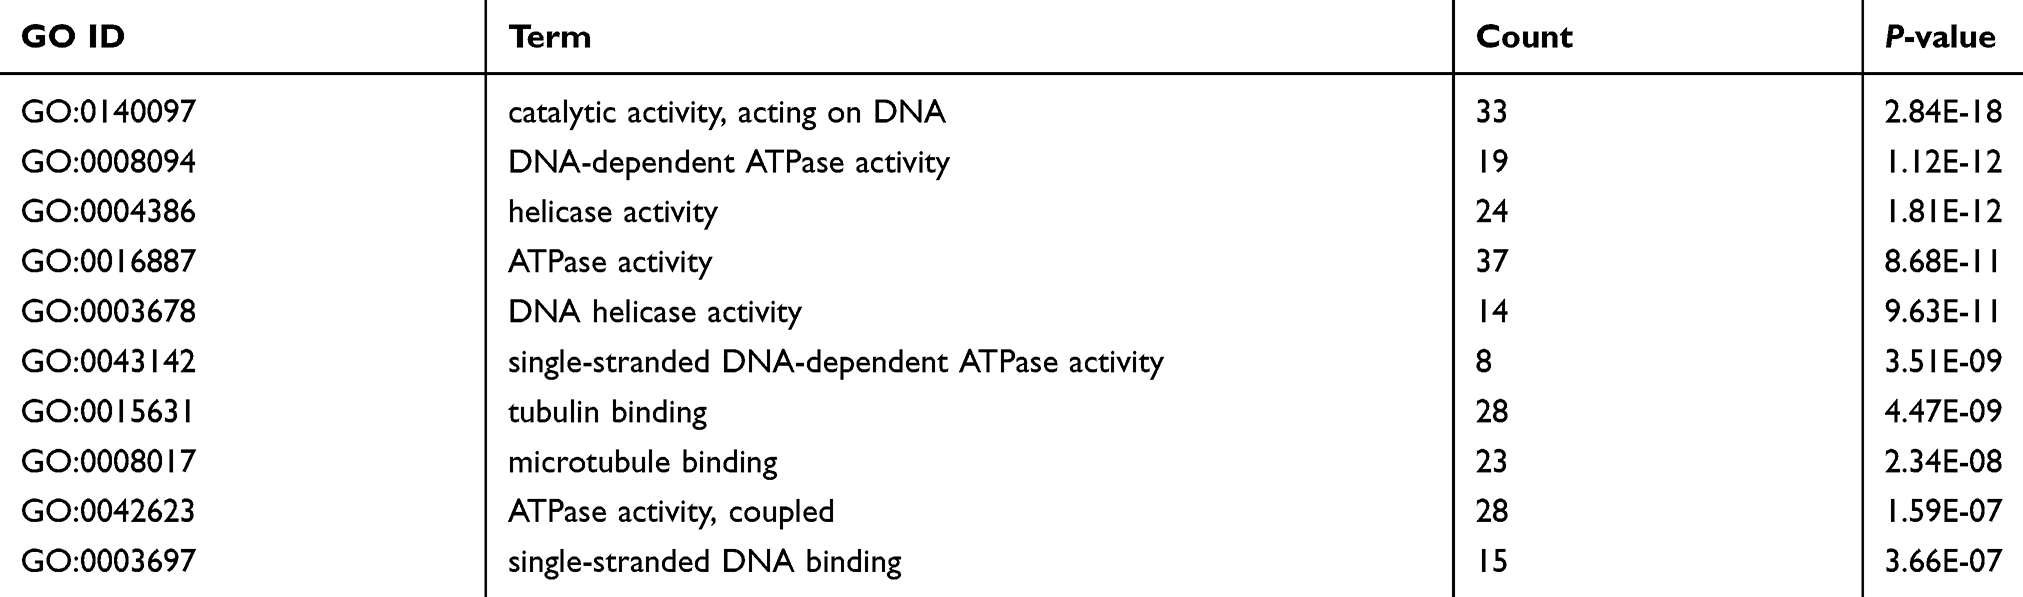 |
Table 6 The GO analysis of predicted target genes of LINC01296 |
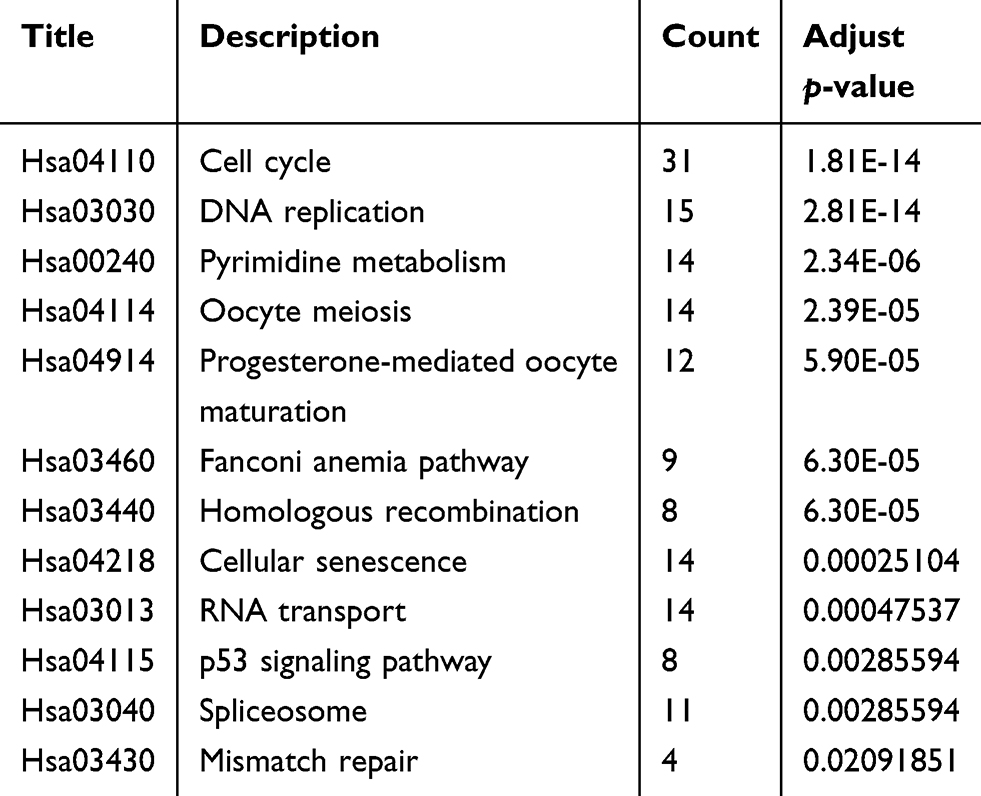 |
Table 7 Pathway analysis of the predicted target genes of LINC01296 in HCC |
We also conducted a BINGO analysis on the 394 LINC01296-related genes that included three parts: a biological process, a cellular component, and a molecular function. As shown in Figure S2–S4, the LINC01296-related genes were enriched in the cell cycle, cell cycle processes, and cellular proliferation.
Furthermore, we performed protein-protein interactions and selected several hub genes using MCODE with Cytoscape 3.0. First, we selected 114 hub genes, for which the PPI of these genes is shown in Figure S5. Then, we identified 20 hub genes including BUB1, CDKN3, TOP2A, CCNB2, DLGAP5, TTK, ASPM, PBK, MEKL, CEP55, BUB1B, CCNB1, EXO1, and ZWINT (Figure 8), for which the relationships between LINC01296 and gene expression for some of these genes are shown in Figure 9 and include ASPM (Figure 9A), BUB1 (Figure 9B), CCNA2 (Figure 9C), CDK1 (Figure 9D), CEP55 (Figure 9E), and CLGAP5 (Figure 9F).
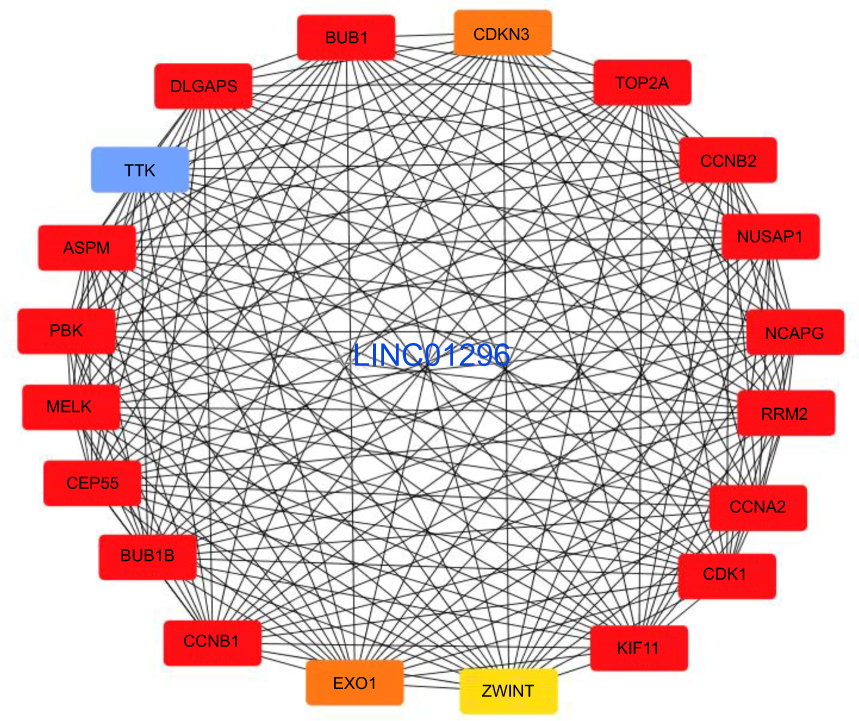 |
Figure 8 The selected LINC01296 hub-related genes. |
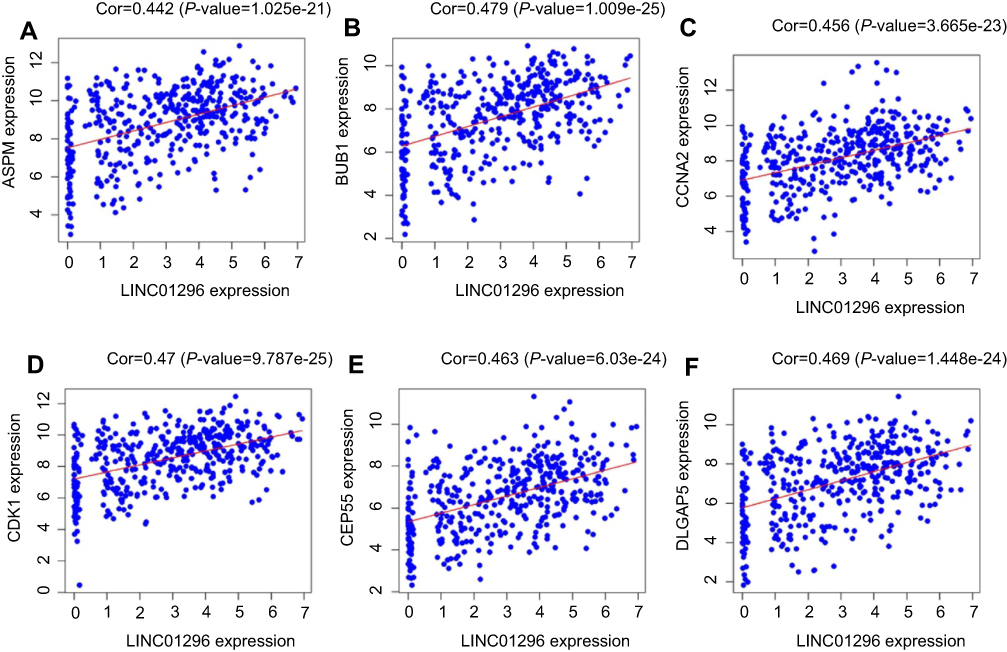 |
Figure 9 Correlation analysis between LINC01296 expression and the hub genes using Pearson’s correlation analysis in The Cancer Genome Altas (TCGA). (A) ASPM, (B) BUB1, (C) CCNA2, (D) CDK1, (E) CEP55, and (F) DLGAP5. |
LINC01296 downregulation suppresses cell proliferation, invasion, and migration of several hepatocellular carcinoma cell lines
We next explored the molecular mechanisms of LINC01296 in HCC cell lines. For these experiments, we examined LINC01296 expression in six HCC cell lines (HepG2, SMCC7721, MHCC97H, BEL-7402, Hep3B, and Huh-7) and a normal liver cell line (LO-2) using qRT-PCR. As shown in Figure 10A, LINC01296 expression in HCC cell lines was significantly higher compared with that of the LO-2 cell line (P<0.05), and LINC01296 expression was highest in the MHCC97H and Hep 3B cell lines. Therefore, we used the MHCC97H and Hep3B cell lines for the subsequent experiments. We transfected two interfering oligonucleotides to downregulate LINC01296 expression in MHCC97H and Hep3B cells, and as shown in Figure 10B, LINC01296 expression was significantly decreased compared with the LO-2 cell line.
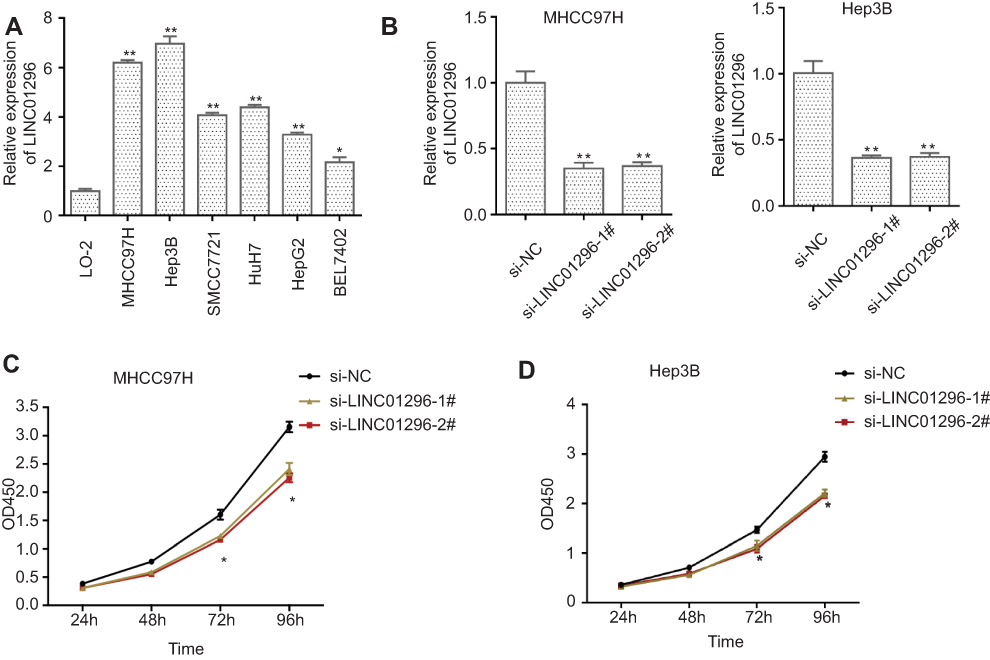 |
Figure 10 (A) LINC01296 expression in different HCC cell lines and the normal liver cell line, LO-2, was measured using qRT-PCR, (B) MHCC97H and Hep 3B cells were transfected with siRNA(si)-negative control (NC), si-LINC-01296–1#, and si-LINC01296-2#, and the CCK-8 assay was performed in (C) MHCC97H and (D) Hep 3B cells. Notes: *P<0.05, **P<0.01. |
The CCK-8 assay indicated that LINC01296 downregulation inhibited proliferation of the HCC cell lines (Figure 10C and D), which demonstrated that LINC01296 promoted the proliferation of the HCC cell lines.
LINC01296 downregulation suppressed the ability of the HCC cells to migrate as shown by the wound healing assay (Figure 11A). The Transwell assay indicated that silencing LINC01296 inhibited invasion by the HCC cell lines (Figure 11B). Overall, these functional experiments revealed that when LINC01296 was downregulated, cell proliferation, invasion, and migration of the HCC cell lines were inhibited.
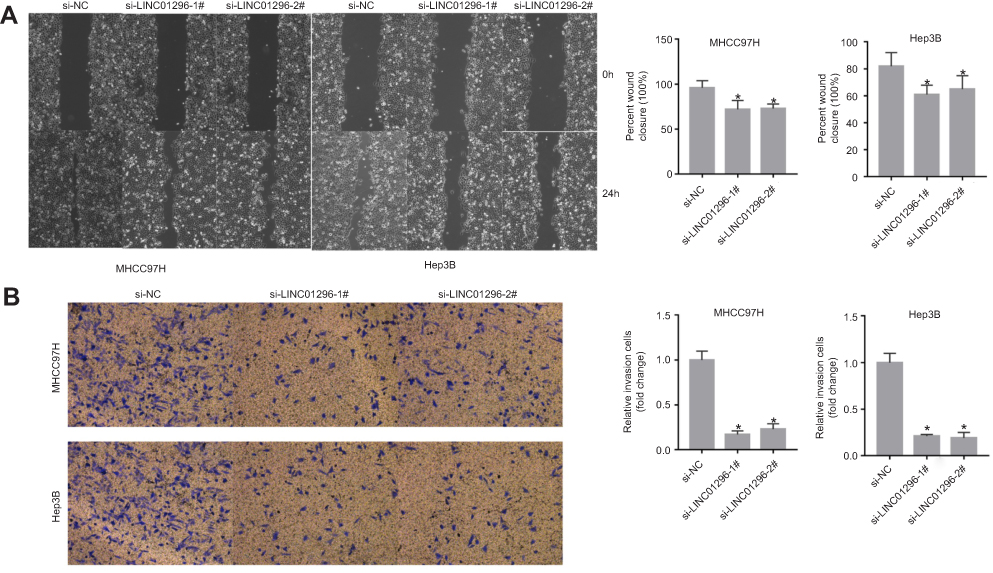 |
Figure 11 LINC01296 knockdown inhibited the migration and invasion of MHCC97H and Hep 3B cells. (A) Cell migration was determined by wound healing assays in MHCC97H and Hep 3B cells transfected with Si-NC, Si-LINC01296-1, and Si-LINC01296-2. (B) Cell invasion was determined in MHCC97H and Hep 3B cells transfected with siRNA (si)-negative control (NC), si-LINC01296-1# and si-LINC01296-2# by Transwell invasion assays. The data are presented as the mean ± standard deviation. *P<0.05. |
LINC01296 downregulation increased apoptosis and inhibited cell cycle progression in HCC cell lines
To identify the effect of LINC01296 on apoptosis and the cell cycle in HCC cell lines, flow cytometry was performed. A proportion of apoptotic cells in the LINC01296 knockdown groups was shown to be markedly increased compared with that of the control group (Figure 12A). Moreover, the number of cells in the G0/G1 phase of the cell cycle increased in LINC01296-downregulated groups compared with that of the control group (Figure 12B). Overall, these results showed that LINC01296 downregulation promoted apoptosis of HCC cell lines and arrested the cells in the G0/G1 phase of the cell cycle.
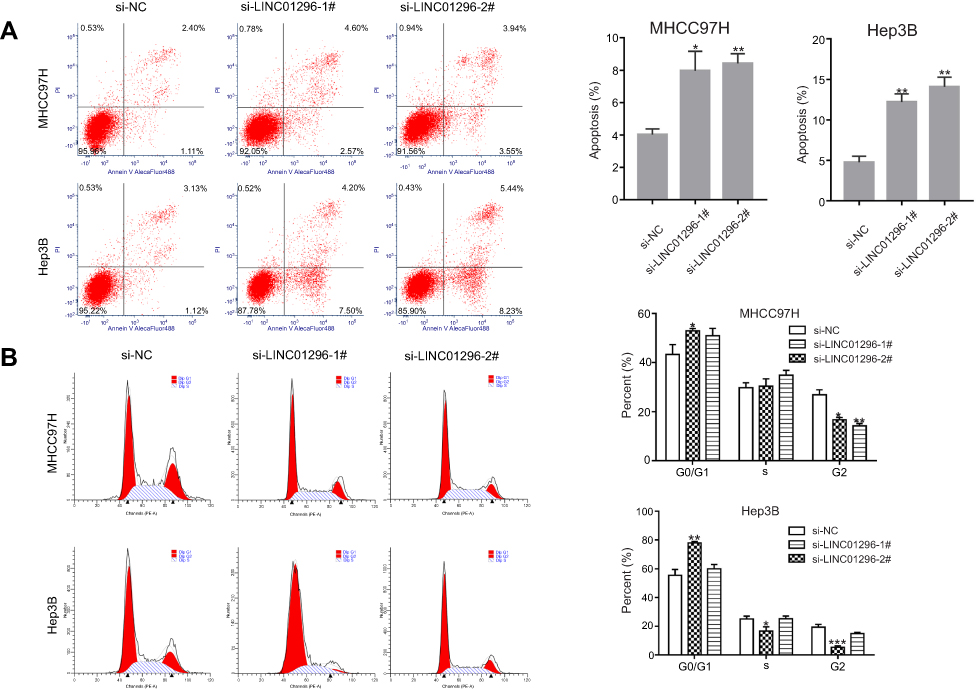 |
Figure 12 LINC01296 knockdown promoted cellular apoptosis. (A) Cellular apoptosis was measured in MHCC97H and Hep3B cells transfected with SiRNA (Si)-negative control (NC), si-LINC01296-1# or si-LINC01296-2# by staining with Annexin V/PI. (B) The cell cycle distribution was determined with flow cytometry. The data are presented as the mean ± standard deviation. *P<0.05, **P<0.01, and ***P<0.001 vs Si-NC. |
CCNA2, CDK1, and BUB1 act as LINC01296 gene targets
The bioinformatic analysis revealed that CCNA2, CDK1, and BUB1 were the LINC01296 hub related genes. Because the Pearson’s correlation analysis showed that CCNA2, CDK1, and BUB1 were also significantly related to LINC01296 expression, we performed Western blot analysis to confirm these findings. The results are shown in Figure 13, and reveal that LINC01296 downregulation suppressed CDK1, BUB1, and CCNA2 expression, which indicated that these genes were likely LINC01296 target genes.
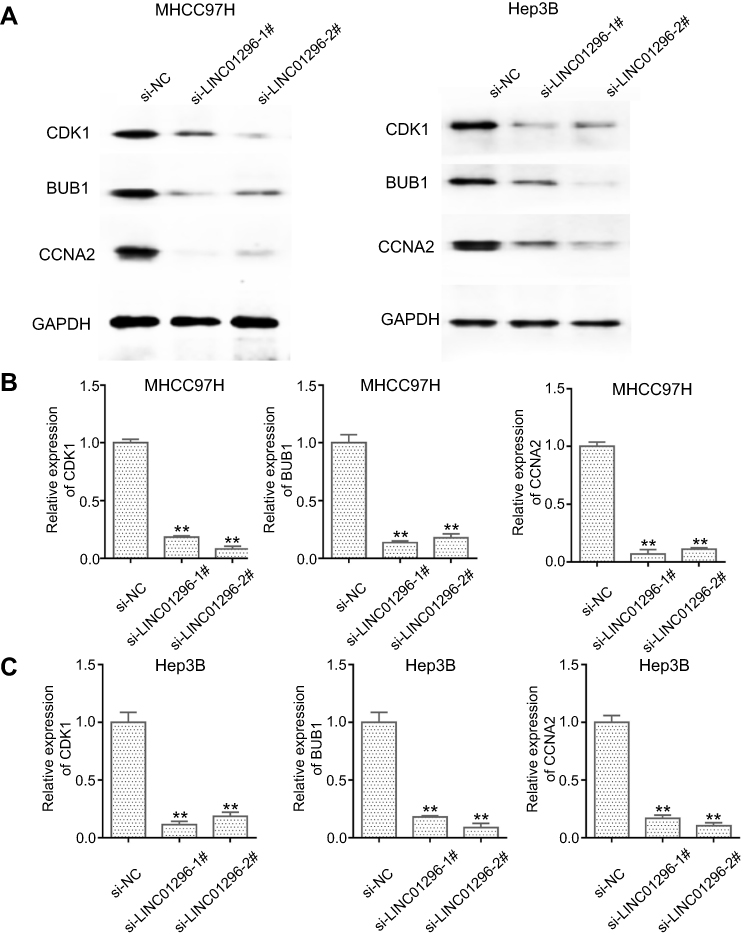 |
Figure 13 LINC01296 downregulation suppressed CDK-1, BUB1, and CCNA-2 expression. (A) CDK1, BUB1, CCNA2, and GAPDH expression in MHCC97H and Hep 3B cells, whose gene expression was silenced with siRNA (si)-negative control (NC), si-LINC01296-1, and si-LINC01296-2, was measured using Western blot. (B and C). The ratio of each protein to GAPDH in MHCC97H and Hep 3B cells is shown. **P < 0.01 |
Discussion
In this study, we performed a comprehensive analysis including data mining, meta-analysis, bioinformatics, and in vitro validation analyses. First, we conducted a meta-analysis by combining published articles and GEO datasets. The pooled results of the meta-analysis indicated that LINC01296 expression was associated with a poor OS and DFS; however, no significant relationship between LINC01296 and RFS was found. The results of TCGA were consistent with the meta-analysis, which again showed that LINC01296 expression was related to poor OS and RFS in different tumor types.
Our meta-analysis had several limitations. First, there were some inconsistencies between the meta-analysis and TCGA dataset analysis, and this may be caused by different regions and races. Second, published studies included in the meta-analysis reported positive results, and there may be some unpublished articles with negative results, which could cause publication bias. Third, the heterogeneity of the OS subgroup analysis regarding the Asian population and digestive system groups were significant, indicating that heterogeneity could be caused by region and tumor type. Fourth, the follow-up time, race, land region, and sample size from the included articles were heterogeneous, indicating that additional studies with identical ethnic groups, regions and follow-up times are needed.
Recently, several studies demonstrated that aberrant LINC01296 expression plays a critical role in the biological processes of cancer progression and development. In prostate cancer, Wu et al reported that knockdown of LINC01296 expression inhibited cell proliferation, migration, and invasion of a prostate cancer cell line through the regulation of PI3K-Akt-mTOR signaling and the epithelial-mesenchymal transition.28 In gastric cancer, Qin et al indicated that LINC01296 had an oncogenic role in the carcinogenesis of gastric tumor cells through the LINC01296/miR-122/MMP-9 axis.19 Zhang et al demonstrated that LINC01296 promoted tumor progression and development by attaching to miR-5095 in human cholangiocarcinoma. Similarly, LINC01296 acts as an oncogene in several different tumors such as ESCC,17 colon carcinoma,30 pancreatic ductal adenocarcinoma,20 osteosarcoma,18 and non-small cell lung cancer.31
Wan et al.32 indicated that LINC01296 could modulate epithelial-mesenchymal transition (EMT) activity by sponging miR-122-5P; however, the current study did not explore the effect of LINC01296 on cell cycle and apoptosis in HCC. We performed bioinformatics analysis to explore potential LINC01296 mechanisms in HCC by first collecting genes related to LINC01296. GO and KEGG analyses showed that enriched genes related to LINC01296 could be associated with ATPase and the genes of cancer progression, such as those of the cell cycle. Next, PPI network evaluations identified 20 hub genes that encompassed the core-related genes of LINC01296, and a correlation between LINC01296 and the hub genes was found in the TCGA database. Among these hub genes, most were associated with cell cycle, which included CCNB1,33 CDK1,34 BUB1,35 ZWINT,36 and CCNA2.37 This was found to be consistent with our bioinformatic analysis; therefore, LINC01296 could play a vital role in HCC progression and development. Our in vitro experiments indicated that LINC01296 downregulation inhibited HCC cell proliferation, invasion, migration; additionally, it promoted cellular apoptosis, and caused HCC cell cycle arrest in the G0/G1 phase. We also found that LINC01296 downregulation decreased CDK1, CCNA2, and BUB1 expression, which indicated that LINC01296 might have an oncogenic role in HCC through the CDK1, CCNB1, or BUB1 genes. However, additional studies are needed to fully elucidate the molecular mechanisms of LINC01296 in HCC progression and development.
Conclusion
We demonstrated that high LINC01296 expression was related to poor OS and DFS in several different cancer types. We also reported that LINC01296 expression was higher in HCC cells compared with normal liver cell lines, and LINC01296 has an oncogenic role in HCC as evidenced by bioinformatics analysis and in vitro experimentation. Thus, we believe that LINC01296 could be a potential prognostic biomarker in patients with HCC and several other tumor types. This is the first comprehensive analysis to explore the prognostic value of LINC01296 in several different cancers types and elaborate on its potential mechanism of action in HCC.
Abbreviations list
lncRNAs (long non-coding RNAs); GEO (Gene Expression Omnibus); OS (overall survival); DFS (disease-free survival); RFS (recurrence-free survival); HR (hazard ratio); CI (confidence interval); GBM (glioblastoma); CLL (chronic lymphocytic leukemia); DLBCL (diffuse large B-cell lymphoma).
Acknowledgments
This study was funding by Project Letter of Academic Leader of the First Hospital of Shanxi Medical University (YD1607), Scientific Research Project Plan of Shanxi Provincial Health Planning Commission (2014029), Project Letter of Fostering Team for Precision Medical Key Innovation in the First Hospital of Shanxi Medical University (YT1603), and Shanxi Medical University Doctor’s Startup Fund Project (XD1802).
Author contributions
Jiansheng Guo and Zhigang Wei designed the study and performed the experiments; Chaojie Liang, Yu Zhang, Yongping Zhang, Zhimin Wang and Ruihuan Li performed the experiments and analyzed the data; Chaojie Liang and Yongping Zhang wrote the manuscript. All authors contributed to data analysis, drafting or revising the article, gave final approval of the version to be published, and agree to be accountable for all aspects of the work.
Disclosure
The authors report no conflicts of interest in this work.
References
1. Chen W, Zheng R, Baade PD, et al. Cancer statistics in China, 2015. CA Cancer J Clin. 2016;66:115–132. doi:10.3322/caac.21338
2. Ferlay J, Soerjomataram I, Dikshit R, et al. Cancer incidence and mortality worldwide: sources, methods and major patterns in GLOBOCAN 2012. Int J Cancer. 2015;136:E359–E386. doi:10.1002/ijc.29210
3. Avila MA, Berasain C, Sangro B, Prieto J. New therapies for hepatocellular carcinoma. Oncogene. 2006;25:3866–3884. doi:10.1038/sj.onc.1209550
4. Huang J. Current progress in epigenetic research for hepatocarcinomagenesis. Sci China Series C Life Sci. 2009;52:31–42. doi:10.1007/s11427-009-0014-7
5. Siegel R, Naishadham D, Jemal A. Cancer statistics, 2012. CA Cancer J Clin. 2012;62:10–29. doi:10.3322/caac.20138
6. Forner A, Reig M, Bruix J. Hepatocellular carcinoma. Lancet. 2018;391:1301–1314. doi:10.1016/S0140-6736(18)30010-2
7. Nishikawa H, Kimura T, Kita R, Osaki Y. Treatment for hepatocellular carcinoma in elderly patients: a literature review. J Cancer. 2013;4:635–643. doi:10.7150/jca.7279
8. Mercer TR, Dinger ME, Mattick JS. Long non-coding RNAs: insights into functions. Nat Rev Genet. 2009;10:155–159. doi:10.1038/nrg2521
9. Wilusz JE, Sunwoo H, Spector DL. Long noncoding RNAs: functional surprises from the RNA world. Genes Dev. 2009;23:1494–1504. doi:10.1101/gad.1800909
10. Spizzo R, Almeida MI, Colombatti A, Calin GA. Long non-coding RNAs and cancer: a new frontier of translational research?. Oncogene. 2012;31:4577–4587. doi:10.1038/onc.2011.621
11. Zhu J, Fu H, Wu Y, Zheng X. Function of lncRNAs and approaches to lncRNA-protein interactions. Sci China Life Sci. 2013;56:876–885. doi:10.1007/s11427-013-4553-6
12. Liang C, Liu J, Ge H, Xu Y, Li G, Wu J. The clinicopathological and prognostic value of long non-coding RNA ZEB1-AS1 in solid tumors: a meta-analysis. Clin Chim Acta. 2018;484:91–98. doi:10.1016/j.cca.2018.05.011
13. Liang C, Qi Z, Ge H, et al. Long non-coding RNA PCAT-1 in human cancers: A meta-analysis. Clin Chim Acta. 2018;480:47–55. doi:10.1016/j.cca.2018.01.043
14. Liang C, Zhang B, Ge H, Xu Y, Li G, Wu J. Long non-coding RNA CRNDE as a potential prognostic biomarker in solid tumors: A meta-analysis. Clin Chim Acta. 2018;481:99–107. doi:10.1016/j.cca.2018.02.039
15. He RQ, Qin M-J, Lin P, et al. Prognostic Significance of LncRNA PVT1 and Its Potential Target Gene Network in Human Cancers: a Comprehensive Inquiry Based Upon 21 Cancer Types and 9972 Cases. Cell Physiol Biochem. 2018;46:591–608. doi:10.1159/000488627
16. Zhu ZM, Liu FT, Chen X. Low Expression of LncRNA Cancer Susceptibility Candidate 2 and its Clinical Significance in Cancer Tissues. Cell Physiol Biochem. 2018;46:1643–1649. doi:10.1159/000489211
17. Wang B, Liang T, Li J. Long noncoding RNA LINC01296 is associated with poor prognosis in ESCC and promotes ESCC cell proliferation, migration and invasion. Eur Rev Med Pharmacol Sci. 2018;22:4524–4531. doi:10.26355/eurrev_201807_15507
18. Yu X, Pang L, Yang T, Liu P. lncRNA LINC01296 regulates the proliferation, metastasis and cell cycle of osteosarcoma through cyclin D1. Oncol Rep. 2018;40:2507–2514. doi:10.3892/or.2018.6674
19. Qin QH, Yin ZQ, Li Y, Wang BG, Zhang MF. Long intergenic noncoding RNA 01296 aggravates gastric cancer cells progress through miR-122/MMP-9. Biomed Pharmacother. 2018;97:450–457. doi:10.1016/j.biopha.2017.10.066
20. Yuan Q, Zhang Y, Feng L, Jiang Y. Upregulated long noncoding RNA LINC01296 indicates a dismal prognosis for pancreatic ductal adenocarcinoma and promotes cell metastatic properties by affecting EMT. J Cell Biochem. 2018.
21. Jiang M, Xiao Y, Liu D, Luo N, Gao Q, Guan Y. Overexpression of long noncoding RNA LINC01296 indicates an unfavorable prognosis and promotes tumorigenesis in breast cancer. Gene. 2018;675:217–224. doi:10.1016/j.gene.2018.07.004
22. Liang J, Wei X, Liu Z, et al. Long noncoding RNA CYTOR in cancer: A TCGA data review. Clin Chim Acta. 2018;483:227–233. doi:10.1016/j.cca.2018.05.010
23. Dennis G
24. Wu J, Mao X, Cai T, Luo J, Wei L. KOBAS server: a web-based platform for automated annotation and pathway identification. Nucleic Acids Res. 2006;34:W720–W724. doi:10.1093/nar/gkl167
25. Shannon P, Markiel A, Ozier O, et al. Cytoscape: a software environment for integrated models of biomolecular interaction networks. Genome Res. 2003;13:2498–2504. doi:10.1101/gr.1239303
26. Szklarczyk D, Franceschini A, Wyder S, et al. STRING v10: protein-protein interaction networks, integrated over the tree of life. Nucleic Acids Res. 2015;43:D447–D452. doi:10.1093/nar/gku1003
27. Qiu JJ, Yan JB. Long non-coding RNA LINC01296 is a potential prognostic biomarker in patients with colorectal cancer. Tumour Biol. 2015;36:7175–7183. doi:10.1007/s13277-015-3448-5
28. Wu J, Cheng G, Zhang C, et al. Long noncoding RNA LINC01296 is associated with poor prognosis in prostate cancer and promotes cancer-cell proliferation and metastasis. Onco Targets Ther. 2017;10:1843–1852. doi:10.2147/OTT.S129928
29. Zhang D, Li H, Xie J, et al. Long noncoding RNA LINC01296 promotes tumor growth and progression by sponging miR-5095 in human cholangiocarcinoma. Int J Oncol. 2018;52:1777–1786. doi:10.3892/ijo.2018.4362
30. Wang K, Zhang M, Wang C, Ning X. Long noncoding RNA LINC01296 harbors miR-21a to regulate colon carcinoma proliferation and invasion. Oncol Res. 2018;27(5):541-549. doi:0.3727/096504018X15234931503876
31. Xu L, Wei B, Hui H, Sun Y, Liu Y, Yu X, Dai J. Positive feedback loop of lncRNA LINC01296/miR-598/Twist1 promotes non-small cell lung cancer tumorigenesis. J Cell Physiol. 2019;234(4):4563-4571. doi:10.1002/jcp.27235
32. Wan Y, Li M, Huang P. LINC01296 promotes proliferation, migration, and invasion of HCC cells by targeting miR-122-5P and modulating EMT activity. Onco Targets Ther. 2019;12:2193–2203. doi:10.2147/OTT.S197338
33. Chai N, Xie H-H, Yin J-P, et al. FOXM1 promotes proliferation in human hepatocellular carcinoma cells by transcriptional activation of CCNB1. Biochem Biophys Res Commun. 2018;500:924–929. doi:10.1016/j.bbrc.2018.04.201
34. Gao CL, Wang GW, Yang GQ, Yang H, Zhuang L. Karyopherin subunit-alpha 2 expression accelerates cell cycle progression by upregulating CCNB2 and CDK1 in hepatocellular carcinoma. Oncol Lett. 2018;15:2815–2820. doi:10.3892/ol.2017.7691
35. Xu B, Xu T, Liu H, Min Q, Wang S, Song Q. MiR-490-5p suppresses cell proliferation and invasion by targeting BUB1 in hepatocellular carcinoma cells. Pharmacology. 2017;100:269–282. doi:10.1159/000477667
36. Ying H, Xu Z, Chen M, Zhou S, Liang X, Cai X. Overexpression of zwint predicts poor prognosis and promotes the proliferation of hepatocellular carcinoma by regulating cell-cycle-related proteins. Onco Targets Ther. 2018;11:689–702. doi:10.2147/OTT.S152138
37. Yang F, Gong J, Wang G, Chen P, Yang L, Wang Z. Waltonitone inhibits proliferation of hepatoma cells and tumorigenesis via FXR-miR-22-CCNA2 signaling pathway. Oncotarget. 2016;7:75165–75175. doi:10.18632/oncotarget.12614
Supplementary materials
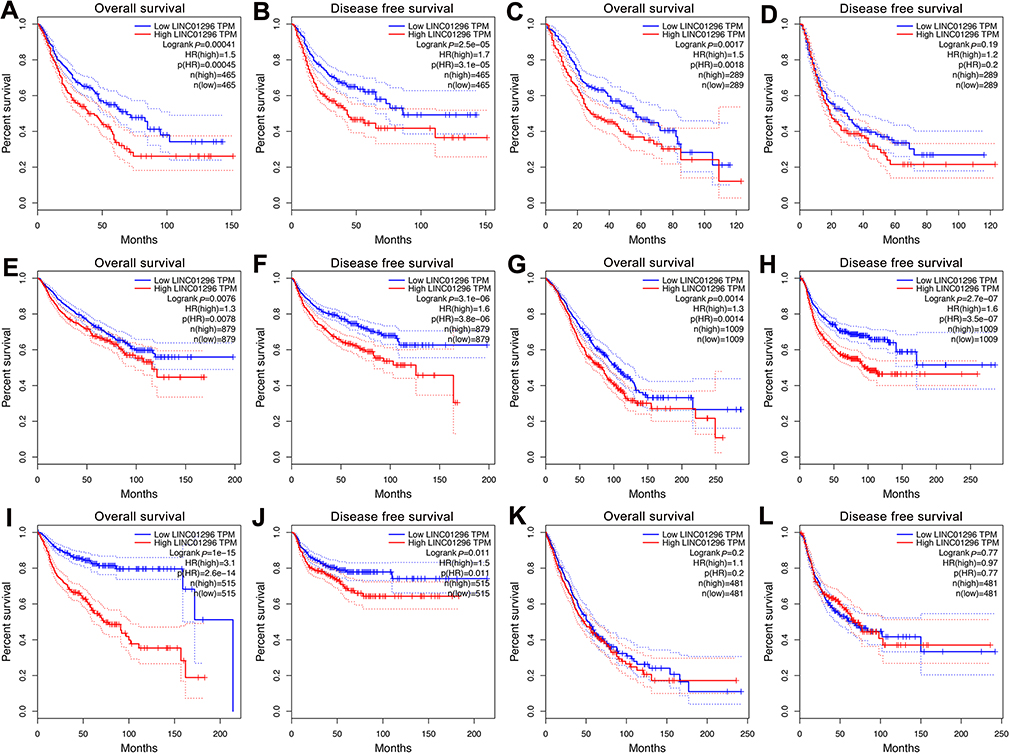 |
Figure S1 Validation of LINC01296 expression in The Cancer Genome Atlas (TCGA) cohort. (A) Overall survival plots of LINC01296 expression in TCGA cohort of gastrointestinal (GI) cancer patients (n=927, log-rank P<0.001). (B) Disease-free survival plots of TCGA cohort in GI tumors (n=930, long-rank P<0.001). (C) Overall survival plots regarding LINC01296 expression in TCGA cohort of hepatobiliary and pancreatic cancer patients (n=578, log-rank P=0.0018). (D) Disease-free survival plots of TCGA cohort of hepatobiliary and pancreatic cancer patients (n=578, log-rank P=0.19). (E) Overall survival plots for LINC01296 expression in TCGA cohort of urinary cancer patients (n=1758, log-rank=0.0076). (F) Disease-free survival plots of TCGA cohort of urinary cancer patients (n=1758, log-rank<0.001). (G) Overall survival plots of LINC01296 in TCGA cohort of female reproductive cancer patients (n=2018, log-rank p=0.0014). (H) Disease-free survival plots of TCGA cohort of female reproductive cancer patients (n=2018, log-rank p<0.001). (I) Overall survival plots of LINC01296 in TCGA cohort of head and neck cancer patients (n=1030, log-rank P<0.001). (J) Disease-free survival plots of TCGA cohort of head and neck cancer patients (n=1030, log-rank P<0.001). (K) Overall survival plots of LINC01296 in TCGA cohort of respiratory cancer patients (n=962, log-rank P=0.2). (L) Disease-free survival plots of TCGA cohort of respiratory cancer patients (n=962, log-rank P=0.77). |
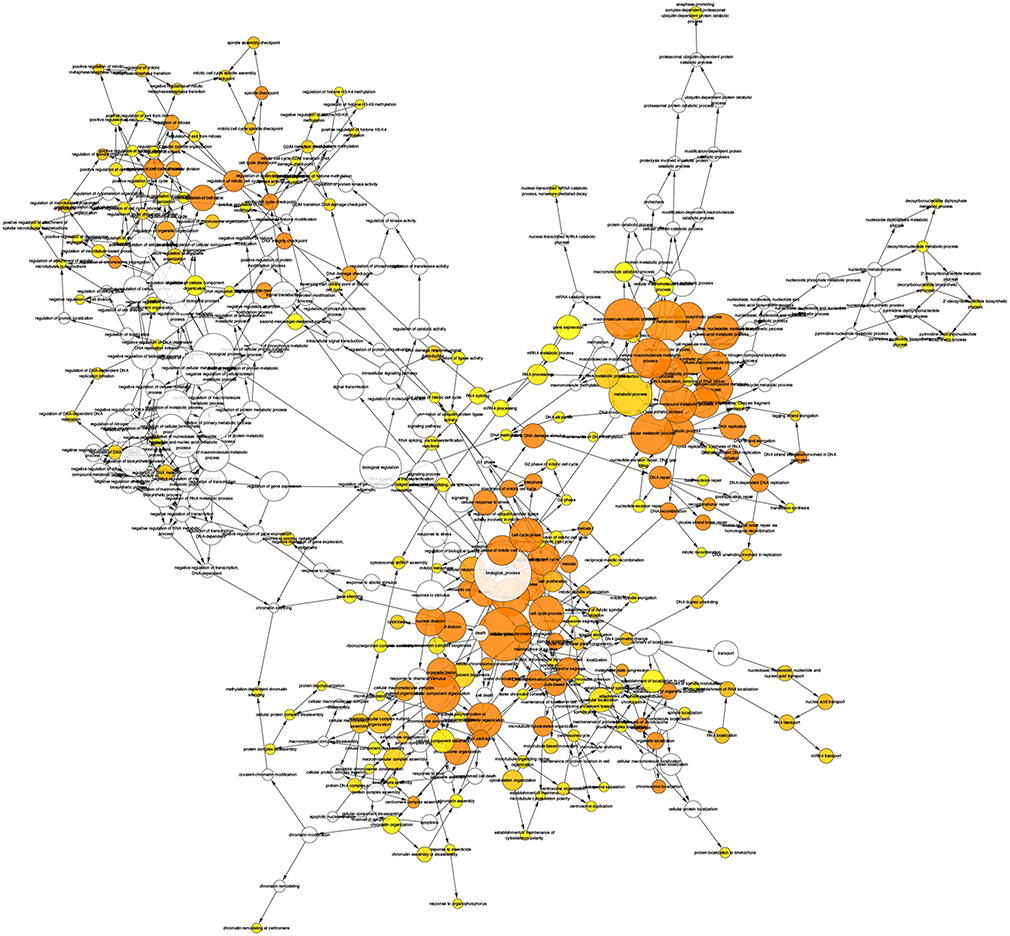 |
Figure S2 Network of the Biological Network Gene Ontology (BINGO) analysis of the LINC01296 genes related to biological processes. |
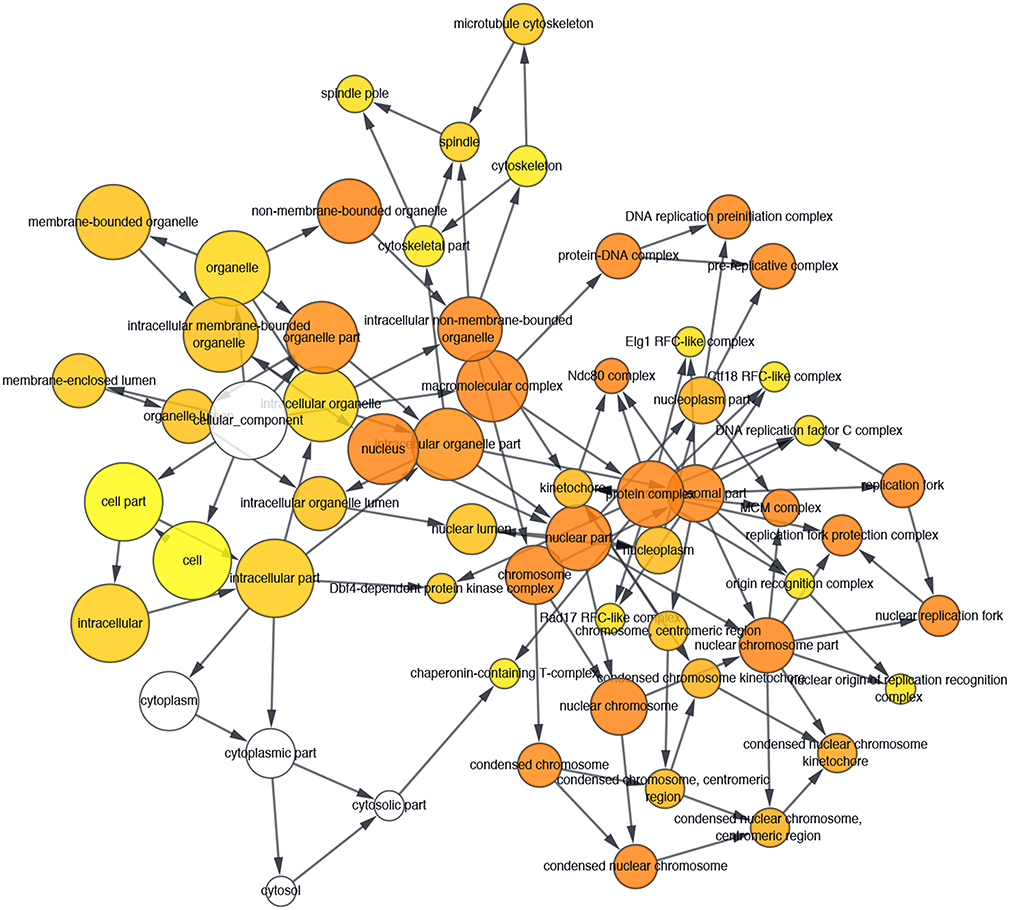 |
Figure S3 Biological Network Gene Ontology (BINGO) analysis of LINC01296 related to molecular function genes. |
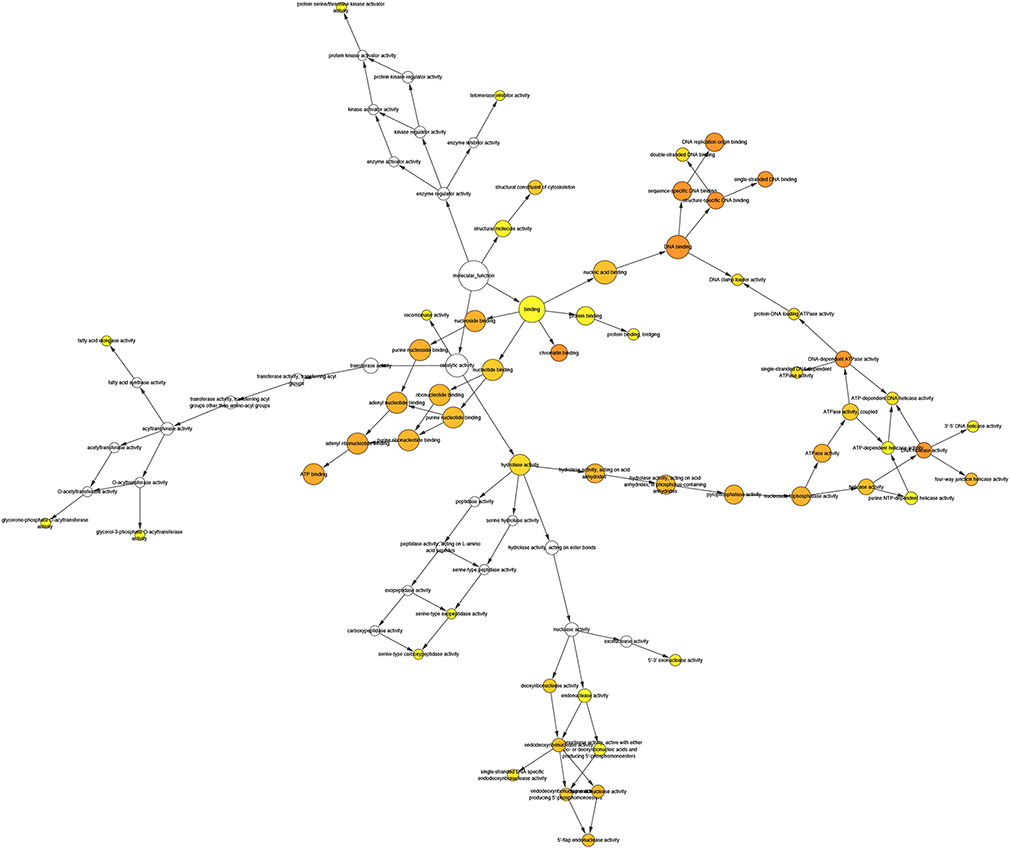 |
Figure S4 Network in Biological Network Gene Ontology (BINGO) analysis of LINC01296 related to cellular component genes. |
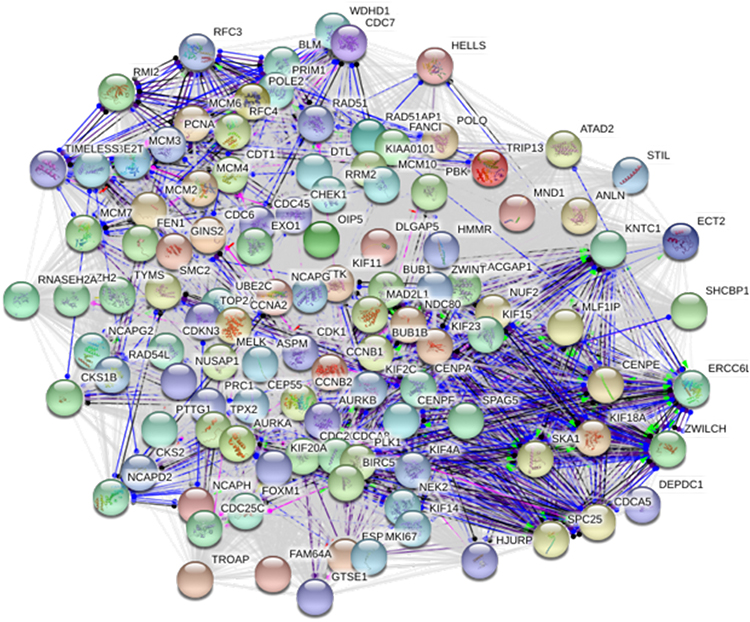 |
Figure S5 Protein-protein interactions of the LINC01296-related hub genes. |
 © 2019 The Author(s). This work is published and licensed by Dove Medical Press Limited. The full terms of this license are available at https://www.dovepress.com/terms.php and incorporate the Creative Commons Attribution - Non Commercial (unported, v3.0) License.
By accessing the work you hereby accept the Terms. Non-commercial uses of the work are permitted without any further permission from Dove Medical Press Limited, provided the work is properly attributed. For permission for commercial use of this work, please see paragraphs 4.2 and 5 of our Terms.
© 2019 The Author(s). This work is published and licensed by Dove Medical Press Limited. The full terms of this license are available at https://www.dovepress.com/terms.php and incorporate the Creative Commons Attribution - Non Commercial (unported, v3.0) License.
By accessing the work you hereby accept the Terms. Non-commercial uses of the work are permitted without any further permission from Dove Medical Press Limited, provided the work is properly attributed. For permission for commercial use of this work, please see paragraphs 4.2 and 5 of our Terms.