")
Back to Journals » Cancer Management and Research » Volume 12
The Prognostic Value of Body Fat Components in Metastasis Renal Cell Carcinoma Patients Treated with TKIs
Authors Dai J, Zhang X, Liu Z , Song T, Zhu X, Zhang H, Wu M, Li X , Zeng H , Shen P
Received 13 September 2019
Accepted for publication 24 December 2019
Published 7 February 2020 Volume 2020:12 Pages 891—903
DOI https://doi.org/10.2147/CMAR.S230973
Checked for plagiarism Yes
Review by Single anonymous peer review
Peer reviewer comments 2
Editor who approved publication: Dr Eileen O'Reilly
Jindong Dai,1 Xingming Zhang,1 Zhenhua Liu,1 Tingni Song,2 Xudong Zhu,1 Haoran Zhang,1 Mingpeng Wu,2 Xiang Li,1 Hao Zeng,1 Pengfei Shen1
1Department of Urology, Institute of Urology, West China Hospital, Sichuan University, Chengdu 610041, People’s Republic of China; 2Department of Radiology, West China Hospital, Sichuan University, Chengdu 610041, People’s Republic of China
Correspondence: Pengfei Shen
Department of Urology, Institute of Urology, West China Hospital, Sichuan University, Chengdu 610041, People’s Republic of China
Tel +86-28-8542-2451
Email [email protected]
Purpose: To assess the association between body fat components and survival status and tumor response for metastatic renal cell carcinoma (mRCC) patients treated with tyrosine kinase inhibitors (TKIs).
Patients and Methods: Patients with pathologically diagnosed and radiologically indicated mRCC were enrolled into the retrospective study. Three body fat components: total fat accumulation (TFA), visceral fat accumulation (VFA) and subcutaneous fat accumulation (SFA) were measured using standard CT scans. The clinical outcomes included progression-free survival (PFS), overall survival (OS), and tumor response rates. Univariate analysis and multivariate Cox proportion hazard regression models were used to find associated parameters and to calculate the adjusted hazard ratio (HR).
Results: A total of 146 patients were enrolled and the average age of patients was 56.5 years old. According to the univariate analysis, patients with an increased SFA and TFA had a longer PFS and OS. A similar phenomenon was observed among patients with ≥ 2 increasing body fat components about PFS and OS. As for multivariate analysis, SFA change (p=0.014) or the number of increasing body fat components (p=0.040) were independent indicators to predict PFS. In addition, SFA change (p=0.022) or the number of increasing body fat components (p=0.008) could independently predict OS. Moreover, a better disease control rate (p=0.028) was founded in patients with ≥ 2 increasing components. In the subgroup of patients with ≥ 2 metastasis sites, improved OS (p=0.017) and PFS (p=0.027) were found compared to those with < 2 increasing components. Further multivariate analysis identified the number of increasing body fat components was an independent factor in predicting PFS (p=0.018) and OS (p=0.029).
Conclusion: Body fat accumulation, such as high SFA or TFA at progression, could improve the survival of patients with mRCC treated with TKIs, especially patients with higher tumor burden. It should be considered as an important parameter to predict the survival status of patients with mRCC.
Keywords: tyrosine kinase inhibitor, body fat component, prognosis
Introduction
Obesity has become a major public health problem of epidemic proportions and there is much evidence that obesity is a modifiable risk factor for cancer.1 About 20% of cancers are associated with excess weight.2 Moreover, obesity is confirmed to be associated with treatment-related adverse effects, quality of life, risk of cancer recurrence and mortality in several cancers.3–5 Over the last decade, obesity has been shown to be associated with increased renal cell carcinoma (RCC) risk and the prognosis of patients.5–7
Body fat accumulation, as one of the important parameters of obesity, which could be measured from a routine computed tomography (CT) image, has recently shown its contribution to the survival of RCC patients.8–10 Several studies have suggested that visceral fat accumulation (VFA) be involved in the prognostic risk stratification.8–10 However, controversial results were reported from studies of different disease stages of RCC.8,11–13 Ladoire et al firstly reported that visceral obesity had significant prognostic value in patients with advanced RCC treated with targeted therapy.11 However, some studies reported that overweight patients with diagnosed RCC might have a favorable prognosis compared to those with normal or underweight;14,15 and another European group also came to an opposite conclusion–more than average adipose tissue was associated with longer survival.12
As a traditional measure of obesity, body mass index (BMI) was regarded by some studies to measure excess weight instead of excess fat. However, BMI could not show the differences among body fat, muscle and bone mass. In addition, BMI also fails to display the distribution of fat among individuals. Given these limitations, some studies that used BMI as a direct measurement of body fat might yield a more accurate estimate of the association between obesity and the risk of cancer.10
Until now, the roles of body composition, especially body fat components, in the progression and prognosis of RCC patients still are not conclusive. In view of these contradictory data, we conducted this retrospective study to evaluate the associations between body fat components and the survival status and tumor response of patients with metastatic RCC (mRCC) treated with tyrosine kinase inhibitors (TKIs).
Materials and Methods
Patients Assessment and Data Collection
This retrospective study enrolled mRCC patients who had been treated with tyrosine kinase inhibitors from January 2008 to November 2018 at our hospital. All subjects had been pathologically diagnosed with RCC and were radiographically indicated with metastasis lesion by CT, magnetic resonance imaging (MRI), radionuclide bone imaging, single-photon emission computed tomography (SPECT) or positron emission tomography/computed tomography (PET/CT). All patients were given TKIs, including sunitinib, sorafenib, and axitinib. Patients were followed up and given a safety examination everyone months and effect evaluation every 3 months by CT. The Response Evaluation Criteria in Solid Tumors (RECIST) 1.1 was applied to assess the treatment efficacy.16 This study was approved by the Ethics Committee of West China Hospital, Sichuan University and conformed to the ethical guidelines of the 1975 Declaration of Helsinki.
The Measurement of Body Fat Components
The patients’ baseline weight and height were collected when enrolled in our study. Body mass index (BMI) was calculated by the standard formula: BMI=weight/height2. Body surface area (BSA) was calculated by Mosteller formula: BSA=square root (weight*height/3600).17 Quantitative radiological measures using CT scans have been reported as the gold standard method to assess fat accumulation.18 Body fat components: total fat accumulation (TFA), VFA and subcutaneous fat accumulation (SFA) were measured at the level of the umbilicus using standard CT scans according to reported study previously.19 After outlining the border of the abdominal muscular wall at the level of umbilicus manually on the CT image, the cross-sectional surface areas of the visceral fat and total fat were separately calculated by two radiologists using MMWP 4 Workstation CT software package (Siemens, Germany). An image display window width from −150 to −50 Hounsfield units was used to identify the region of fat.20 Both body fat components at baseline and at progression were measured. The changes in different body fat components and their percentages were also calculated.
Clinical Outcomes
The primary outcomes of this study were overall survival (OS) and progression-free survival (PFS). OS was defined as the time from targeted agent administration to the date of death or last follow-up. PFS was defined as the time from targeted agent administration to the date of tumor progression, death or last contact. The second outcomes were tumor response rates, included complete response (CR) rate, partial response (PR) rate, stable disease (SD) rate, and progression of disease (PD) rate; objective response rate (ORR, =CR+PR) and disease control rate (DCR, =CR+PR+SD) were calculated.
Statistical Analyses
X-tile software was used to find the optimal cutoffs for all patients.21 Survival curves of PFS and OS for patients in different groups were plotted using the Kaplan–Meier method, and the Log rank test was used to compare the survival difference by categorized adiposity variables. And the generated prespecified multivariate regression models were performed with all covariates chosen on the basis of previous studies and theoretical considerations. To evaluate the prognostic value of investigated variables, the hazard ratio (HR) and 95% confidence interval (CI) were calculated using univariate and multivariate Cox analyses by SPSS 22.0. Characteristics that showed potential significance (p<0.05) in the univariate analyses were further evaluated using a multivariate Cox regression model. In all tests, p<0.05 were considered to indicate significance.
Results
Clinicopathological Characteristics
A total of 146 mRCC patients treated with TKIs were enrolled in this study. The average age of patients was 56.5 years old, and 70% of patients were older than 50 years old. The clinicopathological characteristics are shown in Table 1. What’s more, 64(43.8%) patients had gained increasing TFA as tumor progressed. There were nearly half of the patients had higher VFA than before (Table 1, Figure 1 and Figure 2A). Moreover, 47.9% (70/146) patients had higher SFA at baseline and some of them had more than 10% increase of SFA (Table 1 and Figure 2B). The number of patients with TFA increasing was comparable with TFA decreasing; however, TFA had increased at a higher rate (Table 1 and Figure 2C).
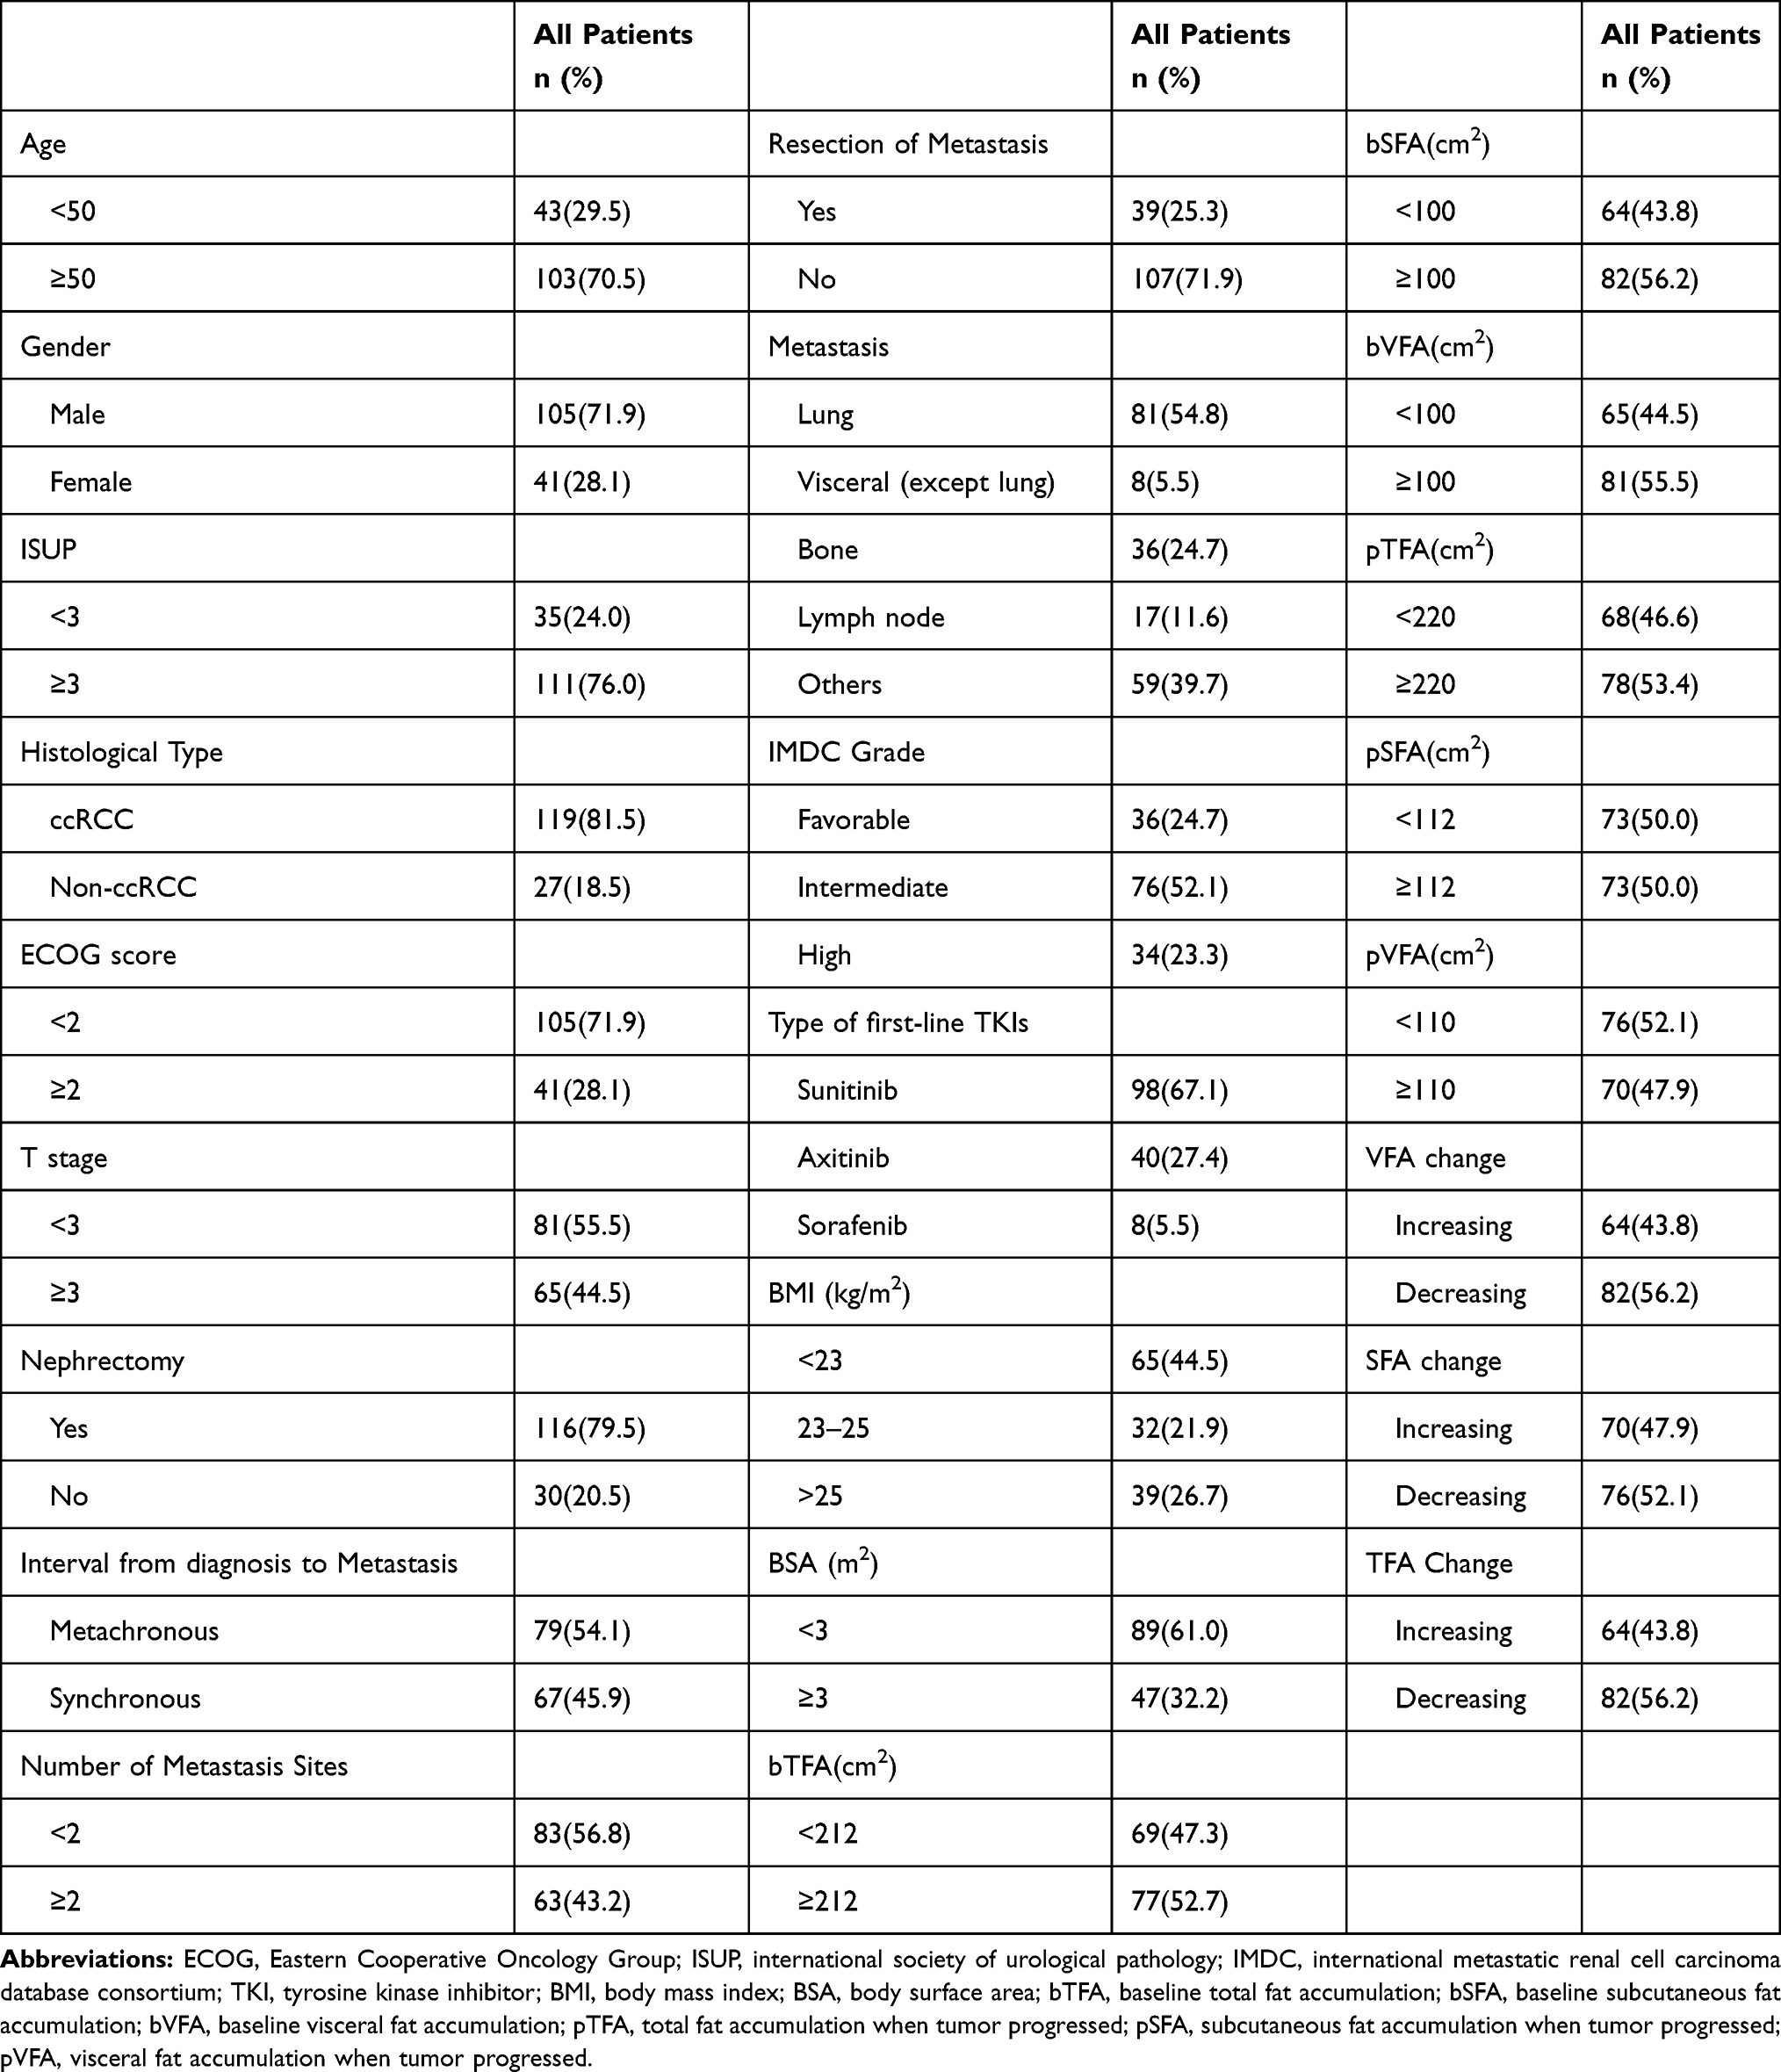 |
Table 1 The Baseline Characteristics of All Included Patients with mRCC (n=146) |
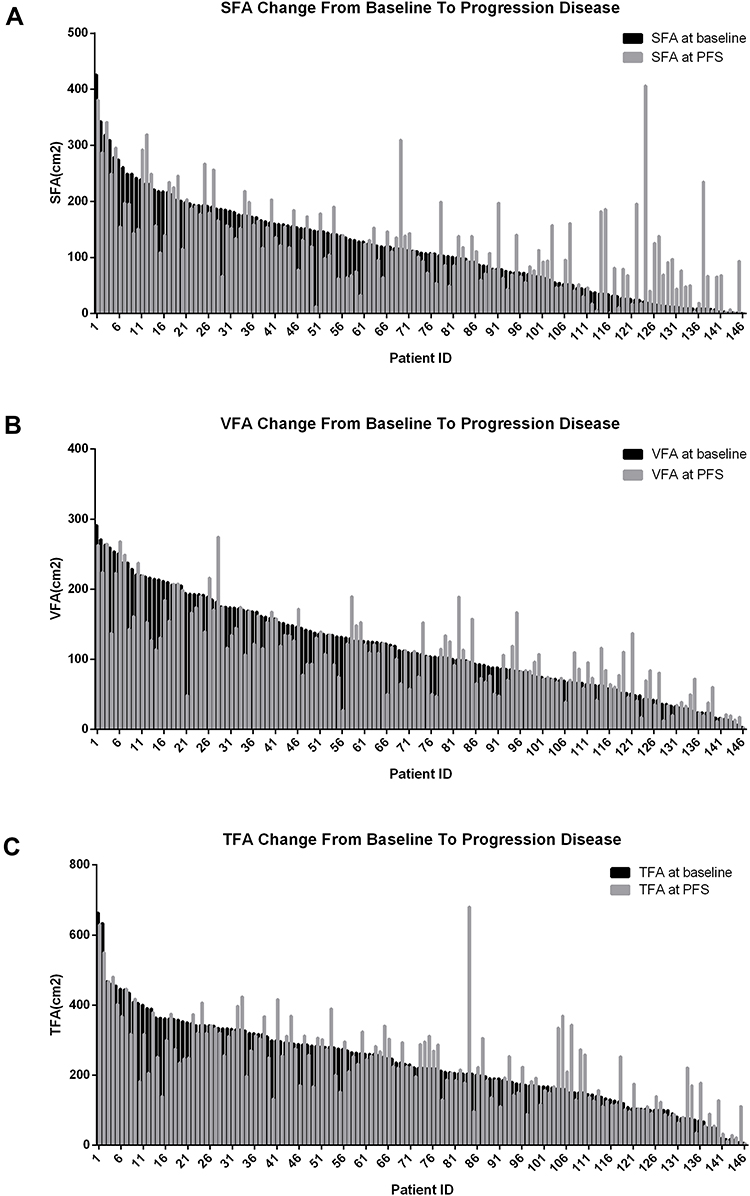 |
Figure 1 Changes in body fat in all patients. (A) The changes in subcutaneous fat accumulation from baseline to tumor progression. (B) The changes in visceral fat accumulation from baseline to tumor progression. (C) The changes in total fat accumulation from baseline to tumor progression. |
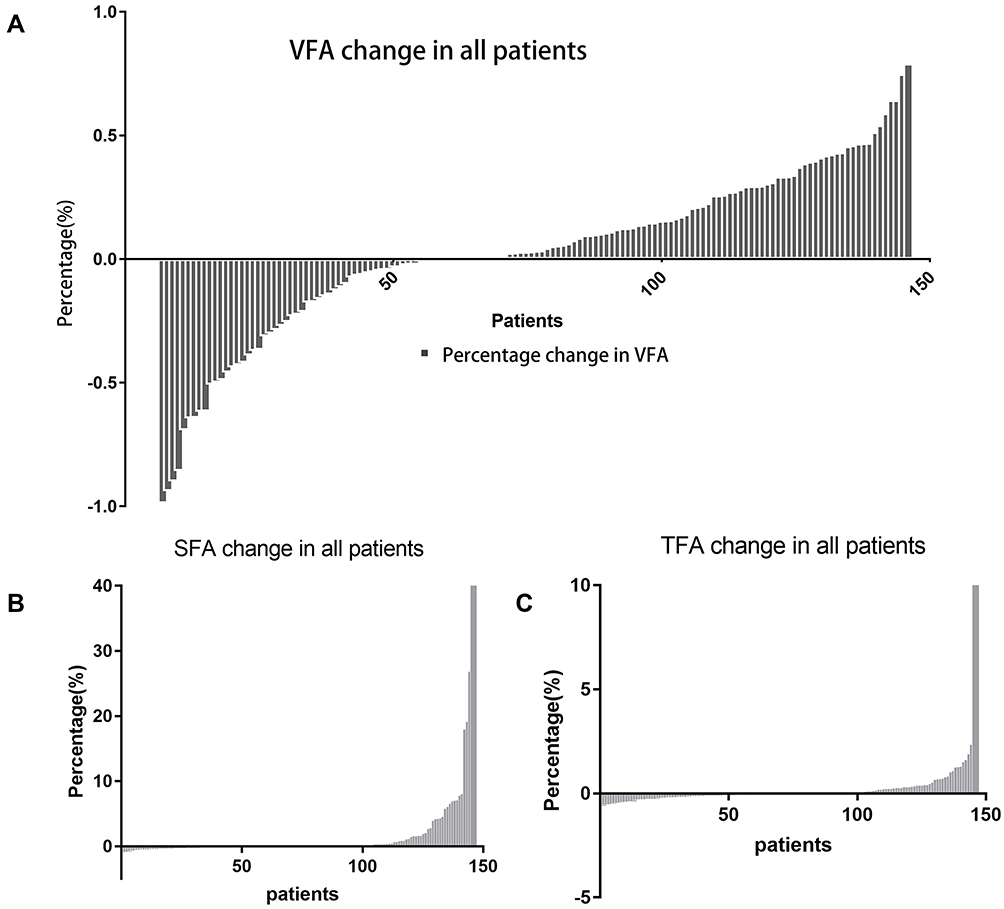 |
Figure 2 The percentage change of body fat in all patients. (A) The percentage change of visceral fat accumulation from baseline to tumor progression. (B) The percentage change of subcutaneous fat accumulation from baseline to tumor progression. (C) The percentage change of total fat accumulation from baseline to tumor progression. |
The Association Between Body Fat Components and Treatment Efficacy
The tumor response rates of patients were analyzed and the results showed that only one patient achieved CR (0.7%), 19 patients achieved PR (13.0%), 55 patients kept SD (37.7%), and 71 patients appeared PD (48.6%). As shown in Table 2, we found that the PD rate was significantly different between patients with <2 increasing body fat components and ≥2 increasing components (p=0.010) and the latter had a better DCR (p=0.028). This suggested that patients with more body fat components increased could obtain better disease control.
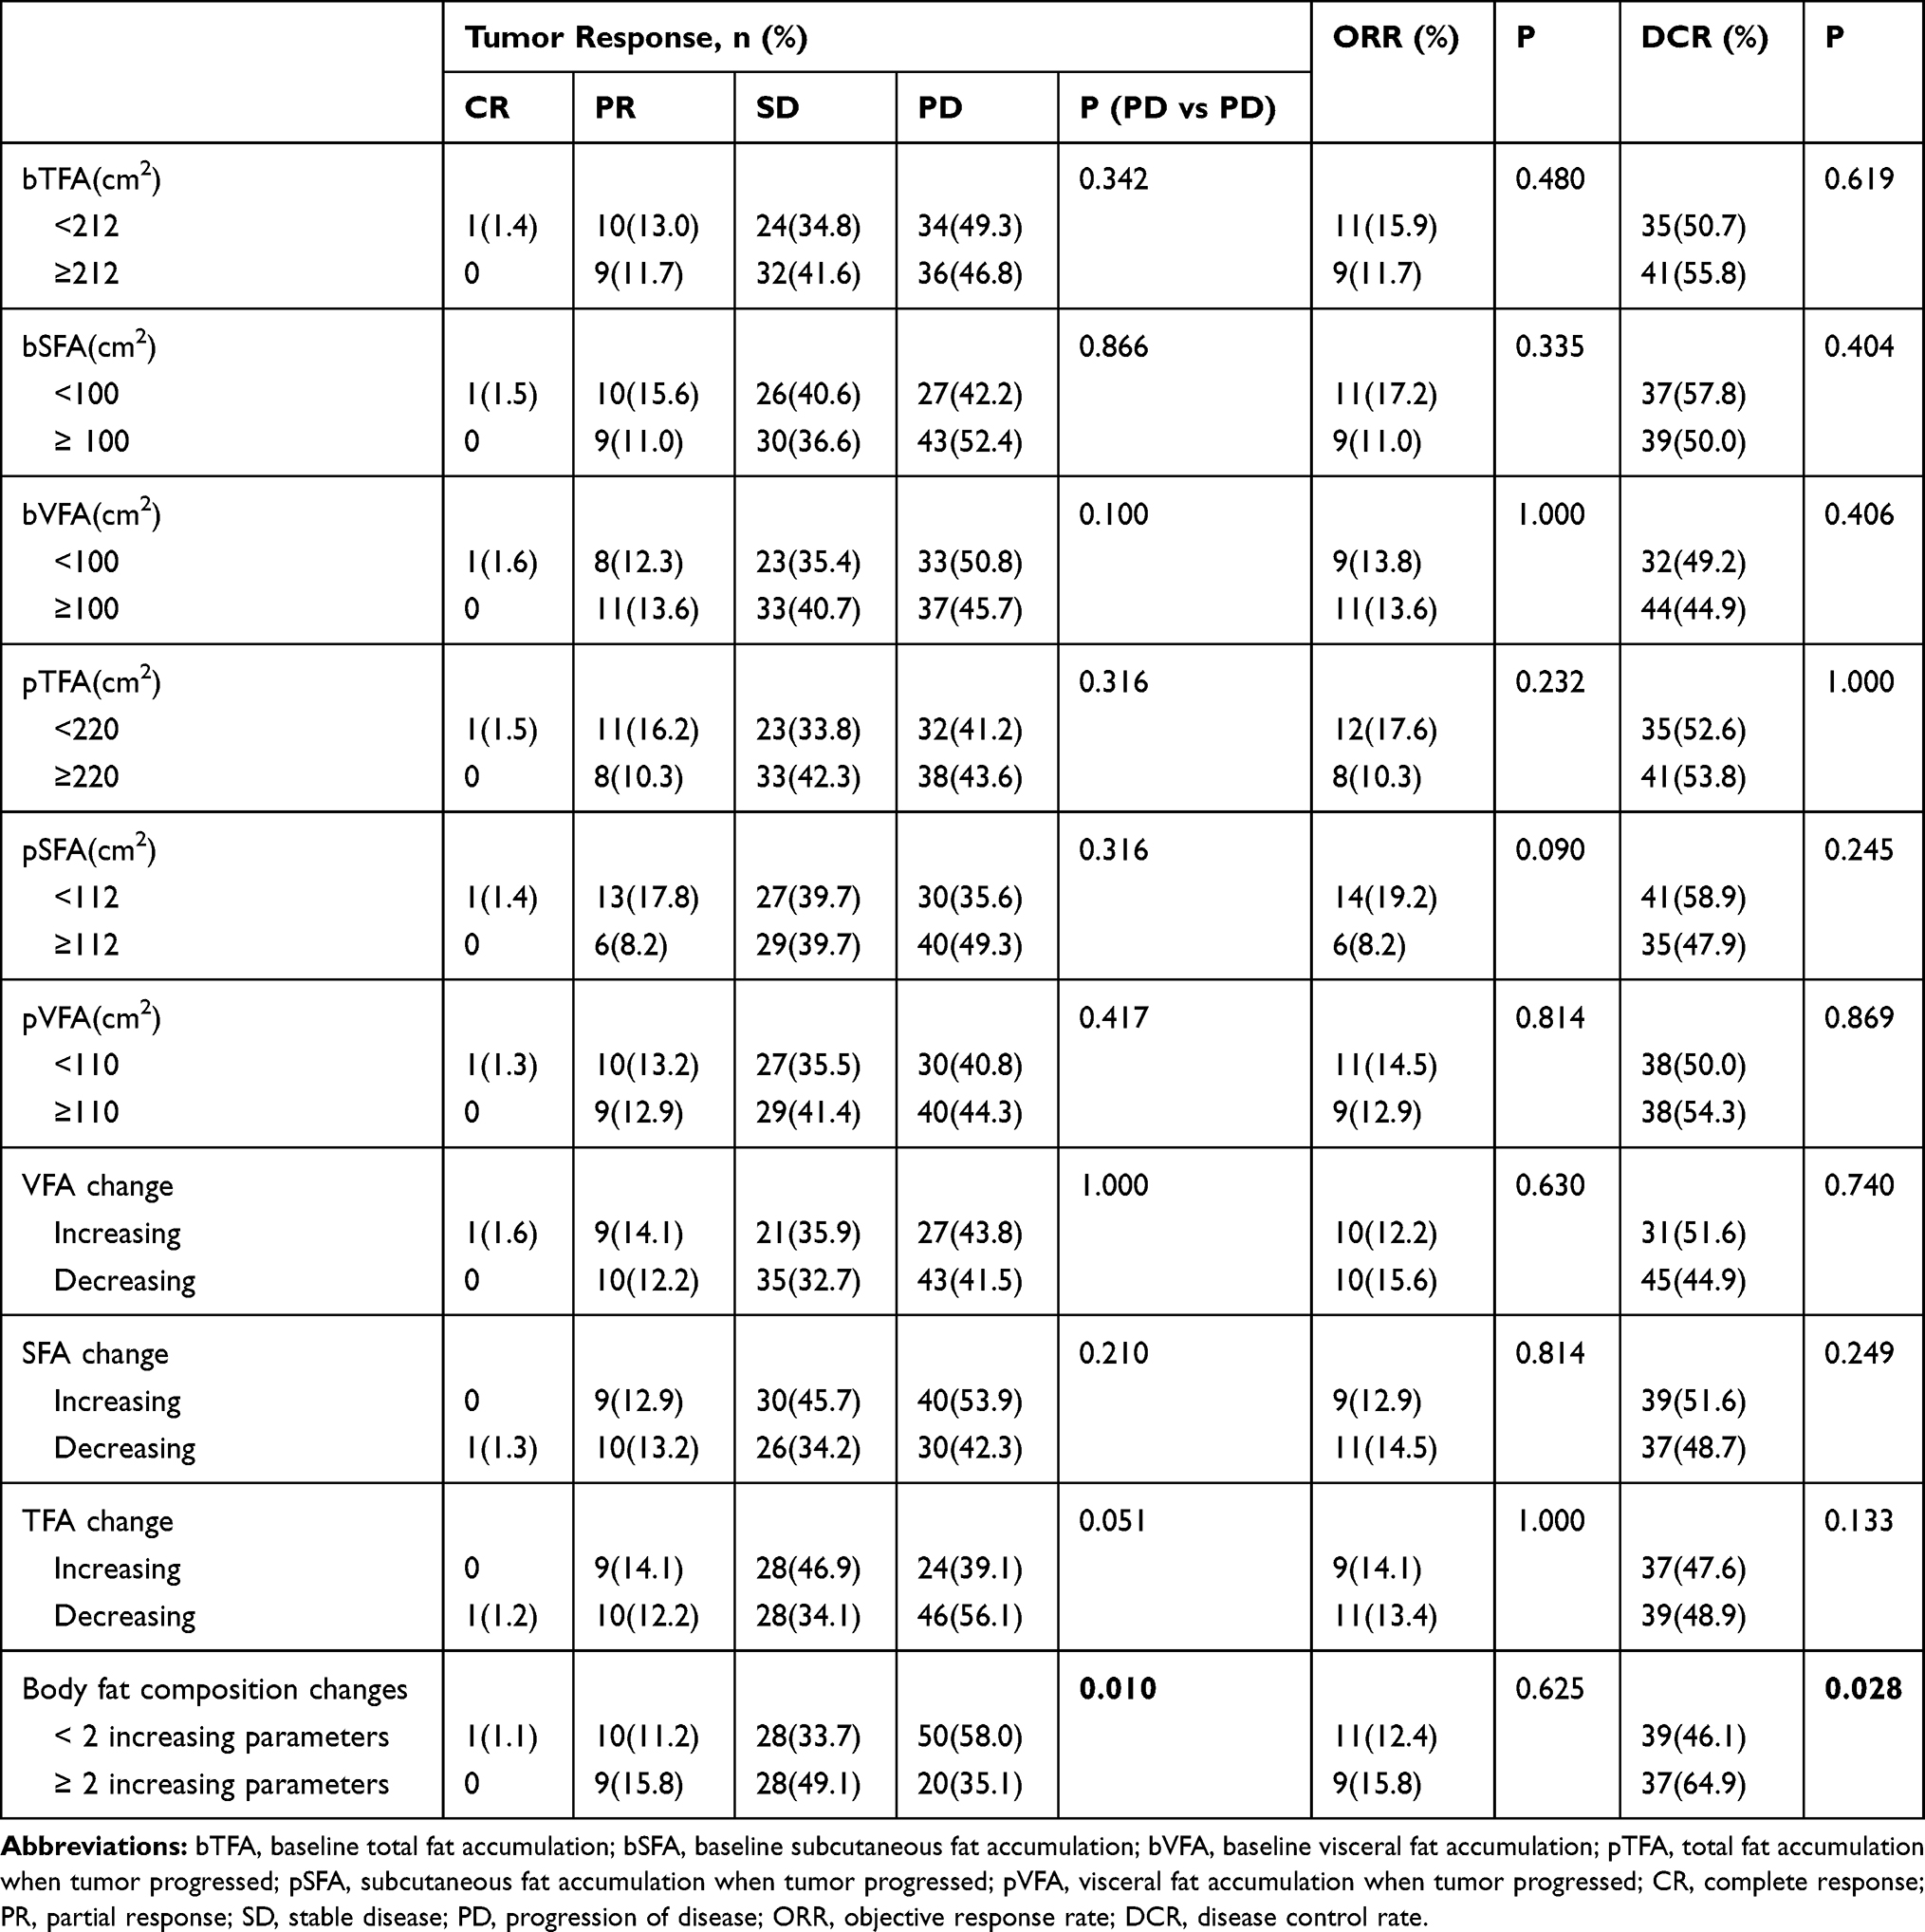 |
Table 2 The Tumor Responses of All Patients (N=146) |
Subsequently, we further analyzed the tumor efficacy in the subgroup of patients treated with sunitinib. For patients with ≥2 increasing parameters, 11 patients appeared PD (31.4%). Meanwhile, the DCR of this subgroup was 68.6% (24/35). As shown in Supplemental Table 1, a significant difference in PD was found between patients with <2 increasing components and those with ≥2 increasing components (58.1% vs 31.4%, p=0.019) and the latter also got a better DCR (44.4% vs 68.6%, p=0.028).
Survival Outcomes in All Patients
101 patients suffered tumor progression and 64 patients died during a median follow up of 36.0 months (30.893–41.107 months). The median PFS was 14 months (from 1 to 110 months) and the median OS was 50 months (from 2 to 122 months). According to the univariate analyses, some body fat variables were significantly associated with PFS and OS (Table 3). SFA change (HR: 0.569, 95% CI: 0.378–0.857, p=0.005), TFA change (HR: 0.612, 95% CI: 0.540–0.916, p=0.015) and the number of increasing body fat components (HR: 0.593, 95% CI: 0.423–0.833, p=0.003) were all positively correlated with tumor progression (Table 3 and Figure 3A). The correlation between OS and SFA change (HR: 0.534, 95% CI: 0.321–0.887, p=0.015), TFA change (HR: 0.539, 95% CI: 0.311–0.895, p=0.018) and the number of increasing body fat components (HR: 0.503, 95% CI: 0.332–0.761, p=0.001) was also found among all patients (Table 3 and Figure 3B).
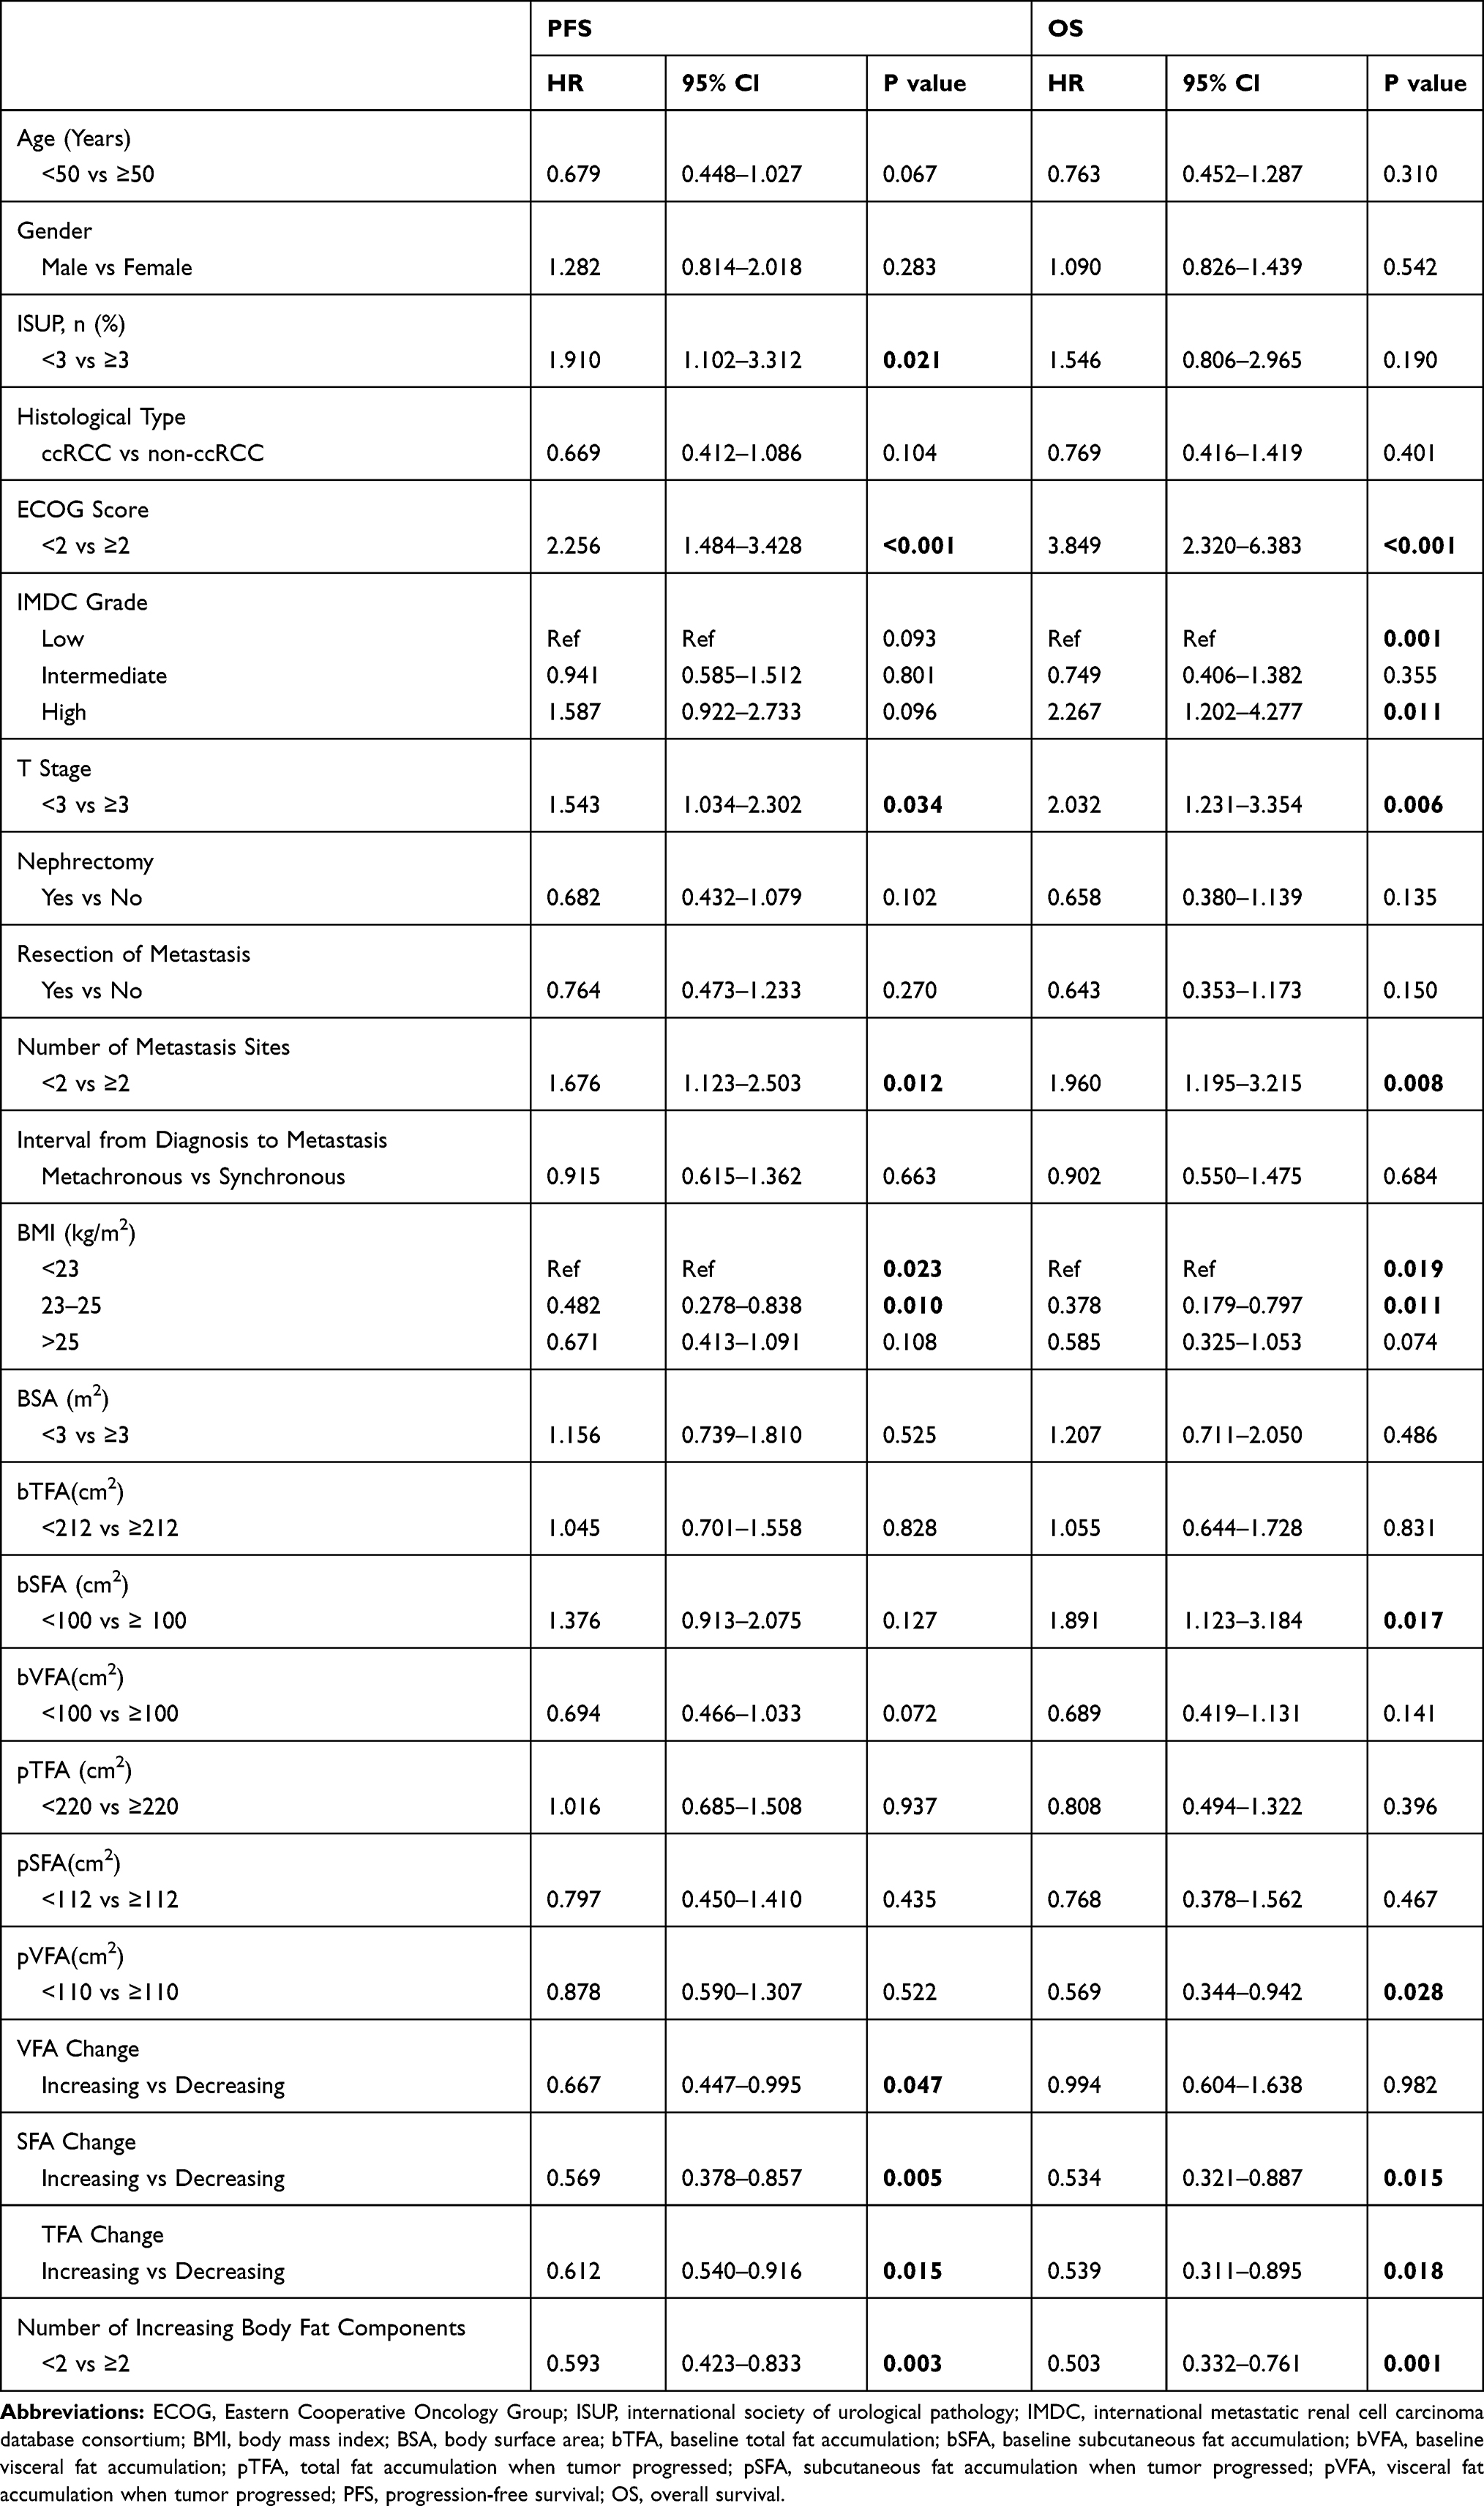 |
Table 3 Univariate Analysis of PFS and OS in All mRCC Patients |
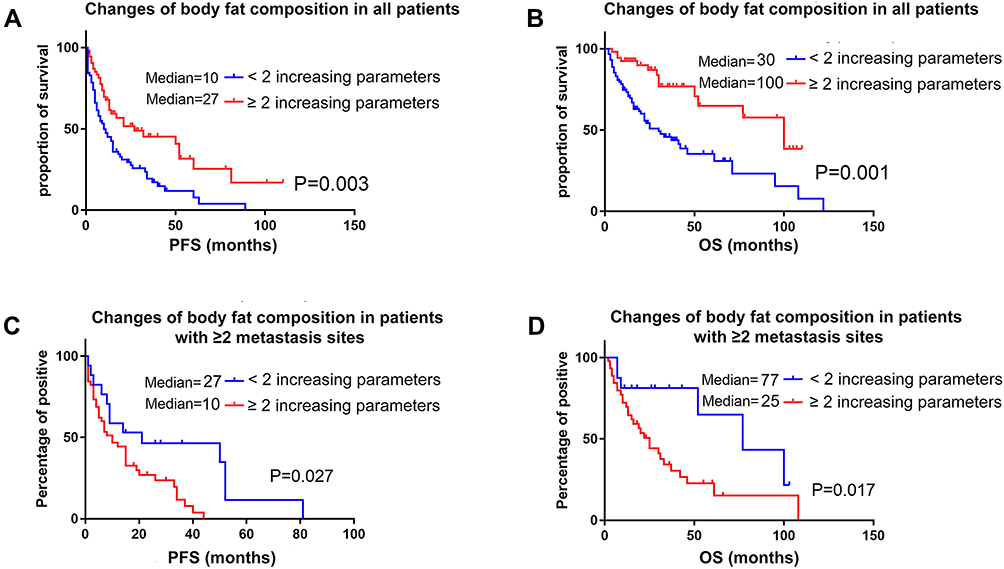 |
Figure 3 Kaplan-Meier assessment of progression-free survival and overall survival according to the number of increasing body fat components. (A) Kaplan-Meier assessment of progression-free survival in all patients. (B) Kaplan-Meier assessment of overall survival in all patients. (C) Kaplan-Meier assessment of progression-free survival in patients with ≥2 metastasis sites. (D) Kaplan-Meier assessment of overall survival in patients with ≥2 metastasis sites. |
Subsequently, due to the linear correlation between the number of increasing body fat components and SFA change or TFA change, two multivariate analysis was performed (one included SFA and TFA; another included number of increasing body fat components). Finally, multivariate analysis showed that patients with increasing SFA (p=0.023) or with BMI more than 25 Kg/m2 (p=0.026) had longer PFS; and patients with increasing SFA (p=0.003) or with BMI more than 25 Kg/m2 (p=0.023) also had longer OS (Table 4 and Figure 4). Moreover, the relationship between the number of increasing body fat components and PFS (HR: 0.620, 95% CI: 0.392–0.979, p=0.040) and OS (HR: 0.395, 95% CI: 0.200–0.781, p=0.008) were also found positive in multivariate analysis (Table 4).
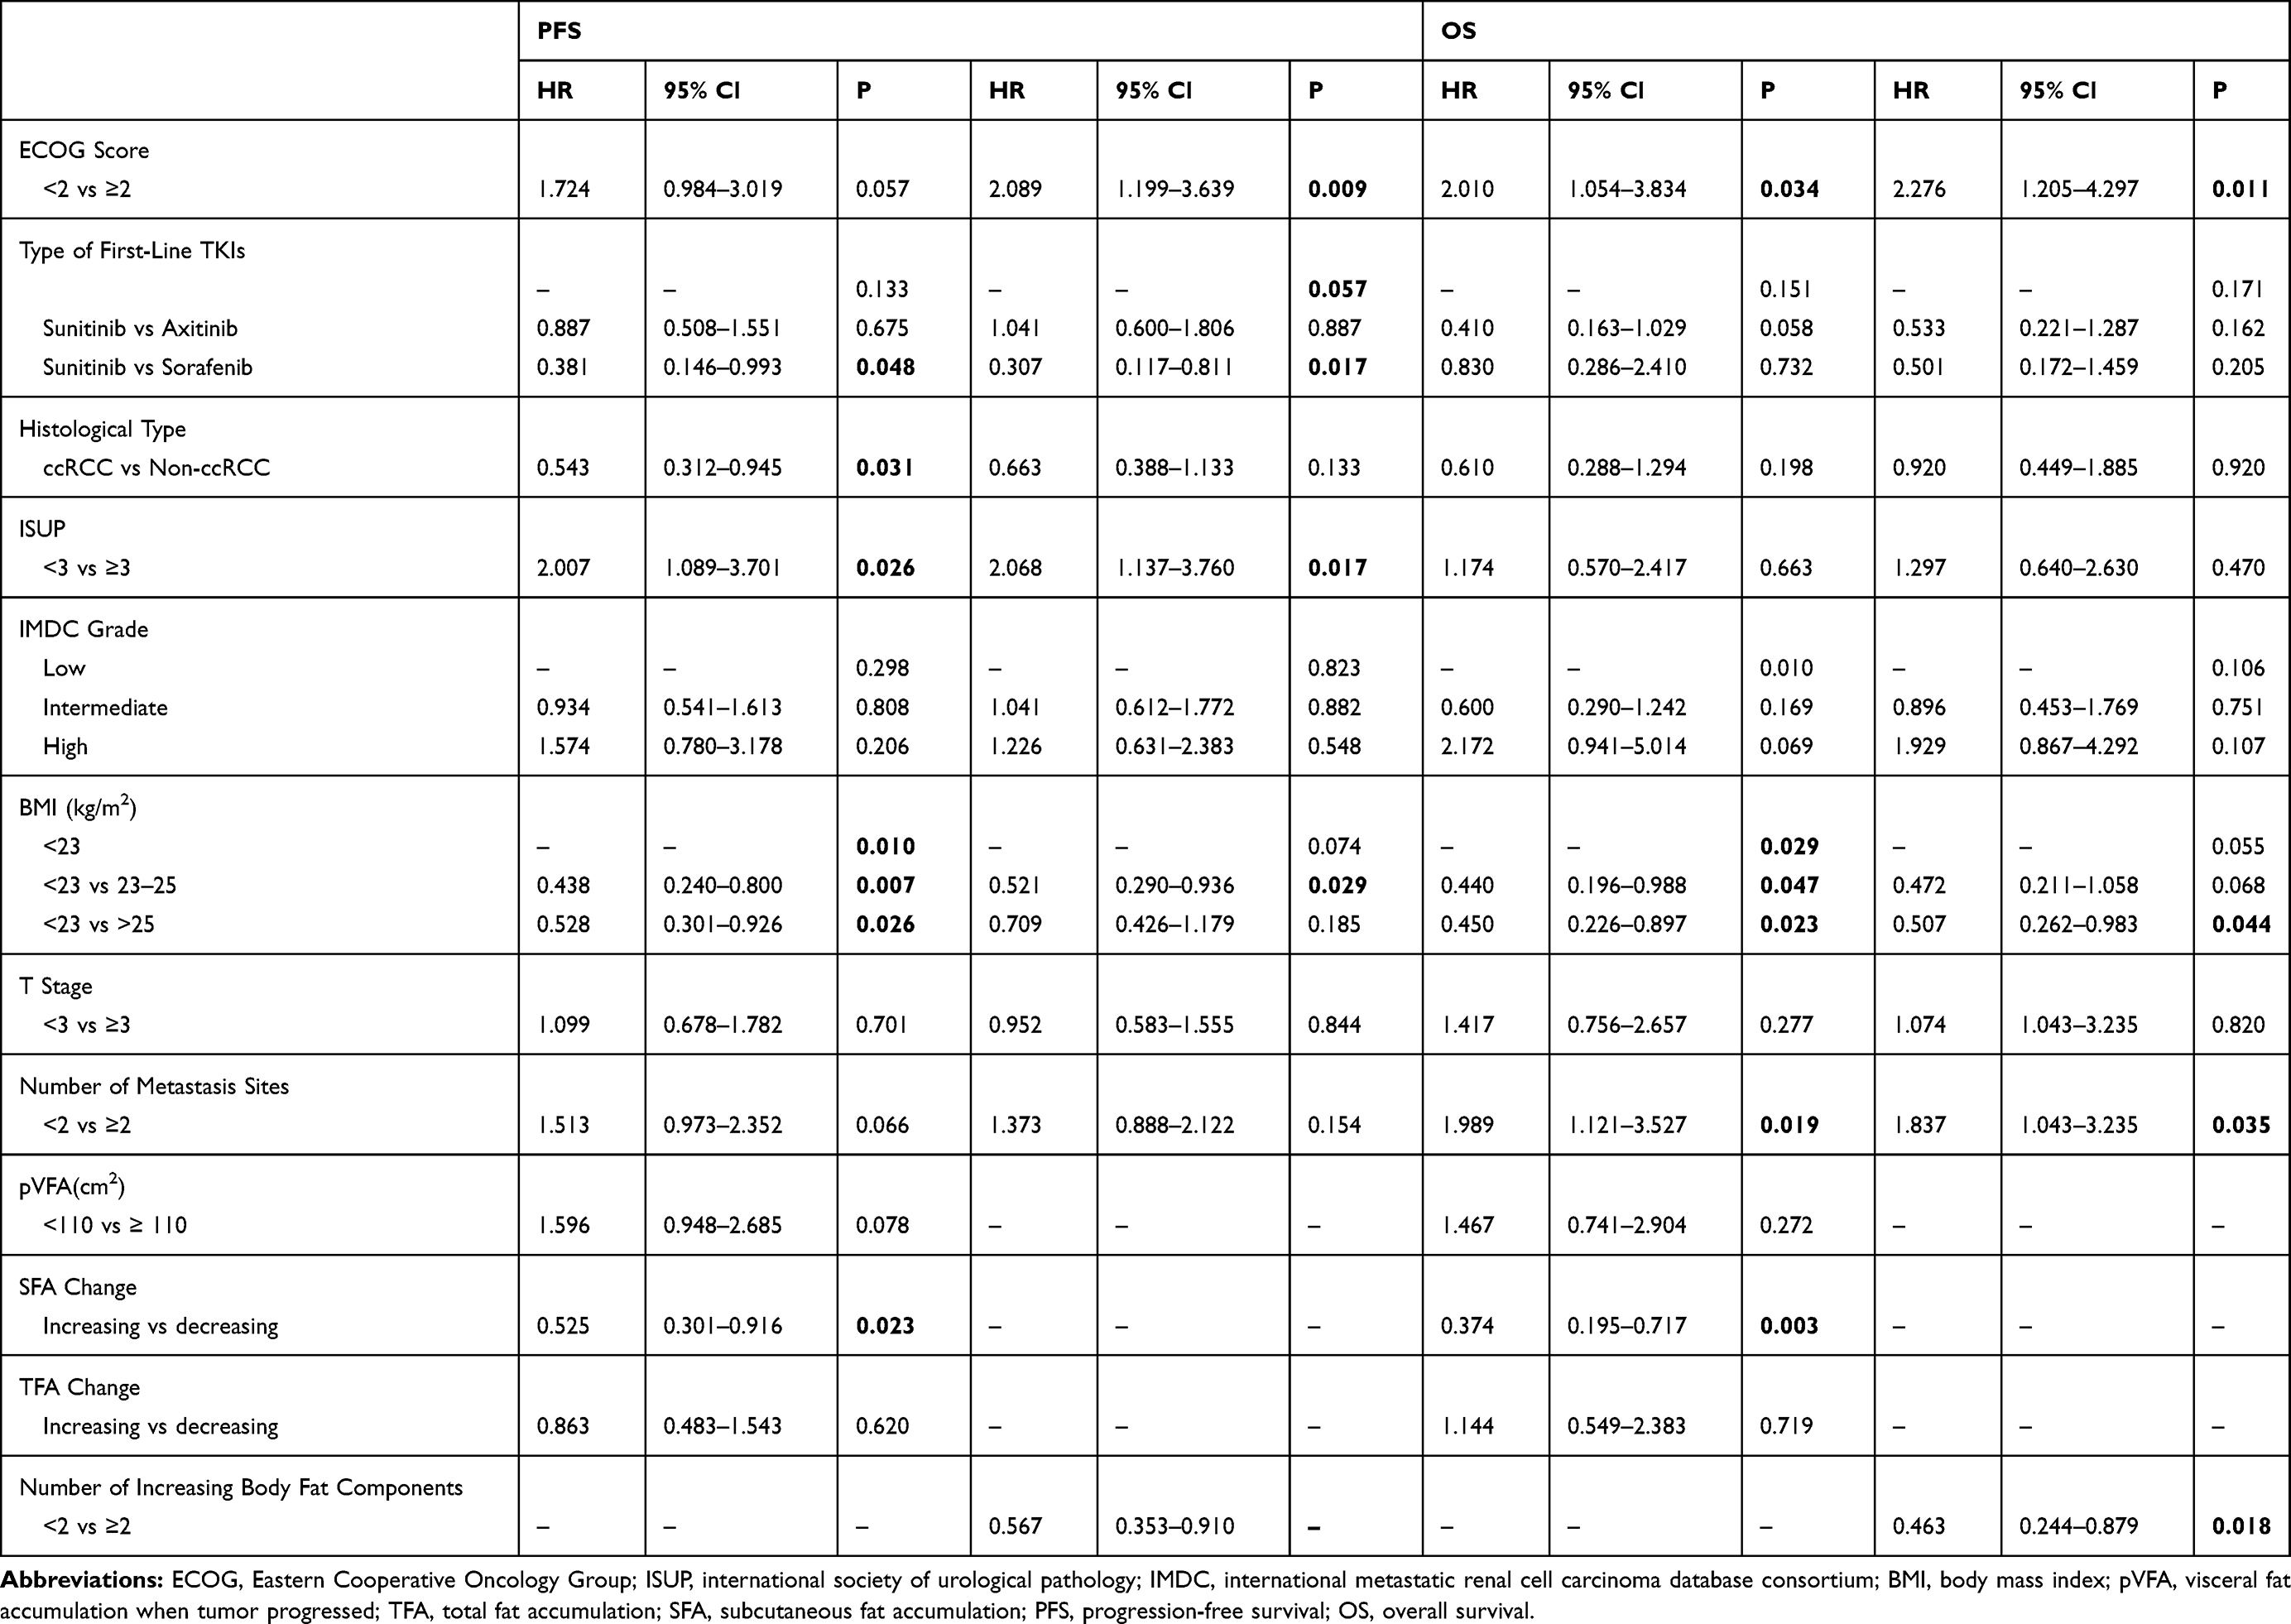 |
Table 4 Multivariate Analysis of PFS and OS in All Patients |
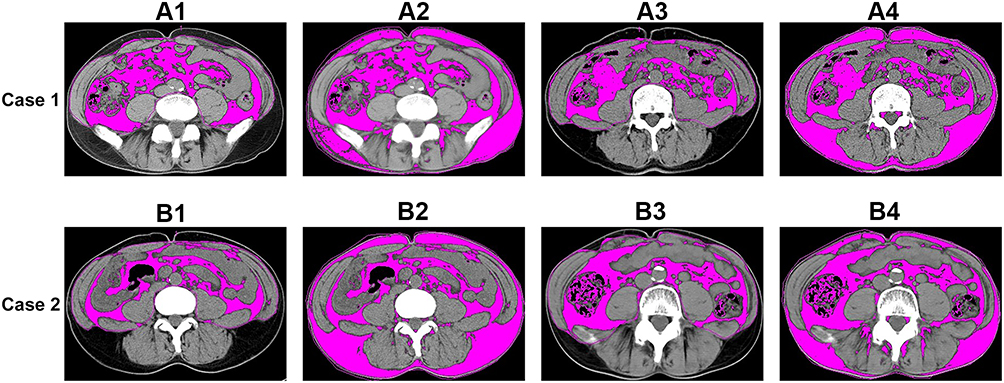 |
Figure 4 Case 1: Axial CT images of a patient with worse clinical outcomes at the level of the umbilicus. (PFS=4 months; OS=29 months). A1. The region in red represents the VFA at baseline (VFA=194.28 cm2). A2. The region in red represents the TFA at baseline (TFA=203.40 cm2). A3. The region in red represents the VFA at progression (VFA=48.65 cm2). A4. The region in red represents the TFA at progression (TFA=96.82 cm2). Case 2: Axial CT images of a patient with better clinical outcomes at the level of the umbilicus. (PFS=15months; OS=46months). B1. The region in red represents the VFA at baseline (VFA=26.34 cm2). B2. The region in red represents the TFA at baseline (TFA=133.00 cm2). B3. The region in red represents the VFA at progression (VFA=72.16 cm2). B4. The region in red represents the TFA at progression (TFA=126.30 cm2). |
Survival Outcomes in the Subgroup of Patients with More Than 2 Metastasis Sites
To investigate the correlation between body fat components and tumor burden, we did a subgroup analysis and further found that the number of increasing body fat components played a crucial role in predicting tumor progression (HR: 0.362, 95% CI: 0.147–0.893, p=0.027) and patient’s survival (HR: 0.403, 95% CI: 0.192–0.849, p=0.017) in the subgroup of patients with ≥2 metastasis sites (Supplemental Table 2, Figure 3C and D).
Just as multivariate analysis in all patients, two types of multivariate analysis were performed (one included SFA and TFA; another included a number of increasing body fat components). Multivariate analysis showed that patients with increasing TFA (p=0.043) or with BMI more than 25 Kg/m2 (p=0.018) had longer PFS, and patients with increasing TFA (p=0.039) or with BMI more than 25 Kg/m2 (p=0.003) also had longer OS (Supplemental Table 3). Moreover, the relationship between the number of increasing body fat components and PFS (HR: 0.620, 95% CI: 0.392–0.979, p=0.040) and OS (HR: 0.395, 95% CI: 0.200–0.781, p=0.008) were also found positive in multivariate analysis (Supplemental Table 3).
Discussion
Metastatic renal cell carcinoma is a fetal disease and TKIs are most prevalent the first-line therapy.22,23 Many pathological and clinical factors could predict and affect the prognosis of patients. Obesity, as one of the well-known etiological factors, increased the risk of developing RCC, was shown a significant association with the progress and prognosis of patients with RCC in some studies.5,24 Naturally, BMI was considered as one of the crucial factors to calculate patients’ obesity and to predict their prognosis with cancer.15,25–28 However, growing evidence suggested that BMI was only a rough initial measurement and it ignored more information about body fat components on an individual level.29
Compared with BMI, body fat composition (such as VFA, SFA, and TFA), as a quantitative method by CT image, has recently been focused on its contributions to the progression of RCC.6,7 However, the relationship between body fat composition and tumor progression and patients’ survival still failed to reach an agreement in different disease stages. Zhu et al reported a positive correlation between the percentage of visceral adipose tissue and the Fuhrman tumor grade in patients with T1a RCC.30 On the contrary, a study by Steffens et al found that mRCC patients with a higher VFA received targeted therapy, could achieve longer tumor-specific survival and OS.12 Nevertheless, the clinical study reported by Mano et al showed that neither SFA nor VFA was associated with tumor stage, grade or OS in a non-metastatic clear cell RCC cohort from the United States.28 Recently, the significant relationship between high VFA and the progression of clear cell RCC among patients from the Chinese south-eastern coast was shown in the study led by Huang et al.31 These conflicting results clearly indicate that further study about the issue is required. In the current study, we provided more evidence to reveal the prognostic value of body fat composition.
The mechanism by which VFA, SFA or TFA to improve the survival of patients with mRCC is not well understood. VFA and SFA differ by the type of adipocytes (fat cells) involved, endocrine function, lipolytic activity and response to insulin and other hormones. Recently, the perturbed or aberrant metabolisms, such as glucose metabolism and lipid metabolism (especial fatty acid synthesis and β-oxidation), are recognized in cancer cells and could facilitate cell growth and proliferation.32–34 Coincidently, patients with visceral obesity have been reported to have a high risk of metabolic complications, eg metabolic syndrome.35
SFA and TFA are always considered as factors of patients’ nutritional status. The reduction of body fat is a mark of cancer cachexia, and malnutrition is related to poor OS in malignant tumors.36,37 As far as we know, the adverse effects of targeted therapy are significant, and gastrointestinal symptoms, like nausea, and inappetence are the most notable.38,39 Furthermore, there were also some studies suggested that body fat be lost more rapidly than lean mass in patients with cancers.40 Therefore, patients who have been undergoing targeted therapy, are more likely to be cachexia. That might be one of the reasons why measurement of VFA, SFA, and TFA could be a more sensitive estimation of nutritional status than BMI.
In this study, we firstly found that the number of increasing body fat components could predict the prognosis of patients treated with TKIs. Combined with these three crucial body fat parameters (VFA, SFA, TFA), body fat accumulation could comprehensively predict patients’ survival status. Taken together, accurate measurement of visceral or subcutaneous obesity might play a vital role in assessing nutritional status (cachexia or not) that could influence survival in patients with mRCC.
The major limitations of our study included retrospective design, small sample and relatively short follow-up. Further study is needed to explore the biological mechanism about the relationship among nutritional factors, therapies, tumor progression, and patient’s survival.
Conclusion
Body fat accumulation, such as high SFA and TFA at progression could improve the survival of patients with mRCC treated with TKIs, especially patients with higher tumor burden. Moreover, the number of increasing body fat components also played a critical role in those patients as a prognostic factor. Body fat accumulation should be considered as an important parameter to assess the survival status of patients with mRCC.
Abbreviations
TKIs, tyrosine kinase inhibitor; mRCC, metastatic renal cell carcinoma; BMI, body mass index; VFA, visceral fat accumulation; SFA, subcutaneous fat accumulation; TFA, total fat accumulation; CR, complete response; PR, partial response; SD, stable disease; PD, progression of disease; ORR, objective response rate; DCR, disease control rate.
Ethics
This study was approved by the Ethics Committee of West China Hospital, Sichuan University. All procedures followed were in accordance with the ethical standards of the responsible committee on human experimentation (institutional and national) and with the Helsinki Declaration of 1975, as revised in 2008. All the patients voluntarily participated in this study and provided written informed consent. All the participants’ personal information is confidential.
Disclosure
The authors report no conflicts of interest in this work.
References
1. Yoshimoto S, Loo TM, Atarashi K, et al. Obesity-induced gut microbial metabolite promotes liver cancer through senescence secretome. Nature. 2013;499(7456):97–101. doi:10.1038/nature12347
2. Wolin KY, Carson K, Colditz GA. Obesity and cancer. Oncologist. 2010;15(6):556–565. doi:10.1634/theoncologist.2009-0285
3. Berger NA. Obesity-associated gastrointestinal tract cancer: from beginning to end. Cancer. 2014;120(7):935–939. doi:10.1002/cncr.28534
4. Callahan CL, Hofmann JN, Corley DA, et al. Obesity and renal cell carcinoma risk by histologic subtype: A nested case-control study and meta-analysis. Cancer Epidemiol. 2018;56:31–37. doi:10.1016/j.canep.2018.07.002
5. Bergstrom A, Hsieh CC, Lindblad P, Lu CM, Cook NR, Wolk A. Obesity and renal cell cancer – a quantitative review. Br J Cancer. 2001;85(7):984–990. doi:10.1054/bjoc.2001.2040
6. Xiao J, Mazurak VC, Olobatuyi TA, Caan BJ, Prado CM. Visceral adiposity and cancer survival: a review of imaging studies. Eur J Cancer Care (Engl). 2018;27(2):e12611. doi:10.1111/ecc.2018.27.issue-2
7. Zhai T, Zhang B, Qu Z, Chen C. Elevated visceral obesity quantified by CT is associated with adverse postoperative outcome of laparoscopic radical nephrectomy for renal clear cell carcinoma patients. Int Urol Nephrol. 2018;50(5):845–850. doi:10.1007/s11255-018-1858-1
8. Gu W, Zhu Y, Wang H, et al. Prognostic value of components of body composition in patients treated with targeted therapy for advanced renal cell carcinoma: a retrospective case series. PLoS One. 2015;10(2):e0118022. doi:10.1371/journal.pone.0118022
9. Wang HK, Song XS, Cheng Y, et al. Visceral fat accumulation is associated with different pathological subtypes of renal cell carcinoma (RCC): a multicentre study in China. BJU Int. 2014;114(4):496–502. doi:10.1111/bju.12592
10. Park YH, Lee JK, Kim KM, et al. Visceral obesity in predicting oncologic outcomes of localized renal cell carcinoma. J Urol. 2014;192(4):1043–1049. doi:10.1016/j.juro.2014.03.107
11. Ladoire S, Bonnetain F, Gauthier M, et al. Visceral fat area as a new independent predictive factor of survival in patients with metastatic renal cell carcinoma treated with antiangiogenic agents. Oncologist. 2011;16(1):71–81. doi:10.1634/theoncologist.2010-0227
12. Steffens S, Grunwald V, Ringe KI, et al. Does obesity influence the prognosis of metastatic renal cell carcinoma in patients treated with vascular endothelial growth factor-targeted therapy? Oncologist. 2011;16(11):1565–1571. doi:10.1634/theoncologist.2011-0213
13. Lee HW, Jeong BC, Seo SI, et al. Prognostic significance of visceral obesity in patients with advanced renal cell carcinoma undergoing nephrectomy. Int J Urol. 2015;22(5):455–461. doi:10.1111/iju.v22.5
14. Hakimi AA, Furberg H, Zabor EC, et al. An epidemiologic and genomic investigation into the obesity paradox in renal cell carcinoma. J Natl Cancer Inst. 2013;105(24):1862–1870. doi:10.1093/jnci/djt310
15. Choi Y, Park B, Jeong BC, et al. Body mass index and survival in patients with renal cell carcinoma: a clinical-based cohort and meta-analysis. Int J Cancer. 2013;132(3):625–634. doi:10.1002/ijc.v132.3
16. Eisenhauer EA, Therasse P, Bogaerts J, et al. New response evaluation criteria in solid tumours: revised RECIST guideline (version 1.1). Eur J Cancer. 2009;45(2):228–247. doi:10.1016/j.ejca.2008.10.026
17. Mosteller RD. Simplified calculation of body-surface area. N Engl J Med. 1987;317(17):1098.
18. Yoshizumi T, Nakamura T, Yamane M, et al. Abdominal fat: standardized technique for measurement at CT. Radiology. 1999;211(1):283–286. doi:10.1148/radiology.211.1.r99ap15283
19. Kobayashi J, Tadokoro N, Watanabe M, Shinomiya M. A novel method of measuring intra-abdominal fat volume using helical computed tomography. Int J Obes Relat Metab Disord. 2002;26(3):398–402. doi:10.1038/sj.ijo.0801921
20. Yuge K, Miyajima A, Jinzaki M, et al. How does visceral obesity affect surgical performance in laparoscopic radical nephrectomy? Jpn J Clin Oncol. 2015;45(4):373–377. doi:10.1093/jjco/hyv001
21. Camp RL, Dolled-Filhart M, Rimm DL. X-tile: a new bio-informatics tool for biomarker assessment and outcome-based cut-point optimization. Clin Cancer Res. 2004;10(21):7252–7259. doi:10.1158/1078-0432.CCR-04-0713
22. Robert J, Motzer EJ, Neeraj Agarwal SB, et al. NCCN clinical practice guidelines in oncology: colon cancer. J Natl Compr Canc Netw. 2019;3.
23. Ljungberg B, Albiges L, Abu-ghanem Y, et al. European association of urology guidelines on renal cell carcinoma: the 2019 update. Eur Urol. 2019;75:799–810. doi:10.1016/j.eururo.2019.02.011
24. Gati A, Kouidhi S, Marrakchi R, et al. Obesity and renal cancer: role of adipokines in the tumor-immune system conflict. Oncoimmunology. 2014;3(1):e27810. doi:10.4161/onci.27810
25. Wang F, Xu Y. Body mass index and risk of renal cell cancer: a dose-response meta-analysis of published cohort studies. Int J Cancer. 2014;135(7):1673–1686. doi:10.1002/ijc.28813
26. Watanabe D, Horiguchi A, Tasaki S, et al. Impact of body mass index on clinicopathological outcomes in patients with renal cell carcinoma without anorexia-cachexia syndrome. Mol Clin Oncol. 2018;8(1):47–53. doi:10.3892/mco.2017.1473
27. Sun L, Chao F, Luo B, et al. Impact of estrogen on the relationship between obesity and renal cell carcinoma risk in women. EBioMedicine. 2018;34:108–112. doi:10.1016/j.ebiom.2018.07.010
28. Mano R, Hakimi AA, Zabor EC, et al. Association between visceral and subcutaneous adiposity and clinicopathological outcomes in non-metastatic clear cell renal cell carcinoma. Can Urol Assoc J. 2014;8(9–10):E675–680. doi:10.5489/cuaj.1979
29. Antoun S, Lanoy E, Albiges-Sauvin L, Escudier B. Clinical implications of body composition assessment by computed tomography in metastatic renal cell carcinoma. Expert Rev Anticancer Ther. 2014;14(3):279–288. doi:10.1586/14737140.2013.866040
30. Zhu Y, Wang HK, Zhang HL, et al. Visceral obesity and risk of high grade disease in clinical t1a renal cell carcinoma. J Urol. 2013;189(2):447–453. doi:10.1016/j.juro.2012.09.030
31. Huang H, Chen S, Li W, Wu X, Xing J. High perirenal fat thickness predicts a poor progression-free survival in patients with localized clear cell renal cell carcinoma. Urol Oncol. 2018;36(4):
32. Liu S, Liu X, Wu F, et al. HADHA overexpression disrupts lipid metabolism and inhibits tumor growth in clear cell renal cell carcinoma. Exp Cell Res. 2019;384:111558. doi:10.1016/j.yexcr.2019.111558
33. Currie E, Schulze A, Zechner R, Walther TC, Farese RV
34. Swierczynski J, Hebanowska A, Sledzinski T. Role of abnormal lipid metabolism in development, progression, diagnosis and therapy of pancreatic cancer. World J Gastroenterol. 2014;20(9):2279–2303. doi:10.3748/wjg.v20.i9.2279
35. Kissebah AH, Krakower GR. Regional adiposity and morbidity. Physiol Rev. 1994;74(4):761–811. doi:10.1152/physrev.1994.74.4.761
36. Tisdale MJ. Molecular pathways leading to cancer cachexia. Physiology (Bethesda, Md). 2005;20:340–348. doi:10.1152/physiol.00019.2005
37. Van Cutsem E, Arends J. The causes and consequences of cancer-associated malnutrition. Eur J Oncol Nurs. 2005;9(Suppl 2):S51–S63. doi:10.1016/j.ejon.2005.09.007
38. Kollmannsberger C, Soulieres D, Wong R, Scalera A, Gaspo R, Bjarnason G. Sunitinib therapy for metastatic renal cell carcinoma: recommendations for management of side effects. Can Urol Assoc J. 2007;1(2 Suppl):S41–S54. doi:10.5489/cuaj.67
39. Escudier B, Pluzanska A, Koralewski P, et al. Bevacizumab plus interferon alfa-2a for treatment of metastatic renal cell carcinoma: a randomised, double-blind Phase III trial. Lancet (London, England). 2007;370(9605):2103–2111. doi:10.1016/S0140-6736(07)61904-7
40. Fouladiun M, Korner U, Bosaeus I, Daneryd P, Hyltander A, Lundholm KG. Body composition and time course changes in regional distribution of fat and lean tissue in unselected cancer patients on palliative care – correlations with food intake, metabolism, exercise capacity, and hormones. Cancer. 2005;103(10):2189–2198. doi:10.1002/(ISSN)1097-0142
 © 2020 The Author(s). This work is published and licensed by Dove Medical Press Limited. The full terms of this license are available at https://www.dovepress.com/terms.php and incorporate the Creative Commons Attribution - Non Commercial (unported, v3.0) License.
By accessing the work you hereby accept the Terms. Non-commercial uses of the work are permitted without any further permission from Dove Medical Press Limited, provided the work is properly attributed. For permission for commercial use of this work, please see paragraphs 4.2 and 5 of our Terms.
© 2020 The Author(s). This work is published and licensed by Dove Medical Press Limited. The full terms of this license are available at https://www.dovepress.com/terms.php and incorporate the Creative Commons Attribution - Non Commercial (unported, v3.0) License.
By accessing the work you hereby accept the Terms. Non-commercial uses of the work are permitted without any further permission from Dove Medical Press Limited, provided the work is properly attributed. For permission for commercial use of this work, please see paragraphs 4.2 and 5 of our Terms.