")
Back to Journals » Neuropsychiatric Disease and Treatment » Volume 15
The prognosis and changes of regional brain gray matter volume in MDD with gastrointestinal symptoms
Authors Liu P , Li G , Zhang A, Sun N, Kang L, Yang C , Wang Y, Zhang K
Received 6 December 2018
Accepted for publication 8 April 2019
Published 9 May 2019 Volume 2019:15 Pages 1181—1191
DOI https://doi.org/10.2147/NDT.S197351
Checked for plagiarism Yes
Review by Single anonymous peer review
Peer reviewer comments 2
Editor who approved publication: Dr Jun Chen
Penghong Liu,1,2 Gaizhi Li,1 Aixia Zhang,1 Ning Sun,1 Lijun Kang,2 Chunxia Yang,1 Yanfang Wang,1 Kerang Zhang1
1Department of Psychiatry, First Hospital of Shanxi Medical University, Taiyuan 030001, People’s Republic of China; 2Department of Psychiatry, Shanxi Medical University, Taiyuan, 030001, People’s Republic of China
Objective: It is common that major depressive disorder (MDD) is accompanied by gastrointestinal (GI) symptoms. However, few studies have focused on the clinical characteristics and its possible mechanism, while brain gray matter (GM) structure is important in the pathogenesis of GI symptoms. In this study, we aimed to investigate the basic clinical characteristics and regional GM volume changes in MDD accompanied by GI symptoms.
Method: Patients with MDD (n=49) and age, gender, and educational level-matched healthy controls (n=30) were recruited. Patients with MDD were divided into two groups based on the GI status: MDD with (n=27) and without (n=22) GI symptoms. The 24-item Hamilton Depression Rating Scale (HAMD) was administered. T1-weighted anatomical images were obtained and analyzed. Correlation analysis was used to identify the possible associations between changed regional GM volume and GI symptoms and depressive symptoms.
Results: The HAMD reductive ratio for 2 weeks of treatment in the GI symptoms group was significantly higher than the non-GI symptoms group (P<0.05). The regional GM volume showed significant differences among the three groups (Gaussian Random Field [GRF] correction, voxel-P<0.01, cluster-P <0.05). Compared with non-GI symptoms group, GI symptoms group exhibited significantly increased GM volume in the left hippocampus, left parahippocampal gyrus, right parahippocampal gyrus; and decreased GM volume in the right middle frontal gyrus, right precentral gyrus, right cuneus, right precuneus, right superior occipital gyrus (GRF correction, voxel-P <0.01, cluster-P <0.05). These altered brain areas were correlated with the GI symptoms, not depressive symptoms.
Conclusion: The changed regional brain GM volume in GI-MDD group may be the pathogenesis for the GI symptoms. In addition, the GI symptoms may predict the prognosis of MDD.
Keywords: major depressive disorder, gastrointestinal symptoms, clinical characters, gray matter volume
Introduction
Major depressive disorder (MDD) is a complex mental disorder caused by many factors. It is estimated currently that the population living with depression is 322 million worldwide and accounts for approximately 4.4% of the world’s population according to the WHO.1
In addition to the psychiatric symptoms, somatic symptoms are often reported in patients with MDD. Majority of MDD have somatic symptoms such as headache, anorexia, constipation, back pain, lack of energy, sleep disturbance and so on. It is reported that more than 69% of the depressed patients experienced somatic symptoms.2 It is also shown that patients with mental disorder have an average of six somatic symptoms over the past month.3,4 Somatic symptoms are common among inpatients and outpatients across all cultures.5 Moreover, it is reported that the somatic symptoms including gastrointestinal (GI) symptoms are associated with increased severity of depressive symptoms, cognitive impairments and poor prognosis of MDD.6
Indeed, the main reasons for patients with depression to seek medical advice are the somatic symptoms.7 These findings suggest that somatic symptoms are the important parts of depressive episodes. According to nationwide epidemiologic study, García-Campayo et al found that the somatic symptoms are strongly associated with the severity of depression, quality of life (QOL), as well as health resources utilization.8 Among these somatic symptoms, GI symptom is the most frequent symptom in MDD. In clinic, there are about 67–71% of patients with depression suffering from anorexia and constipation, the incidence of other GI symptoms is 36–63%.9 For patients with depression, the GI symptoms are so prominent and persistent that they can be diagnosed as functional gastrointestinal disorders (FGIDs).10 The GI symptoms in patients with MDD influence patients‘ health care seeking, depression severity and prognosis. They often visit the digestive department for the GI symptoms including abdominal pains, abdominal distension, heartburn, acid regurgitation, nausea and vomiting, eructation, borborygmus, increased flatus and so on. Mussell et al found the incidence of anxiety and depression increased with severity and frequency of GI symptoms in a stepwise manner. In primary care clinics, the prevalence of MDD and anxiety in patients with GI symptoms was more than four times compared to these without GI symptoms.11 Bekhuis et al reported that the GI symptoms significantly predicted the two-year persistence of MDD.12 Meanwhile, among the patients with digestive system disease such as FGIDs, the rates of anxiety and depression were 61.5% and 57.0%, respectively, which is significantly higher than the general population (5%).13
In conclusion, GI symptoms are closely related to depression and anxiety. However, the pathophysiology of mood-related GI symptoms still remains incompletely understood. In addition to peripheral abnormalities, such as hypersensitivity, GI dysmotility and the dysfunction of the brain–gut axis (BGA), might play a crucial role in the onset and development of the disease. It is increasingly recognized that the two-way communication of BGA have an important effect on the function of the gut and brain.14 Accumulating evidence suggests that the depressive symptoms and GI symptoms of patients with depression may have common pathophysiological mechanisms which may involve the alteration of gut microbiota, immune dysfunction, neuro-endocrine disorders, metabolic disturbance and changes of brain structure as well as function. These disorders are involved in the Bi-directionality of brain–gut Interactions.15–18 So internal and external stimulations can cause emotional changes by BGA. At the same time, the function of GI and other peripheral organs will also be altered.
As early as the 1990s, professor Mearin proposed that the abnormalities of BGA are one of the disease-driven factors behind FGID.19 By using brain imaging techniques, there are increasing evidence supporting that abnormal processing of sensory information at the central nervous system (CNS) is one of the pathophysiologies of FGID and various brain networks, including sensory and salience networks might be relevant.20,21 Positron emission tomography (PET) and fMRI have verified subjects with FGIDs showed altered brain activity during resting-state and GI distension. However, studies exploring brain structure changes in depressive patients with GI symptoms using fMRI were rare.22
In this study, we aimed to investigate the prognosis of MDD with GI symptoms and the regional gray matter (GM) volume changes, furthermore, to explore the possible correlation of changed regional brain GM volume and the GI symptoms.
Methods
Participants
Forty-nine first-episode, drug-naive patients with MDD were recruited from the Department of Psychiatry in the First Hospital of Shanxi Medical University between December 2016 and July 2017. The MDD diagnosis was made using the Diagnostic and Statistical Manual of Mental Disorders Fourth Edition (DSM-5).23 They were interviewed the Chinese version of the Modified Structured Clinical Interview for DSM-5 patient version24 and interviewed using the 24-item HAMD.25
All the subjects included in this study meet the following criteria: 1) aged from 18 to 55 years old; 2) right-handedness; 3) without history of neurological illnesses or other severe diseases; 4) without history of head injury or other comorbid DSM-IV axis I psychiatric disorders; 5) without GI disease; 6) not pregnant or contraindications for MRI scans.
The eligible MDD patients were divided into two groups by the 12th item (GI symptoms) of the HAMD; GI symptoms include abdominal pains, abdominal distension, heartburn, acid regurgitation, nausea and vomiting, eructation, borborygmus, increased flatus, decreased passage of stools, increased passage of stools, loose stools, hard stools, urgent need for defecation, feeling of incomplete evacuation and so on. This item scores from 0 to 2. Zero means no GI symptoms, 1 means occasional discomfort and the GI symptoms is mild, 2 means frequent discomfort with severe symptoms. Among all the participants, 27 patients had at least one of GI symptoms (GI symptoms group) with the item score is 1 or 2 and 22 patients without GI symptoms (non-GI symptoms group), the item score is 0. Three subjects in GI symptoms group and one subject in non-GI symptoms group were excluded due to excessive head motion during fMRI scan. So there were 24 subjects in the GI symptoms group and 21 subjects in the non-GI symptoms group. After receiving antidepressant treatment (all the participants were taking selective serotonin reuptake inhibitors, ie, fluoxetine (20-40 mg/d) for two weeks, all patients were interviewed using HAMD-24 again.
In addition, 30 right-handed healthy controls (HCs group) whose age, gender and years of education matched were recruited from the Physical Examination Center of the First Hospital of Shanxi Medical University. Subjects with mental disorders, neurological illness, GI disease and abnormalities on brain images were excluded. There was no statistical difference among the three groups in terms of age, gender and years of education. The HAMD scores between GI symptoms group and Non-GI symptoms group were not statistically different.
After receiving a thorough description of the study, all participants provided their written informed consent; this study was approved by the Ethical Committee for Medicine of First Hospital of Shanxi Medical University, Taiyuan, China, and conducted in accordance with the Declaration of Helsinki.
Image acquisition
We obtained a series of MRI images using a Siemens Trio 3-Tesla scanner (Siemens, Erlangen, Germany). To reduce head motion and scanner noise, foam pads and earplugs were used during scanning. A 3D-FLASH sequence was used to obtain high-resolution transaxial T1-weighted anatomical images for Voxel-Based Morphometry (VBM) with the following parameters: 120 sagittal slices, TR=14 ms, TE=4.92 ms, thickness/skip=1.5/0.3 mm, FOV=230×230 mm, matrix=256×192 mm, flip angle=25°. The participants were asked to remain awake, close their eyes and relaxed during scanning.
Image processing
SPM 8 and the VBM 8 toolbox were used for T1 image processing. T1 images are normalized to a template space and segmented into GM, white matter and cerebrospinal fluid. After the preprocessing step, a quality check was taken using the modules “Display one slice for all images” and “Check sample homogeneity using covariance”. Normalized images need to be smoothed with an 8-mm full-width at half-maximum Gaussian kernel.
Statistical analyses
IBM SPSS Statistics Version 23.0 was used to determine whether there were differences in demographic and clinical characters in the GI symptoms group, non-GI symptoms group and HCs group. Chi-squared test was used to compare gender across groups. Independent two-sample t-test was done for the analysis of the seven factors and total score of HAMD and also for the HAMD reductive ratio of 2 weeks. One-way ANOVA was used to compare age and years of education for the three groups.
Voxel-based comparison of VBM maps in the three groups was performed using a design model of full factorial in SPM8. On the basis of the results, two-sample t-test was used for comparison between two groups; REST 2.1 (
The differentiated brain areas of GM of all the subjects were extracted using REST.
Correlation analyses (Spearman correlation and Pearson correlation) were conducted to calculate the correlation coefficient between the GM volume of regions of interest and GI symptoms and the total score of HAMD in the MDD groups.
Results
The reductive ratio in two groups
The HAMD reductive ratio of the GI symptoms group is significantly lower than the non-GI symptoms group (Table 1). Further, the reductive ratio (r =-0.346, P=0.022) was negatively correlated with the GI symptoms (Table 4).
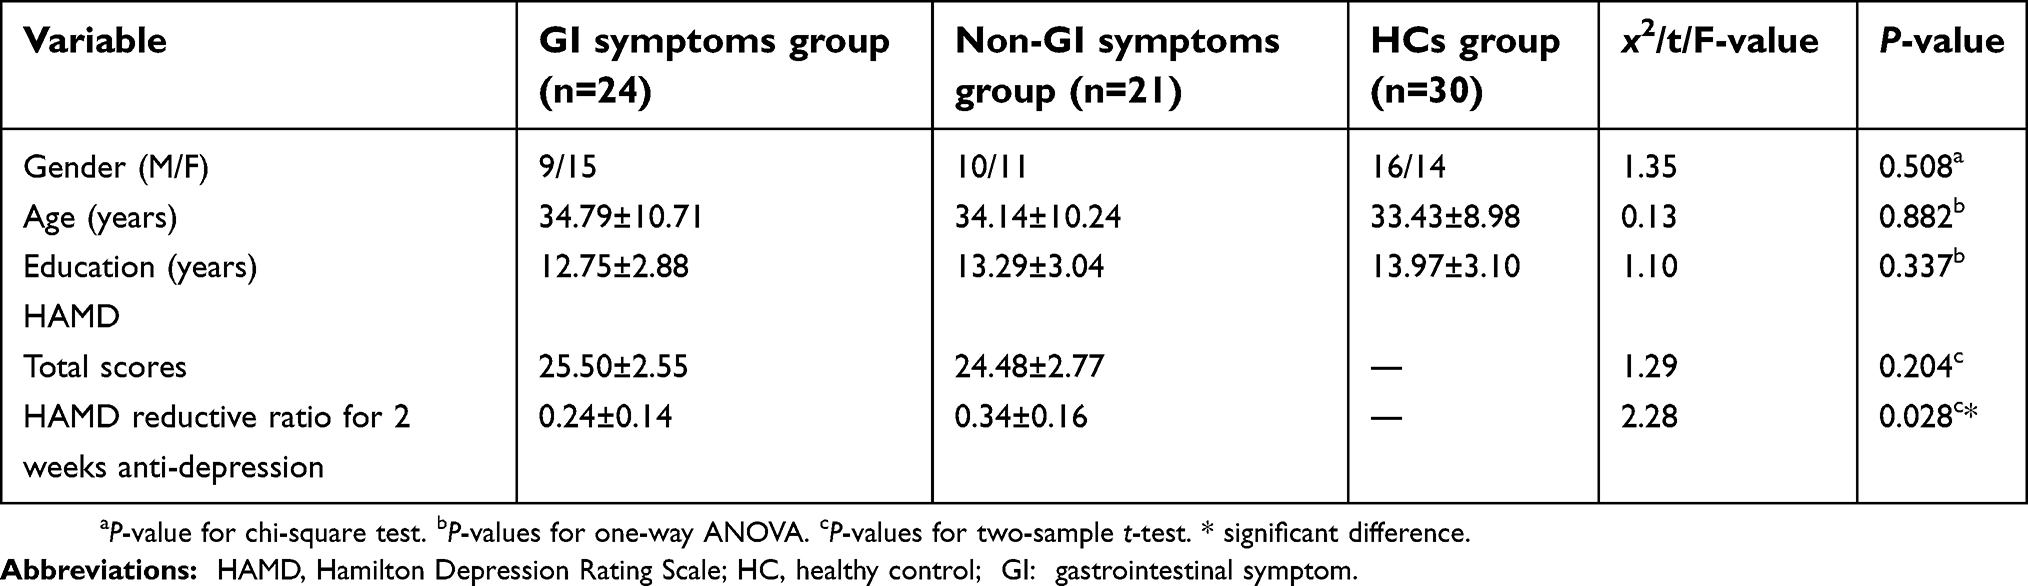 | Table 1 Demographic and clinical characteristics of all participants |
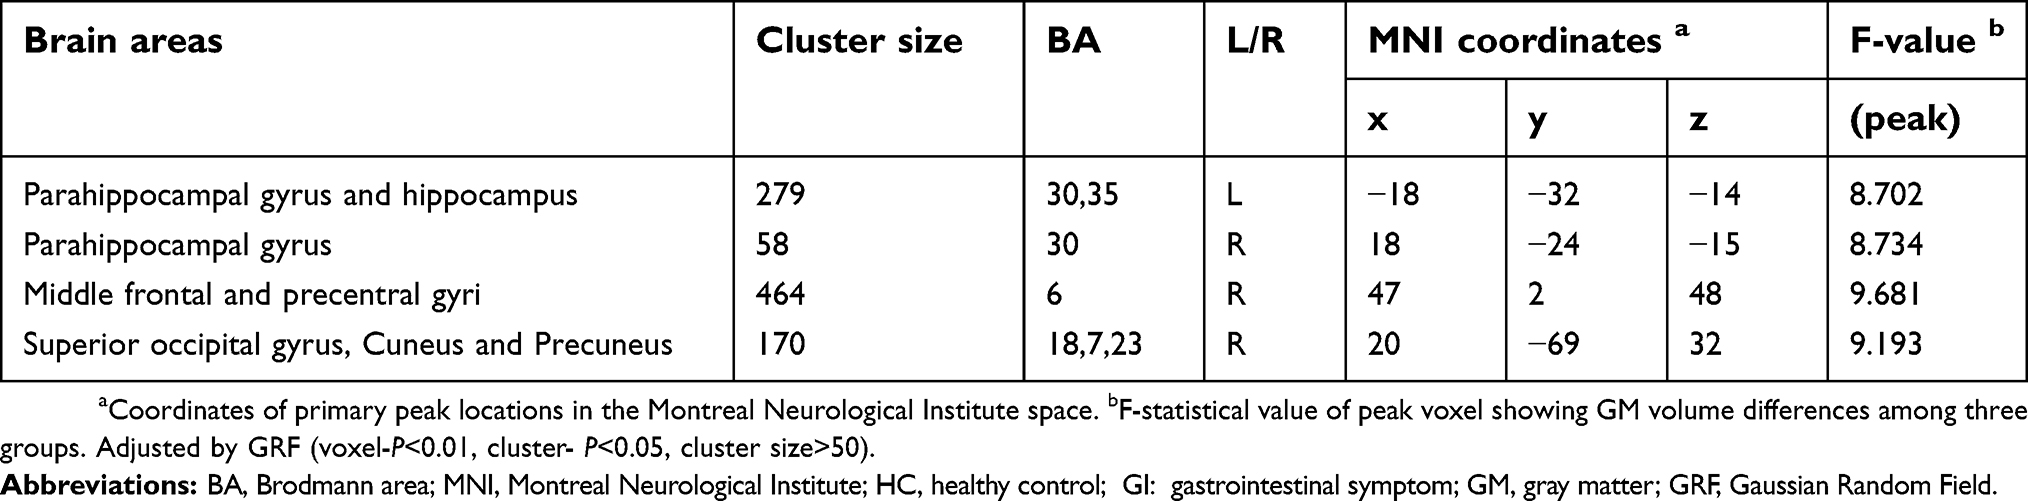 | Table 2 Regional GM volume differences in GI symptoms group, non-GI symptoms group and HCs group |
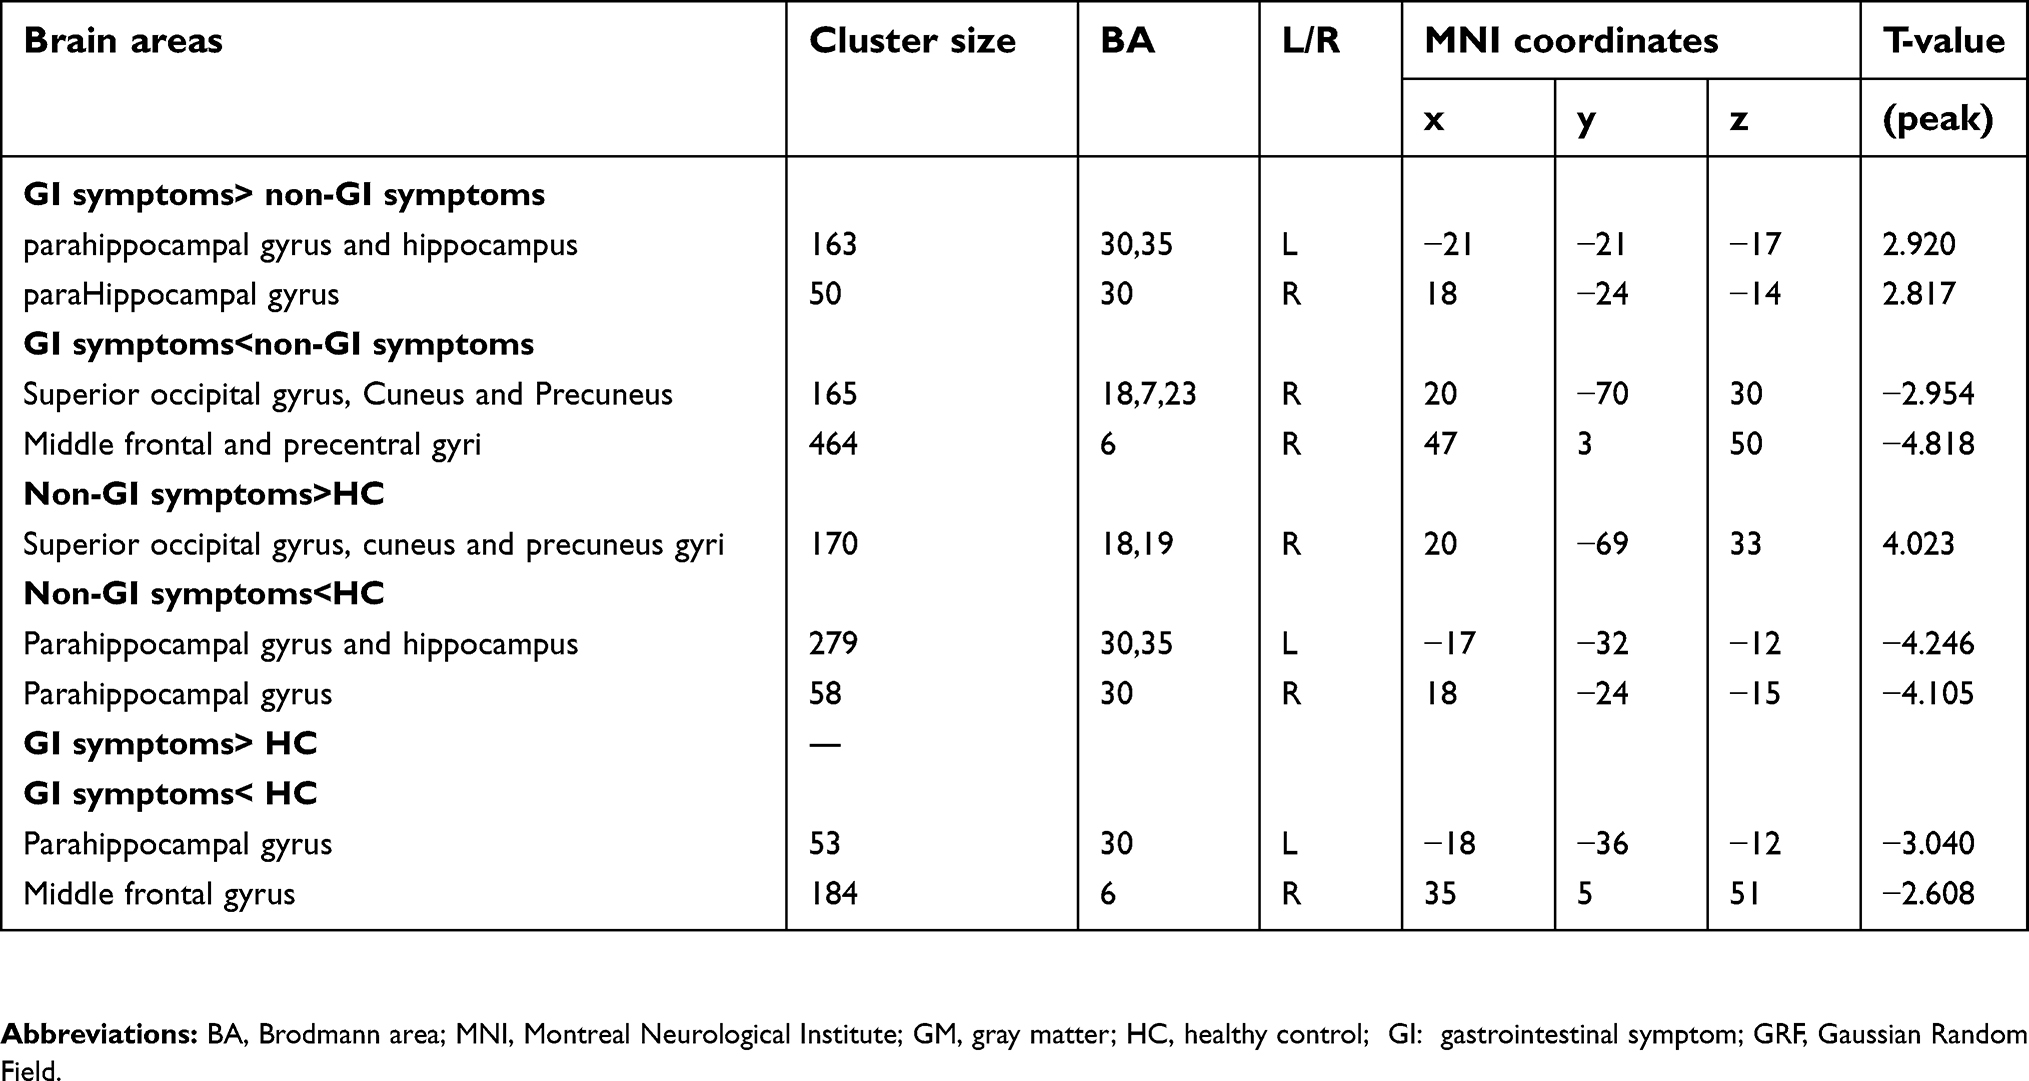 | Table 3 Regional GM volume differences between two groups |
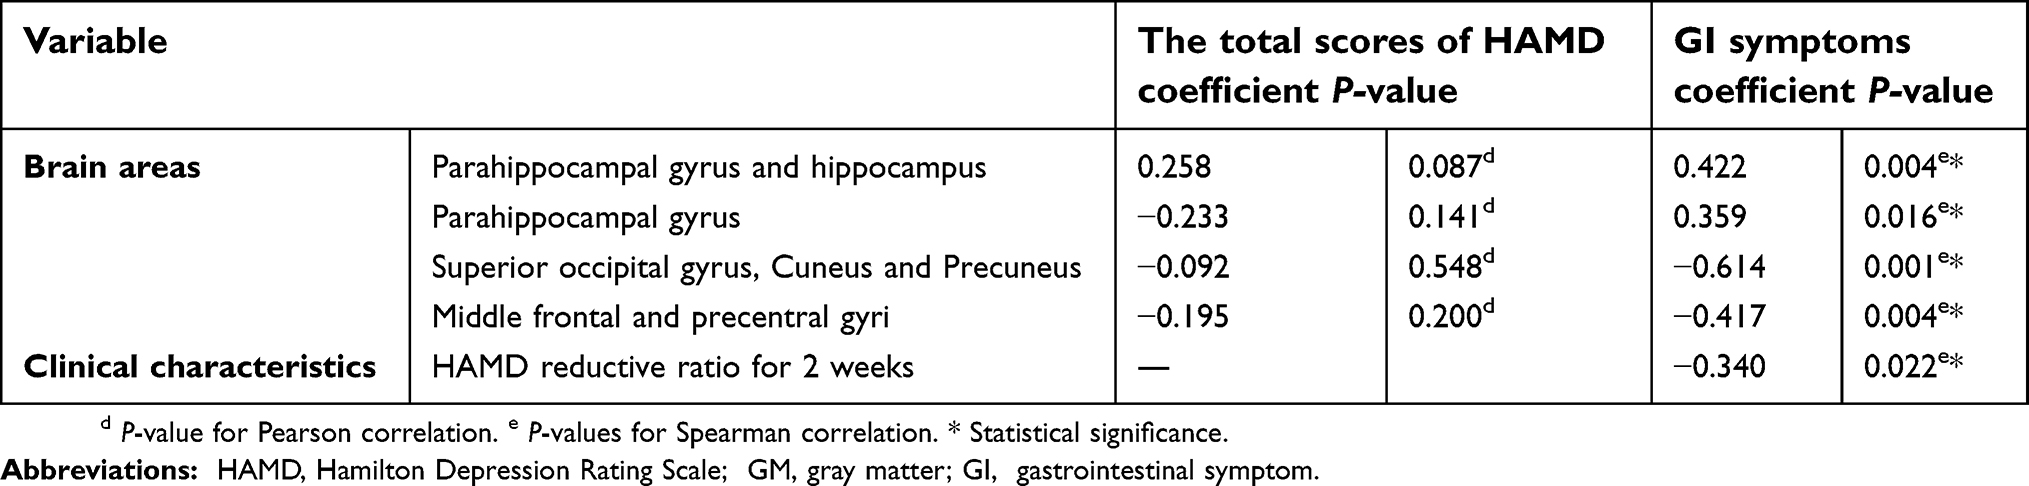 | Table 4 The correlation between the regional GM volume and clinical characteristics |
Regional GM volume differences in GI symptoms group, non-GI symptoms group and HCs group
According to full factorial model analysis, we found that the regional GM volume in the left hippocampus, left parahippocampal gyrus, right parahippocampal gyrus, right middle frontal gyrus, right precentral gyrus, right cuneus, right precuneus and right superior occipital gyrus showed significant differences among the three groups (see Table 2 and Figure 1).
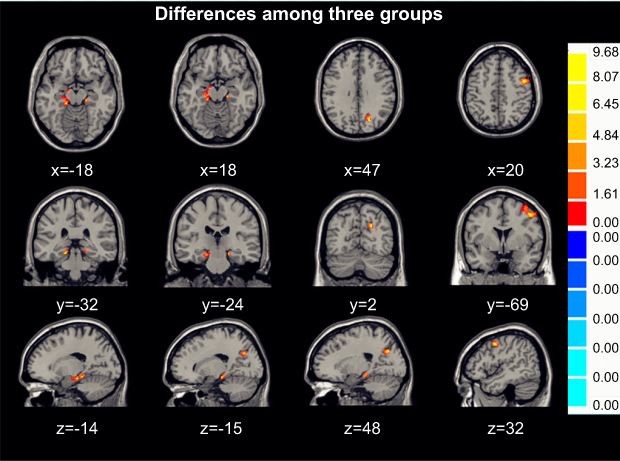 | Figure 1 Regional GM volume differences in GI symptoms group, non-GI symptoms group and HCs group are displayed on axial, coronal and sagittal slices. Numbers indicate x, y and z slices and are displayed in MNI coordinates. Red color denotes increased GM volume. The color bars indicate the F-value based on one-way ANOVA in three groups. (voxel-P<0.01, cluster- P <0.05, cluster size>50, GRF correction).Abbreviations: GM, gray matter; HC, healthy control; GI: gastrointestinal symptom; GRF, Gaussian Random Field. |
Regional GM volume differences between two groups
Compared with non-GI symptoms group, GI symptoms group exhibited significantly increased GM volume in the left hippocampus, parahippocampal gyrus, right parahippocampal gyrus and decreased GM volume in the right middle frontal gyrus, precentral gyrus, rcuneus, precuneus and superior occipital gyrus (see Table 3 and Figure 2).
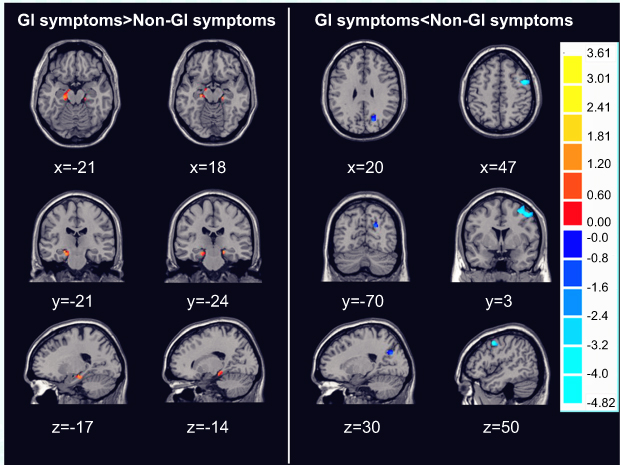 | Figure 2 Regional GM volume differences between GI symptoms group and non-GI symptoms group displayed on axial, coronal and sagittal slices. Numbers indicate x, y and z slices and are displayed in MNI coordinates. Red and blue colors denote increased and decreased GM volume. The color bars indicate the T-value based on two-sample t-test. (voxel- P <0.01, cluster- P <0.05, cluster size>50, GRF correction).Abbreviations: GM, gray matter; MNI, Montreal Neurological Institute; GI: gastrointestinal symptom; GRF, Gaussian Random Field. |
Compared with HCs group, increased GM volume was observed in the non-GI symptoms group in the right cuneus, precuneus, superior occipital gyrus, reduced GM volume in the left hippocampus, parahippocampal gyrus and right parahippocampal gyrus (see Table 3 and Figure 3).
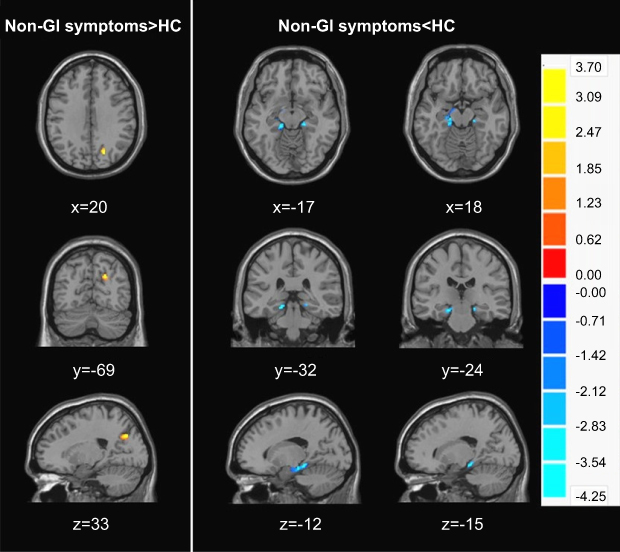 | Figure 3 Regional GM volume differences between non-GI symptoms group and HCs group displayed on axial, coronal and sagittal slices. Numbers indicate x, y and z slices and are displayed in MNI coordinates. Red and blue colors denote increased and decreased GM volume. The color bars indicate the T-value based on two-sample t-test. (voxel- P <0.01, cluster- P <0.05, cluster size>50, GRF correction).Abbreviations: HC, healthy control; GM, gray matter; MNI, Montreal Neurological Institute; GI: gastrointestinal symptom; GRF, Gaussian Random Field. |
The GI symptoms group showed decreased GM volume in the left parahippocampal gyrus, right precuneus and the middle frontal gyrus (see Table 3 and Figure 4).
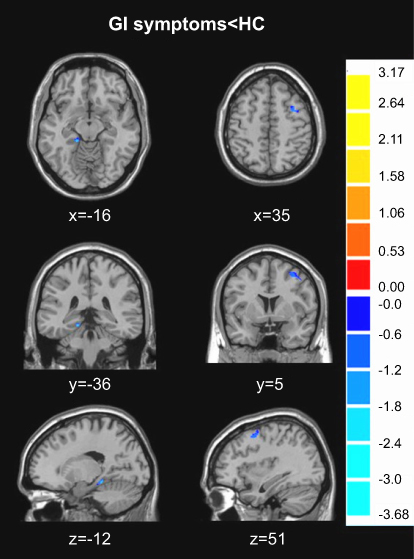 | Figure 4 Regional GM volume differences between GI symptoms group and HCs group displayed on axial, coronal and sagittal slices. Numbers indicate x, y and z slices and are displayed in MNI coordinates. Blue color denotes decreased GM volume. The color bars indicate the T-value based on two-sample t-test. (voxel- P <0.01, cluster- P <0.05, cluster size>50, GRF correction).Abbreviations: HC, healthy control; GM, gray matter; MNI, Montreal Neurological Institute; GI: gastrointestinal symptom; GRF, Gaussian Random Field. |
Associations between the regional GM volume and clinical data
As shown in Table 3, the GM volume in the left hippocampus and parahippocampal (r=0.422, P=0.004) and right parahippocampal (r=0.359, P=0.016) were positively correlated with the GI symptoms. GM volume in the right precentral and middle frontal gyri (r =-0.614, P<0.001), right cuneus, right precuneus and right superior occipital gyrus (r =-0.412, P = 0.005) were inversely correlated with GI symptoms. Pearson’s correlation was performed between the regional GM volume with significant differences and HAMD-24 total scores. However, this relationship was not observed (r =0.181, P>0.05) (see Table 4).
Discussion
This is, to the best of our knowledge, the first study to compare regional brain structure between MDD with and without GI symptoms. This study reveals the basic clinical characters of MDD with GI symptoms and shows the differences in regional brain GM volume between the MDD with and without GI symptoms. Furthermore, this study preliminarily explored the correlations between abnormal brain GM volume and GI symptoms.
The basic clinical characters of MDD with GI symptoms
This is, to the best of our knowledge, the first study to compare regional brain structure between MDD with and without GI symptoms. This study reveals the basic clinical characters of MDD with GI symptoms and shows the differences in regional brain GM volume between the MDD with and without GI symptoms. Furthermore, this study preliminarily explored the correlations between abnormal brain GM volume and GI symptoms.
In this study, we found that the total scores of HAMD were not significant between GI symptoms group and non-GI symptoms group. Further, compared with non-GI symptoms group, we found that the score of HAMD reductive ratio is lower in GI symptoms group after antidepressant treatment for 2 weeks. This indicates that the depression without GI symptoms has a better prognosis.
Previous studies found that somatic symptoms including GI symptoms are strongly associated with the severity of depression.26 However, our result showed that there is no correlation between the GI symptoms and severity of depression (R=0.18 P>0.05). which may be related to the small sample size (45 patients) and disease type (MDD patients in our study).
Generally, the 2 weeks reduced ratio of HAMD-24 of anti-depression treatment can predict the response and prognosis of depression to the drug. Silverstein et al found that depressions accompanied by somatic symptoms have a poor response to antidepressant medication in comparison with depressions without somatic symptoms.27 Xie et al concluded that depressive symptoms improved more slowly and the therapeutic effect is poorer in patients with GI symptoms than those without GI symptoms.28 In this study, we found that the efficacy is better in depression without GI symptoms after antidepressant treatment for 2 weeks. So we speculate that the non-GI symptoms group may have a better prognosis. It was necessary to take individualized therapeutic schedules for depressions with GI symptoms in clinical. Firstly, patients with GI symptoms significantly heavier than emotional cognitive symptoms may have an insufficient motivation or even resistance to antidepressant treatment. So, psychiatrists should communicate with patients and their relatives deeply to make patients realize that GI symptoms are only symptoms of depression, and the GI symptom is one of the major prognostic factors. Secondly, the depressed patients with severe GI symptoms are difficult to recover after 6–8 weeks of regular antidepressant therapy, so the dose required for treatment is higher, or even need to combine with synergist (such as lithium) and drugs improving GI symptoms.29–31
Differences in regional brain GM volume between non-GI symptoms group and HCs group
The VBM is of great significance for understanding the pathogenesis of the disease. The comprehensive analysis of brain GM volume can determine abnormal brain structure in patients and may find structural neuroimaging biomarkers for diagnoses.
Compared with HCs group, non-GI symptoms group showed increased GM volume in the right cuneus, right precuneus and right superior occipital gyrus and reduced GM volume in the left hippocampus, left parahippocampal gyrus and right parahippocampal gyrus. Our results are the same as previous reports. For example, a voxel-based meta-analysis which included 41 studies including 50 comparisons between MDD (1736 patients) and healthy controls (2365 controls) showed that regions of greater volume relative to healthy controls were observed in the right postcentral gyrus, bilateral superior occipital gyrus and right cuneus. Smaller volumes were found in the right middle frontal gyrus, left hippocampus and left parahippocampal gyrus.32Another meta-analysis found that MDD patients presented increased GM volume in the bilateral cuneus and left paracentral gyrus, compared to healthy controls and reduced volume in the bilateral hippocampus.33 Compared with controls, Wise et al found GM volume reductions in bilateral hippocampal and parahippocampal gyrus in MDD patients by meta-analyses. Furthermore, patients with MDD who were currently depressed had a significantly smaller hippocampal volume compared with patients in remission.34 However, the results of these studies are not completely consistent. The GM volume in hippocampus was decreased in all studies. The possible reasons for the inconsistent results were that different studies had distinct demographic characteristics, various imaging acquisition techniques and diverse methods to analyze data.
The hippocampus may influence memory of emotional information, and the signal communication with other regions plays an important role in mood regulation. The hippocampus has been implicated in many mood disorders, with its volume deficits. Indeed, studies in adults have reported reduced hippocampal subfield volumes in both patients with MDD and bipolar disorder. Hippocampus volume reduction has a significant impact on the brain’s executive function, stress regulation and learning process.35,36 In this study, we also found the GM volume changes in cuneus, precuneus and occipital cortex in MDD. The occipital cortex is responsible for the collection and processing of visual information. Alterations of occipital cortex structure may affect the neuropsychological activity of attention and memory which are closely related to visual function. The precuneus located in the medial parietal lobe is thought to be associated with high levels of cognitive function.37 Precuneus is part of the Default Mode Network (DMN). Previous rs-fMRI studies showed that the DMN change plays an important role in pathogenesis of MDD patients.38
Differences in regional brain GM volume between GI symptoms group and non-GI symptoms group
The most important finding of this study was that GI symptoms group exhibited significantly increased GM volume in the left hippocampus, left parahippocampal gyrus and right parahippocampal gyrus and decreased GM volume in the right middle frontal gyrus, right precentral gyrus, right cuneus, right precuneus and right superior occipital gyrus. Furthermore, a correlation analysis was performed. We found that GM volume of identified brain regions correlated with GI symptoms.
There had been a lot of neuroimaging studies on FGID. Brain dysfunctions in FGID have been identified. Zeng et al showed that compared with healthy subjects, patients with FD had higher levels of glycometabolism in prefrontal cortex (PFC), precentral gyrus, postcentral gyrus, right parahippocampal gyrus and left precuneus cortex.39 Van Oudenhove et al used PET techniques and found that occipital cortex, precuneus cortex, hippocampus-amygdala, PFC, and anterior cingulate cortex extensively deactivated during gastric distension in health.40 Seminowicz et al found that patients with IBS exhibited decreased gray matter density (GMD) in medial prefrontal cortex, ventrolateral prefrontal cortex and posterior parietal cortex and increased GMD in (para)hippocampus, and left dorsolateral prefrontal cortex.41 It has been suggested that the GM volume in patients with chronic pain syndromes shows extensive changes.42 Although the results of these studies are inconsistent, they all pointed out that the dysfunction of CNS may be one of the important pathophysiologic mechanisms causing GI symptoms. Our findings were not entirely consistent with previous studies. The possible reasons were that our samples were different from previous studies in size, demographic characteristics and disease type. Further, we used different imaging acquisition techniques and different data analysis method.
The PFC of the brain located on the top hierarchy of visceral sensory network is related to executive and integrative control functions. The cognitive modulation of pain, integration of peripheral information, and response or appraise to affective aspect of pain sensation are performed in the PFC.43 Hippocampus and parahippocampal are important brain regions that are located in the limbic system. In CNS, the functional nucleus associated with the regulation of GI function mainly is located in the limbic system which plays an important role in controlling human emotions, visceral pain and visceral sensation. So the limbic system is also thought as the core of uniting mind and body.20 Precuneus is part of the DMN which is closely related to cognitive and executive functions, such as visual processing, auditory processing, memory, motivation, emotional processing and self-instruction. Many studies showed the importance of the DMN in the pathophysiology of somatization disorder including GI dysfunction.23 To a certain extent, the abnormal persistent activity in the DMN was related to GI symptom severity.44 Although the occipital cortex was frequently reported in functional neuroimaging studies in FGID patients,45 the exact mechanism is still unclear. Previous studies showed that nausea was correlated with the activity of occipital gyrus and that a gastric electrical stimulation can increase the occipital cortex activity.46 These brain regions are associated with the information processing of visceral sensory and visceral motor, so GM volume changes in these brain regions may be related to the GI symptoms.
In this study, we also found that the abnormal brain regions in patients with MDD (comparing non-GI symptoms group with HCs group) and that in the patient with GI symptoms (comparing GI symptoms group with non-GI symptoms group) were nearly consistent. These same brain regions were the left hippocampus, parahippocampal gyrus, right parahippocampal gyrus, cuneus, precuneus and the superior occipital gyrus. This further explains the comorbidity pathophysiological mechanism of MDD and GI diseases.
Limitations
There are several limitations in our study. Firstly, we divide groups by the 12th item (GI symptoms) of the HAMD. It might be better to assess the gastrointestinal symptom rating scale so that it is clear which GI symptom MDD patients have and the severity of GI symptom. Secondly, this is a cross-sectional study, whether GM volume changes are a preexisting abnormality or a consequence of GI symptoms are needed to be examined, long-term follow-up observations and GM volume changes between pretreatment and posttreatment can lead to more profound experimental results. Lastly, there is a relatively small sample size.
Conclusion
In summary, the present study showed the different clinical characters and regional brain GM volume between the GI symptoms group and non-GI symptoms group. Furthermore, we found that the anxiety/somatization, cognitive impairment, weight loss factors and changes of regional brain GM volume in depressed patients are associated with GI symptoms. The accompanied GI symptoms are associated with the prognosis of depression. The current results might provide evidence to support the mechanism of GI symptoms in depression and are helpful for clinical therapy.
Ethics approval and consent to participate
The Ethical Committee for Medicine of the First Hospital of Shanxi Medical University approved this study. Written informed consent was received from all participants prior to inclusion.
Availability of supporting data
The datasets used and/or analyzed during the current study are available from the corresponding author on reasonable request.
Acknowledgments
We would like to thank all the participants in this study. This study was supported by the National key research and development program of China (2016YFC1307103), National Natural Science Foundation of China (No. 81471379), National Natural Science Foundation of China (81701345) and Natural Science Foundation of Shanxi Province for Youths (201601D021151).
Author contributions
All authors contributed to data analysis, drafting and revising the article, gave final approval of the version to be published, and agree to be accountable for all aspects of the work.
Disclosure
The authors report no conflicts of interest in this work.
References
1. Friedrich MJ. Depression is the leading cause of disability around the world. JAMA. 2017;317(15):1517. doi:10.1001/jama.2017.5254
2. Simon GE, VonKorff M, Piccinelli M, Fullerton C, Ormel J. An international study of the relation between somatic symptoms and depression. N Engl J Med. 1999;341(18):1329–1335. doi:10.1056/NEJM199910283411801
3. Wenyuan W. Mechanisms and principles of treatment for different somatic symptoms of depression. Chin J Psychiatry. 2013;46(6):372–374.
4. Bekhuis E, Boschloo L, Rosmalen JG, Schoevers RA. Differential associations of specific depressive and anxiety disorders with somatic symptoms. J Psychosom Res. 2015;78(2):116–122. doi:10.1016/j.jpsychores.2014.11.007
5. Kapfhammer HP. Somatic symptoms in depression. Dialogues Clin Neurosci. 2006;8(2):227–239.
6. Gerrits MM, Vogelzangs N, van Oppen P, van Marwijk HW, van der Horst H, Penninx BW. Impact of pain on the course of depressive and anxiety disorders. Pain. 2012;153(2):429–436. doi:10.1016/j.pain.2011.11.001
7. Kessler D, Lloyd K, Lewis G, Gray DP. Cross sectional study of symptom attribution and recognition of depression and anxiety in primary care. BMJ. 1999;318(7181):436–439.
8. García-Campayo J, Ayuso-Mateos JL, Caballero L, et al. Relationship of somatic symptoms with depression severity, quality of life, and health resources utilization in patients with major depressive disorder seeking primary health care in Spain. Prim Care Companion J Clin Psychiatry. 2008;10(5):355–362.
9. Li Q, Zhang Y, Liu H, et al. Research progress on the relationship between gastrointestinal symptoms in depression and 5-HT system. J Med Res. 2016;45(12):157–159.
10. Sheeber LB, Feil EG, Seeley JR, et al. Mom-net: evaluation of an internet-facilitated cognitive behavioral intervention for low-income depressed mothers. J Consult Clin Psychol. 2017;85(4):355–366. doi:10.1037/ccp0000175
11. Mussell M, Kroenke K, Spitzer RL, Williams JB, Herzog W, Löwe B. Gastrointestinal symptoms in primary care: prevalence and association with depression and anxiety. J Psychosom Res. 2008;64(6):605–612. doi:10.1016/j.jpsychores.2008.02.019
12. Bekhuis E, Boschloo L, Rosmalen JG, de Boer MK, Schoevers RA. The impact of somatic symptoms on the course of major depressive disorder. J Affect Disord. 2016;205:112–118. doi:10.1016/j.jad.2016.06.030
13. Liu J, Diao L, Liu C, et al. Relationship between functional gastrointestinal disorders and psychological factors and related treatment. Chin J Gastroenterol. 2016;21(2):98–100.
14. Collins SM, Surette M, Bercik P. The interplay between the intestinal microbiota and the brain. Nat Rev Microbiol. 2012;10(11):735–742. doi:10.1038/nrmicro2876
15. Bai YM, Chiou WF, Su TP, Li CT, Chen MH. Pro-inflammatory cytokine associated with somatic and pain symptoms in depression. J Affect Disord. 2014;155:28–34. doi:10.1016/j.jad.2013.10.019
16. Kozlowski CM, Green A, Grundy D, Boissonade FM, Bountra C. The 5-HT(3) receptor antagonist alosetron inhibits the colorectal distention induced depressor response and spinal c-fos expression in the anaesthetised rat. Gut. 2000;46(4):474–480.
17. Geng J, Yan R, Shi J, et al. Altered regional homogeneity in patients with somatic depression: A resting-state fMRI study. J Affect Disord. 2019;246:498–505. doi:10.1016/j.jad.2018.12.066
18. Yarandi SS, Peterson DA, Treisman GJ, Moran TH, Pasricha PJ. Modulatory effects of gut microbiota on the central nervous system: how gut could play a role in neuropsychiatric health and diseases. J Neurogastroenterol Motil. 2016;22(2):201–212. doi:10.5056/jnm15146
19. Mearin F, Cucala M, Azpiroz F, Malagelada JR. The origin of symptoms on the brain-gut axis in functional dyspepsia. Gastroenterology. 1991;101(4):999–1006.
20. Coss-Adame E, Rao SS. Brain and gut interactions in irritable bowel syndrome: new paradigms and new understandings. Curr Gastroenterol Rep. 2014;16(4):379. doi:10.1007/s11894-014-0379-z
21. Mayer EA, Labus JS, Tillisch K, Cole SW, Baldi P. Towards a systems view of IBS. Nat Rev Gastroenterol Hepatol. 2015;12(10):592–605. doi:10.1038/nrgastro.2015.121
22. Zhou G, Qin W, Zeng F, et al. White-matter microstructural changes in functional dyspepsia: a diffusion tensor imaging study. Am J Gastroenterol. 2013;108(2):260–269. doi:10.1038/ajg.2012.405
23.
24. Zhang DL. The Chinese Version of the Modified Structured Clinical Interview for DSM-5 Patient Version. Beijing (VA): Peking University Press; 2014.
25. Hamilton M. A rating scale for depression. J Neurol Neurosurg Psychiatry. 1960;23:56–62.
26. Gaspersz R, Lamers F, Kent JM, et al. Anxious distress predicts subsequent treatment outcome and side effects in depressed patients starting antidepressant treatment. J Psychiatr Res. 2017;84:41–48. doi:10.1016/j.jpsychires.2016.09.018
27. Silverstein B, Patel P. Poor response to antidepressant medication of patients with depression accompanied by somatic symptomatology in the STAR*D study. Psychiatry Res. 2011;187(1–2):121–124. doi:10.1016/j.psychres.2010.12.026
28. Xie X. Treatment of depression and anxiety patients with gastrointestinal symptoms as the main complaint. Zhejiang Clin Med J. 2017;19(12):2258–2259.
29. Carney RM, Freedland KE. Are somatic symptoms of depression better predictors of cardiac events than cognitive symptoms in coronary heart disease. Psychosom Med. 2012;74(1):33–38. doi:10.1097/PSY.0b013e3182405ac4
30. Haj KS, Heller J, Bär JK, Wutzler A, Menge BA, Juckel G. Autonomic dysfunction of gastric motility in major depression. J Affect Disord. 2018;226:196–202. doi:10.1016/j.jad.2017.09.049
31. Quick C, Kliem A, Berger S, et al. Gastric dysmotility in major depression. Prog Neuropsychopharmacol Biol Psychiatry. 2010;34(1):92–97. doi:10.1016/j.pnpbp.2009.10.003
32. Wise T, Radua J, Via E, et al. Common and distinct patterns of grey-matter volume alteration in major depression and bipolar disorder: evidence from voxel-based meta-analysis. Mol Psychiatry. 2017;22(10):1455–1463. doi:10.1038/mp.2016.72
33. Peng W, Chen Z, Yin L, Jia Z, Gong Q. Essential brain structural alterations in major depressive disorder: A voxel-wise meta-analysis on first episode, medication-naive patients. J Affect Disord. 2016;199:114–123. doi:10.1016/j.jad.2016.04.001
34. Kempton MJ, Salvador Z, Munafò MR, et al. Structural neuroimaging studies in major depressive disorder. Meta-analysis and comparison with bipolar disorder. Arch Gen Psychiatry. 2011;68(7):675–690. doi:10.1001/archgenpsychiatry.2011.60
35. Alders GL, Amb M, Minuzzi L, Frey BN, MacQueen GM, Hall GB. Altered hippocampal function with preserved cognitive performance in treatment-naive major depressive disorder. Neuroreport. 2019;30(1):46–52. doi:10.1097/WNR.0000000000001163
36. Tannous J, Amaral-Silva H, Cao B, et al. Hippocampal subfield volumes in children and adolescents with mood disorders. J Psychiatr Res. 2018;101:57–62. doi:10.1016/j.jpsychires.2018.03.003
37. Chen Z, Peng W, Sun H, et al. High-field magnetic resonance imaging of structural alterations in first-episode, drug-naive patients with major depressive disorder. Transl Psychiatry. 2016;6(11):e942. doi:10.1038/tp.2016.209
38. Kaiser RH, Andrews-Hanna JR, Wager TD, Pizzagalli DA. Large-scale network dysfunction in major depressive disorder: a meta-analysis of resting-state runctional connectivity. JAMA Psychiatry. 2015;72:603–611. doi:10.1001/jamapsychiatry.2015.0071
39. Zeng F, Qin W, Liang F, et al. Abnormal resting brain activity in patients with functional dyspepsia is related to symptom severity. Gastroenterology. 2011;141(2):499–506. doi:10.1053/j.gastro.2011.05.003
40. Van Oudenhove L, Vandenberghe J, Dupont P, et al. Cortical deactivations during gastric fundus distension in health: visceral pain-specific response or attenuation of ‘default mode‘ brain function? A H2 15O-PET study. Neurogastroenterol Motil. 2009;21(3):259–271. doi:10.1111/j.1365-2982.2008.01196.x
41. Seminowicz DA, Labus JS, Bueller JA, et al. Regional gray matter density changes in brains of patients with irritable bowel syndrome. Gastroenterology. 2010;139(1):48–57.e2. doi:10.1053/j.gastro.2010.03.049
42. Browning M, Fletcher P, Sharpe M. Can neuroimaging help us to understand and classify somatoform disorders? A systematic and critical review. Psychosom Med. 2011;73(2):173–184. doi:10.1097/PSY.0b013e31820824f6
43. Lu HC, Hsieh JC, Lu CL, et al. Neuronal correlates in the modulation of placebo analgesia in experimentally-induced esophageal pain: a 3T-fMRI study. Pain. 2010;148(1):75–83. doi:10.1016/j.pain.2009.10.012
44. Liu P, Zeng F, Zhou G, et al. Alterations of the default mode network in functional dyspepsia patients: a resting-state fmri study. Neurogastroenterol Motil. 2013;25(6):e382–8. doi:10.1111/nmo.12131
45. Lee IS, Wang H, Chae Y, Preissl H, Enck P. Functional neuroimaging studies in functional dyspepsia patients: a systematic review. Neurogastroenterol Motil. 2016;28(6):793–805. doi:10.1111/nmo.12793
46. Lee IS, Kullmann S, Scheffler K, Preissl H, Enck P. Fat label compared with fat content: gastrointestinal symptoms and brain activity in functional dyspepsia patients and healthy controls. Am J Clin Nutr. 2018. doi:10.1093/ajcn/nqy077
 © 2019 The Author(s). This work is published and licensed by Dove Medical Press Limited. The full terms of this license are available at https://www.dovepress.com/terms.php and incorporate the Creative Commons Attribution - Non Commercial (unported, v3.0) License.
By accessing the work you hereby accept the Terms. Non-commercial uses of the work are permitted without any further permission from Dove Medical Press Limited, provided the work is properly attributed. For permission for commercial use of this work, please see paragraphs 4.2 and 5 of our Terms.
© 2019 The Author(s). This work is published and licensed by Dove Medical Press Limited. The full terms of this license are available at https://www.dovepress.com/terms.php and incorporate the Creative Commons Attribution - Non Commercial (unported, v3.0) License.
By accessing the work you hereby accept the Terms. Non-commercial uses of the work are permitted without any further permission from Dove Medical Press Limited, provided the work is properly attributed. For permission for commercial use of this work, please see paragraphs 4.2 and 5 of our Terms.