")
Back to Journals » Journal of Multidisciplinary Healthcare » Volume 13
The Prevalence of Sarcopenic Obesity in Postmenopausal Women with a History of Breast Cancer Depending on Adopted Methodology – A Case–Control Study
Authors Kałędkiewicz E , Milewska M, Panczyk M , Szostak-Węgierek D
Received 6 August 2020
Accepted for publication 22 September 2020
Published 27 November 2020 Volume 2020:13 Pages 1749—1758
DOI https://doi.org/10.2147/JMDH.S274660
Checked for plagiarism Yes
Review by Single anonymous peer review
Peer reviewer comments 3
Editor who approved publication: Dr Scott Fraser
Emilia Kałędkiewicz,1 Magdalena Milewska,1 Mariusz Panczyk,2 Dorota Szostak-Węgierek1
1Department of Clinical Dietetics, Faculty of Health Sciences, Medical University of Warsaw, Warsaw, Poland; 2Department of Education and Research in Health Sciences, Faculty of Health Sciences, Medical University of Warsaw, Warsaw, Poland
Correspondence: Emilia Kałędkiewicz Email [email protected]
Introduction: Sarcopenic obesity (SO) is characterized as the cooccurrence of sarcopenia and obesity. It is associated with many adverse health consequences, also in oncological patients. The study aimed to assess the prevalence of SO in postmenopausal women with a history of breast cancer depending on adopted methodology.
Materials and Methods: The case–control study enrolled 103 women over the age of 50 with a history of breast cancer, including women who completed oncological treatment and had remained in remission for at least 5 years (group I, n=78) and women in whom the disease recurred (group II, n=25). The control group included women with no history of breast cancer (group III, n=73).
Results: In group II sarcopenia occurred significantly more commonly compared to both group I and the control group (for the skeletal muscle index (SMI) ≤ 29.20%: 13 (52%) in group II vs 16 (20.5%) in group I, p=0.004 and 3 (4.1%) in group III, p< 0.001; for SMI ≤ 26.60%: 10 (40%) in group II vs 9 (11.5%) in group I, p=0.003 and 3 (4.1%) in group III, p< 0.001; for SMI ≤ 33.87%: 17 (68%) in group II vs 21 (26.9%) in group I, p< 0.001 and 5 (6.8%) in group III, p< 0.001). Depending on the assessment criteria, SO was diagnosed in 0– 11.5% of cases in group I, 0– 40% of cases in group II and 0– 4.1% in the control group. Intergroup differences were not statistically significant, irrespective of the adopted pair of diagnostic criteria. The highest detectability of SO was observed when SMI was combined with each of the diagnostic criteria for obesity used.
Discussion: SO diagnosis based on the percentage of fatty tissue mass in the body of > 38% and SMI value were associated with a higher detection rate of SO in each study group, regardless of the adopted cut-off value. Similar results were obtained in each analyzed group when using the remaining diagnostic criteria for obesity and SMI value, regardless of the cut-off value.
Keywords: sarcopenia, obesity, breast neoplasms, muscles, menopause, aging
The assessment of body composition has gained a lot of interest in oncology as it may affect the effectiveness of chemotherapy, the frequency of surgery-related complications, the duration of hospital stay and the overall survival rate. It was corroborated by the results published by Prado et al, Antoun et al, Lieffers et al and Cecchini et al.1,9,27,34
The association between obesity and the risk of developing numerous tumors, including breast cancer, has been confirmed by strong evidence.2,26,29,32,37 Furthermore, obesity may constitute a poor prognostic factor in case of this tumor. A meta-analysis of 82 studies, which comprised over 200,000 patients, showed that the risk of death was higher by 75% in premenopausal women and by 34% in postmenopausal women if they were obese at the moment of breast cancer diagnosis, compared to patients with normal body weight.11 Moreover, a strong correlation was demonstrated between obesity and the risk of breast cancer recurrence and death regardless of the fact that the patient was pre- or postmenopausal.46 A meta-analysis of 12 studies, which included 23,832 women, showed that if body weight increased by at least 5% of initial body weight after the diagnosis of breast cancer, the patient was at an increased risk of death due to all causes compared to patients whose body weight did not change (HR, 1.12; 95% CI, 1.03–1.22). The risk of death was the highest in patients whose body weight increased by at least 10%.33
The assessment of adipose tissue mass may be performed with the use of numerous parameters. However, the most common one is body mass index (BMI) defined as body weight/height2 (kg/m2).47 Regrettably, the assessment of the nutritional status with BMI is commonly insufficient. Observations by Cespedes Feliciano et al demonstrated the limitations of the sole use of BMI in oncological patients. BMI scales body weight to height without comprising such parameters as adipose tissue distribution and the differentiation between adipose tissue and muscle tissue.10 Excessive adipose tissue may mask the loss of muscle mass in oncological patients. The appropriate body composition assessment necessitates adequate diagnostic procedures of sarcopenia and sarcopenic obesity.
Sarcopenia is a myopathy caused by unfavorable changes characterized by lifelong progression. Sarcopenia is common in elderly people, but it may also occur in younger individuals.14 It is defined as the loss of muscle mass and function. Menopause is associated with numerous changes in body composition. The changes are predominantly associated with the reduction of the fat-free mass index, including the loss of skeletal muscle, which translates into the decreased strength of muscle contraction. During menopause, the adipose tissue mass increases both generally, and in the central location.47 Sarcopenic obesity (SO) is a new category of obesity, which refers to sarcopenia concomitant with obesity. Its occurrence, especially in the group of oncological patients, is associated with numerous consequences. Therefore, the diagnostics of sarcopenic obesity should become an element of routine proceedings.41
The results of numerous studies indicate that oncological patients in whom sarcopenia was diagnosed are characterized by higher morbidity and mortality rates.4,6,31,35,42 A correlation between the occurrence of sarcopenia and poorer prognosis in patients with early breast cancer was observed by Deluche et al.16 Furthermore, research conducted by Villaseñor et al emphasized the relationship between the occurrence of sarcopenia and overall mortality in patients with breast cancer and the possible influence on breast cancer-related mortality.44 Bandera and John noted that the death risk in the group of women with breast cancer with concomitant sarcopenia was higher than in patients without sarcopenia.5
Lieffers et al demonstrated that patients with colon cancer and concomitant sarcopenia were at risk of adverse effects following colon surgery.27 Prado et al showed that SO constituted a significant prognostic factor in patients with digestive and respiratory system tumors.35 Patients with sarcopenic obesity were characterized by a poorer functional status and shorter overall survival rate. Similar conclusions were drawn from a study conducted in patients with advanced pancreatic cancer. SO was an unfavorable prognostic factor and contributed to lower survival rate.42
However, not all studies revealed similar results. Awad et al demonstrated that adipose tissue mass and fat-free mass were not associated with hospital mortality or survival in patients with esophagogastric cancer.3 Similar conclusions were presented by Hamer and O’Donovan who analyzed the relationship between SO in a group of 6864 patients with no history of oncological conditions.22
The aim of the study
The study aimed to assess the prevalence of SO in postmenopausal women with a history of breast cancer depending on adopted methodology.
Materials and Methods
The case–control study was conducted in Warsaw and the neighboring area. It included women with a history of breast cancer (patients of selected hospitals and members of oncological associations) and their female acquaintances and relatives who were oncologically healthy. The women were informed about the study via banners and leaflets. Furthermore, the information concerning the possibility of participating in the study was also passed by the attending physician. At baseline, all the participants had a document issued by their gynecologist which confirmed that they entered menopause.
The selection of the method of body composition analysis (BIA – Bioelectrical Impedance Analysis) necessitated the following exclusion criteria: confirmed epilepsy, implanted cardiac pacemaker or defibrillator and metal endoprosthesis. Moreover, women with renal or hepatic failure, as well as a metastatic process were excluded. Inclusion criteria were met by 173 women over the age of 50, including 103 women with a history of breast cancer. The participants were divided into three groups. Group I (n=78) included women who had completed oncological treatment and had been in remission for at least 5 years. Group II (n=25) included women who had completed oncological treatment in the past, and in whom the disease recurred. Group III (n=73) was made up of women with no history of breast cancer. The occurrence of sarcopenic obesity was assessed in all the groups.
Body weight was measured with electronic scales in increments of 0.1 kg according to generally accepted measurement standards. The results were used to calculate BMI values (body weight (kg)/height (cm)2). BMI ranges corresponding to normal and low body weight, being overweight and obese were consistent with the recommendations of the WHO. The measurement of hand grip strength of the non-dominant hand was performed twice with a hydraulic SAEHAN dynamometer. Subsequently, the higher value was selected.
Due to changes introduced by EWGSOP2 the cut-off value for sarcopenia was set at 16 kg (instead of 20 kg, as previously assumed in research).12,13
Body composition was estimated by means of bioelectrical impedance method with the use of Bioscan 920–2 device (Maltron Int, UK) at 4 frequencies (5, 50, 100 and 200 kHz). The patient was in a lying position with the limbs abducted from the body axis by 30 degrees. The basic test was performed in a single-channel tetrapolar system on the right side of the body. The application site was cleansed with an alcohol wipe. Then, electrodes were applied 5 cm apart on the dorsal central part of the hand between the carpal joint and the 3rd metacarpophalangeal joint and on the dorsal central part of the foot between the tarsal joint and the 3rd metatarsophalangeal joint, 5 cm apart.19
Study participants were supposed to meet the conditions of the guidelines concerning body composition measurements issued by the European Society for Clinical Nutrition and Metabolism (ESPEN). On the day of examination, the participants had to refrain from eating, void urine 30 minutes before the test, refrain from physical activity for 12 hours prior to the test, resign from the consumption of alcohol or caffeinated beverages for 24 hours prior to the test.19
Basing on the performed tests of body composition and anthropometric measurements the following values were determined:
- fat mass – FM (%),
- fat mass index – FMI (kg/m2) calculated on the basis of the formula: body fat mass [kg]/height [m]2,40
- skeletal mass index – SMI (%) according to the formula: [muscle mass [kg]/(body weight [kg])/100],23
- muscle mass index – MMI (kg/m2) according to the formula: [muscle mass [kg]/(height [m])2],7,43
- fat-free mass index – FFMI (kg/m2) according to the formula: fat-free mass index [kg]/(height [m])2,40
- appendicular skeletal mass index – ASMI (kg/m2); ASMI cut-off value (proposed by EWGSOP2 as a criterion for diagnosing sarcopenia) was used in place of MMI in the present study because of the selected method of body composition testing.14
Obesity was diagnosed when at least one of the following criteria was met:
The adopted cut-off values according to various authors are presented in Table 1. The results obtained in Group III could not be used to determine the cut-off values for the group, because according to Cruz-Jentoft et al they can only be defined for the population of 18–39 years old.13
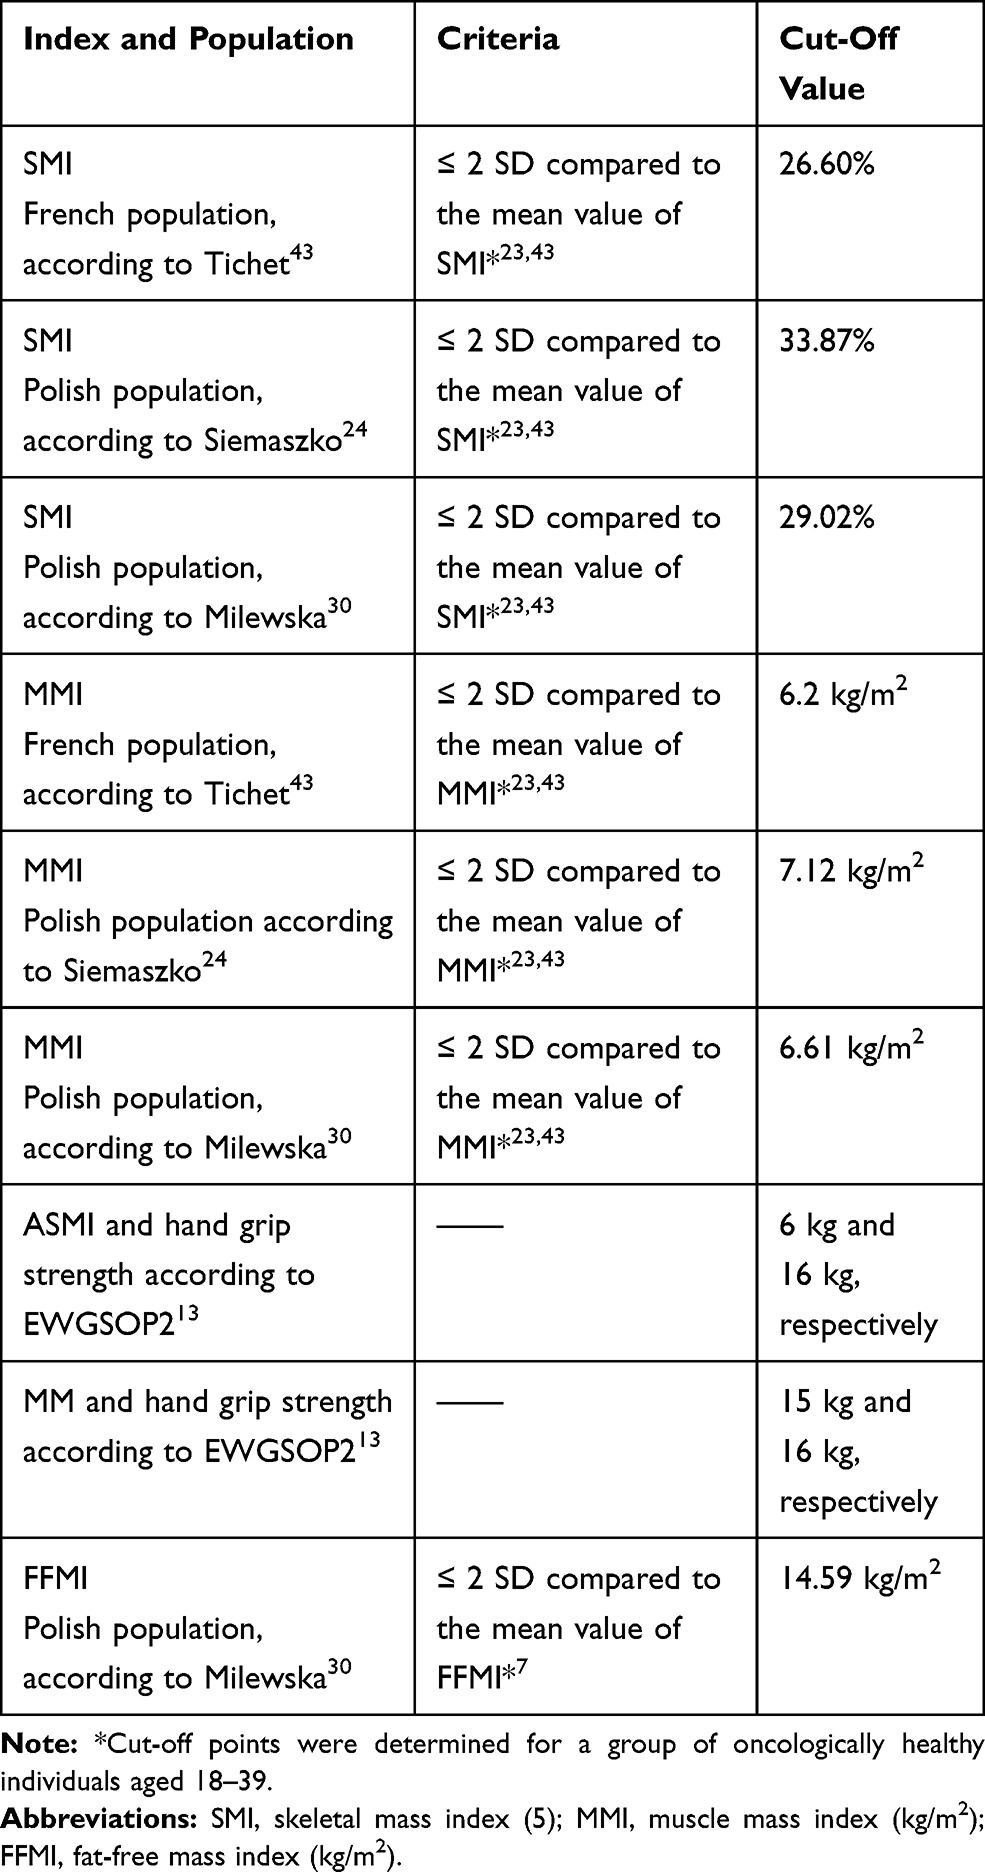 |
Table 1 Diagnostic Criteria and Cut-off Points Used for the Identification of Sarcopenia |
Sarcopenia was defined in accordance with EWGSOP2 guidelines as of 2018 if low muscle mass and low muscle strength were noted. Due to the fact that the present study had been performed before the publication of those guidelines physical fitness was not assessed.13 Sarcopenic obesity was diagnosed when two conditions were met simultaneously: obesity and sarcopenia.
The obtained results were analyzed with Maltron BioScan 920 v. 1.1.135 and Statistica 13.3 (TIBCO Software Inc.). The normality of distribution was tested with the Shapiro–Wilk test. Testing differences between values was performed with the t-Student test or the two-tailed Fisher’s exact test. If the dependent variable was not normally distribution the Mann–Whitney U-test or Kruskal–Wallis ANOVA test (with Dunn's post hoc test with Bonferroni correction) was used. For all analyses, a P-level of <0.05 was considered statistically significant.
Results
Table 2 shows detailed characteristics of the participants. The average age in group I was 67.33±7.03 years, in group II it was 70.92±8.17 and in group III it was 65.44±6.22 years. Group II women were characterized by a significantly higher body mass index (29.03±5.31 vs 26.64±4.21, p=0.05) and muscle mass (19.80±2.79 vs 19.36±1.90, p=0.013) compared to the control group. Moreover, significantly lower values of hand grip strength were noted in group II compared to other groups (12.76±3.97 vs 17.53±4.87 in group I, p<0.001 and 21.82±5.77 in group III, p<0.001).
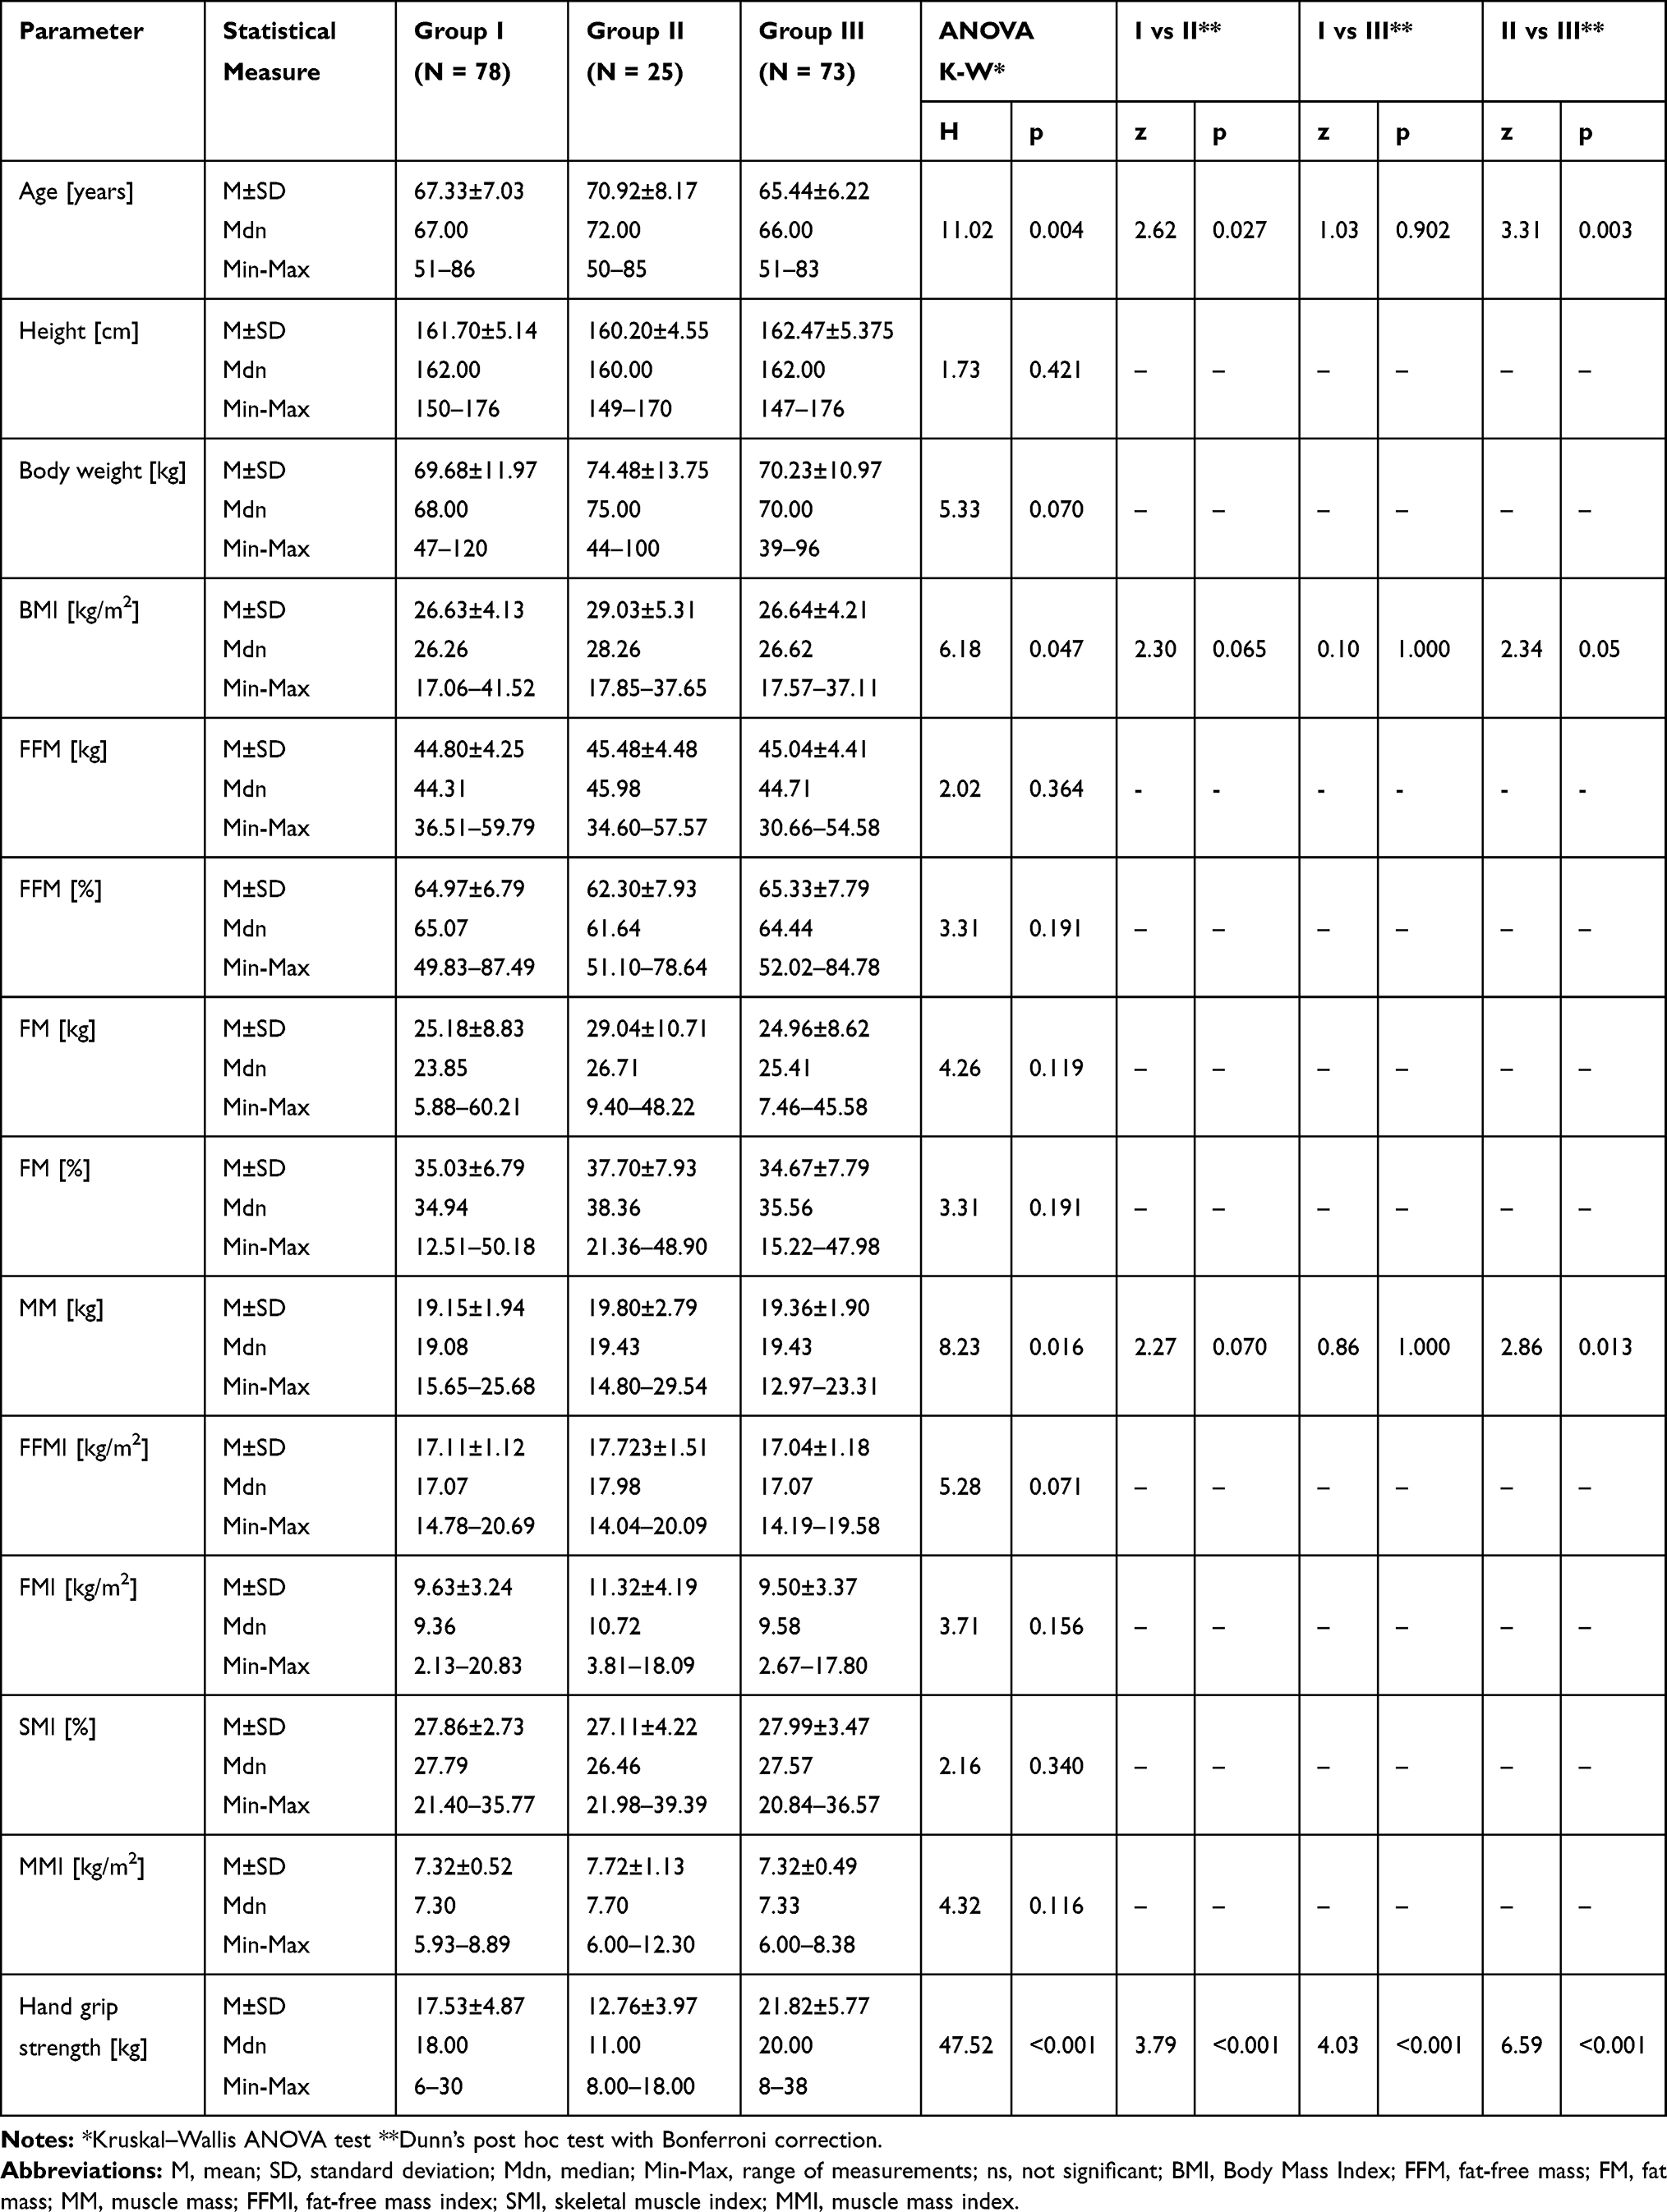 |
Table 2 Characteristics of Subjects According to Groups |
The diagnosis of sarcopenia based on the muscle mass index (MMI) with the use of the cut-off point determined for the Polish population after Milewska revealed 3.8% (n=3) of women with sarcopenia in group I and 4% (n=1) of women in group II. When adopting the cut-off values determined for the French population sarcopenia was diagnosed in 1.3% of group I participants (n=1) and in 4% of persons from group II (n=1). When adopting the cut-off values determined for the Polish population by Siemaszko, sarcopenia was identified in 14.1% of persons in group I (n=11) and in 20% in group II (n=5). The differences which occurred when the MMI criterion was used were statistically significant only as regards the control group (group I vs III p=0.005; group II vs III p=0.004).
Basing on the SMI criterion of sarcopenia classification and the cut-off value determined by Milewska et al, sarcopenia was diagnosed in 20.5% of persons from group I (n=16) and 52% from group II (n=13). The differences were statistically significant (p=0.004). When adopting the cut-off values determined by Tichet, sarcopenia was diagnosed in 11.5% of group I participants (n=9) and in 40% of persons from group II (n=10) (p=0.003). The criteria proposed by Siemaszko showed sarcopenia in 26.9% of women in group I (n=21) and in 68% of women in group II (n=17) (p<0.001).
When adopting the cut-off values indicated by Milewska based on the FFMI, sarcopenia was identified in 4% of persons in group II (n=1). Nobody was diagnosed with sarcopenia in group I. However, the differences were statistically insignificant. Detailed results are presented in Table 3.
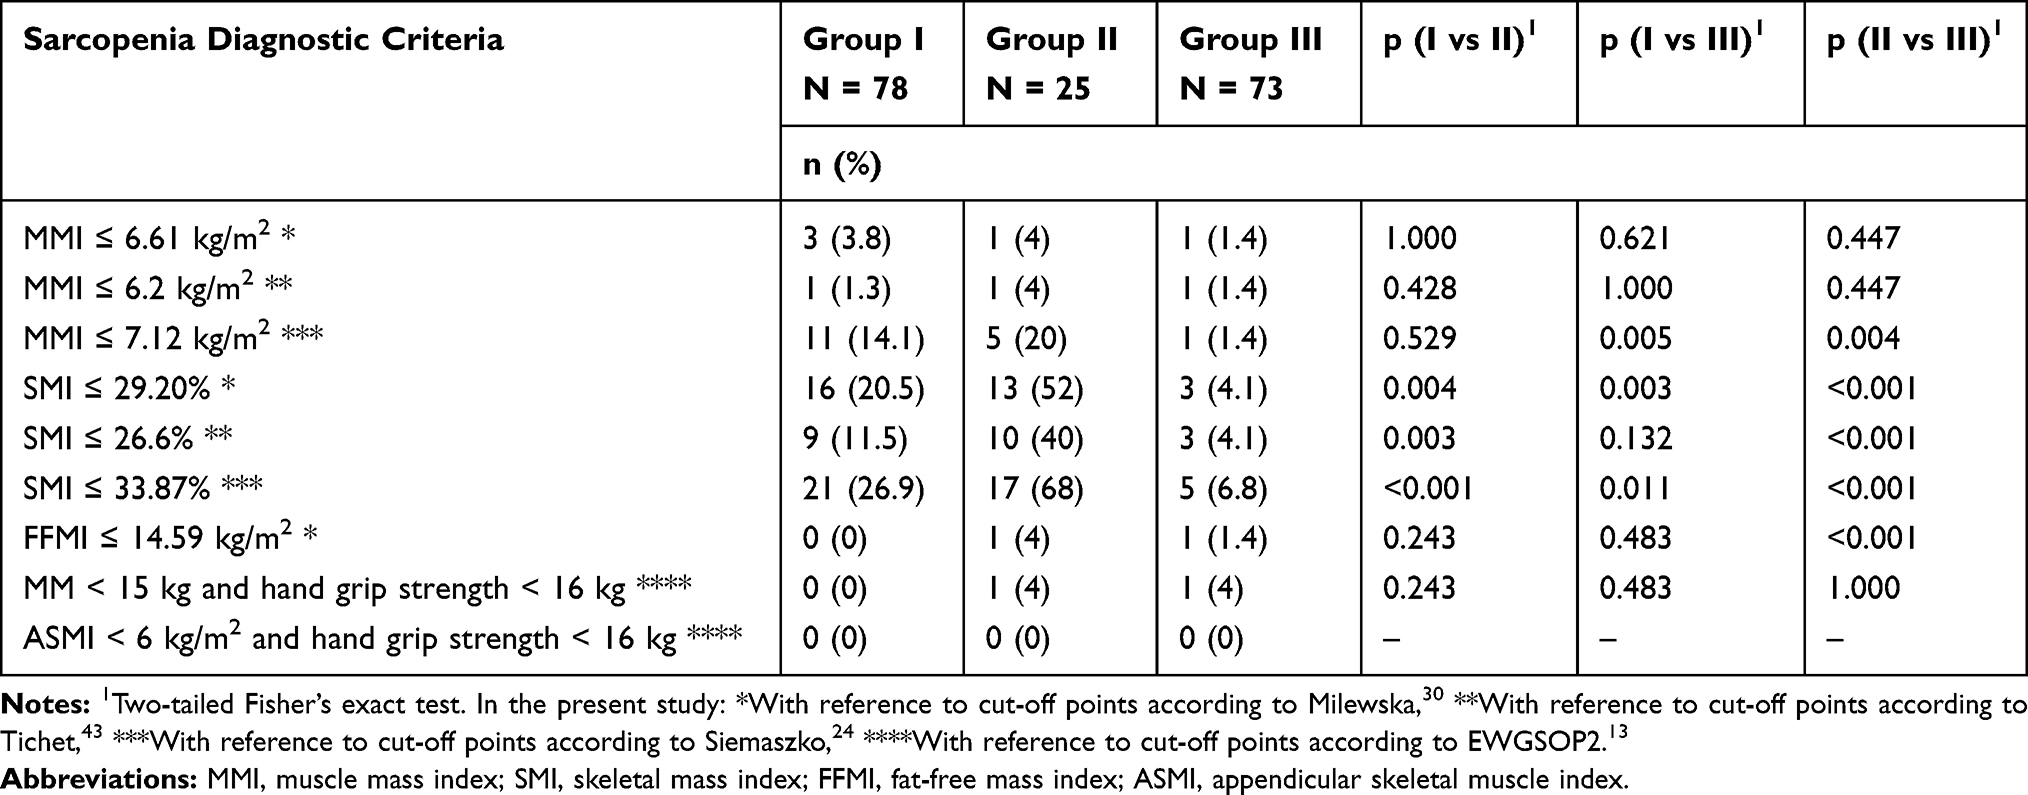 |
Table 3 Prevalence of Sarcopenia in Subjects According to Groups |
The frequency of obesity in individual groups of women identified with various diagnostic criteria are presented in Table 4. Statistically significant differences were only observed in diagnosing obesity with the BMI criterion.
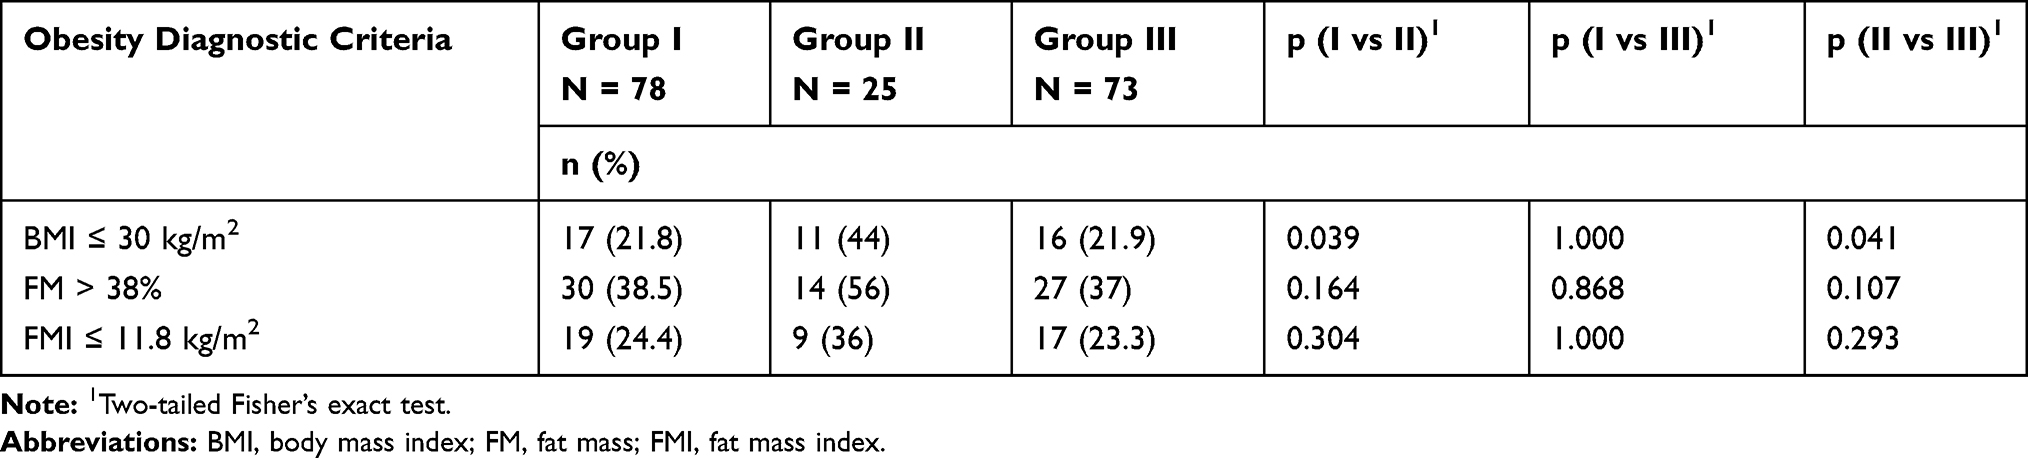 |
Table 4 Prevalence of Obesity in Subjects According to Groups |
Matching the results concerning the diagnosis of sarcopenia and identification of obesity revealed rather diversified findings regarding SO prevalence. The results ranged from 0% to 11.5% in group I and from 0% to 40% in group II. The lowest percentage of SO was revealed based on the FFMI and MMI indices regardless of the adopted cut-off value and in the case of the MM and ASMI combined with hand grip strength. The highest SO detectability was obtained with the use of the skeletal muscle index (SMI) regardless of the adopted cut-off value and the criterion for diagnosing obesity. However, it needs to be emphasized that no statistical significance was noted in the case of any of the observed differences in diagnosing SO with the use of various pairs of criteria. Detailed results are presented in Table 5.
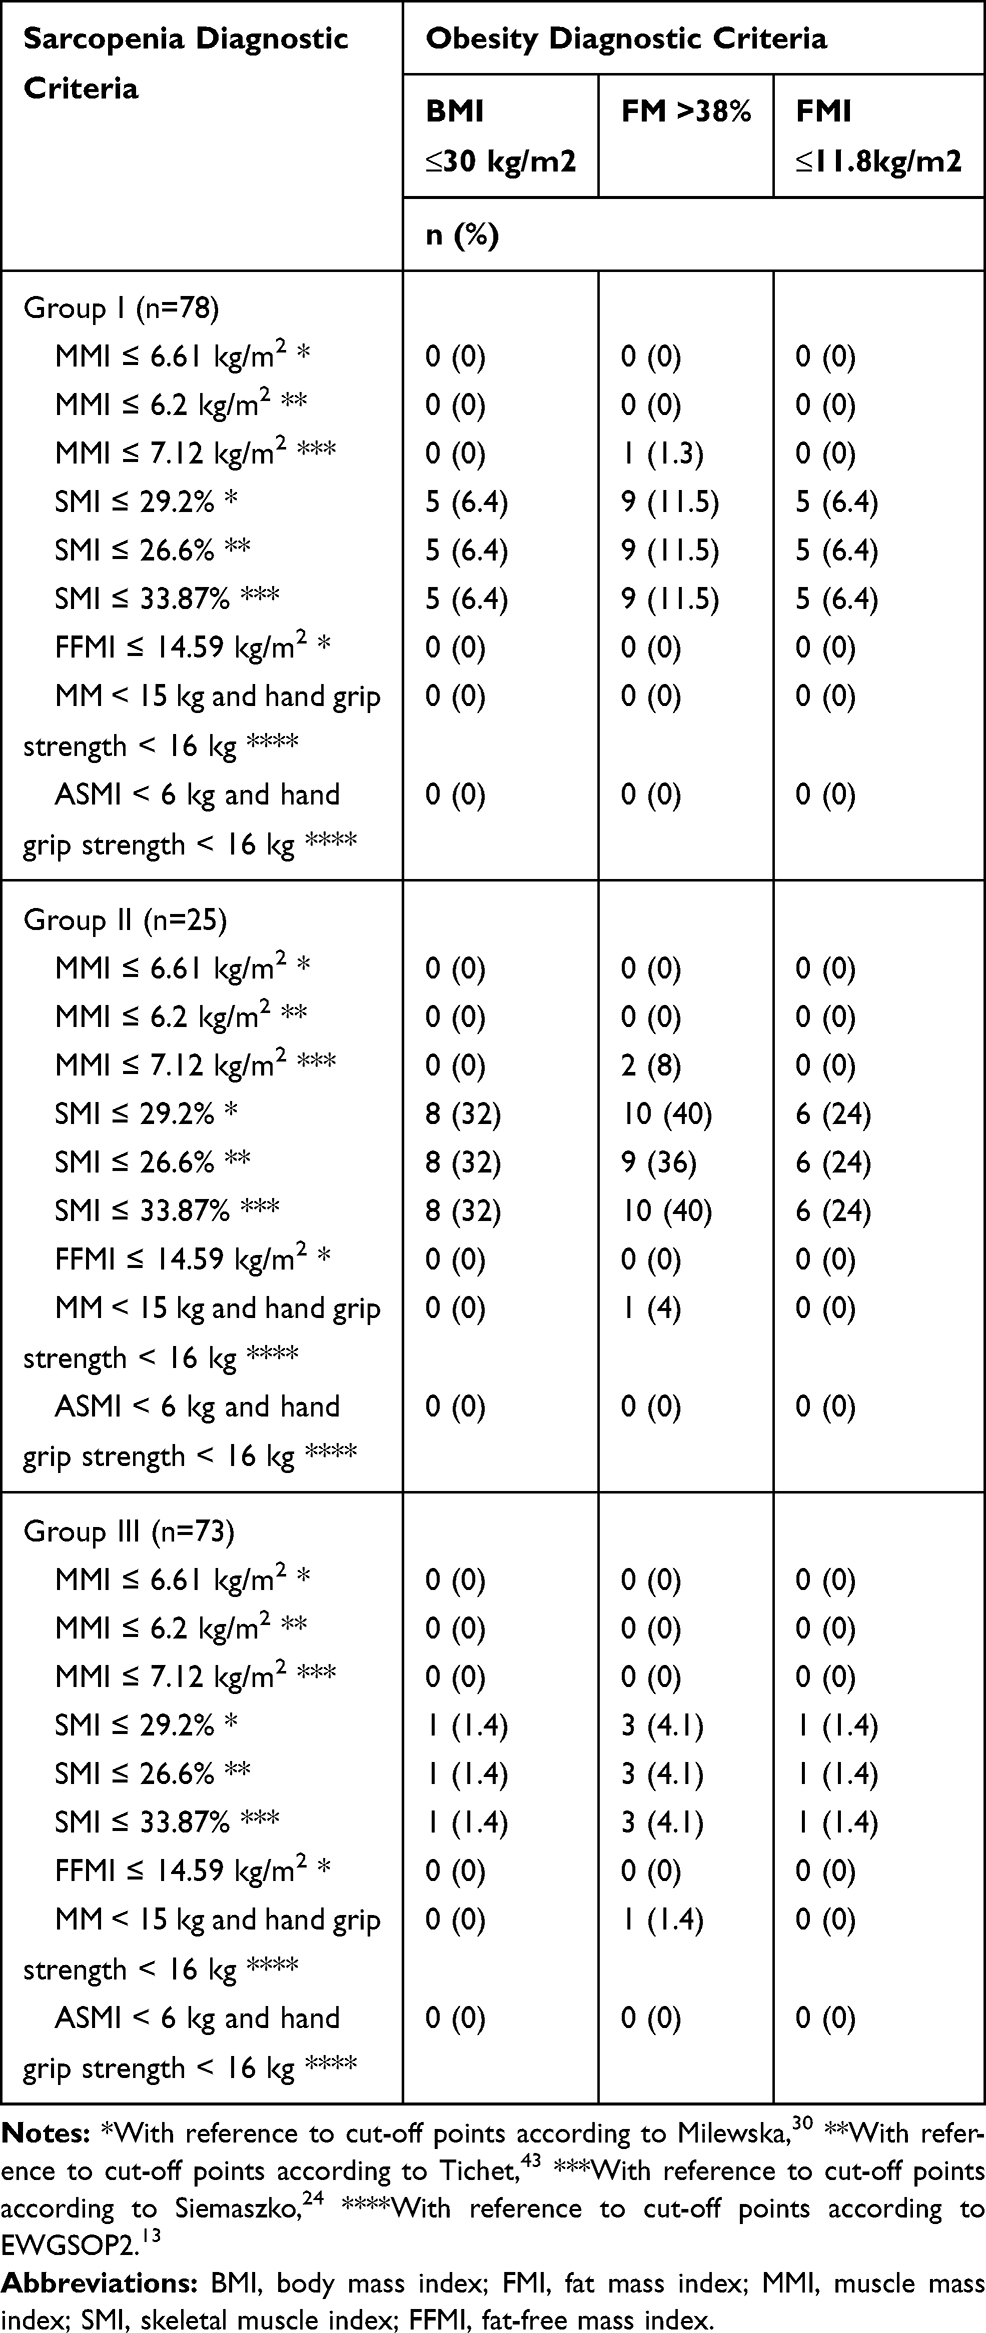 |
Table 5 Prevalence of Sarcopenic Obesity in Subjects According to Groups |
Discussion
According to some criteria, sarcopenia was significantly more common in women with the recurrence of breast cancer than in women in remission and in women with no history of breast cancer (for SMI ≤29.20%: 13 (52%) in group II vs 16 (20.5%) in group I, p=0.004 and 3 (4.1%) in group III, p<0.001; for SMI ≤26.60%: 10 (40%) in group II vs 9 (11.5%) in group I, p=0.003 and 3 (4.1%) in group III, p<0.001; for SMI ≤33.87%: 17 (68%) in group II vs 21 (26.9%) in group I, p<0.001 and 5 (6.8%) in group III, p<0.001). Such a phenomenon may occur due to numerous factors. It seems essential to consider the duration of the neoplastic disease and the related treatment. Furthermore, oncological patients frequently experience fatigue, which translates into reduced physical activity. Neoplastic diseases and implemented oncological treatment are commonly responsible for loss of appetite. Therefore, muscle mass may be reduced, and sarcopenia may develop in patients with oncological diseases.11
SO, which is a combination of obesity and sarcopenia, was diagnosed with three different diagnostic criteria for obesity and nine diagnostic criteria for sarcopenia. The total combination count was 27. The obtained differences in the frequency of SO diagnosed with various pairs of criteria both within particular groups and between groups did not reach the level of statistical significance. It is worth emphasizing that SO diagnosis based on the percentage of fatty tissue mass in the body of >38% and the SMI value was associated with a higher detection rate of SO in each study group, regardless of the adopted cut-off value. Furthermore, similar results were obtained in each analyzed group when using the remaining diagnostic criteria for obesity and the SMI value, regardless of the cut-off value. SMI is the only index that comprises muscle mass and body weight, which makes it more significant in SO diagnostics in individuals with excessive adipose tissue. It may be corroborated by the study by Milewska et al30 and Tichet et al.43 The index prevents the underestimation of sarcopenia occurrence in persons with body weight beyond the reference values. Due to the fact that despite a relatively stable body weight the amount of adipose tissue increases in relation to muscle tissue in elderly people, the diagnosis of SO should be based on several indices.
Regardless of the adopted criterion for diagnosing obesity, the identification of SO with FFMI revealed the lowest percentage of SO cases in all groups. However, the difference was not statistically significant. Siemaszko et al and Milewska et al noted that using this index may be useful in diagnosing SO in individuals with normal and excessive body weight.24,25,30 Similar results were obtained when MMI and ASMI were combined with the index of hand grip strength.
A similar study was conducted by Milewska et al in a group of healthy women.30 Similar to the present study, the highest percentage of individuals with SO was identified with the use of SMI, regardless of the adopted cut-off value. SO diagnosed with the FFMI index led to the lowest detectability of SO, which was similar to our observations.
The obtained results cannot be compared to the results of other researchers because no publication tackling the issue of sarcopenic obesity in women with breast cancer was found.
Several studies assessing the correlation between SO and tumors other than breast cancer were conducted in the past few years. It has not been fully elucidated why some of them revealed a correlation between SO and neoplastic diseases5,8,48,35,39 while others did not.14,15,38 It may be assumed that it is usually due to a small size of the study group in which SO patients constitute a relatively low percentage. SO development is associated with the ageing process of the body and the reduction of physical activity and sedentary lifestyle. As regards oncological patients, SO is additionally associated with muscle mass loss resultant from the course of the disease.28,36 At the same time, in the case of some tumors the tendency towards adipose tissue increase is observed, while the muscle mass is reduced.36 Muscle loss may also be associated with the kind of treatment and administered drugs, persistent inflammation and the catabolic specificity of tumors.20 Patients frequently manifest reduced energy requirement and the implemented treatment often contributes to decreased physical activity and appetite.18 The results of a pilot study by Demark-Wahnefried et al suggested that dietetic interventions and the introduction of physical exercise programs may prove effective in preventing unfavorable changes in body weight and composition in women receiving adjuvant chemotherapy in the treatment of breast cancer.17
The results of numerous studies indicated the necessity of the implementation of body composition assessment in planning the oncological care, including dietetic and physiotherapeutic interventions.16,21,23 It is noteworthy that body composition assessment is simple and may be relatively easily introduced in the routine care of oncological patients. It facilitates the diagnostics of sarcopenia and sarcopenic obesity. However, the precise assessment of the influence of body composition on the effectiveness of oncological treatment requires further research, preferably in the form of prospective clinical studies.6,45
Undoubtedly, small sample size is a limitation of the present study, especially as regards patients with tumor recurrence. The discussion of the problem of SO diagnostics is additionally impeded by the inability to assess the third parameter included in the definition of sarcopenia – physical fitness, and the diversification of outcomes resulting from the necessity to select several options of cut-off values and definitions. It is also difficult to disregard the significance of the difference in the age of the patients in the interpretation of the results. Another limitation of the study is not taking into consideration the role of drugs used by these patients that are not limited to the anticancer treatment, eg, denosumab, also indicated for the prevention of osteoporosis in aromatase inhibitors treated women, has been suggested to modulate insulin resistance and possibly rising metabolic concerns. The lack of data on comorbidity is also a limitation of the study.
Conclusions
Sarcopenia was more common in women with the recurrence of breast cancer than in women in remission and in women with no history of breast cancer. However, this observation requires further study involving a larger group of women. The highest SO detectability was obtained with the use of the skeletal muscle index (SMI), regardless of the adopted cut-off value and the criterion for diagnosing obesity. However, it needs to be emphasized that no statistical significance was noted in the case of any of the observed differences in diagnosing SO with the use of various pairs of diagnostic criteria.
Acknowledgments
This research did not receive any specific grant from funding agencies in the public, commercial, or not-for-profit sectors. The study was accepted by the Bioethics Committee at the Medical University of Warsaw (no KB60/2012). All subjects were asked for their approval before starting the interview and a consent form was explained and then signed by all subjects. This study was conducted in accordance with the Declaration of Helsinki. The manuscript has not been published previously, it is not under consideration for publication elsewhere, its publication is approved by all authors and tacitly or explicitly by the responsible authorities where the work was carried out. If accepted, it will not be published elsewhere in the same form, in English or in any other language, including electronically without the written consent of the copyright holder.
Disclosure
The authors report no conflicts of interest in this work.
References
1. Antoun S, Baracos VE, Birdsell L, Escudier B, Sawyer MB. Low body mass index and sarcopenia associated with dose-limiting toxicity of sorafenib in patients with renal cell carcinoma. Ann Oncol. 2010;21(8):1594–1598. doi:10.1093/annonc/mdp605
2. Argolo DF, Hudis CA, Iyengar NM. The impact of obesity on breast cancer. Curr Oncol Rep. 2018;20(6):47. doi:10.1007/s11912-018-0688-8
3. Awad S, Tan BH, Cui H, et al. Marked changes in body composition following neoadjuvant chemotherapy for oesophagogastric cancer. Clin Nutr. 2012;31(1):74–77. doi:10.1016/j.clnu.2011.08.008
4. Balentine CJ, Enriquez J, Fisher W, et al. Intra-abdominal fat predicts survival in pancreatic cancer. J Gastrointest Surg. 2010;14(11):1832–1837. doi:10.1007/s11605-010-1297-5
5. Bandera EV, John EM. Obesity, body composition, and breast cancer: an evolving science. JAMA Oncol. 2018;4(6):804–805. doi:10.1001/jamaoncol.2018.0125
6. Baracos VE, Arribas L. Sarcopenic obesity: hidden muscle wasting and its impact for survival and complications of cancer therapy. Ann Oncol. 2018;29(2):ii1–ii9. doi:10.1093/annonc/mdx810
7. Baumgartner RN. Body composition in healthy aging. Ann N Y Acad Sci. 2000;904(1):437–448. doi:10.1111/j.1749-6632.2000.tb06498.x
8. Carneiro IP, Mazurak VC, Prado CM. Clinical implications of sarcopenic obesity in cancer. Curr Oncol Rep. 2016;18(10):62. doi:10.1007/s11912-016-0546-5
9. Cecchini S, Cavazzini E, Marchesi F, Sarli L, Roncoroni L. Computed tomography volumetric fat parameters versus body mass index for predicting short-term outcomes of colon surgery. World J Surg. 2011;35(2):415–423. doi:10.1007/s00268-010-0888-3
10. Cespedes Feliciano EM, Kroenke CH, Caan BJ. The obesity paradox in cancer: how important is muscle? Annu Rev Nutr. 2018;38(1):357–379. doi:10.1146/annurev-nutr-082117-051723
11. Chan D, Vieira A, Aune D, et al. Body mass index and survival in women with breast cancer: systematic literature review and meta-analysis of 82 follow-up studies. Ann Oncol. 2014;25(10):1901–1914. doi:10.1093/annonc/mdu042
12. Cruz-Jentoft AJ, Baeyens JP, Bauer JM, et al. Sarcopenia: European consensus on definition and diagnosis: report of the European working group on sarcopenia in older people. Age Ageing. 2010;39(4):412–423. doi:10.1093/ageing/afq034
13. Cruz-Jentoft AJ, Bahat G, Bauer J, et al. Writing group for the European working group on sarcopenia in older people 2 (EWGSOP2), and the extended group for EWGSOP2; sarcopenia: revised European consensus on definition and diagnosis. Age Ageing. 2019;48(1):16–31. doi:10.1093/ageing/afy169
14. Cushen SJ, Power DG, Murphy KP, et al. Impact of body composition parameters on clinical outcomes in patients with metastatic castrate- resistant prostate cancer treated with docetaxel. Clin Nutr. 2016;13:39–45.
15. Del Fabbro E, Parsons H, Warneke CL, et al. The relationship between body composition and response to neoadjuvant chemotherapy in women with operable breast cancer. Oncologist. 2012;17(10):1240–1245. doi:10.1634/theoncologist.2012-0169
16. Deluche E, Leobon S, Desport JC, et al. Impact of body composition on outcome in patients with early breast cancer. Support Care Cancer. 2018;26(3):861–868. doi:10.1007/s00520-017-3902-6
17. Demark-Wahnefried W, Jacobs Kenyon A, Eberle P, Skye A, Kraus WE. Preventing sarcopenic obesity among breast cancer patients who receive adjuvant chemotherapy: results of a feasibility study. Clin Exerc Physiol. 2002;4(1):44–49.
18. Demark-Wahnefried W, Peterson BL, Winer EP, et al. Changes in weight, body composition, and factors influencing energy balance among premenopausal breast cancer patients receiving adjuvant chemotherapy. J Clin Oncol. 2001;19(9):2381–2389. doi:10.1200/JCO.2001.19.9.2381
19. Lochs H, Allison SP, Meier R, et al. ESPEN guidelines. Clin Nutr. 2004;23(5i6):
20. Fearon KC, Arends J, Baracos V. Understanding the mechanisms and treatment options in cancer cachexia. Nat Rev Clin Oncol. 2013;10(2):90–99. doi:10.1038/nrclinonc.2012.209
21. Fielding R, Kirn D, Koochek A, et al. PT02.5: impact of a structured physical activity program and nutritional supplementa- tion on regional body composition: results from the vitality, independence, and vigor in the elderly 2 study (VIVE2). Clin Nutr. 2016;35:S25. doi:10.1016/S0261-5614(16)30294-1
22. Hamer M, O’Donovan G. Sarcopenic obesity, weight loss, and mortality: the english longitudinal study of ageing. Am J Clin Nutr. 2017;106(1):125–129. doi:10.3945/ajcn.117.152488
23. Janssen I, Heymsfield SB, Ross R. Low relative skeletal muscle mass (sarcopenia) in older persons is associated with functional impairment and physical disability. J Am Geriatr Soc. 2002;50(5):889–896. doi:10.1046/j.1532-5415.2002.50216.x
24. Krzymińska-Siemaszko R, Czepulis N, Rzepnicka A. Ocena ryzyka sarkopenii u starszych kobiet. Now Lekarskie. 2013;82(1):19–24.
25. Krzymińska-Siemaszko R. Wieczorkowska-Tobis K: Ocena sarkopenii u osób starszych – przyczynek do metodologii. Now Lekarskie. 2012;81/1:16–20.
26. Kyrgiou M, Kalliala I, Markozannes G, et al. Adiposity and cancer at major anatomical sites: umbrella review of the literature. BMJ. 2017;28:356. doi:10.1136/bmj.j477
27. Lieffers JR, Bathe OF, Fassbender K, Winget M, Baracos VE. Sarcopenia is associated with postoperative infection and delayed recovery from colorectal cancer resection surgery. Br J Cancer. 2012;107(6):931–936. doi:10.1038/bjc.2012.350
28. Lieffers JR, Mourtzakis M, Hall KD, et al. A viscerally driven cachexia syndrome in patients with advanced colorectal cancer: contributions of organ and tumor mass to whole-body energy demands. Am J Clin Nutr. 2009;89(4):1173–1179. doi:10.3945/ajcn.2008.27273
29. Ligibel JA, Alfano CM, Courneya KS, et al. American society of clinical oncology position statement on obesity and cancer. J Clin Oncol. 2014;32(31):3568–3574. doi:10.1200/JCO.2014.58.4680
30. Milewska M, Sińska B, Sych D, Kucharska A. Częstość występowania otyłości sarkopenicznej w grupie kobiet w wieku pomenopauzalnym w zależności od przyjętej metodologii – badanie wstępne. Pol Merkur Lekarski. 2015;XXXVIII/226:206–210.
31. Moon HG, Ju YT, Jeong CY, et al. Visceral obesity may affect oncologic outcome in patients with colorectal cancer. Ann Surg Oncol. 2008;15(7):1918–1922. doi:10.1245/s10434-008-9891-4
32. Nagrani R, Mhatre S, Rajaraman P, et al. Central obesity increases risk of breast cancer irrespective of menopausal and hormonal receptor status in women of South Asian ethnicity. Eur J Cancer. 2016;66:153–161. doi:10.1016/j.ejca.2016.07.022
33. Playdon MC, Bracken MB, Sanft TB, Ligibel JA, Harrigan M, Irwin ML. Weight gain after breast cancer diagnosis and all-cause mortality: systematic review and meta-analysis. J Natl Cancer Inst. 2015;107(12):djv275. doi:10.1093/jnci/djv275
34. Prado CM, Baracos VE, McCargar LJ, et al. Body composition as an independent determinant of 5-fluorouracil-based chemo- therapy toxicity. Clin Cancer Res. 2017;13(11):3264–3268. doi:10.1158/1078-0432.CCR-06-3067
35. Prado CM, Lieffers JR, McCargar LJ, et al. Prevalence and clinical implications of sarcopenic obesity in patients with solid tumours of the respiratory and gastrointestinal tracts: a population-based study. Lancet Oncol. 2008;9(7):629–635. doi:10.1016/S1470-2045(08)70153-0
36. Prado CM, Sawyer MB, Ghosh S, et al. Central tenet of cancer cachexia therapy: do patients with advanced cancer have exploitable anabolic potential? Am J Clin Nutr. 2013;98(4):1012–1019. doi:10.3945/ajcn.113.060228
37. Reeves GK, Pirie K, Beral V, Green J, Spencer E, Bull D. Million women study collaboration. Cancer incidence and mortality in relation to body mass index in the million women study: cohort study. BMJ. 2007;335(7630):1134. doi:10.1136/bmj.39367.495995.AE
38. Rier HN, Jager A, Sleijfer S, et al. Low muscle attenuation is a prognostic factor for survival in metastatic breast cancer patients treated with first line palliative chemotherapy. Breast. 2017;31:9–15. doi:10.1016/j.breast.2016.10.014
39. Sandini M, Bernasconi DP, Fior D, et al. A high visceral adipose tissue to skeletal muscle ratio as a determinant of major complications after pancreatoduodenectomy for cancer. Nutrition. 2016;32(11–12):1231–1237. doi:10.1016/j.nut.2016.04.002
40. Schutz Y, Kyle UU, Pichard C. Fat-free mass index and fat mass index percentiles in Caucasians aged 18–98 y. Int J Obes Relat Metab Disord. 2002;26(7):953–960. doi:10.1038/sj.ijo.0802037
41. Stenholm S, Harris TB, Rantanen T, Visser M, Kritchevsky SB, Ferrucci L. Sarcopenic obesity: definition, cause and consequences. Curr Opin Clin Nutr Metab Care. 2008;11(6):693–700. doi:10.1097/MCO.0b013e328312c37d
42. Tan BH, Birdsell LA, Martin L, Baracos VE, Fearon KC. Sarcopenia in an overweight or obese patient is an adverse prognostic factor in pancreatic cancer. Clin Cancer Res. 2009;15(22):6973–6979. doi:10.1158/1078-0432.CCR-09-1525
43. Tichet J, Vol S, Goxe D, Salle A, Berrut G, Ritz P. Prevalence of sarcopenia in the French senior population. J Nutr Health Aging. 2008;12(3):202–206. doi:10.1007/BF02982621
44. Villaseñor A, Ballard-Barbash R, Baumgartner K, et al. Prevalence and prognostic effect of sarcopenia in breast cancer survivors: the HEAL study. J Cancer Surviv. 2012;6(4):398–406. doi:10.1007/s11764-012-0234-x
45. Yip C, Goh V, Davies A, et al. Assessment of sarcopenia and changes in body composition after neoadjuvant chemotherapy and associations with clinical outcomes in oesophageal cancer. Eur Radiol. 2014;24(5):998–1005. doi:10.1007/s00330-014-3110-4
46. Yung RL, Ligibel JA. Obesity and breast cancer: risk, outcomes, and future considerations. Clin Adv Hematol Oncol. 2016;14(10):790–797.
47. Zamboni M, Mazzali G, Fantin F, Rossi A, Di Francesco V. Sarcopenic obesity: a new category of obesity in the elderly. Nutr Metab Cardiovasc Dis. 2008;18(5):388–395. doi:10.1016/j.numecd.2007.10.002
48. Pecorelli N, Carrara G, De Cobelli F, et al. Effect of sarcopenia and vis- ceral obesity on mortality and pancreatic fistula following pancreatic cancer surgery. Br J Surg. 2016;103(4):434–442. doi:10.1002/bjs.10063
 © 2020 The Author(s). This work is published and licensed by Dove Medical Press Limited. The full terms of this license are available at https://www.dovepress.com/terms.php and incorporate the Creative Commons Attribution - Non Commercial (unported, v3.0) License.
By accessing the work you hereby accept the Terms. Non-commercial uses of the work are permitted without any further permission from Dove Medical Press Limited, provided the work is properly attributed. For permission for commercial use of this work, please see paragraphs 4.2 and 5 of our Terms.
© 2020 The Author(s). This work is published and licensed by Dove Medical Press Limited. The full terms of this license are available at https://www.dovepress.com/terms.php and incorporate the Creative Commons Attribution - Non Commercial (unported, v3.0) License.
By accessing the work you hereby accept the Terms. Non-commercial uses of the work are permitted without any further permission from Dove Medical Press Limited, provided the work is properly attributed. For permission for commercial use of this work, please see paragraphs 4.2 and 5 of our Terms.