")
Back to Journals » Diabetes, Metabolic Syndrome and Obesity » Volume 14
The Predictive Value of Visceral Adiposity Index and Lipid Accumulation Index for Microalbuminuria in Newly Diagnosed Type 2 Diabetes Patients
Authors Qi L, Kang N, Li Y, Zhao H, Chen S
Received 20 January 2021
Accepted for publication 24 February 2021
Published 11 March 2021 Volume 2021:14 Pages 1107—1115
DOI https://doi.org/10.2147/DMSO.S302761
Checked for plagiarism Yes
Review by Single anonymous peer review
Peer reviewer comments 2
Editor who approved publication: Prof. Dr. Juei-Tang Cheng
Licui Qi,1,2 Ning Kang,3 Yong Li,2 Hang Zhao,2 Shuchun Chen2
1Graduate School of Hebei North University, Zhangjiakou, 075000, People’s Republic of China; 2Endocrinology Department, Hebei General Hospital, Shijiazhuang, 050051, People’s Republic of China; 3Graduate School of Hebei Medical University, Shijiazhuang, 050000, People’s Republic of China
Correspondence: Shuchun Chen
Endocrinology Department, Hebei General Hospital, 348 Heping West Road, Shijiazhuang, Hebei, 050051, People’s Republic of China
Email [email protected]
Purpose: This study aims to investigate the predictive value of visceral adiposity index (VAI) and lipid accumulation index (LAP) for microalbuminuria (MAU) in patients with newly diagnosed Type 2 diabetes (T2DM).
Patients and Methods: This study included 335 patients with newly diagnosed T2DM patients from Hebei General Hospital. All the patients aged from 18 to 65 years old include 226 males and 109 females. Patients information and blood indicators were Collected and calculated the LAP and VAI scores. All the patients were divided into males (group A) and females (group B), and these groups were then further subdivided into A1 group which arises microalbuminuria, and A2 group which does not. With the same method, women were divided into B1 group and B2 group.
Results: Baseline data analysis showed that LAP and VAI levels in A1 and B1 groups were significantly higher than those in A2 and B2 groups (P< 0.05). Logistic regression analysis showed that fasting blood glucose, waist circumference, LAP, and VAI were independent risk factors for the occurrence of microalbuminuria in both males and females. ROC showed that the area under curve (AUC) of waist circumference, fasting blood glucose, LAP and VAI in male patients were 0.626, 0.676, 0.760 and 0.742, respectively, and in female patients were 0.703, 0.685, 0.787 and 0.764, respectively. In addition, the area under the curve of both LAP and VAI was higher in females than in males.
Conclusion: This study confirmed that both LAP and VAI had predictive values for the occurrence of urinary microalbumin in newly diagnosed T2DM patients. The predictive value was higher in the female group and the suggestion was more applicable to female patients.
Keywords: visceral adiposity index, lipid accumulation index, type 2 diabetes, microalbuminuria
Introduction
Diabetes mellitus (DM) is one of the most common chronic diseases in China, and its incidence is gradually increasing. According to the latest epidemiological survey data, the prevalence of diabetes in China has risen to 11.2%,1 among which type 2 diabetes is the major disease. Diabetic kidney disease (DKD) is one of the most important microvascular complications with the highest mortality rate of diabetes, and it is one of the most main causes of chronic kidney disease (CKD) and end-stage renal disease (ESRD).2 The appearance of microalbuminuria is the early manifestation of DKD and the main basis for the diagnosis of DKD, hence, clinical screening and identification of microalbuminuria is particularly important.
The incidence of T2DM in obese and overweight people has significantly increased,3 and compared with general obesity, central obesity has a stronger correlation with the morbidity and mortality of type 2 diabetes.4 Extensive epidemiological studies have shown that obesity, especially visceral obesity, is closely related to the occurrence of CKD.5,6 In clinical practice, body mass index (BMI) is used to evaluate obesity and overweight, but it cannot distinguish between central obesity and peripheral obesity. Waist circumference (WC) is a common indicator used to evaluate central obesity, but it cannot distinguish subcutaneous fat from visceral fat. In clinical practice, magnetic resonance imaging (MRI) and computed tomography (CT) can accurately measure visceral adipose tissue content,7 but it requires highly professional physicians to measure it, and it is expensive and limited by many factors, such as the influence of radiation.
In recent years, two new body fat indexes, visceral fat index (VAI) and lipid storage index (LAP) have been proposed. Studies have shown that VAI and LAP have important values for the evaluation of visceral fat content, distribution and function, which are comparable to those of CT and MRI. Current studies on LAP and VAI mainly focus on the prediction of cardiovascular diseases, diabetes, fatty liver, metabolic syndrome and other diseases.8–13 As far as we know, few studies have been conducted on the prediction of microalbuminuria. This study was designed to investigate the predictive values of VAI and LAP for microalbuminuria in newly diagnosed type 2 diabetes patients.
Patients and Methods
Study Design
This was a cross-sectional study. The study was conducted in accordance with the Declaration of Helsinki and approved by the Hebei General Hospital Ethics Committee.
Participants Recruitment
A total of 455 newly diagnosed T2DM patients admitted to the Department of Endocrinology of Hebei General Hospital from April 2018 to April 2019 were collected. According to the inclusion and exclusion criteria, 335 newly diagnosed T2DM patients were finally included in this study, including 226 males and 109 females. The researchers explained the study purpose and procedure to the recruited patients. Each patient signed an informed consent form. The recruitment was carried out by two researchers according to the inclusion and exclusion criteria. The inclusion and exclusion criteria refer to the “Guidelines for the Prevention and Treatment of Type 2 Diabetes in China (2017 Edition)”14
Inclusion Criteria
- Diagnosis of T2DM according to World Health Organization criteria.
- Duration of diabetes ≤90 days;
- Aged from 18 to 65 years old.
Exclusion Criteria
- Type 1 diabetes, gestational diabetes, and special type diabetes;
- Acute diabetic complications (diabetic ketoacidosis, hyperglycemic hyperosmolar syndrome, or hypoglycemia) in the past 3 months;
- Serious cardiovascular and cerebrovascular diseases, liver and kidney diseases, malignant tumors and other diseases;
- Patients with hypertension;
- Use hypoglycemic, hypotensive and lipid-lowering drugs;
- BMI of 40 or higher, TG or greater tendency for 11.1mmol/L;
- Microalbuminuria >300 mg/24 h.
Because of the difference in fat distribution between males and females, all the patients were classified into two groups: males (group A) and females (group B). According to the presence or absence of microalbuminuria, the group A was divided into the A1 group with microalbuminuria, and the A2 group without microalbuminuria, the group B was divided into the B1 group and the B2 group.
Data Collection
We administrated a questionnaire to each participant to collect basic information including sex, age, DM disease course, family history of DM (for three generations), tobacco history alcohol history, history of hypertension and other diseases, and body mass index (BMI) were calculated by measuring height and weight. Waist-hip-ratio was calculated by measuring waist circumference and hip circumference. All participants fasted overnight, and the blood was drawn the next morning. All patients’ blood indicators were tested in the same laboratory. Blood indicators include total cholesterol (TC), triglycerides(TG), high-density lipoprotein(HDL), low-density lipoprotein (LDL), serum uric acid; serum creatinine (SCr), glomerular filtration rate (GFR), fasting blood glucose (FBG), HbA1c, fasting insulin, HOMA insulin-resistance (HOMA-IR) calculated by fasting blood glucose and fasting insulin, and 24-hour urinary microalbumin. The data were entered into an Excel spreadsheet and checked by two researchers.
Definition
The new diagnosed of T2DM was defined as Duration of diabetes≤90 days,
BMI=weight (kg)/height2 (m2),
HOMA-IR= fasting blood glucose (FBG, mmol/l) × fasting blood insulin (FBI, μU/mL)/22.5,
VAI = [WC/(39.68 + 1.88 × BMI)] × (TG/1.03) × (1.31/HDL-C)(Male),
VAI = [WC/(36.58 + 1.89 × BMI)] × (TG/0.81) × (1.52/HDL-C)(Female),
LAP=[WC-65]×TG(Male),
LAP=[WC-58]×TG(Female)
Statistical Analysis
The statistical analysis using SPSS 26.0. The normality test of measurement data showed that data conforming to normal distribution and were expressed as mean ± standard deviation. The independent sample t-test was used for comparison between groups. Data that did not conform to normal distribution were represented by median (quaternary), and a comparison between groups was performed by Mann–Whitney U-test. Classification count data were expressed by case number (percentage), and χ2 test was used for comparison between groups. Binary logistic regression analysis was used to screen the related factors. Results are shown as the odds ratio (OR) and 95% confidence interval (95% CI). P<0.05 was regarded as statistically significant. The diagnostic value of each index was evaluated by ROC curve.
Results
Baseline Information of Group A and Group B
In males, there were no significant differences in the duration of diabetes, age, smoking history, drinking history, systolic blood pressure, diastolic blood pressure, hip circumference, fasting insulin level, TC, LDL, creatinine, glomerular filtration rate and glycated hemoglobin level between A1 and A2 (P>0.05). The levels of BMI, WC, serum uric acid, FBG, WHR, TG, HOMA-IR, LAP and VAI in A1 group were all higher than those in A2 group, with statistical significance (P<0.05). The level of HDL was lower than that of A2 group, and the differences were statistically significant (P<0.05). Details are showed in Table 1. The box chart of LAP and VAI was made according to group A1 and group A2, showing that the highest and median values of LAP in group A1 were higher than those in group A2, and the lowest values of group A1 were similar to those in group A2, group A1 had larger inter-quad spacing and a greater degree of dispersion. The highest and median values of VAI in group A1 were higher than those in group A2, and the lowest values in group A1 were similar to those in group A2, group A1 had larger interquad spacing and a greater degree of dispersion. The results are shown in Figure 1.
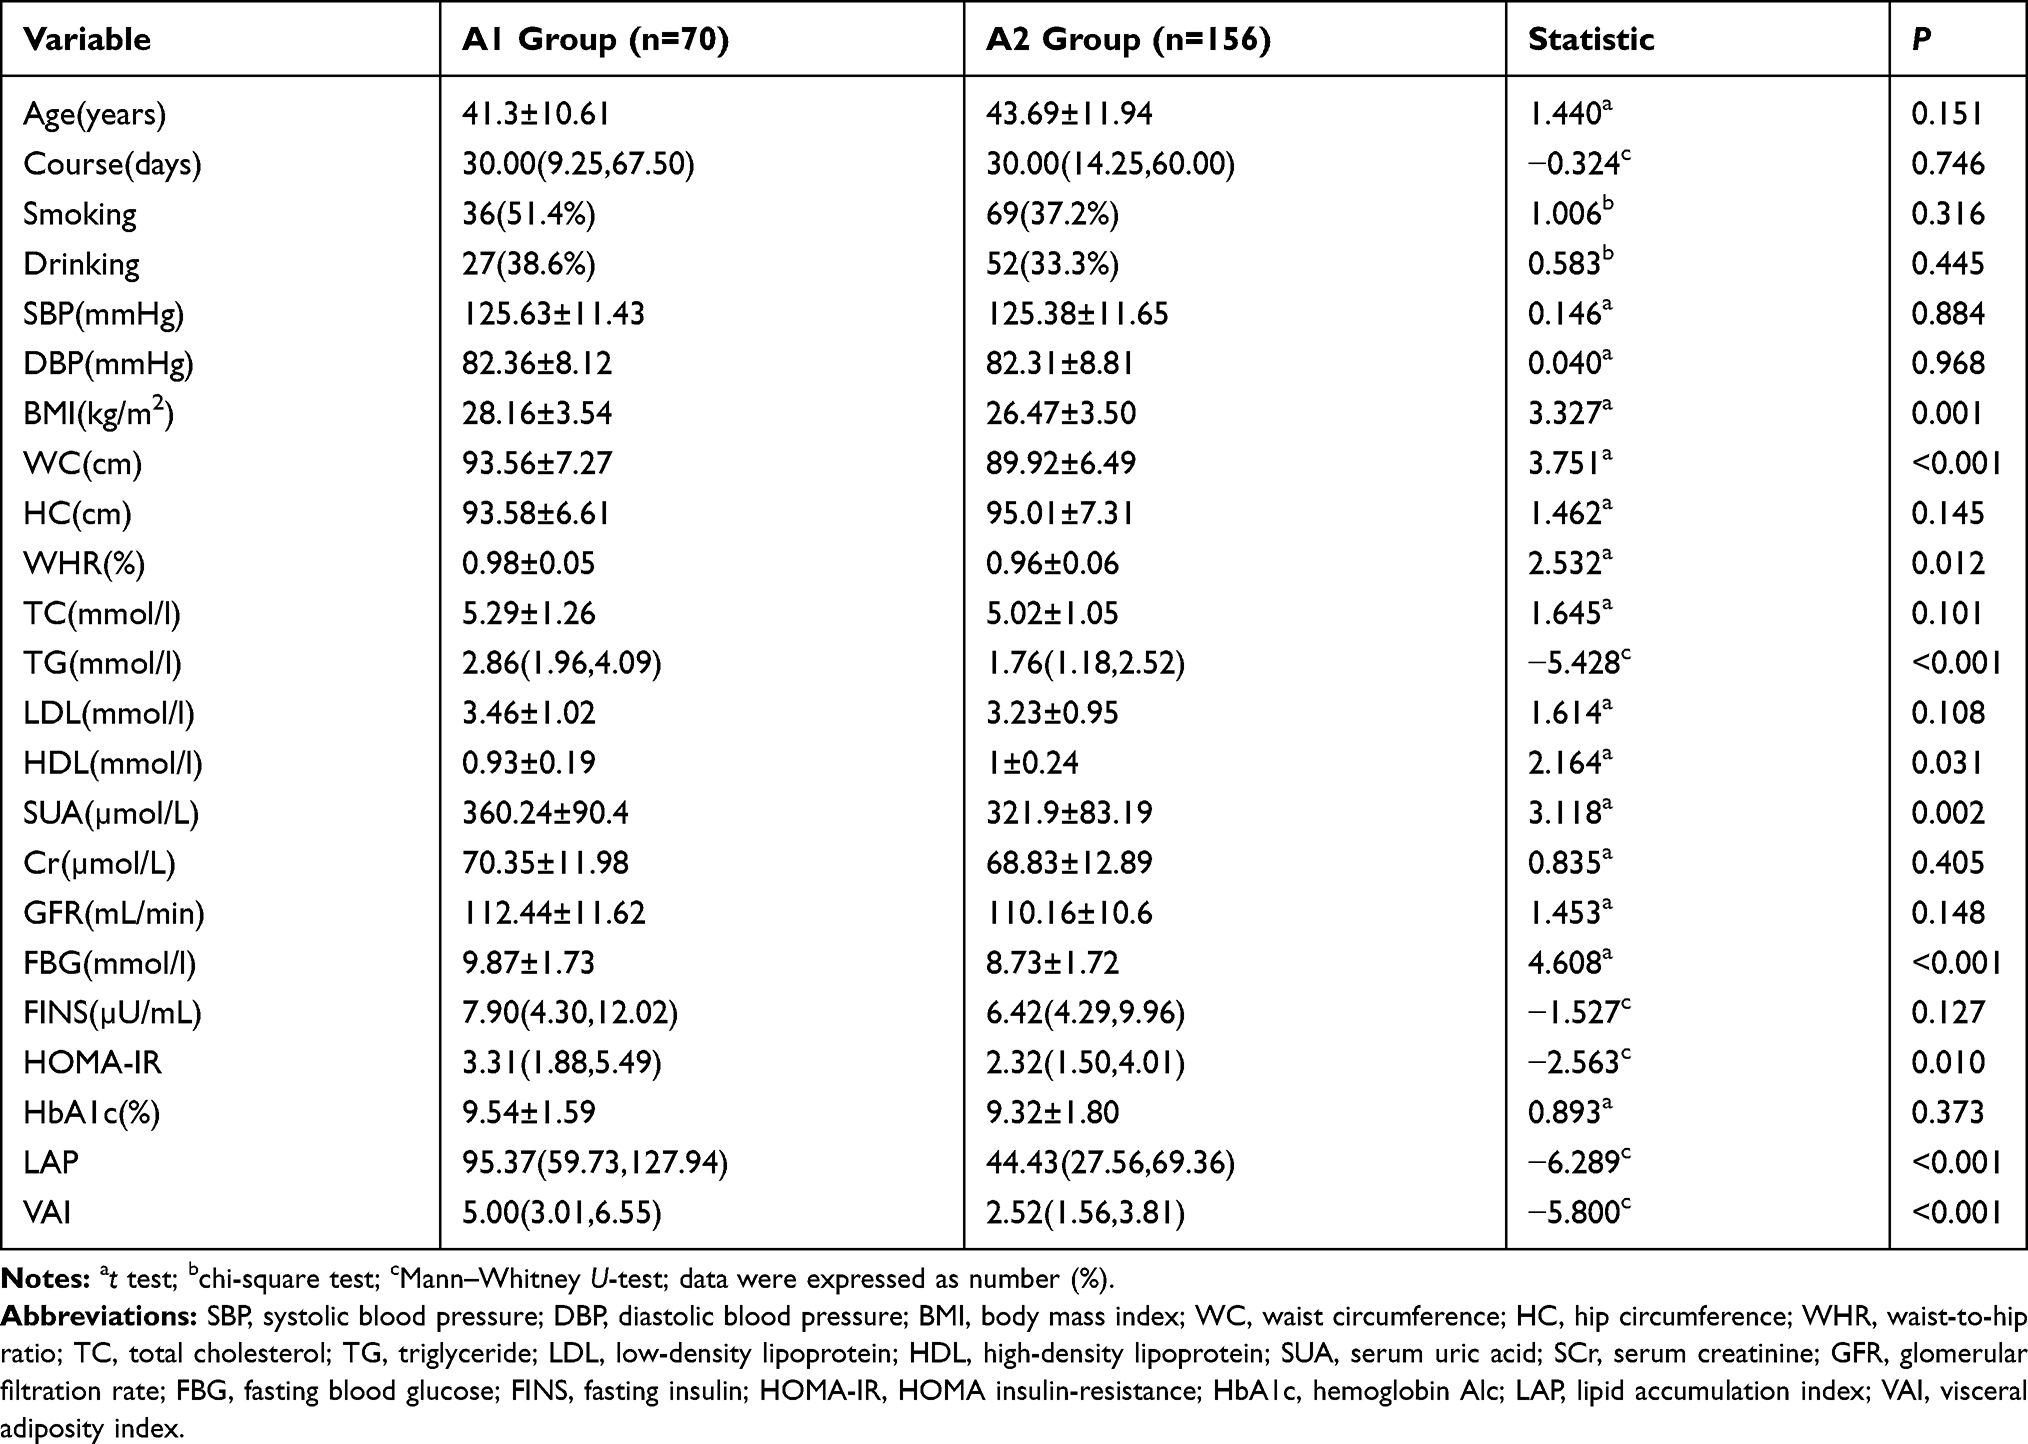 |
Table 1 The General Data of Male T2DM Patients |
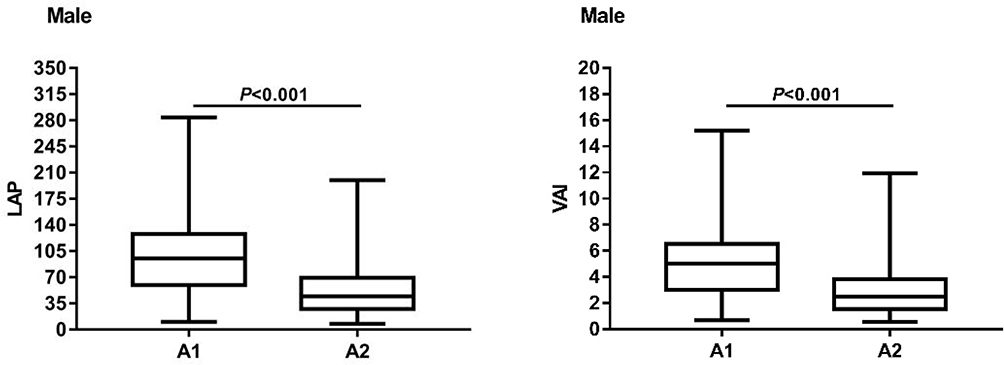 |
Figure 1 The box chart of LAP and VAI about the A1 group and the A2 group of male T2DM patients. |
In females, there were no significant differences in age, duration of diabetes, smoking history and alcohol consumption history, systolic blood pressure, diastolic blood pressure, hip circumference, fasting insulin level, TC, LDL, uric acid, creatinine, glomerular filtration rate and glycated hemoglobin levels between B1 and B2 (P>0.05). The levels of BMI, WC, WHR, FBG, TG, HOMA-IR, LAP and VAI in group B1 were higher than those in group B2, with statistical significance (P<0.05). HDL level was significantly lower than B2 group, and the difference was statistically significant (P<0.05). Details are showed in Table 2. The box chart of LAP and VAI was built according to group B1 and group B2, showing that the highest and median values of LAP in group B1 were higher than those in group B2, and the lowest values of group B1 were similar to those in group B2, the inter-quad spacing of group B1 was larger and the degree of dispersion was greater. The highest and median values of VAI in the B1 group were higher than those in the B2 group, and the lowest values of the B1 group were similar to those in the B2 group, the inter-quartile spacing of the B1 group was larger and the degree of dispersion was higher. The results are shown in Figure 2.
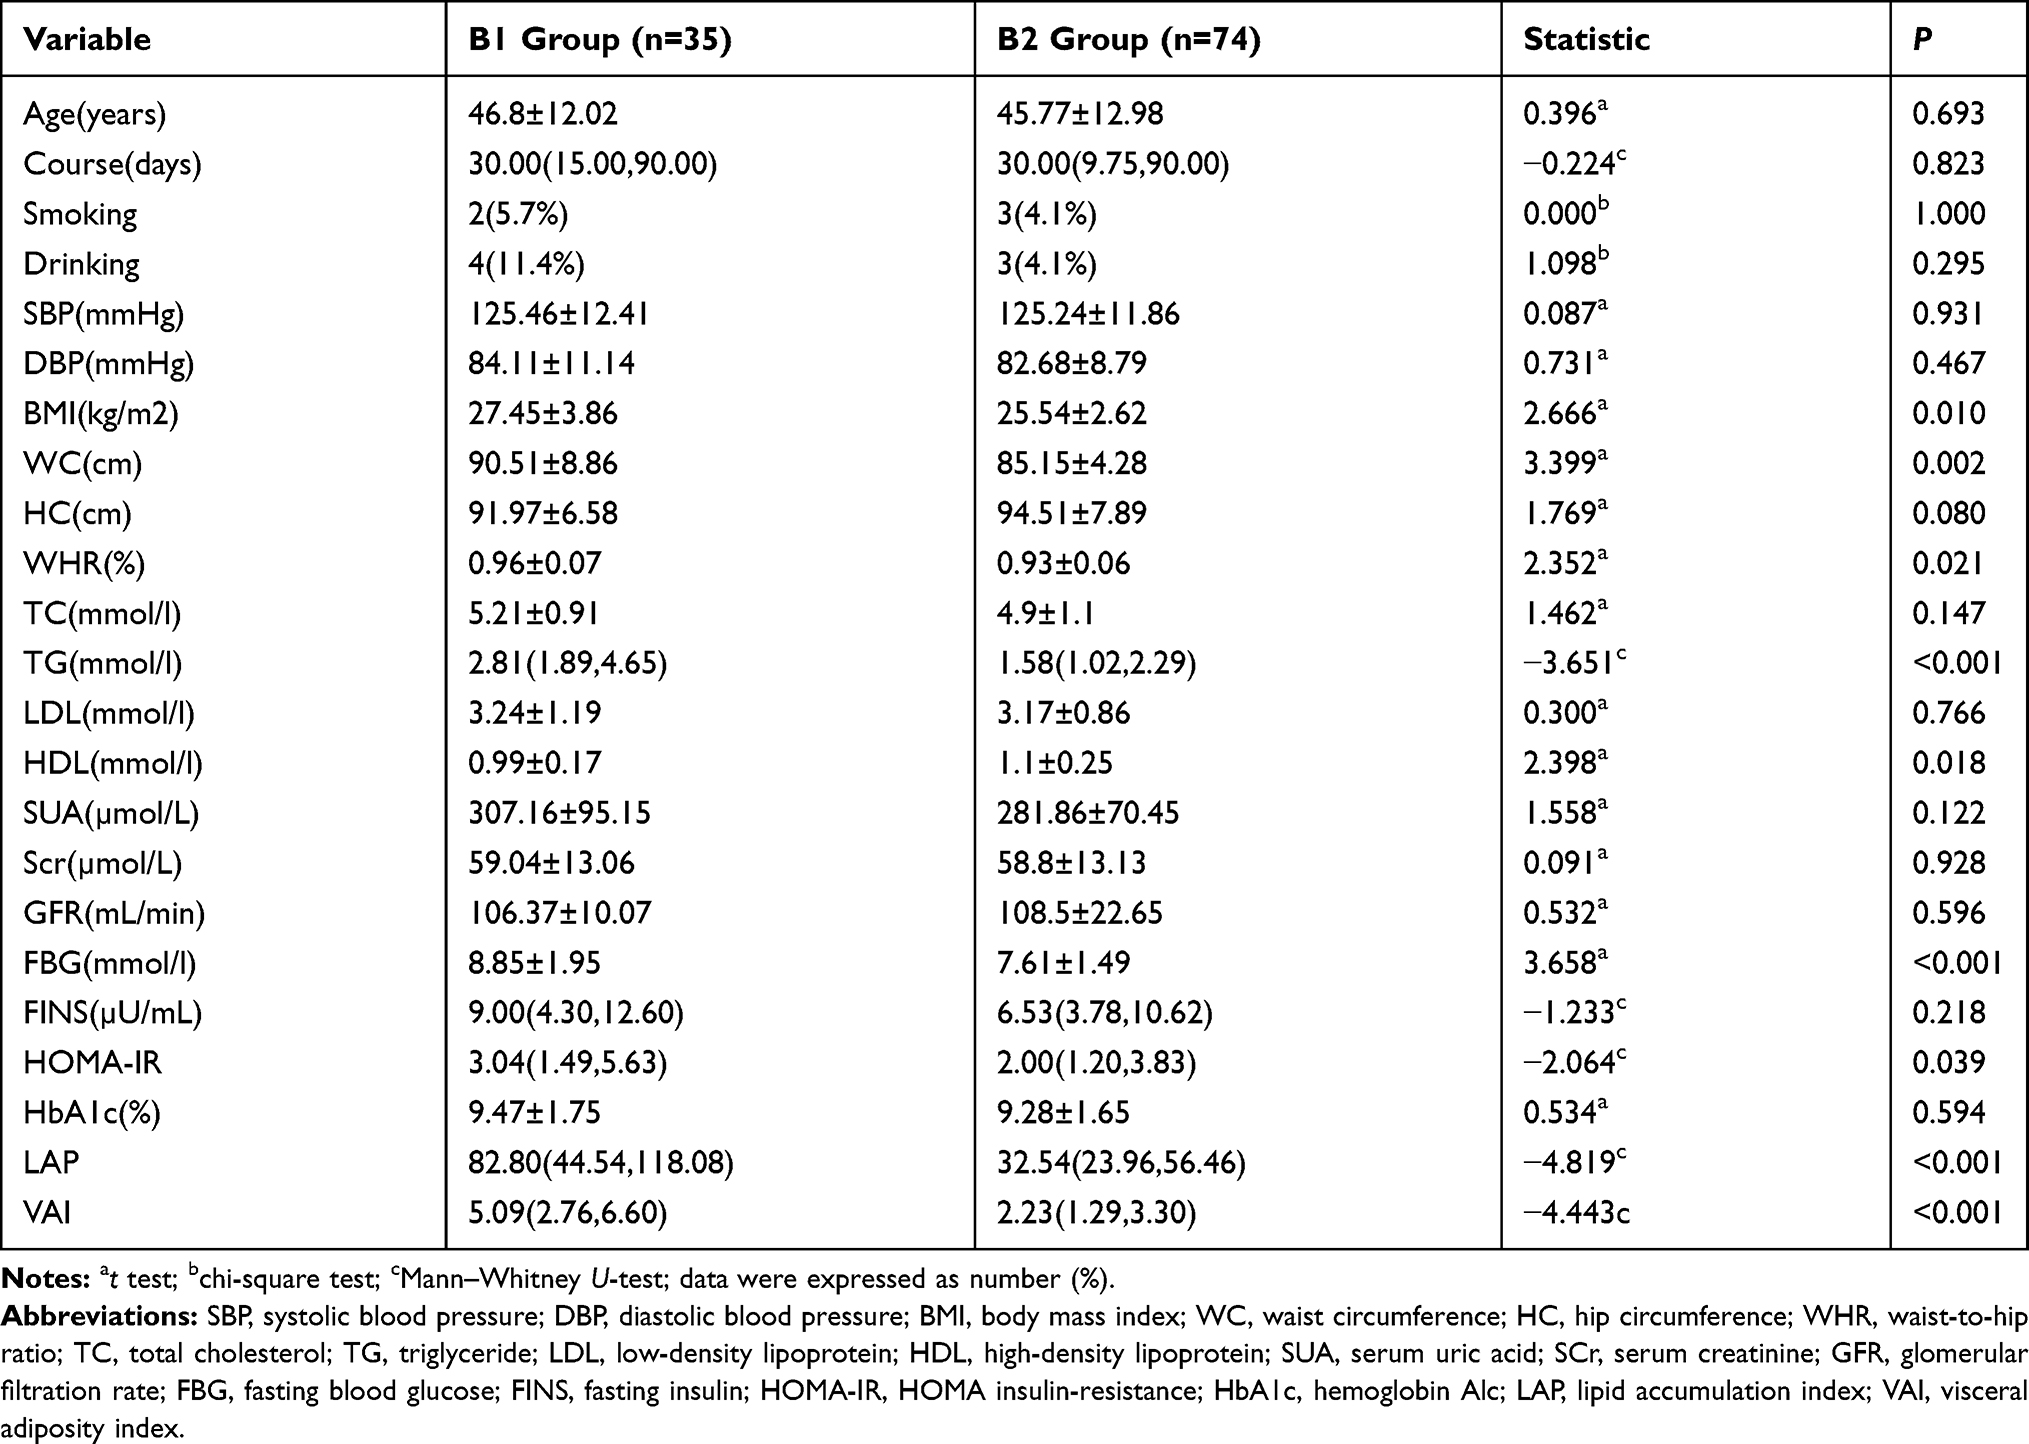 |
Table 2 The General Data of Female T2DM Patients |
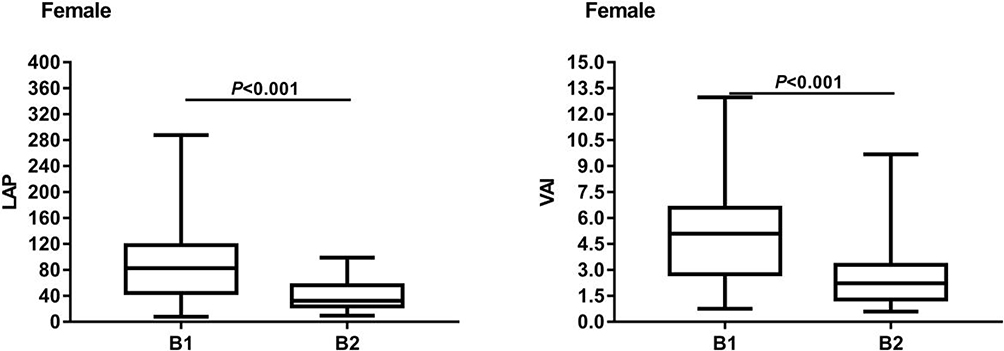 |
Figure 2 The box chart of LAP and VAI about the B1 group and the B2 group of female T2DM patients. |
Logistic Regression Analysis of Influence on Microalbumin in Urine
In males, because of the obvious collinearity between LAP and VAI, LAP and VAI were, respectively, modeled with patient outcomes. With microalbuminuria as the dependent variable (yes =1, no =0) and BMI, WC, TG, HDL, serum uric acid, FBG, HOMA-IR, LAP and VAI as independent variables, model 1 and model 2 were established by the forward condition method, respectively. Results showed that FBG and LAP were statistically significant in Model 1 (P<0.05). The risk of disease increased by 0.277 times for each unit of FBG increased and the risk of disease increased by 0.020 times for each unit of LAP increased. WC, FBG and VAI were statistically significant in Model 2 (P<0.05). The risk of disease increased by 0.063 times for each unit of WC increased and the risk of disease increased by 0.278 times for each unit of FBG increased. The risk of disease increased by 0.322 times for each unit of VAI increased. Details are showed in Table 3.
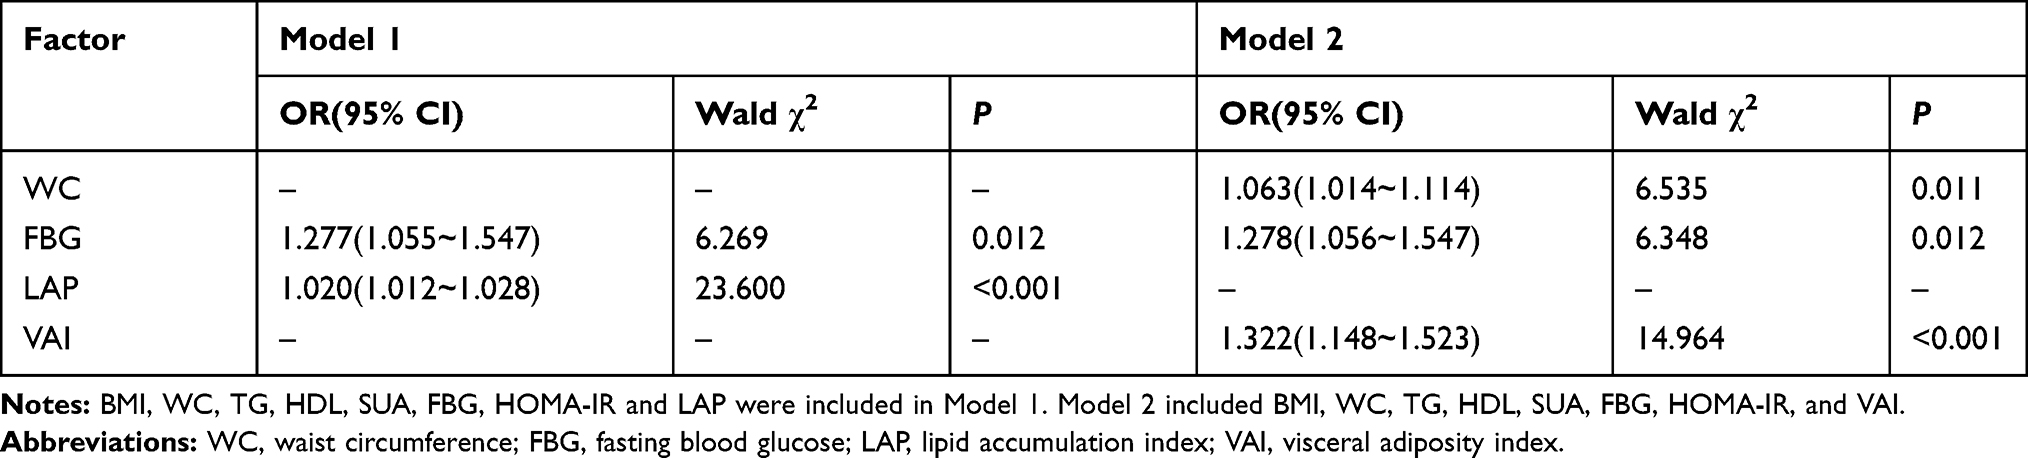 |
Table 3 Logistic Regression Analysis of Male T2DM Patients with Microalbuminuria |
In females, because of the obvious collinearity between LAP and VAI, LAP and VAI were, respectively, modeled with patient outcomes. With disease as the dependent variable (yes =1, no =0) and BMI, WC, WHR, TG, HDL, FBG, HOMA-IR, LAP and VAI as independent variables, model 1 and model 2 were established by the forward condition method, respectively. Results showed that FBG and LAP were statistically significant in Model 1 (P<0.05). The risk of disease was increased by 0.393 times for each unit of FBG increased and the risk of disease increased by 0.037 times for each unit of LAP increased. WC, FBG and VAI were statistically significant in Model 2 (P<0.05). The risk of disease increased by 0.117 times for each unit of WC increased and each additional unit of FBG increased the risk of disease by 0.483 times. The risk of disease increased by 0.615 times for each unit of VAI increased. Details are showed in Table 4.
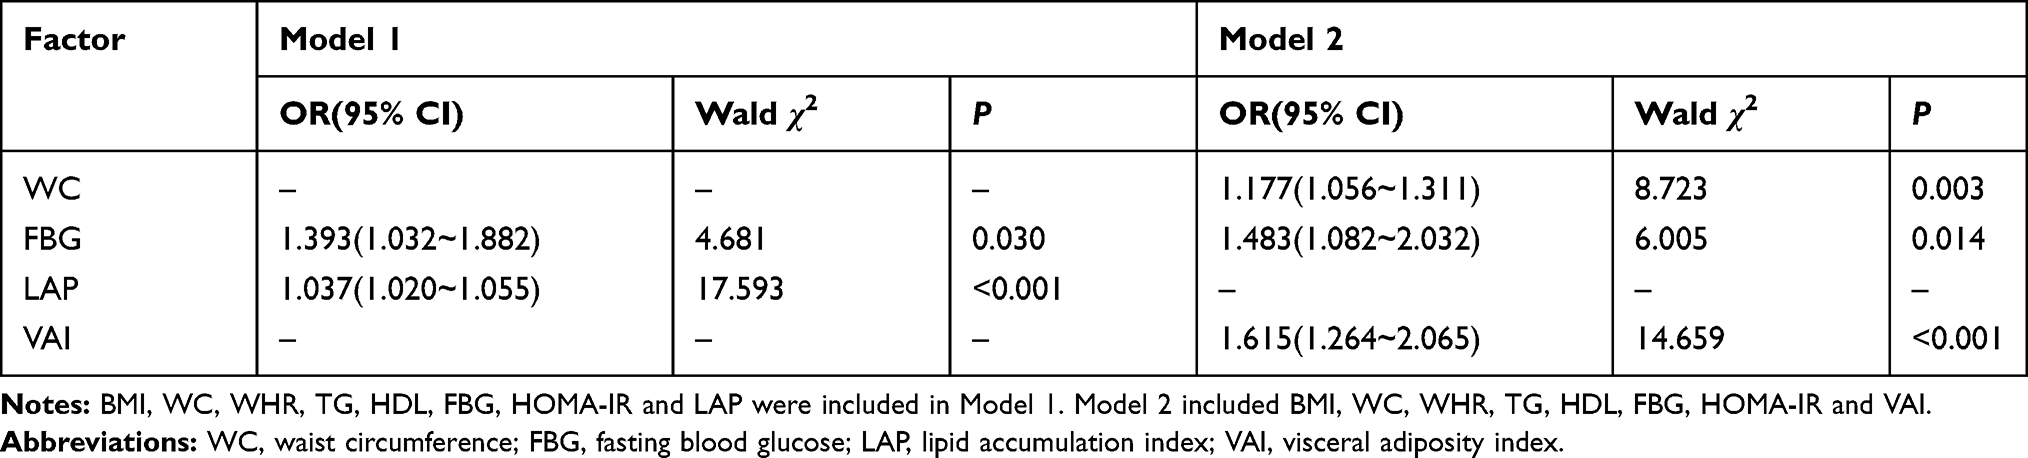 |
Table 4 Logistic Regression Analysis of Female T2DM Patients with Microalbuminuria |
ROC Analysis of Relevant Variables in Predicting Microalbuminuria
According to the ROC curve, the areas under the curves of WC, FBG, LAP and VAI in the male group were 0.626, 0.676, 0.760 and 0.742, respectively, and the corresponding P-values were all smaller than 0.05, indicating that the value of each index in predicting male disease was statistically significant. In females, the area under the curves of WC, FBG, LAP and VAI were 0.703, 0.685, 0.787 and 0.764, respectively, and the corresponding P-values were all less than 0.05, indicating that the value of each index in predicting the disease of women was statistically significant. The area under the curve of LAP predicting disease was the largest in both male and female populations, the corresponding cut-off values are 66.805 for males and 75.615 for females. Details are showed in Table 5 and Figure 3.
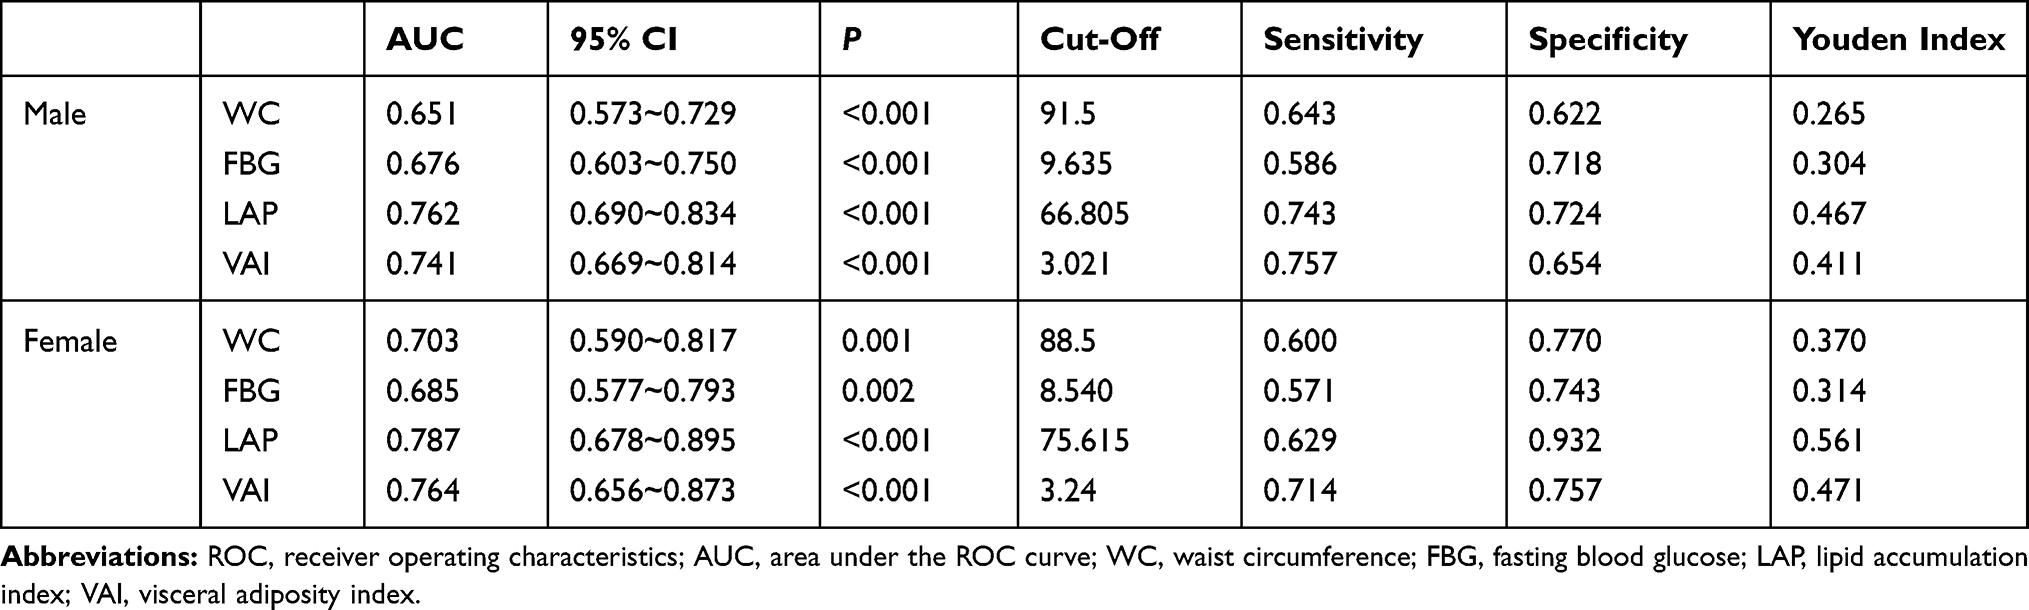 |
Table 5 ROC Curve Analysis of WC, FBG, LAP and VAI in Predicting Disease in Male and Female T2DM Patients |
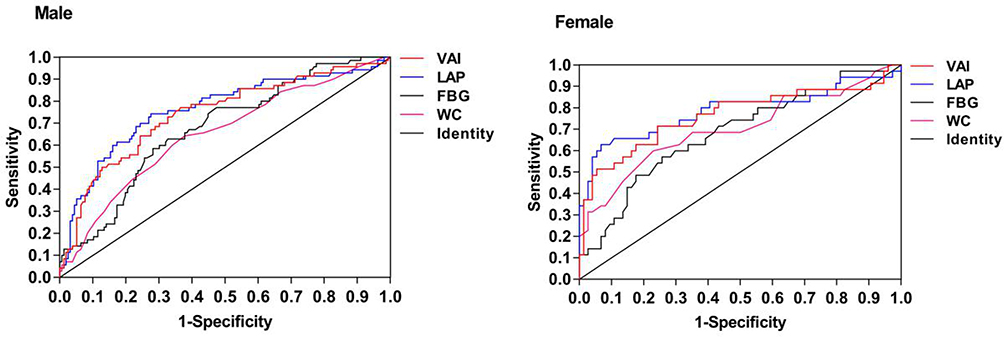 |
Figure 3 The ROC curve of VAI, LAP, FBG, WC in male and female T2DM patients. |
Discussion
Diabetic kidney disease (DKD) is a chronic kidney disease (CKD) caused by diabetes, with a progressive increase of albuminuria and a progressive decrease of glomerular filtration rate as the main clinical features.15 The appearance of microalbuminuria is the early manifestation of DKD and also the main basis for the diagnosis of DKD. The pathogenesis of diabetic nephropathy has been gradually clarified, including advanced glycation end products (AGEs), protein kinase C (PKC) activity enhancement, amino hexasaccharide pathway activation, polyol pathway and its activity enhancement, renin-angiotensin-Aldosterone system (RAAS), etc.16 In addition, lipid metabolism disorder also plays an important role in the occurrence and development of DKD.17–21 Lipid metabolism disorder is common in diabetic patients, and insulin resistance can aggravate lipid metabolism disorder, while lipid metabolism abnormality can also enhance insulin resistance in various ways.22 In this vicious cycle, excessive lipid heterotopia is deposited in liver, kidney, pancreas and other non-adipose tissues and organs, leading to lipid toxicity. Renal lipid toxicity is the excessive production of aliphatic factors, fatty acids and toxic metabolites deposited in the kidney by lipoectopia, which activates various signaling pathways (including oxidative stress, inflammation, fibrosis and apoptosis) and leads to renal cell damage and dysfunction.21,23 Previous studies have shown that visceral fat accumulation in obese people is associated with increased urinary albumin excretion rate and decreased glomerular filtration function.24,25 Few studies have been conducted in newly diagnosed type 2 diabetes patients. Therefore, this study investigated the relationship between visceral fat accumulation and microalbuminuria in newly diagnosed type 2 diabetes patients.
The comparison of baseline data in this study showed that among male patients, BMI, WC, WHR, FBG, TG, HOMA-IR, LAP and VAI in group A1 were all higher than those in group B2, with statistically significant differences. There was no significant difference in age, smoking and drinking history, systolic blood pressure and diastolic blood pressure. Among female patients, the levels of BMI, WC, WHR, FBG, TG, HOMA-IR, LAP and VAI in group B1 were all higher than those in group B2, with statistically significant differences. There was no significant difference in age, smoking and drinking history, systolic blood pressure and diastolic blood pressure. Kim’s study showed that compared with normal-weight patients, overweight and obese patients had a significantly increased risk of CKD.26 Chung’s study also showed that obese and visceral fat accumulation patients with type 2 diabetes were more likely to develop CKD.5 The results of this study showed that FBG, BMI, WC, TG, LAP and VAI were risk factors for urinary albumin in patients with type 2 diabetes, which was consistent with the findings mentioned above.
To investigate the risk factors for microalbuminuria, we performed a binary logistic regression analysis. This study found that LAP, VAI, WC and FBG were independent risk factors for microalbuminuria in both male and female patients. Chen’s study showed that VAI was a predictor of chronic kidney disease in healthy people in Taiwan.27 Zhang’s research showed that LAP was closely related to the decline of renal function, and was one of the indicators to predict the risk of renal insufficiency in the general Chinese population.28 This study is consistent with their findings, which did not confirm the usefulness of VAI and LAP in the treatment of renal function impairment. One difference between the two studies is that this study jointly explored the predictive value of VAI and LAP in the treatment of early renal function impairment, and compared them to see which one has the highest predictive value.
In this study, subject working characteristic curve analysis was carried out on LAP, VAI, WC and FBG. The results showed that the AUC of LAP, VAI, FBG and WC in male patients were 0.762, 0.741, 0.676 and 0.651, respectively, all of which had predictive values. As we all know, the greater the AUC was, the higher the prediction accuracy was. Therefore, LAP had a better predictive value for microalbuminuria. The optimal critical point of LAP was 66.805, indicating that the risk of microalbuminuria was greatly increased if LAP≥66.805. It was necessary to pay attention to monitor renal function in clinical practice while the risk was relatively low when LAP< 66.805. Similarly, in female patients, the AUC of LAP, VAI, WC and FBG was 0.787, 0.764, 0.703 and 0.685, respectively. The AUC of LAP was the highest and the predictive value was the highest. The optimal critical point of LAP was 75.615, indicating that the risk of microalbuminuria was increased if LAP ≥75.615. In addition, in the prediction of MAU occurrence in newly diagnosed T2DM patients, VAI and LAP have higher predictive value in the female group, suggesting that they are more suitable for female patients. But it was also highly valuable in predicting male patients.
This study has limitations. First of all, this study is a cross-sectional study, in the process of data collection, there are inevitably confounding factors that affect the accuracy of data. Secondly, patients who are newly diagnosed with type 2 diabetes were included in this study, and the results may not be applicable to all patients with diabetes. Finally, this study is single-centered with a small sample size, so it is expected to be confirmed by large-sample, multi-center and prospective studies in the next step.
In conclusion, this study found that LAP and VAI increased with the increase of microalbuminuria in newly diagnosed T2DM patients, it was confirmed that both LAP and VAI had predictive value in the occurrence of microalbuminuria in newly diagnosed T2DM patients. It is possible that excess visceral fat accumulation is a risk factor for microalbuminuria in T2DM patients, but it needs further investigation. In addition, we found that the area under the curve of both LAP and VAI was higher in females than in males, suggesting that this predictive value was more sensitive in females.
Disclosure
The authors report no conflicts of interest for this work.
References
1. Chinese Diabetes Society. Guidelines for the prevention and control of type 2 diabetes in China (2020 Edition)[J]. Chine J Diabetes. 2021:22(8);2–42
2. Liew A, Bavanandan S, Prasad N, et al. Asian pacific society of nephrology clinical practice guideline on diabetic kidney disease[J]. Nephrology. 2020;25(Suppl 2):12–45. doi:10.1111/nep.13785
3. American Diabetes Association. Obesity management for the treatment of type 2 diabetes: standards of medical care in diabetes-2020[J]. Diabetes Care. 2020;43(Suppl 1):S89–S97. doi:10.2337/dc20-S008
4. Xue H, Wang C, Li Y, et al. Incidence of type 2 diabetes and number of events attributable to abdominal obesity in China: a cohort study[J]. J Diabetes. 2016;8(2):190–198. doi:10.1111/1753-0407.12273
5. Chung HF, Al MA, Huang MC, et al. Obesity, weight change, and chronic kidney disease in patients with type 2 diabetes mellitus: a longitudinal study in Taiwan[J]. J Diabetes. 2017;9(11):983–993. doi:10.1111/1753-0407.12514
6. Mottaghi A, Mirmiran P, Delshad H, et al. Effect of different obesity phenotypes on incidence of chronic kidney disease in tehranian adults[J]. J Am Coll Nutr. 2016;35(7):587–596. doi:10.1080/07315724.2015.1046195
7. Fang H, Berg E, Cheng X, et al. How to best assess abdominal obesity[J]. Curr Opin Clin Nutr Metab Care. 2018;21(5):360–365. doi:10.1097/MCO.0000000000000485
8. Kahn HS. The lipid accumulation product is better than BMI for identifying diabetes: a population-based comparison[J]. Diabetes Care. 2006;29(1):151–153. doi:10.2337/diacare.29.01.06.dc05-1805
9. Demirbas N, Kutlu R. Importance of measured body fat, visceral adiposity index, and lipid accumulation product index in predicting cardiometabolic risk factors[J]. Metab Syndr Relat Disord. 2020. doi:10.1089/met.2020.0098
10. Taverna MJ, Martinez-Larrad MT, Frechtel GD, et al. Lipid accumulation product: a powerful marker of metabolic syndrome in healthy population[J]. Eur J Endocrinol. 2011;164(4):559–567. doi:10.1530/EJE-10-1039
11. Motamed N, Razmjou S, Hemmasi G, et al. Lipid accumulation product and metabolic syndrome: a population-based study in northern Iran, Amol[J]. J Endocrinol Invest. 2016;39(4):375–382. doi:10.1007/s40618-015-0369-5
12. Amato MC, Giordano C, Galia M, et al. Visceral Adiposity Index: a reliable indicator of visceral fat function associated with cardiometabolic risk[J]. Diabetes Care. 2010;33(4):920–922. doi:10.2337/dc09-1825
13. Amato MC, Giordano C. Visceral adiposity index: an indicator of adipose tissue dysfunction[J]. Int J Endocrinol. 2014;2014:730827. doi:10.1155/2014/730827
14. Zhou J, Sun HC, Wang Z. Guidelines for the prevention and treatment of type 2 diabetes in China (2017 Edition)[J]. Chin Pract Intern Med. 2018;38:292–344.
15. Tuttle KR, Bakris GL, Bilous RW, et al. Diabetic kidney disease: a report from an ADA Consensus Conference[J]. Diabetes Care. 2014;37(10):2864–2883. doi:10.2337/dc14-1296
16. Maric-Bilkan C. Obesity and diabetic kidney disease[J]. Med Clin North Am. 2013;97(1):59–74. doi:10.1016/j.mcna.2012.10.010
17. Herman-Edelstein M, Scherzer P, Tobar A, et al. Altered renal lipid metabolism and renal lipid accumulation in human diabetic nephropathy[J]. J Lipid Res. 2014;55(3):561–572. doi:10.1194/jlr.P040501
18. Chang Y, Ryu S, Choi Y, et al. Metabolically healthy obesity and development of chronic kidney disease: a cohort study[J]. Ann Intern Med. 2016;164(5):305–312. doi:10.7326/M15-1323
19. Mount P, Davies M, Choy SW, et al. Obesity-related chronic kidney disease-the role of lipid metabolism[J]. Metabolites. 2015;5(4):720–732. doi:10.3390/metabo5040720
20. Bobulescu IA. Renal lipid metabolism and lipotoxicity[J]. Curr Opin Nephrol Hypertens. 2010;19(4):393–402. doi:10.1097/MNH.0b013e32833aa4ac
21. Thongnak L, Pongchaidecha A, Lungkaphin A. Renal Lipid Metabolism and Lipotoxicity in Diabetes[J]. Am J Med Sci. 2020;359(2):84–99. doi:10.1016/j.amjms.2019.11.004
22. Yazici D, Sezer H. Insulin Resistance, Obesity and Lipotoxicity[J]. Adv Exp Med Biol. 2017;960:277–304.
23. Opazo-Rios L, Mas S, Marin-Royo G, et al. Lipotoxicity and diabetic nephropathy: novel mechanistic insights and therapeutic opportunities[J]. Int J Mol Sci. 2020;21(7):7. doi:10.3390/ijms21072632
24. Foster MC, Hwang SJ, Massaro JM, et al. Association of subcutaneous and visceral adiposity with albuminuria: the Framingham Heart Study[J]. Obesity. 2011;19(6):1284–1289. doi:10.1038/oby.2010.308
25. Chen H, Cao G, Chen DQ, et al. Metabolomics insights into activated redox signaling and lipid metabolism dysfunction in chronic kidney disease progression[J]. Redox Biol. 2016;10:168–178. doi:10.1016/j.redox.2016.09.014
26. Kim YJ, Hwang SD, Oh TJ, et al. Association between obesity and chronic kidney disease, defined by both glomerular filtration rate and albuminuria, in Korean adults[J]. Metab Syndr Relat Disord. 2017;15(8):416–422. doi:10.1089/met.2017.0053
27. Chen YC, Lai SH, Tsai YW, et al. Visceral adiposity index as a predictor of chronic kidney disease in a relatively healthy population in Taiwan[J]. J Ren Nutr. 2018;28(2):91–100. doi:10.1053/j.jrn.2017.07.006
28. Zhang K, Li Q, Chen Y, et al. Visceral adiposity and renal function: an observational study from SPECT-China[J]. Lipids Health Dis. 2017;16(1):205. doi:10.1186/s12944-017-0597-0
 © 2021 The Author(s). This work is published and licensed by Dove Medical Press Limited. The full terms of this license are available at https://www.dovepress.com/terms.php and incorporate the Creative Commons Attribution - Non Commercial (unported, v3.0) License.
By accessing the work you hereby accept the Terms. Non-commercial uses of the work are permitted without any further permission from Dove Medical Press Limited, provided the work is properly attributed. For permission for commercial use of this work, please see paragraphs 4.2 and 5 of our Terms.
© 2021 The Author(s). This work is published and licensed by Dove Medical Press Limited. The full terms of this license are available at https://www.dovepress.com/terms.php and incorporate the Creative Commons Attribution - Non Commercial (unported, v3.0) License.
By accessing the work you hereby accept the Terms. Non-commercial uses of the work are permitted without any further permission from Dove Medical Press Limited, provided the work is properly attributed. For permission for commercial use of this work, please see paragraphs 4.2 and 5 of our Terms.