")
Back to Archived Journals » Research and Reports in Focused Ultrasound » Volume 2
The prediction of liver disease status using Doppler observations of the hepatic and portal venous system compared with liver biopsy in patients with chronic hepatitis C
Authors Zytoon AA, Allah AN, Faisal A
Received 8 November 2013
Accepted for publication 12 December 2013
Published 17 October 2014 Volume 2014:2 Pages 1—11
DOI https://doi.org/10.2147/RRFU.S57202
Checked for plagiarism Yes
Review by Single anonymous peer review
Peer reviewer comments 2
Ashraf Anas Zytoon,1 Abdel Naser A Gad Allah,2 Ahmed Faisal3
1Radiology Department, Faculty of Medicine, 2Gastroenterology Unit, Internal Medicine Department, Menoufia University, Menoufia, Egypt; 3Infectious and Endemic Diseases Unit, Internal Medicine Department, Suez Canal University, Ismailiya, Egypt
Objective: To investigate the influence of chronic hepatitis C-induced hepatic tissue damage on hepatic dopplerographic hemodynamics.
Subjects and methods: A total of 118 patients with chronic hepatitis C underwent both liver biopsy and ultrasound with duplex dopplerography of right hepatic and portal veins. A liver biopsy was performed during sonography, and biopsy specimens were evaluated. Hepatic and portal vein flow pattern was correlated with the total modified histologic activity index (HAI), fibrosis score, and intrahepatic fat content. Hepatic vein Doppler curve was evaluated. The flow of the portal vein was characterized according to the velocity undulation. Multiple logistic regression analysis was used to identify the best histological features that might contribute to hepatic hemodynamic alterations.
Results: The Doppler sonography spectrum of the right hepatic vein was classified as triphasic in 27 (23%), biphasic in 67 (57%), and monophasic in 24 (20%) patients. A significant difference was observed in the HAI, fibrosis score, and hepatosteatosis between patients with triphasic, biphasic, and monophasic flow patterns in the right hepatic vein (P<0.001). Portal vein waveform was flattened in patients with chronic hepatitis C (Vmax–min index =3.6±2.4). Multiple logistic regression analysis was used to evaluate the histologic features that contributed to the hepatic and portal vein flow-pattern changes. The HAI was the best correlated independent variable.
Conclusion: The alterations in dopplerographic hemodynamics of hepatic and portal veins have a strong correlation with hepatitis C virus-induced inflammatory and fibrotic changes as well as hepatosteatosis.
Keywords: liver, hepatitis C, hepatic vein, portal vein, histologic activity index (HAI), Doppler
Introduction
Accurate assessment of liver fibrosis is essential for therapeutic decisions and surveillance of chronic liver diseases of various etiologies. To date, liver biopsy is still the gold standard for staging of liver fibrosis.1 This method has several limitations, including morbidity and mortality (“large complications” 0.4%–2.8%, lethality 0–0.2%),1 diagnostic accuracy, sampling error,2–4 interobserver and intraobserver variability,5–7 and difficulties in follow-up. Therefore, several noninvasive methods have been developed and are tested in clinical practice.8
Ultrasound (US) signs of liver cirrhosis are well known: increase and later decrease of liver size, hypertrophy of the lobus caudatus, changes in ratio between size of right and caudate lobes, nodularity, and coarse echo structure of the liver.9 B-mode US does not allow the detection of liver fibrosis in precirrhotic stages, but it is directly related to the severity of the process itself, regardless of the underlying etiology. Liver blood flow undergoes complex changes with the progression of chronic liver disease, which should be detected with dopplerographic examinations. Characteristic features of liver cirrhosis are decreasing portal blood-flow velocity, disappearance of pulsatility, change in flow detection in the portal vein from hepatopetal to hepatofugal in more severe cases,10–14 and increase of resistive index in the hepatic artery.15–17 The most characteristic dopplerographic sign has been suggested: changes in hepatic vein Doppler curve waveform from triphasic to biphasic and monophasic.12,18,19
Doppler US is an important diagnostic technique in the characterization of the hepatic vasculature. Changes in hepatic blood flow might be surrogate markers for significant changes in parenchymal liver diseases and their complications (eg, portal hypertension, cirrhosis, or steatosis). The standard ranges of blood flow in the hepatic veins, the portal vein, and the hepatic artery have been well defined in the past.20 The Doppler signal of the right hepatic vein changes in liver cirrhosis from a triphasic to a monophasic waveform.18 Additionally, the prevalence of a monophasic waveform has been shown to have a negative prognostic value for patients with portal hypertension.21 Furthermore, hepatic vein flow has been assessed as a marker to monitor therapy of portal hypertension.22
Although fatty infiltration of the liver is a common condition, its hemodynamic effect on the hepatic artery and vein is unclear. Since patients with such liver disease as cirrhosis and malignancy may have accompanying fatty infiltration of the liver, it is essential to know the effect of fatty infiltration on hepatic arterial resistance and hepatic vein Doppler waveform. Most previous studies on the effect of chronic liver diseases on hepatic hemodynamics reported alterations in hepatic vein waveforms and hepatic arterial resistive index.23 Non-invasive screening procedure to accurately stage liver fibrosis independent of the underlying etiology would significantly improve the follow-up of chronic liver diseases. Various noninvasive scores have been evaluated as fibrosis markers to reduce the need for liver biopsies in clinical routine,24 but to date no standard procedure with adequate sensitivity and specificity has been established.
In the present prospective study, we investigate the influence of hepatitis C virus (HCV) infection on hepatic blood flow. Specifically, we sought to determine if there is a relationship between the degree of chronic HCV infection-induced hepatic fibrosis and steatosis and changes in hepatic dopplerographic hemodynamics.
Subjects and methods
Patients and control subjects
Between April 2009 and January 2011, 118 patients with chronic HCV attending our hepatology outpatient clinic were enrolled in the present study. Eighty-six men and 32 women were included, who ranged from 31 to 53 years old (mean age±standard deviation 43.3±6.8 years). The diagnosis of chronic HCV infection was based on histology and the consistent detection of serum hepatitis C virus ribonucleic acid by polymerase chain reaction.25–27 All patients were anti-HCV antibody-positive and were negative for hepatitis B surface antigen and anti-HIV-1 and -2 antibodies. Malignant diseases were excluded by appropriate clinical, laboratory, and imaging investigations. Heart diseases were excluded by medical history, physical findings, chest radiography, electrocardiography, and sonographic examination of the heart. To preclude possible influences on the flow pattern of the hepatic veins, only patients with an actual heart rate of 60–100 beats per minute and normal blood pressure who were not taking cardiovascular medication were included in the study. In all 118 patients, adequate visualization of the liver vessels was achieved by transabdominal B-mode sonography, and an adequate Doppler sonography spectrum was obtained by duplex scanning. A liver biopsy was performed in each patient for grading the severity of disease and staging the degree of fibrosis and permanent architectural damage. Liver biopsy was also helpful in ruling out other causes of liver disease, such as alcoholic liver injury or iron overload. All patients gave informed consent.
Sonographic examination
All patients and healthy control subjects were examined by B-mode and duplex Doppler sonography using an HD-9 ultrasound system (Amsterdam, the Netherlands) with broadband curved-array transducer (C6-3) and volume curved-array transducer (V7-3) with the patients in a supine position. The patients had fasted overnight. All eight segments of the liver were carefully scanned and vascular malformations excluded. In all patients, vascular malformations were excluded by power Doppler colored sonography. For duplex scanning, the sample gate was adjusted to 3–7 mm, depending on the diameter of the vessel. The pulse-repetition frequency of the Doppler sonography beam and filter were defined by the C6-3 transducer. The Doppler sonography spectra of the right, left, and middle hepatic veins were photodocumented.
The close anatomic relationship between the left liver lobe and the heart frequently leads to artifacts of the Doppler sonography signal obtained from the left hepatic vein. Because of these artifacts, which are mainly due to heart movements, the left hepatic vein cannot always be reliably evaluated. Adequate sonographic visualization of the middle hepatic vein and evaluation of the Doppler sonography spectrum is best accomplished during slight inspiration via the subcostal route.
The most reproducible Doppler sonography spectrum can be obtained from the right hepatic vein via the intercostal approach. Adequate visualization of the right hepatic vein was achieved in all subjects in a 30° left lateral position with the right arm raised above the head. The Doppler sonography spectrum was recorded in short breathing pauses of 5–8 seconds without relevant intra-abdominal or thoracic pressure-related artifacts. The evaluation of the right hepatic vein via the tenth or eleventh intercostal space 6–8 cm distal to the confluence of the hepatic veins helped to avoid artifacts due to different respiration positions and different abdominal and thoracic pressures, and provided reproducible results in all patients and control subjects. To establish the best position for evaluation of the flow pattern, the right hepatic vein was also evaluated 2 cm distal to the confluence of the hepatic veins. Doppler sonography spectrum 6–8 cm distal to the confluence of the hepatic veins may better reflect histologic changes of the liver parenchyma. The Doppler sonography spectrum of the right hepatic vein 6–8 cm distal to the confluence of the hepatic veins was subsequently classified as a triphasic waveform with a short reversed flow (pattern 1), a biphasic waveform with no reversed flow but with fluttering of more than 10% of the mean phasic amplitude (pattern 2), or a monophasic flat waveform with fluttering of less than 10% of the mean phasic amplitude (pattern 3).12 Figure 1A–C shows the three flow patterns. The maximum, medium, and minimum (reversed flow) velocity (cm/second) was recorded in each patient and photodocumented. Because of changes in the vessel diameter up to 2 mm per cycle during systole and diastole and different directions of the normal triphasic hepatic vein flow, the blood flow (mL/minute) in the hepatic veins was not calculated. The reproducibility of the method was evaluated by repeated sonographic examinations of the flow pattern in the right hepatic vein in control subjects. The mean coefficient of variation for intraindividual assessment of the flow velocity was 13% for the hepatofugal flow and 19% for the reversed flow. The flow pattern in normal subjects is always triphasic. The reproducibility for the middle hepatic vein was less favorable, because the mean coefficient of variation for intraindividual assessment of flow velocity was 25% for the hepatofugal flow and 76% for the reversed flow. When no artifacts were present, intraindividual differences in the flow pattern between the right and middle hepatic vein were not observed.12 The portal vein flow velocity should be measured at the corresponding site next to the right hepatic vein. The flow in the portal vein should be also documented next to the site of measurement of the right hepatic vein. The biphasic Doppler sonography spectrum of the portal vein should be documented during a 5- to 8-second breathing pause to avoid the influences of respiration and intra-abdominal pressure. The sample gate should be adjusted to 6–10 mm (depending on the diameter of the vessel), and spectral analysis should always be recorded for the whole cycle. The reproducibility of the method for evaluation of portal vein flow was also investigated by repeated sonographic examinations of control subjects. The mean coefficient of variations for intraindividual assessment of the flow velocity (Vmaximum and Vminimum) were 12% and 10%, respectively.28 The portal vein velocity (cm/second) was recorded in each patient and photodocumented (Figure 2).
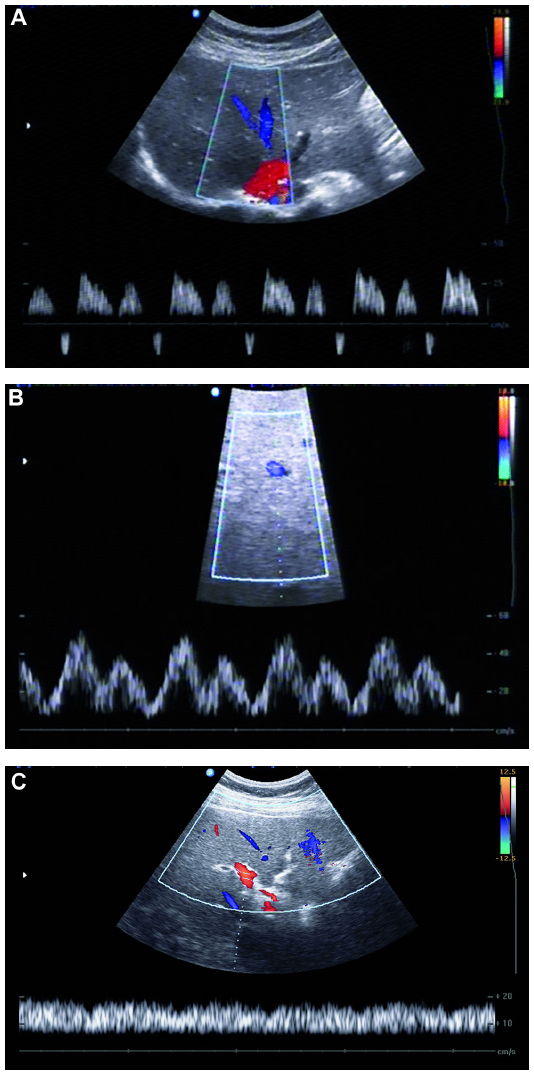 | Figure 1 Duplex Doppler sonography of the right hepatic vein in a healthy control subject shows triphasic waveform. Two antegrade peaks are separated by a short phase of retrograde flow (A). Duplex Doppler sonography of the right hepatic vein in a subject with moderate hepatosteatosis shows biphasic waveform without reversed flow (B). Duplex Doppler sonography of the right hepatic vein in a subject with severe hepatosteatosis shows monophasic waveform with continuous flat flow (C). |
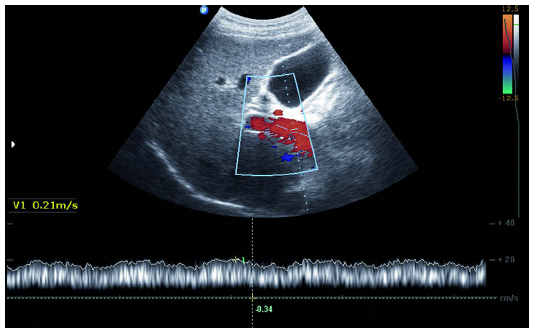 | Figure 2 Duplex Doppler sonography of the portal vein in a healthy control subject with continuous hepatopetal flow. |
Histopathologic evaluation
Histology may be different in the liver segments; therefore, Menghini biopsy of the liver was performed via an intercostal approach at the site where the flow pattern was evaluated. Liver biopsy specimens were fixed in formalin and embedded in paraffin for routine staining with hematoxylin and eosin. All specimens were evaluated by the same experienced pathologist, who was unaware of the clinical and biochemical data and the flow pattern of the liver vessels. The biopsy specimens of all patients with chronic hepatitis C were classified by the METAVIR scoring system29 and semiquantitatively evaluated using the Ishak scoring system (also known as the modified histologic activity index).30 With the METAVIR scoring system, the fibrosis is graded on a 5-point scale from F0 to F4 (F0=no fibrosis, F1=portal fibrosis without septa, F2=portal fibrosis with few septa, F3=numerous septa without cirrhosis, and F4=cirrhosis), and the activity, which is the intensity of necroinflammatory lesions, is graded on a 4-point scale from A0 to A3 (A0=no activity, A1=mild activity, A2=moderate activity, and A3=severe activity), and by using the histologic activity index, four distinct subgroups of histologic changes are assessed: 1) periportal or periseptal interface hepatitis (piecemeal necrosis), 2) confluent necrosis, 3) focal (spotty) lytic necrosis, apoptosis, and focal inflammation, and 4) portal inflammation.
Statistical analysis
Multivariate analysis was performed by multiple logistic regression analysis to evaluate the histological features of periportal changes with or without bridging hepatocellular necrosis, intralobular degeneration and focal hepatocellular necrosis, portal inflammation, and fibrosis. In addition, the hepatocyte fat deposition that might contribute to the amplitude of Vmax and Vmin (undulation) in the portal vein was evaluated. Clinical and biochemical characteristics of subjects were expressed as means±standard deviation when appropriate. Relationships between variables were analyzed using Spearman’s rank correlation. Categorical data were compared using χ2 analysis or Fisher’s exact test. Distributions of continuous variables were analyzed using nonparametric Student’s t-tests or Mann–Whitney U tests when appropriate to compare variances. All tests of significance were two-tailed, with P-values of less than 0.05 considered statistically significant.
Results
Hepatic vein flow pattern in patients with chronic hepatitis C and in control subjects
In the present study, we examined 118 patients with chronic hepatitis C. The clinical, biochemical, and serologic characteristics of our hepatitis C-infected patients are summarized in Table 1. Adequate visualization of hepatic and portal veins by B-mode sonography and sufficient analysis of respective flow patterns were achieved in all patients. The most reliable and reproducible Doppler sonography spectrum of hepatic veins was obtained from the right hepatic vein (Figure 1A–C). In none of the subjects did we see evidence of hepatic vein thrombosis (Budd–Chiari syndrome).
In our patients, the flow pattern of the right hepatic vein was triphasic in 27 of 118 (23%), biphasic in 67 of 118 (57%), and monophasic in 24 of 118 (20%). On sonography, all 24 patients with flattening of the waveform had a bright liver, whereas the 27 patients with a triphasic flow pattern had a normal B-mode echotexture of the liver. These data are summarized in Table 2.
 | Table 1 Basic clinical and pathological characteristics of the patients |
 | Table 2 Flow pattern of hepatic veins |
Correlation of hepatic vein flow pattern with total modified histologic activity index: necroinflammatory scores, fibrosis score, and intrahepatic fat content
In all patients with chronic hepatitis C, sonographic examination (including duplex Doppler sonography) and a liver biopsy were performed on the same occasion to correlate flow pattern and liver histology.
In the modified histologic activity index, four distinct subgroups of histologic changes are semiquantitatively assessed: 1) periportal or periseptal interface hepatitis (piecemeal necrosis), 2) confluent necrosis, 3) focal (spotty) lytic necrosis, apoptosis, and focal inflammation, and 4) portal inflammation.
In the hepatitis C-infected patients, the mean total modified histologic activity index (total score =18) was 6.7±1.7 (range 3–11). A significant difference was observed in the necroinflammatory scores (piecemeal necrosis, confluent necrosis, focal lytic necrosis and apoptosis, portal inflammation) between patients with triphasic (27 of 118), biphasic (67 of 118), and monophasic (24 of 118) flow patterns in the right hepatic vein; the mean total histologic activity index was 4.9±1.5 (95% confidence interval [CI] 4.3–5.5, range 3–7), 7.1±0.6 (95% CI 6.9–7.3, range 6–8), and 9.6±1.6 (95% CI 9.0–10.1, range 6–11), respectively (Figure 3). The flow patterns in the right hepatic vein of patients with chronic hepatitis C in relation to the histologic activity index subgroups are shown in (Table 3).
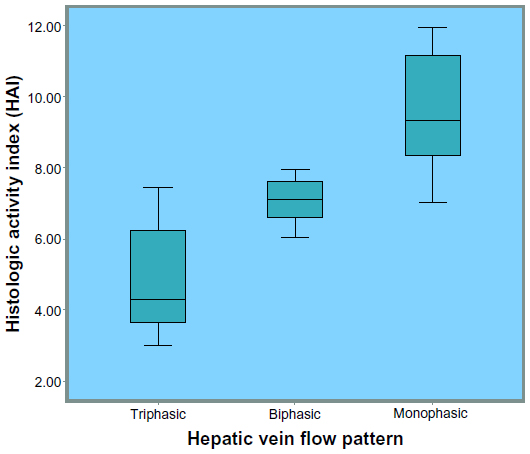 | Figure 3 Box and whisker plot diagram shows hepatic vein flow pattern in relation to total histologic activity index (necroinflammatory score) in 118 patients with chronic hepatitis C. Duplex Doppler sonography and liver biopsy were performed on same occasion. Mean total histologic activity index of patients with tri-, bi-, and monophasic flow patterns was 4.8±1.5, 6.7±0.6 and 8.2±1.5, respectively. Note that difference between the three flow patterns in correlation with the total histologic activity index (necroinflammatory score) was significant (P<0.001). |
 | Table 3 Modified histologic activity index results |
The difference of the total histologic activity index score between patients with triphasic flow and other flow patterns was significant (P=0.003), the difference between patients with biphasic flow and other flow patterns was significant (P=0.008), and the difference between patients with monophasic flow and other flow patterns was significant (P=0.030).
A significant correlation was found between hepatic vein flow pattern and histologic activity index (necroinflammatory score) among patients with HCV infection (r=0.958, r2=0.924±0.602; P<0.001) (Figure 4). A significant difference was observed in the Ishak fibrosis score (total score =6) between patients with triphasic and biphasic flow pattern was 2.1±1.2 (95% CI 1.6–2.6, range 1–4) versus 3.1±0.7 (95% CI 2.9–3.3, range 2–4), and between patients with triphasic and monophasic flow patterns 2.1±1.2 (95% CI 1.6–2.6, range 1–4) versus 4.8±0.7 (95% CI 1.6–2.6, range 4.4–5.1), and between patients with biphasic and monophasic flow patterns 3.1±0.7 (95% CI 2.9–3.3, range 2–4) versus 4.8±0.7 (95% CI 1.6–2.6, range 4.4–5.1) (P<0.001) (Figure 5). A significant correlation was found between hepatic vein flow pattern and Ishak fibrosis score among patients with HCV infection (r=0.863, r2=0.745±1.703; P<0.001) (Figure 6).
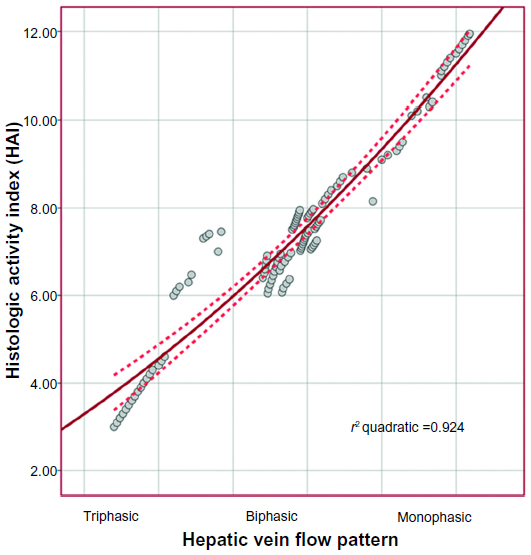 | Figure 4 Linear regression analysis illustrates the relationship between hepatic veins flow pattern and histologic activity index (necroinflammatory score) among patients with HCV infection. (r=958, r2=0.924±0.602, P<0.001). |
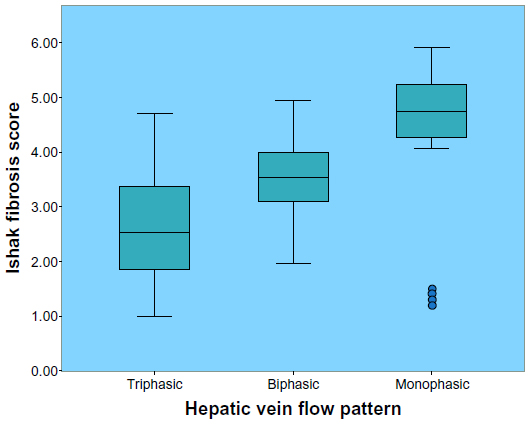 | Figure 5 Box and whisker plot diagram shows hepatic vein flow pattern in relation to Ishak fibrosis score in 118 patients with chronic hepatitis C. Duplex Doppler sonography and liver biopsy were performed on same occasion. Mean Ishak fibrosis score of patients with tri-, bi-, and monophasic flow patterns was 2.2±1.2, 3.1±0.7 and 4.8±0.7, respectively. Note that difference between the three flow patterns in correlation with the Ishak fibrosis score was significant (P<0.001). |
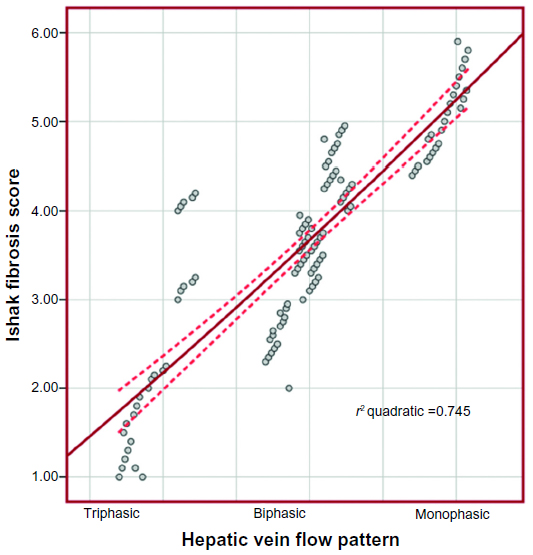 | Figure 6 Linear regression analysis illustrates the relationship between hepatic veins flow pattern and Ishak fibrosis score among patients with HCV infection. (r=0.863, r2=0.745±1.703, P<0.001). |
Intrahepatic fat deposition was semiquantitatively evaluated in all liver biopsy specimens of patients with chronic hepatitis C. Fat deposition was less than 25% in 32 of 118 (27%), 25%–50% in 47 of 118 (40%), and more than 50% in 39 of 118 (33%) patients. A monophasic flow pattern was present in twelve of 39 (31%) patients with an intrahepatic fat deposition of more than 50%, and present in only five of 47 (11%) patients with an intrahepatic fat deposition of 25%–50%, and five of 32 (16%) patients with an intrahepatic fat deposition of less than 25% (P<0.001). Intrahepatic fat deposition with respect to hepatic vein flow pattern is shown in Figure 7 and Table 3.
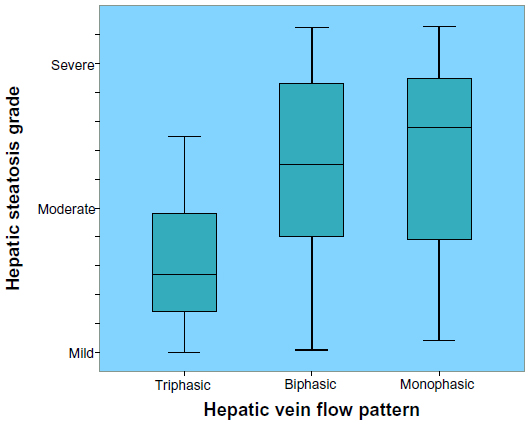 | Figure 7 Box and whisker plot diagram shows hepatic vein flow pattern in relation to intrahepatic fat deposition (hepatic steatosis) in 118 patients with chronic hepatitis C. Duplex Doppler sonography and liver biopsy were performed on same occasion. Mean intrahepatic fat deposition of patients with tri-, bi-, and monophasic flow patterns was 0.4±0.5, 1.3±0.7 and 1.3±0.9, respectively. Note that difference between the three flow patterns in correlation with the intrahepatic fat deposition was significant (P<0.001). |
Hepatocyte fat content was the only variable associated with an independent effect on the type of flow pattern: triphasic versus nontriphasic (odds ratio 8.61, 95% CI 3.31–22.4; relative risk 4.57, 95% CI 2.34–8.91; P<0.0001), biphasic versus nonbiphasic (odds ratio 1.95, 95% CI 0.90–4.20; relative risk 1.32, 95% CI 0.97–1.79; P=0.126), and monophasic versus nonmonophasic (odds ratio 3.47, 95% CI 1.38–8.78; relative risk 2.63, 95% CI 1.28–5.39; P=0.009). A significant correlation was found between hepatic vein flow pattern and intrahepatic fat deposition (hepatic steatosis) among patients with HCV infection (r=0.649, r2=0.469±0.784; P<0.001) (Figure 8).
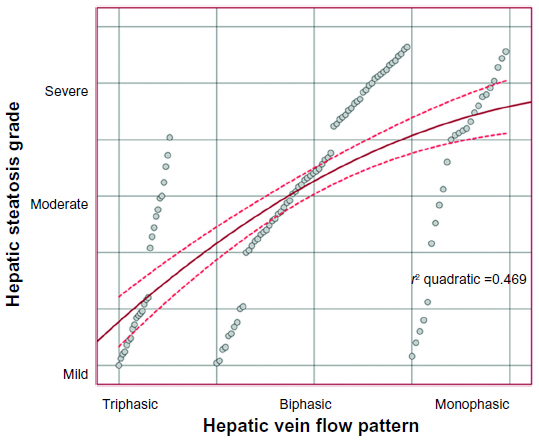 | Figure 8 Linear regression analysis illustrates the relationship between hepatic veins flow pattern and intrahepatic fat deposition (hepatic steatosis) among patients with HCV infection (r=0.649, r2=0.469±0.784, P<0.001). |
Multiple logistic regression analysis was used to evaluate the variety of histologic features that might contribute to the type of flow pattern in the right hepatic vein (tri-, bi-, or monophasic). The type of flow pattern as a dependent variable was stratified into six two-group pairs (triphasic versus nontriphasic, biphasic versus nonbiphasic, monophasic versus nonmonophasic, biphasic versus triphasic, biphasic versus monophasic, and monophasic versus triphasic).
If all the estimated factors (total modified histologic activity index; necroinflammatory changes, hepatic fibrosis score, and intrahepatic fat content) for correlation with hepatic vein flow-pattern alteration in patients with hepatitis C were considered in the analysis, then total modified histologic activity index (necroinflammatory change) was the best-correlated independent variable, with a one-way analysis of variance (ANOVA) test correlation coefficient of 0.8193 (95% CI 0.7496–0.8711) versus 0.6721 (95% CI 0.5593–0.7605) for hepatic fibrosis score and 0.5691 (95% CI 0.4329–0.6800) for intrahepatic fat content (P<0.0001) (Table 4).
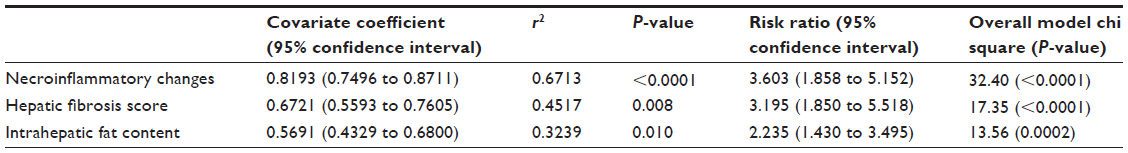 | Table 4 Estimated factors for correlation with hepatic vein changes |
Correlation of flow pattern in portal vein with liver histology and intrahepatic fat deposition
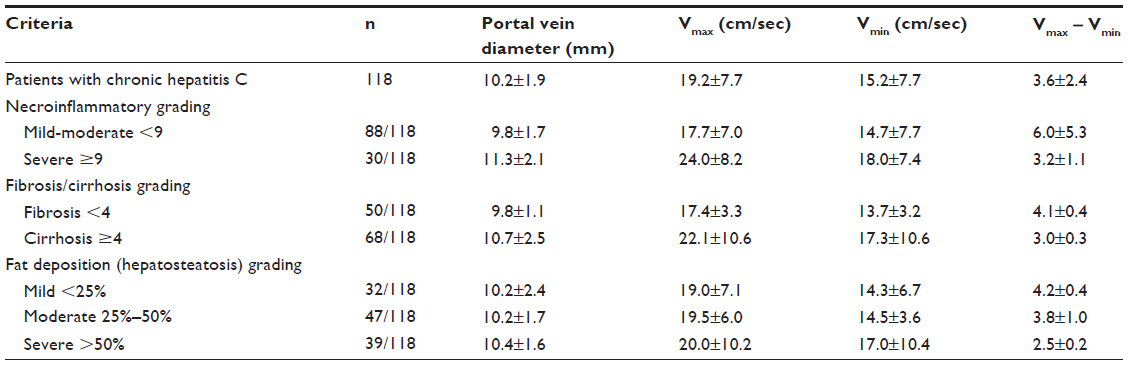
The mean diameter of the portal vein at a defined site next to the right hepatic vein was 10.2±1.9 mm (range 8–15 mm) in patients with chronic hepatitis C. For characterization of the flow in the portal vein, Vmax and Vmin were recorded in all patients. The difference of Vmax and Vmin was calculated as an index of flow. Compared with normal subjects, the waveform in the portal vein was flattened in patients with chronic hepatitis C (Vmax – Vmin index); 6.5±3.2 in healthy subjects (12), and 3.6±2.4 in patients with chronic hepatitis C (P=0.2776). This flattening was due to both a reduction of Vmax to 20.4±4.7 cm/second in healthy subjects12 versus 19.2±7.7 cm/second in patients with chronic hepatitis C (P=0.9005) and an increase in Vmin to 14.0±3.6 cm/second in healthy subjects12 versus 15.2±7.7 cm/seconds in our patients with chronic hepatitis C (P=0.8189).
The histologic features were correlated with the difference of Vmax – Vmin index in the portal vein. Flattening of the waveform of the Doppler sonography signal obtained from the portal vein was more pronounced in hepatitis C-infected patients with histologic signs of liver cirrhosis than in patients without cirrhosis: Vmax – Vmin index, 3.0±0.258 versus 4.1±0.449; difference between mean indices 1.1±0.605 (95% CI 0.084 to 2.334, P=0.0001).
However, flattening of the waveform of the portal vein was more strongly influenced by intrahepatic fat deposition. The Vmax – Vmin index was 2.5±0.199 in hepatitis C-infected patients with an intrahepatic fat deposition of more than 50% and 4.2±0.401 in patients with an intrahepatic fat deposition of less than 25%, and the difference between mean indices 1.7±0.618 (95% confidence interval 0.488–2.957, P<0.0001) (Table 5). No significant correlation was observed between the blood flow in the portal vein and the flow pattern in hepatic veins (P=0.220).
 | Table 5 Diameter and blood flow of portal vein |
If all the estimated factors (total modified histologic activity index [necroinflammatory changes, hepatic fibrosis score, and intrahepatic fat content]) for correlation with portal vein-flow modulation in patients with hepatitis C were considered in the analysis, then total modified histologic activity index (necroinflammatory changes) was the best-correlated independent variable with a one way ANOVA test correlation coefficient of 0.3929 (95% CI 0.2723–0.5135) versus 0.3125 (95% CI 0.1891–0.4359) for hepatic fibrosis score and 0.1339 (95% CI 0.01102–0.2568) for intrahepatic fat content (P<0.0001) (Table 6).
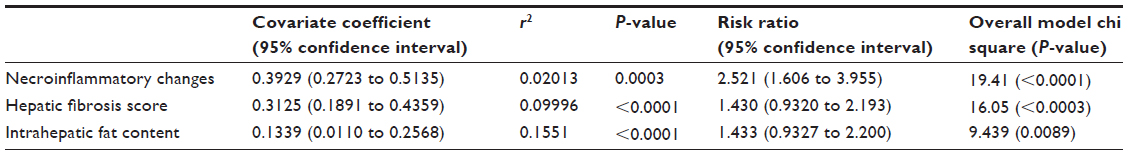 | Table 6 Estimated factors for correlation with portal vein modulation |
Discussion
Liver fibrosis is a known cause of regional hepatic and systemic hemodynamic changes. Doppler US has been used to detect hemodynamic changes that are known to be present during the precirrhotic stages of hepatic fibrogenesis. Published data on Doppler US methods used in liver fibrosis differ, and thus the clinical usefulness of Doppler flow measurements for the diagnosis of hepatic fibrosis remains controversial.13,31,32 Quantitative measures include portal vein blood volume, mean or maximum portal vein velocity, portal blood flow, congestion index of the portal vein, effective portal liver perfusion, and resistance indices of the liver and the spleen33,34 (Figure 2), including our results compared to the results of the previous investigators in the field. Additionally, pulse wave Doppler can be applied to obtain waveforms (phasicity) of the portal vein and hepatic vein. While the normal flow pattern in the right hepatic vein is triphasic, patients with a biphasic flow pattern more often had advanced fibrosis.12,36,38 A monophasic flow pattern is not related to fibrosis or cirrhosis but to extensive fatty infiltration of the liver.12,36,39–41 However, while portal and hepatic US Doppler parameters in patients with hepatic disease show differences when compared to controls, the relationship between these parameters and impairment of liver function has not been fully investigated. Despite general agreement that portal vein velocity is decreased in cirrhotic patients, the absolute values of portal flow velocity in both healthy subjects and patients with hepatic disease vary considerably and there is substantial overlap.37 Further, portal vein velocity and portal vein flow have shown correlation with fibrosis stage in larger patient samples,36 but the accuracy of measurement in single patients is not sufficient for exact fibrosis staging.11,35 In the current study, the authors noted that there was a strong correlation between hepatic necroinflammatory changes with alterations in the hepatic vein flow pattern as well as portal vein undulations, with sensitivity of 82% (95% CI 65.1%–91.7%) and 75.6% (95% CI 59.4%–87.1%), specificity of 95% (95% CI 87%–98.4%) and 87% (95% CI 77%–93.2%), and accuracy of 90.7% and 83.1% respectively.
Furthermore, the alterations in hepatic vein flow pattern and portal vein was joined strongly with the degree of hepatic fibrosis, with sensitivity of 76.2% (95% CI 60.2%–87.4%) and 82% (95% CI 65.1%–91.7%), specificity of 94.7% (95% CI 86.4%–98.3%) and 84% (95% CI 73.4% to 90.7%), and accuracy of 88.1% and 82.6%, respectively.
Portal blood flow is influenced by change in body position, respiration, timing of meals, exercise, and cardiac output. Errors in Doppler measurements, observer variability, and equipment differences play a role. Collateral pathways, hepatic steatosis, and inflammation add measurement variability.32,34,42 Compared with these early studies, the present results using alterations in the hepatic vein flow pattern as well as portal vein undulations to identify chronic hepatitis C-associated intrahepatic fat deposition provide sufficient odds to discriminate between mild and severe viral hepatitis-induced steatosis (sensitivity of 74.5% [95% CI 59.4%–85.6%] and 86.1% [95% CI 69.7% –94.8%], specificity of 93% [95% CI 83.7%–97.4%] and 82% [95% CI 71.3%–89.1%], and accuracy of 86% and 81.3%, respectively).
A very simple mathematical combination of sonographic and Doppler-derived measures to formulate a composite score to predict the known liver disease status of a patient with hepatitis C was statistically and clinically justified. It is recommended that these sonographic and Doppler-derived scores should be applied in clinical practice as alternative invasive liver-biopsy procedures to diagnose cirrhosis/fibrosis/steatosis associated with hepatitis C infection. The availability of a noninvasive alternative is imperative, because many patients experience anxiety, about 30% report substantial pain, and about 2% experience fatal complications, including pneumothorax, bleeding, or puncture of the biliary tree after liver biopsy.55 From the current study, we can use alterations in the hepatic veins flow pattern and portal vein undulations for estimation of the degree of liver cell damage induced by chronic hepatitis C with sensitivity of 77.2% (95% CI 69%–84%) and 81% (95% CI 72.3%–87.4%), specificity of 94.3% (95% CI 90.2%–97%) and 84.1% (95% CI 78.7%–88.4%), and accuracy 88.1% and 83.1%, respectively, with overall cumulative sensitivity of 79% (95% CI 73.4%–83.6%), specificity of 89.1% (95% CI 86%–91.6%), and accuracy of 86% for both techniques combined.
A mathematical combination of noninvasive sonographic and Doppler-derived measures to diagnose cirrhosis/fibrosis/steatosis associated with hepatitis C infection was justified not only by its statistical and clinical significance but also for physiological reasons. The morphometric and physiological components of the sonographic and Doppler-derived measures emphasize that blood flow through the hepatic veins and portal vein are inextricably linked to the hepatic cirrhosis/fibrosis/steatosis burden that affects blood-flow resistance through the hepatic and portal veins and consequently dampens the blood flow. Such correlation highlights the inextricable links that may exist between sonographic and Doppler-derived predictors of liver diseases; such correlations having been previously highlighted by Guthrie.44
However, hepatic venous flow is not steady, the dynamic viscosity of blood is not constant, and the portal vein is bifurcated, with multiple branches, varying in size between the inlets and the outlets. In reality, the portal vein will not continue to dilate or attenuate indefinitely, nor will more blood flow through the liver over time than the elastic properties of the vessels and hepatic resistance will allow. Consequently, the pressure gradient between the two ends of the portal vein may not necessarily be correlated with blood flow through the portal vein. Moreover, we cannot depend only on liver tissue morphological changes, as these are not accurately correlated with blood flow through the hepatic vessels. Furthermore, echogenicity and hepatic resistance may not always be directly correlated, because intracellular fat infiltration rather than hepatocellular damage may elevate the echo grade score.9,45–47
The portal vein is valveless, so portal vein pressure is theoretically proportional to the product of the input of blood from the portal vein and the hepatic resistance to outflow. Consequently, any events causing a change in the blood flow and/or an increase in hepatic resistance could develop into portal hypertension, potentially associated with a damping of the hepatic venous waveform. Substituting portal vein diameter changes that are related intimately to hepatic resistance is proportional to the extent of hepatocellular damage. This simple model highlights the dominating effects of portal vein morphometry due to hepatocellular damage on hepatic blood flow. Such reality focuses attention on classical concepts derived from cardiac physiology to highlight the inextricable links that may exist between sonographic and Doppler-derived predictors of liver diseases.44
In reality, dilation of the portal vein is a compensatory mechanism to enhance blood flow in the face of increasingly nodular lesions blocking flow through the liver. As the nodularity increases, the blood takes the path of least resistance. It is easier for the blood to follow collateral channels rather than course through a nodular liver. As collateral venous flow increases, the amount of blood traversing the liver is reduced, portal hypertension develops, and the probability of significant cirrhosis becomes a function of a change in portal vein velocity.48 It is possible that the portal vein flow index reflects these combined physiological processes, because the lowest scores were found to be significantly diagnostic of hepatic tissue damage.
In conclusion, the alterations in dopplerographic hemodynamics of the hepatic and portal veins are good parameters in the assessment of liver dysfunction in patients with chronic hepatitis C.
There are strengths and limitations to every study. Strengths of this study include the prospective database used, all the duplex Doppler sonographic examinations were performed and analyzed by the same consultant radiologist, who is an expert in the field, and on the same high quality ultrasound scanner, which limits confounders, and the accessibility to histopathological reports of the liver biopsy. The limitations of this case study were that there were no controls with healthy liver conditions to compare with, and will be the subject of further investigation.
Furthermore, as we did not include a control group with fatty liver due to other causes rather than hepatitis C infection, it is not possible to know whether our duplex Doppler sonographic analysis models could discriminate positively between all types of hepatic steatosis disease status, and more sophisticated models will be the topic of our further research.
There are many possible clinical imperatives of these data. Perhaps a patient who is anxious about liver biopsy or with poor bleeding profile may benefit from our noninvasive duplex Doppler model for assessment of the liver state. Perhaps a patient with fatty liver due to causes other than hepatitis C can benefit from our results estimating his/her liver state, and this will deserve further investigation. The technique described here may help to improve the early detection of liver dysfunction at an initial stage through screening programs for high-risk groups by duplex Doppler ultrasound.
Disclosure
The authors report no conflicts of interest in this work.
References
Buscarini E, Di Stasi M. Complications of Abdominal Interventional Ultrasound. Milan: Poleto; 1996. | |
Colloredo G, Guido M, Sonzogni A, Leandro G. Impact of liver biopsy size on histological evaluation of chronic viral hepatitis: the smaller the sample, the milder the disease. J Hepatol. 2003;39:239–244. | |
Maharaj B, Leary WP, Naran AD, et al. Sampling variability and its influence on diagnostic yield of percutaneous needle biopsy of the liver. Lancet. 1986;1:523–525. | |
Baunsgaard P, Sanchez GC, Lundborg CJ. The variation of pathological changes in the liver evaluated by double biopsies. Acta Pathol Microbiol Scand A. 1979;87:21–57. | |
Bedosa P, Dargere D, Paradis V. Sampling variability of liver fibrosis in chronic hepatitis C. Hepatology. 2003;38:1449–1457. | |
Regev A, Berho M, Jeffers LJ, et al. Sampling error and intraobserver variations in liver biopsy in patients with chronic HCV infection. Am J Gastroenterol. 2004;97:2614–2618. | |
[No authors listed]. Intraobserver and interobserver variations in liver biopsy interpretation in patients with chronic hepatitis C. The French METAVIR Cooperative Study Group. Hepatology. 1994;20:15–20. | |
Lutz HH, Gassler N, Tischendorf FW, Trautwein C, Tischendorf JJW. Doppler ultrasound of hepatic blood flow for noninvasive evaluation of liver fibrosis compared with liver biopsy and transient elastography. Dig Dis Sci. 2012;57:2222–2230. | |
Rumack CM, Wilson SR, Charboneau JW. Diagnostic Ultrasound. 3rd ed. St Louis (MO): Elsevier Mosby; 2005. | |
Barkat M. Non-pulsatile hepatic and portal vein waveforms in patients with liver cirrhosis: concordant and discordant relationships. Br J Radiol. 2004;77:547–550. | |
Schneider AR, Teuber G, Kriener S, Caspary WF. Non-invasive assessment of liver steatosis, fibrosis and inflammation in chronic hepatitis C virus infection. Liver Int. 2005;25:1150–1155. | |
Dietrich CF, Lee JH, Gottschalk R, et al. Hepatic and portal vein flow pattern in correlation with intrahepatic fat deposition and liver histology in patients with chronic hepatitis C. AJR Am J Roentgenol. 1998;171:437–443. | |
Bernatik T, Strobel D, Hahn EG, Becker D. Doppler measurements: a surrogate marker of liver fibrosis? Eur J Gastroenterol Hepatol. 2002;14:383–387. | |
Walsh KM, Leen E, MacSween RN, Morris AJ. Hepatic blood flow changes in chronic hepatitis C measured by duplex Doppler color sonography: relationship to histological features. Dig Dis Sci. 1998;43:2584–2590. | |
Lim AK, Patel N, Eckersley RJ, et al. Can Doppler sonography grade the severity of hepatitis C-related liver disease? AJR Am J Roentgenol. 2005;184:1848–1853. | |
Pierce ME, Sewell R. Identification of hepatic cirrhosis by duplex Doppler ultrasound value of the hepatic artery resistive index. Australas Radiol. 1990;34:331–333. | |
Sacerdoti D, Merkel C, Bolognesi M, Amodio P, Angeli P, Gatta A. Hepatic arterial resistance in cirrhosis with and without portal vein thrombosis: relationships with portal hemodynamics. Gastroenterology. 1995;108:1152–1158. | |
Bolondi L, Li Bassi S, Gaiani S, et al. Liver cirrhosis: changes of Doppler waveform of hepatic veins. Radiology. 1991;178:513–516. | |
Colli A, Cocciolo M, Riva C, et al. Abnormalities of Doppler waveform of the hepatic veins in patients with chronic liver disease: correlation with histological findings. AJR Am J Roentgenol. 1994;162:833–837. | |
Coulden RA, Lomas DJ, Farman P, Britton PD. Doppler ultrasound of the hepatic veins: normal appearances. Clin Radiol. 1992;45:223–227. | |
Ohta M, Hashizume M, Kawanaka H, et al. Prognostic significance of hepatic vein waveform by Doppler ultrasonography in cirrhotic patients with portal hypertension. Am J Gastroenterol. 1995;90:1853–1857. | |
Kim MY, Baik SK, Park DH, et al. Damping index of Doppler hepatic vein waveform to assess the severity of portal hypertension and response to propranolol in liver cirrhosis: a prospective nonrandomized study. Liver Int. 2007;27:1103–1110. | |
Mohammadinia AR, Bakhtavar K, Ebrahimi-Daryani N, et al. Correlation of hepatic vein Doppler waveform and hepatic artery resistance index with the severity of nonalcoholic fatty liver disease. J Clin Ultrasound. 2010:346–353. | |
Sebastiani G, Halfon P, Castera L, et al. Comparison of three algorithms of non-invasive markers of fibrosis in chronic hepatitis C. Aliment Pharmacol Ther. 2011;35:92–104. | |
Zeuzem S, Schmidt JM, Lee JH, Rüster B, Roth WK. Effect of interferon alfa on the dynamics of hepatitis C virus turnover in vivo. Hepatology. 1996;23:366–371. | |
Roth WK, Lee JH, Rüster B, Zeuzem S. Comparison of two quantitative hepatitis C virus reverse transcriptase PCR assays. J Clin Microbiol. 1996;34:261–264. | |
Zeuzem S, Franke A, Lee JH, Herrmann G, Rüster B, Roth WK. Phylogenetic analysis of hepatitis C virus isolates and their correlation to viremia, liver function tests and histology. Hepatology. 1996;24:1003–1009. | |
Sabba C, Ferraioli G, Genecin P, et al. Evaluation of postprandial hyperemia in superior mesenteric artery and portal vein in healthy and cirrhotic humans: an operator-blind echo-Doppler study. Hepatology. 1991;13:714–718. | |
Bedossa P, Poynard T. An algorithm for grading activity in chronic hepatitis C. The French METAVIR Cooperative Study Group. Hepatology. 1996;24:289–293. | |
Ishak K, Baptista A, Bianchi L, et al. Histological grading and staging of chronic hepatitis. J Hepatol. 1995;22:696–699. | |
Oberti F, Valsesia E, Pilette C, et al. Non-invasive diagnosis of hepatic fibrosis or cirrhosis. Gastroenterology. 1997;113:1609–1616. | |
Colli A, Cocciolo M, Mumoli N, Cattalini N, Fraquelli M, Conte D. Hepatic artery resistance in alcoholic liver disease. Hepatology. 1998;28:1182–1186. | |
Kurz AK, Blum HE. [Duplex sonography of the liver: state-of-the-art and perspectives]. Dtsch Med Wochenschr. 2006;131:1035–1039. German. | |
Bolognesi M, Sacerdoti D, Mescoli C, et al. Different hemodynamic patterns of alcoholic and viral endstage cirrhosis: analysis of explanted liver weight, degree of fibrosis and splanchnic Doppler parameters. Scand J Gastroenterol. 2007;42:256–262. | |
Barbaro B, Manfredi R, Bombardieri G, et al. Correlation of MRI liver volume and Doppler sonographic portal hemodynamics with histologic findings in patients with chronic hepatitis C. J Clin Ultrasound. 2000;28:461–468. | |
Haktanir A, Cihan BS, Celenk C, Cihan S. Value of Doppler sonography in assessing the progression of chronic viral hepatitis and in the diagnosis and grading of cirrhosis. J Ultrasound Med. 2005;24:311–321. | |
Shen L, Li JQ, Zeng MD, Lu LG, Fan ST, Bao H. Correlation between ultrasonographic and pathologic diagnosis of liver fibrosis due to chronic virus hepatitis. World J Gastroenterol. 2006;12:1292–1295. | |
Arda K, Ofelli M, Calikoglu U, Olçer T, Cumhur T. Hepatic vein Doppler waveform changes in early stage (Child-Pugh A) chronic parenchymal liver disease. J Clin Ultrasound. 1997;25:15–19. | |
Von Herbay A, Frieling T, Haussinger D. Association between duplex Doppler sonographic flow pattern in right hepatic vein and various liver diseases. J Clin Ultrasound. 2001;29:25–30. | |
Oguzkurt L, Yildirim T, Torun D, Tercan F, Kizilkilic O, Niron EA. Hepatic vein Doppler waveform in patients with diffuse fatty infiltration of the liver. Eur J Radiol. 2005;54:253–257. | |
Hirche TO, Ignee A, Hirche H, Schneider A, Dietrich CF. Evaluation of hepatic steatosis by ultrasound in patients with chronic hepatitis C virus infection. Liver Int. 2007;27:748–757. | |
Cosar S, Oktar SO, Cosar B, Yucel C, Ozdemir H. Doppler and gray-scale ultrasound evaluation of morphological and hemodynamic changes in liver vasculature in alcoholic patients. Eur J Radiol. 2005;54:393–399. | |
Rockey DC, Caldwell SH, Goodman ZD, Nelson RC, Smith AD. Liver biopsy. Hepatology. 2009;49:1017–1044. | |
Guthrie J. The prediction of liver disease status using a combination of sonographic and Doppler-derived observations of the portal venous system. J Diagn Med Sonogr. 2012;28:270–276. | |
Hagen-Ansert SL. Textbook of Diagnostic Ultrasonography. 6th ed. St Louis (MO): Elsevier Mosby; 2006;2. | |
Fan JG, Farrell GC. Epidemiology of non-alcoholic fatty liver disease in China. J Hepatol. 2008;50:204–210. | |
Obrador BD, Prades MG, Gómez MV, et al. A predictive index for the diagnosis of cirrhosis in hepatitis C based on clinical, laboratory, and ultrasound findings. Eur J Gastroenterol Hepatol. 2006;18:57–62. | |
Liu CH, Hsu SJ, Lin JW, et al. Noninvasive diagnosis of hepatic fibrosis in patients with chronic hepatitis C by splenic Doppler impedance index. Clin Gastroenterol Hepatol. 2007;5:1199–1206. |
 © 2014 The Author(s). This work is published and licensed by Dove Medical Press Limited. The full terms of this license are available at https://www.dovepress.com/terms.php and incorporate the Creative Commons Attribution - Non Commercial (unported, v3.0) License.
By accessing the work you hereby accept the Terms. Non-commercial uses of the work are permitted without any further permission from Dove Medical Press Limited, provided the work is properly attributed. For permission for commercial use of this work, please see paragraphs 4.2 and 5 of our Terms.
© 2014 The Author(s). This work is published and licensed by Dove Medical Press Limited. The full terms of this license are available at https://www.dovepress.com/terms.php and incorporate the Creative Commons Attribution - Non Commercial (unported, v3.0) License.
By accessing the work you hereby accept the Terms. Non-commercial uses of the work are permitted without any further permission from Dove Medical Press Limited, provided the work is properly attributed. For permission for commercial use of this work, please see paragraphs 4.2 and 5 of our Terms.