")
Back to Journals » Journal of Inflammation Research » Volume 15
The Potential Role of Serum IGF-1 and Leptin as Biomarkers: Towards Screening for and Diagnosing Postmenopausal Osteoporosis
Authors Zhang Y , Huang X, Sun K, Li M, Wang X, Han T , Shen H, Qi B, Xie Y, Wei X
Received 18 October 2021
Accepted for publication 7 January 2022
Published 22 January 2022 Volume 2022:15 Pages 533—543
DOI https://doi.org/10.2147/JIR.S344009
Checked for plagiarism Yes
Review by Single anonymous peer review
Peer reviewer comments 2
Editor who approved publication: Dr Monika Sharma
Yili Zhang,1,* Xinyi Huang,2,* Kai Sun,3,* Mengyuan Li,1,* Xu Wang,3 Tao Han,3 Hao Shen,4 Baoyu Qi,3 Yanming Xie,5 Xu Wei3
1School of Traditional Chinese Medicine & School of Integrated Chinese and Western Medicine, Nanjing University of Chinese Medicine, Nanjing, People’s Republic of China; 2School of Traditional Chinese Medicine, Beijing University of Chinese Medicine, Beijing, People’s Republic of China; 3Wangjing Hospital, China Academy of Chinese Medical Sciences, Beijing, People’s Republic of China; 4Changxindian Community Health Service Center, Beijing, People’s Republic of China; 5Institute of Basic Research in Clinical Medicine, China Academy of Chinese Medical Sciences, Beijing, People’s Republic of China
*These authors contributed equally to this work
Correspondence: Yanming Xie; Xu Wei, Tel +86 13911112416; +86 13488716557, Email [email protected]; [email protected]
Purpose: To investigate the differences of several serum markers among population with different bone mass and to explore the utility of new potential biomarker for the diagnosing and screening for postmenopausal osteoporosis (PMOP).
Materials and Methods: A total of 1055 postmenopausal women were screened and gathered data on BMD screening, biological samples, and questionnaire information. A liquid chip assay was used to measure serum IL-6, IGF-1, BMP-2, VEGF, leptin and FGF23. The predictive value of the indicator panels was assessed using the area under the receiver-operator characteristic curve (AUC). Statistical analyses were conducted by using SAS 9.4 and R software 4.1.1. Figures were created in GraphPad Prism 8.0.
Results: When compared against the normal group, in addition to the vitamin D, the PMOP group showed a significant increase in median values for other indicators (P < 0.05), especially in P1NP and β-CTX. Among the six cytokines representing different osteoporosis mechanisms, currently, we found that only IGF-1 and leptin showed significant differences between the groups. Also, the liquid chip assay results showed that IGF-1 and leptin, as newer cytokines in osteoporosis, not only have significant differences between groups, but also have a strong correlation with each other (P < 0.05). Then, we reported the accuracy of different indicator combinations by using AUC and, moreover, we demonstrated that IGF-1 with leptin did significantly provide incremental value to the AUC of conventional indexes, it markedly improved diagnostic efficacy, displaying an IDI of 9.45% (P = 0.000).
Conclusion: IFG-1 and leptin seem to be key biomarker associated with PMOP. The high prevalence of PMOP makes these cytokines might bear the potential of becoming a very useful screening test also for clinical follow-up of patients.
Keywords: biomarkers, menopause, diagnose, cytokine
Introduction
Postmenopausal osteoporosis (PMOP) is a common type of osteoporosis (OP), which is a condition affecting approximately 33% women over 60yr in China.1,2 Estrogen is an essential element in the bone metabolism and its deficiency after menopause might result in rapid bone loss, which is maximal within the first 2–3 years after the menopause transition.3–6 Moreover, the amount of bone being reabsorbed increases sharply in response to menopause beginning, while the amount of bone being formed increases only moderately.
At present, dual-energy X-ray absorptiometry (DEXA) scans are a fundamental approach of measuring bone mineral density (BMD) to determine bone strength and risk of fracture. Nevertheless, its diagnosis frequently carries significant challenges to the clinical practitioner. In fact, approximately half of the female patients had not been diagnosed as osteoporosis even after fragility hip or vertebral fractures in China.7
Osteoporosis has now been defined by the World Health Organization (WHO) as an abnormal bone mineral density (T-score) that is 2.5 SD below the mean peak value in young adults.8 It raises a risk factor for fracture to the status of a diagnostic criterion; however, it has ignored the important role of other determinants of bone strength and the higher risk of fracture associated with a certain level of bone mineral density in older women.9 Besides, it does not indicate which technique should be used or where bone mineral density should be measured. Therefore, the exploration of new biomarkers could help clinicians to monitor and treat the patients with PMOP as early as possible.
Insulin-like growth factor 1 (IGF-1) is considered as the most abundant growth factor in the bone matrix, maintaining bone mass in adulthood.10,11 Likewise, in age-related osteoporosis in humans, it has been reported that people with osteoporosis were 40% lower in bone marrow IGF-1 concentrations compared to individuals without osteoporosis.12 In particular, IGF-1 and several of its binding proteins are positively correlated with bone mass. Therefore, it has a significant predictive value as a standard for the risk of osteoporosis and incident fractures.13–15
Recently, another star molecule that has been found to be closely associated with the state of bone turnover is leptin. Adipocytes are critical components involved in modulating energy expenditure and bone cell activities.16–18 Studies have indicated that adipocytes and osteoblasts derived from the same mesenchymal stem cell precursors, obesity-induced adipocyte differentiation and lipid accumulation in vivo lead to reduced osteoblast differentiation and bone formation. It has been demonstrated that the increased expression of leptin and decreased adiponectin expression are associated with obesity.19 Nowadays, leptin is considered as potent bone cell modulators. Classically, regulation of bone metabolism was believed to be achieved by activating β-2 adrenergic receptors on osteoblasts, with a consequent decreasing of osteoblasts differentiation and increasing of osteoclasts activity. Hence, increased secretion of leptin has been proposed that is detrimental to bone formation while supportive for bone resorption.20,21
There are several candidate markers that change over time, such as serum IGF-122 and leptin.23 Thus, the aim of this study was to determine which one demonstrated the greatest utility in the early detection of women with low bone mass or osteoporosis. Herein, based on our previous large-scale cross-sectional study which related to postmenopausal osteoporosis conducted among Chinese population in mainland China, we investigated the differences of several serum markers among population with normal bone mass and osteoporosis. We hope our data could shed light on the utility of several new potential biomarker for the diagnosing and treatment response monitoring of PMOP.
Materials and Methods
Study Design and Participants
In this community-based cross-sectional and prospective follow-up study,24 we sought 1055 postmenopausal women who responded to an invitation to participate from Chaoyang District or Fengtai District in Beijing. Then, the participants were screened, based on predetermined inclusion and exclusion criteria. The investigation would gather data on BMD screening, biological samples, and questionnaire information. The trial was conducted in accordance with the Declaration of Helsinki. Written informed consent was obtained for all material from each participant.
Diagnostic Criteria
The diagnosis and treatment of primary osteoporosis was based on the criteria outlined by the WHO and Chinese guidelines,25 osteoporosis was diagnosed if T-score ≤−2.5, osteopenia was diagnosed if −2.5 < T-score < −1.0, and normal BMD was diagnosed if T-score ≥−1.0. Natural menopause is diagnosed after 12 months of amenorrhea not associated with a pathological cause.26 All participants had not received a previous treatment that may influence bone density and had not had other relevant metabolic diseases were eligible to participate in the study and comprise the population for this report. The characteristics of study participants are summarized in Table 1.
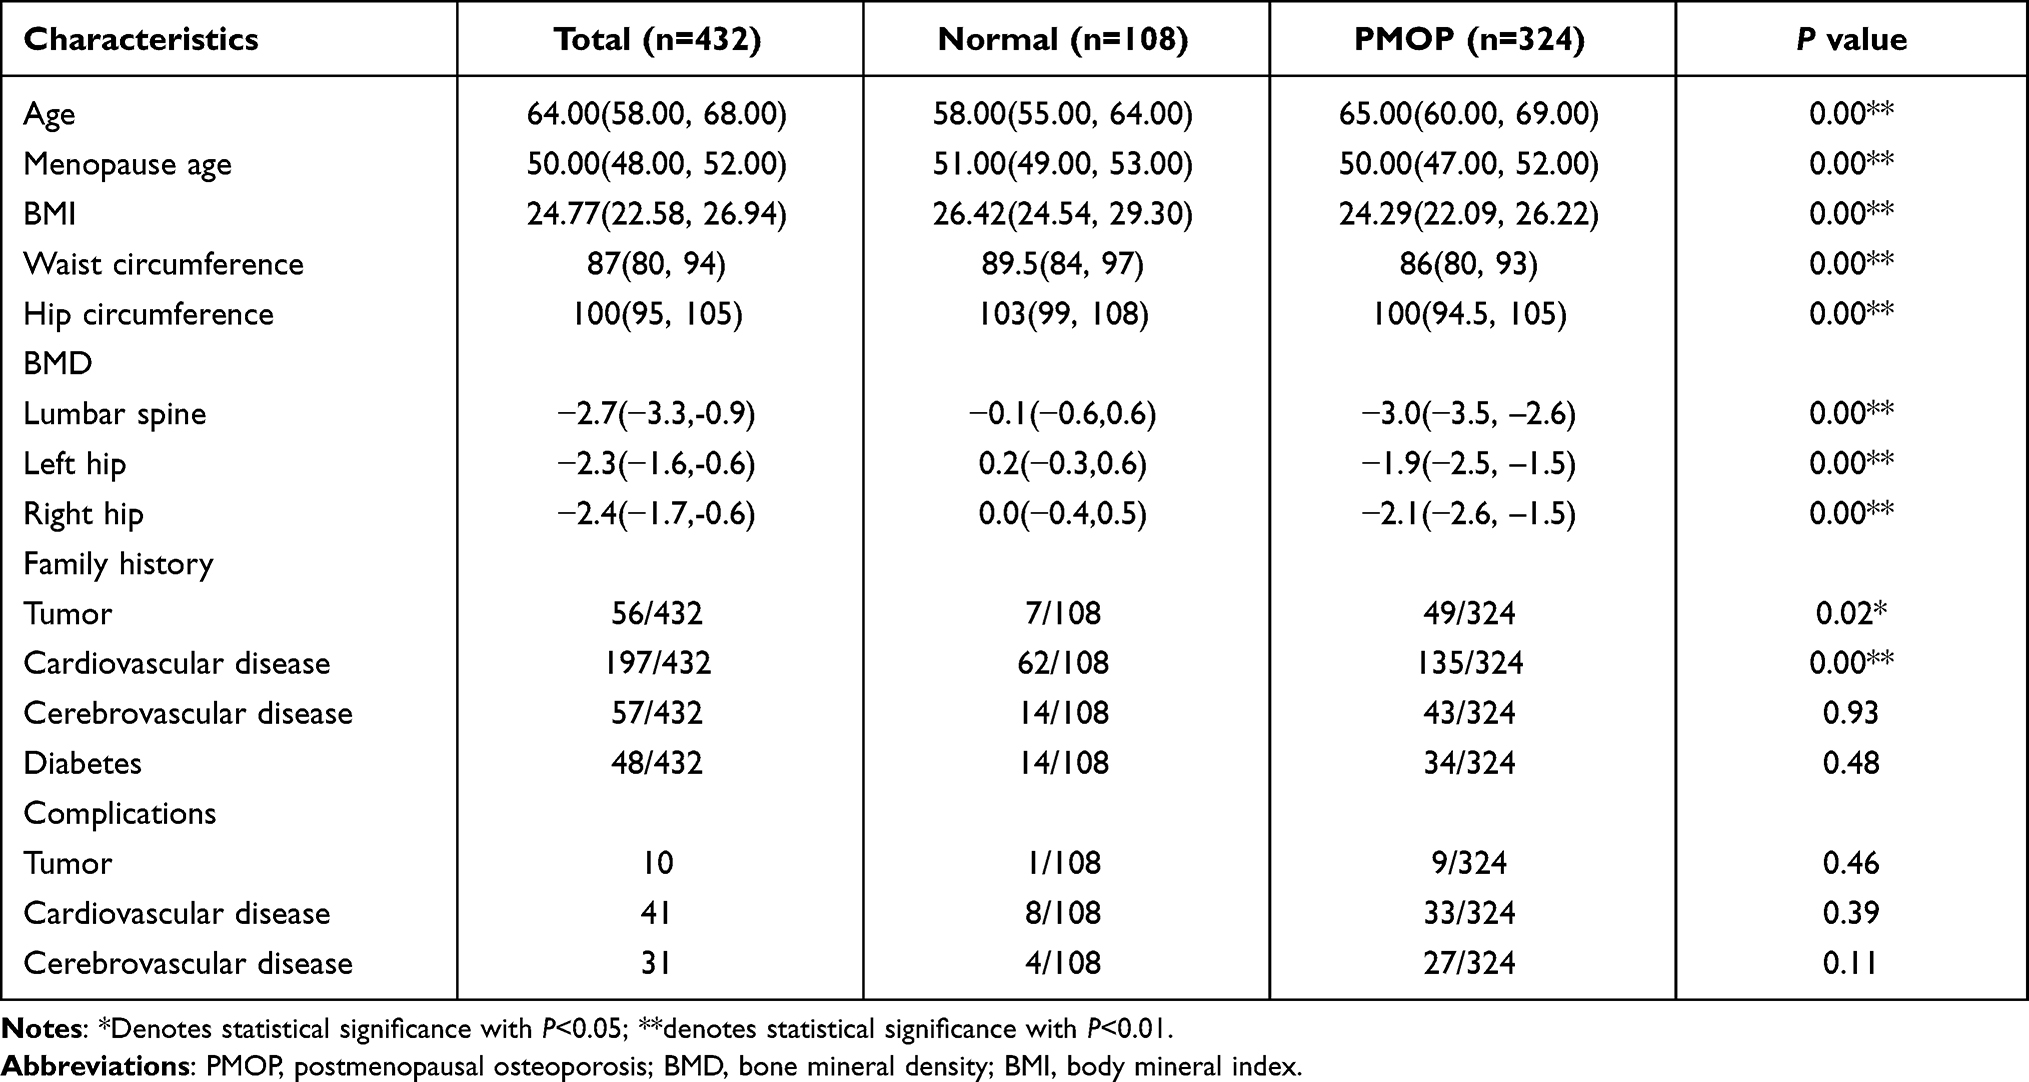 |
Table 1 Baseline Characteristics of Patients with PMOP and Normal Participants |
Inclusion and Exclusion Criteria
The inclusion criteria in our study were as follows: (1) postmenopausal women aged from 45 to 80 years; (2) the subjects lived locally lasting for more than five years; (3) the population with complete clinical and laboratory information including BMD, bone metabolic markers [β-CTX, P1NP, 25(OH)D3, serum Ca, serum P, serum Mg, ALP, PTH and OST] and cytokines (IL-6, IGF-1, BMP-2, VEGF, leptin and FGF23) of interest.
The exclusion criteria included: (1) the participants who had incomplete information; (2) those had diseases affecting bone metabolism or calcium absorption, such as endocrine system disease including diabetes and thyroid disorders, haematological diseases including leukaemia and myeloma, systemic lupus erythematosus, or renal disease; (3) those who received medications or therapy that may affect BMD, such as glucocorticoids and immunosuppressive agents, within three months before the study.
BMD Testing
BMD was evaluated by Dual-energy X-ray absorptiometry (DXA) (HOLOGIC WI, United States). The areas where patients undergo bone density testing include the lumbar spine and hips.
Cytokine and Biochemical Examinations
Samples of venous blood were collected in all volunteers between 8:30 and 12:00 a.m. Blood was collected into vacuum test tube and isolated by centrifugation at 1500g for 15 minutes at 4°C. Then, plasma aliquots were frozen at −80°C until analysis.
Multiplex kits for measuring cytokines were purchased from R&D SYSTEMS (LXSAHM-05, RD Human Premixed Multi-Analyte Kit) and Merck (HIGFMAG-52K, MILLIPLEX MAP Human IGF-1 Single Plex Magnetic Bead Kit). The cytokine analyses were performed in accordance with the manufacturer’s instructions for the xMAP technology with multiplex beads. Plates were measured using the Luminex 200 system (Luminex Corporation, Austin, TX, USA) and analyzed with the Bio-Plex Manager version 6.1 (Bio-Rad Laboratories, Inc, USA), agented by Wayen Biotechnologies (Shanghai, China), Inc. The Bio-Plex software calculated cytokine concentrations on the basis of fluorescence values derived from a recombinant cytokine standard included in the 96-well plate, and the software then generated a separate standard concentration curve for each of the 6 cytokines sampled. Each standard curve was created using eight concentration points. A nonlinear least-squares minimization algorithm generated a curve fitted by a five-parameter logistic equation and determined the high and low limits of detection. The following cytokines IL-6, IGF-1, BMP-2, VEGF, leptin and FGF23 were measured. Results are expressed as picograms per milliliter.
Assessment of Accuracy
The predictive value of the indicator panels was assessed using the area under the receiver-operator characteristic curve (AUC). We also used the AUC to compare the accuracy of the IGF1 plus leptin with other conventional bone metabolism indicators, which have been recommended by several clinical practice guidelines. Then, De Long’s method was used to compare areas under the curve of ROC curves. To evaluate the utility of the indicators for diagnosis, we determined the integrated discrimination improvement (IDI).
Statistical Analysis
Statistical analyses were conducted by using SAS 9.4 (SAS Institute, Cary, NC) and R software 4.1.1 (R Foundation for Statistical Computing, Vienna, Austria). Figures were created in GraphPad Prism 8.0 (GraphPad Software, CA, USA).
Depending on normality of data distribution, parametric or non-parametric tests were applied. Continuous variables were tested for a normal distribution using the Kolmogorov–Smirnov test and were presented as the median with an interquartile range. Categorical variables were presented as frequencies and percentages. The parametric test used in our analysis was the t-Student test; the non-parametric one was the U Mann–Whitney test. The relationships between the individual factors were investigated using Spearman’s rank order correlations. The association between biomarkers and PMOP was investigated by using multivariable logistic regression models and models which adjusted for age and waist-to-hip ratio. The areas under the ROC curve (AUCs) were calculated. To evaluate the value of different indicator combinations, De Long’s method was used to compare AUC. The integrated discrimination improvement (IDI) was used to evaluate the utility of the indicators for diagnosis. The level of statistical significance was set at P < 0.05.
Results
Study Population and Patient Characteristics
Among 1055 menopausal participants, 371 (35.17%) osteopenia patients and 252 (23.89%) secondary osteoporosis patients were excluded, and 432 subjects were enrolled in this analysis. According to the WHO diagnosis criteria, the enrolled 432 subjects were divided into normal group (n = 108) and PMOP group (n = 324). The baseline characteristics and outcomes of the included patients are reported in Table 1.
Overall, the basic anthropometry, BMD, past medical history and comorbidity were described. The median age of patients in the cohort was 64.00 (58.00, 68.00) years. The demographic characteristics were compared between the two groups, there were no differences between the normal and PMOP groups for family history of diabetes and cerebrovascular (P > 0.05). In addition, the complications of tumor, cardiovascular, and cerebrovascular showed no statistical difference between the two groups (P > 0.05). Compared with the normal group, patients in the PMOP group had older age, lower body mineral index, lower waist circumference and longer menopausal duration (P < 0.001). Furthermore, the PMOP group has higher tumor prevalence and lower cardiovascular prevalence (P < 0.001).
Biochemical Index Examinations
The biochemical index profiles in total and by group are reported in Table 2 and Figure 1. When compared against the normal group, in addition to the vitamin D, the PMOP group showed a significant increase in median values for other indicators (P < 0.05). Especially in P1NP and β-CTX, it showed that the PMOP group had a more active level of bone turnover.
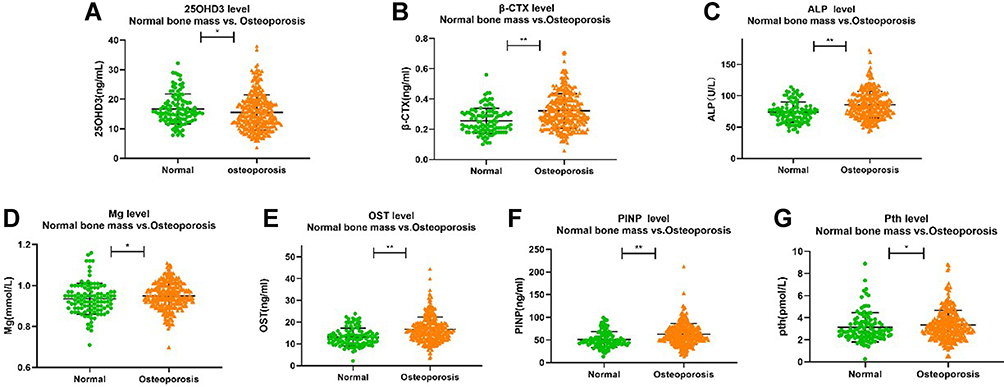 |
Figure 1 The level of β-CTX, P1NP, ALP, Mg, Pth, OST and 25OHD3 between two groups. (A) comparison of 25OHD3 between groups. (B) comparison of β-CTX between groups. (C) comparison of ALP between groups. (D) comparison of Mg between groups. (E) comparison of OST between groups. (F) comparison of PINP between groups. (G) comparison of Pth between groups. *Denotes statistical significance with P<0.05; **denotes statistical significance with P<0.01. |
Cytokine Examinations
Among the six cytokines representing different osteoporosis mechanisms, currently, only IGF-1 and leptin showed significant differences between the groups (P < 0.05) (Table 3 and Figure 2).
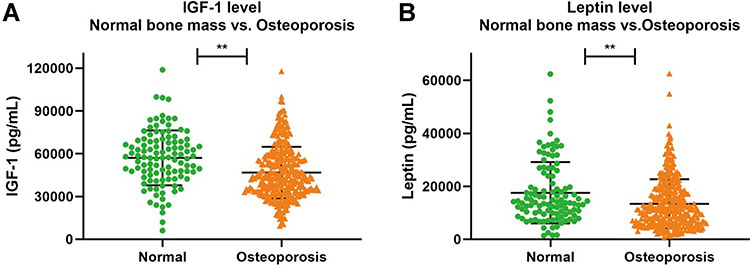 |
Figure 2 The level of IGF-1 and leptin between two groups. (A) comparison of IGF-1 between groups. (B) comparison of leptin between groups. **Denotes statistical significance with P<0.01. |
The Correlation Between BMD, IGF-1, Leptin and Other Bone Turnover Indicators
Given that different cytokines and biochemical indicators were significantly different between the groups, the next step was to quantify whether these factors showed a robust correlation with each other (Table 4). We found that IGF-1 and leptin, as newer cytokines in osteoporosis, not only have significant differences between groups, but also have a strong correlation with BMD (P < 0.05). Moreover, adjustment for age and waist-to-hip ratio had no further effect on the association between IGF-1, leptin and PMOP (P<0.05).
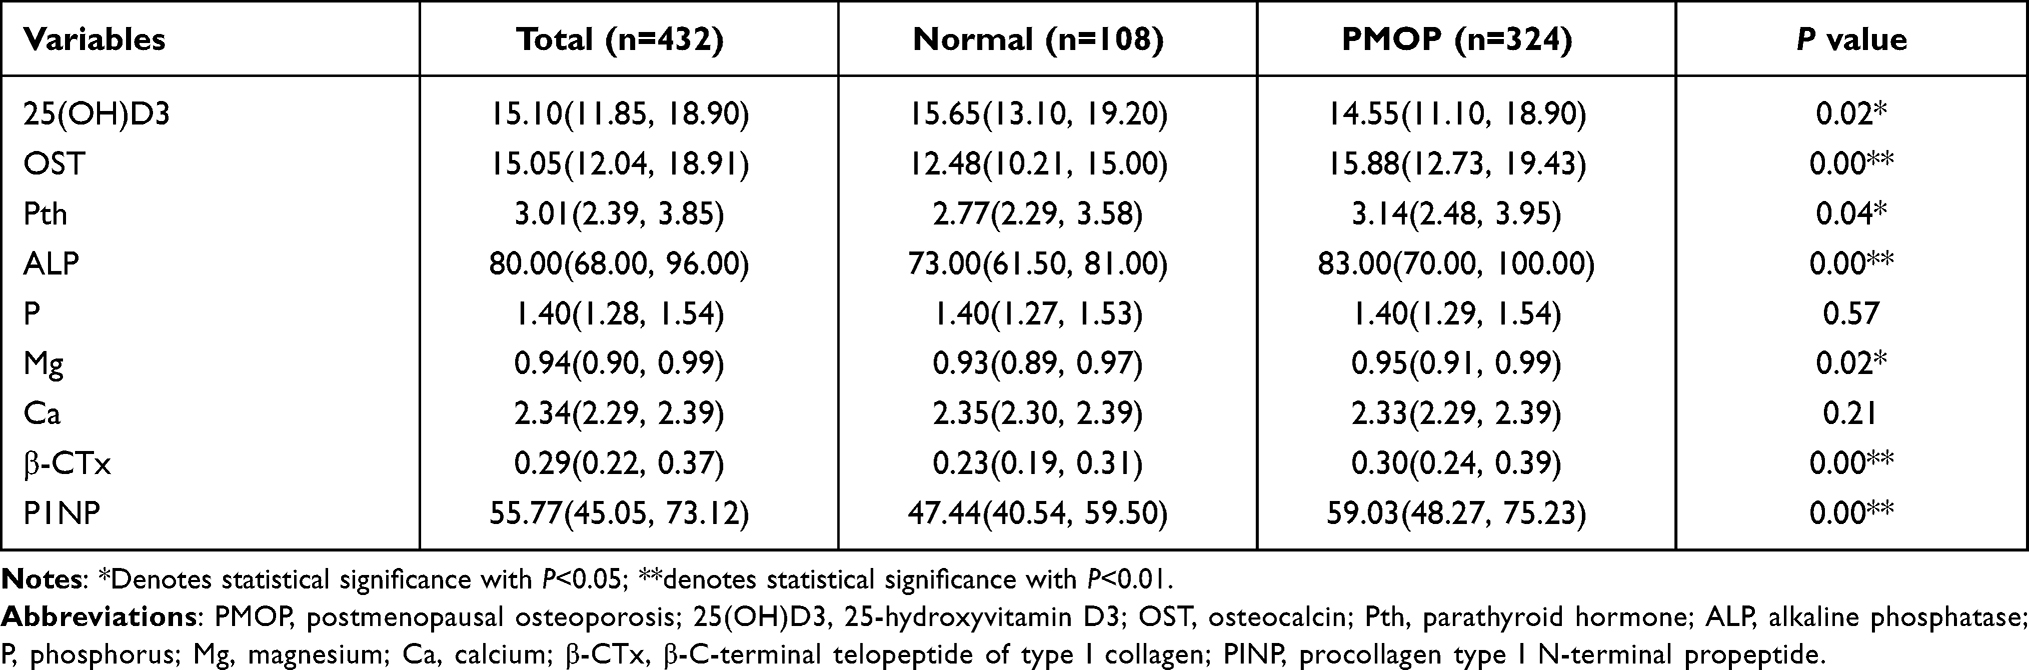 |
Table 2 Biomarker Comparison of PMOP and Normal Groups |
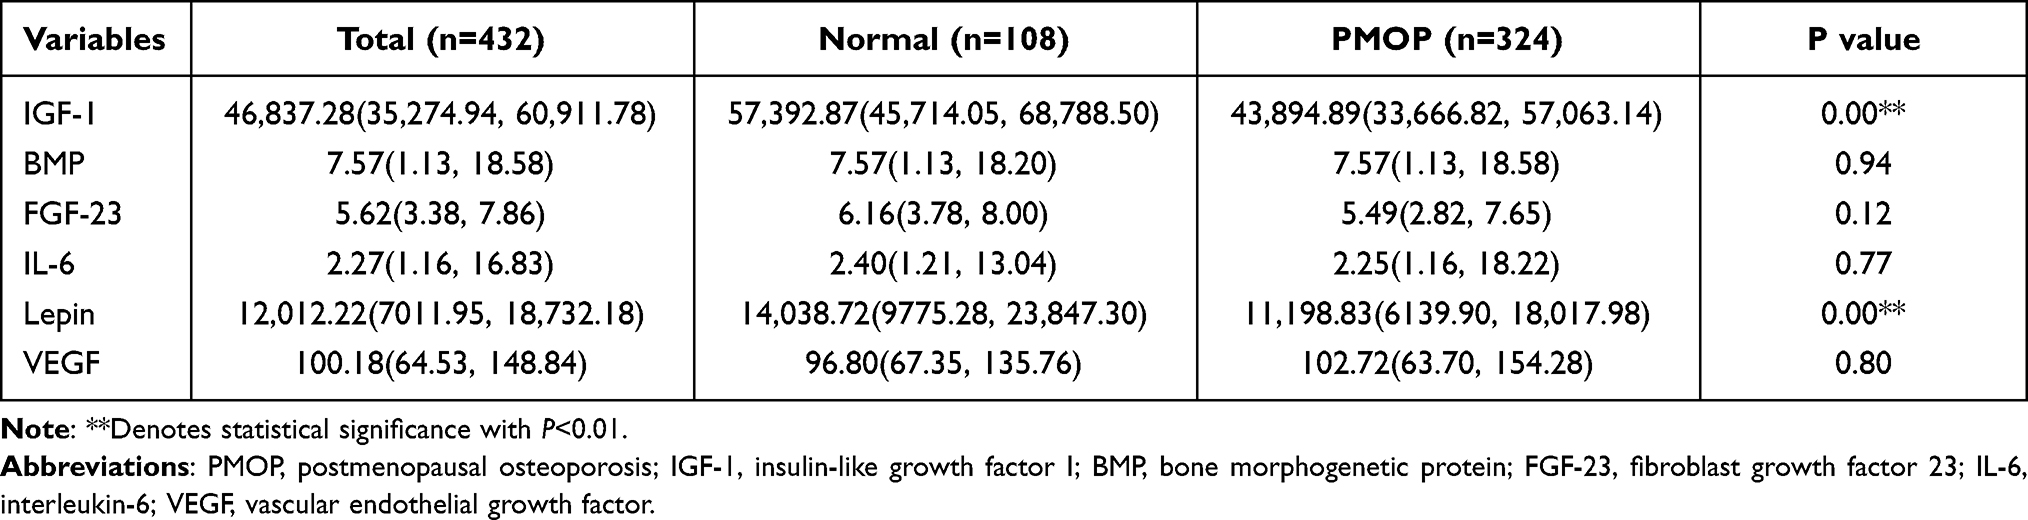 |
Table 3 Cytokines Comparison of PMOP and Normal Groups |
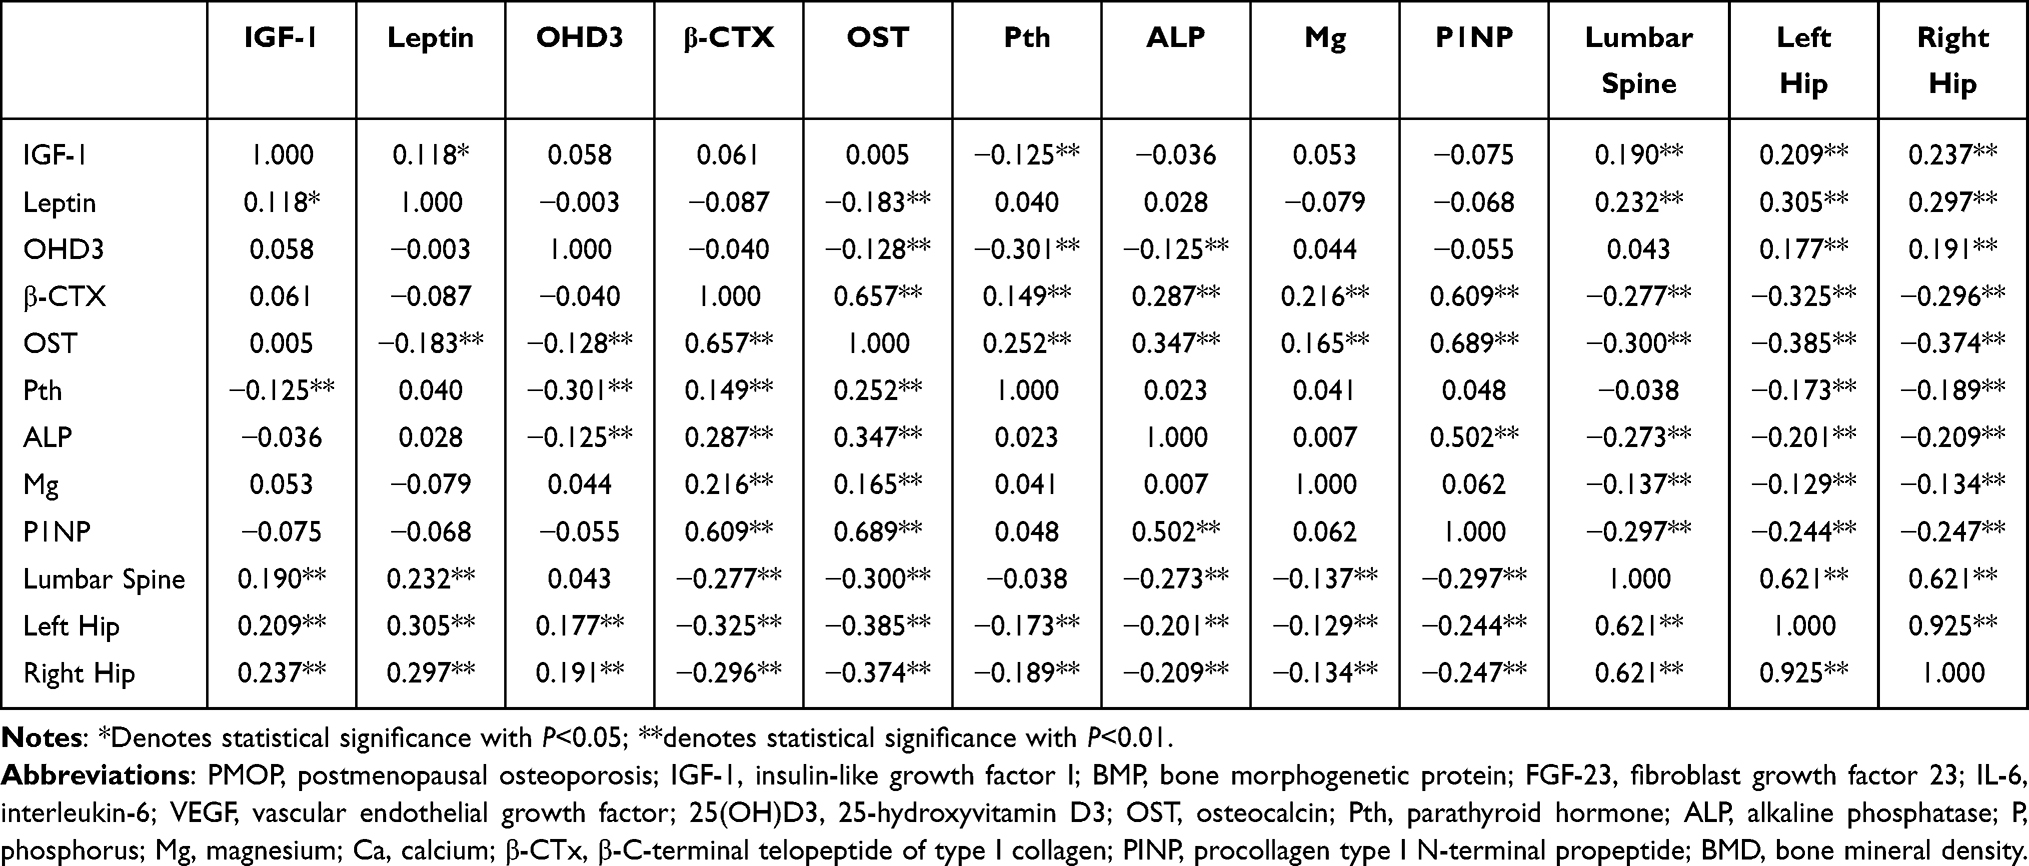 |
Table 4 Correlations Between BMD, IGF-1, Leptin and Classical Biomarkers |
Discrimination Performance of Biomarkers in PMOP
The ROC curves showed an accurate discrimination performance for all nine biomarkers. Herein, we compared 4 different combinations of indicators, including the combination of two newer cytokines (IGF-1 and leptin) for PMOP (Type A); the combination of two indicators, according to practice guideline, which can reflect bone formation and bone resorption (P1NP and β-CTX) (Type B); seven kinds of conventional OP biochemical examination indicators [25(OH)D3, OST, PTH, ALP, Mg, β-CTX and P1NP] (Type C); and the combination of all indicators included in this study (Type D).
The AUCs for different types were shown in Tables 5 and Tables 6 and Figure 3. The AUC value of Type A was close to that of Type B and Type C [Type A: 0.696 (95% CI,0.638–0.753); Type B: 0.687 (95% CI,0.632–0.743); Type C: 0.730 (95% CI, 0.678–0.782)]. The addition of Type A to the Type C improved the accuracy of the clinical model in terms of area under the curve, from 0.78 (95% CI, 0.730–0.820) to 0.809 (95% CI, 0.765–0.853) (P=0.000).
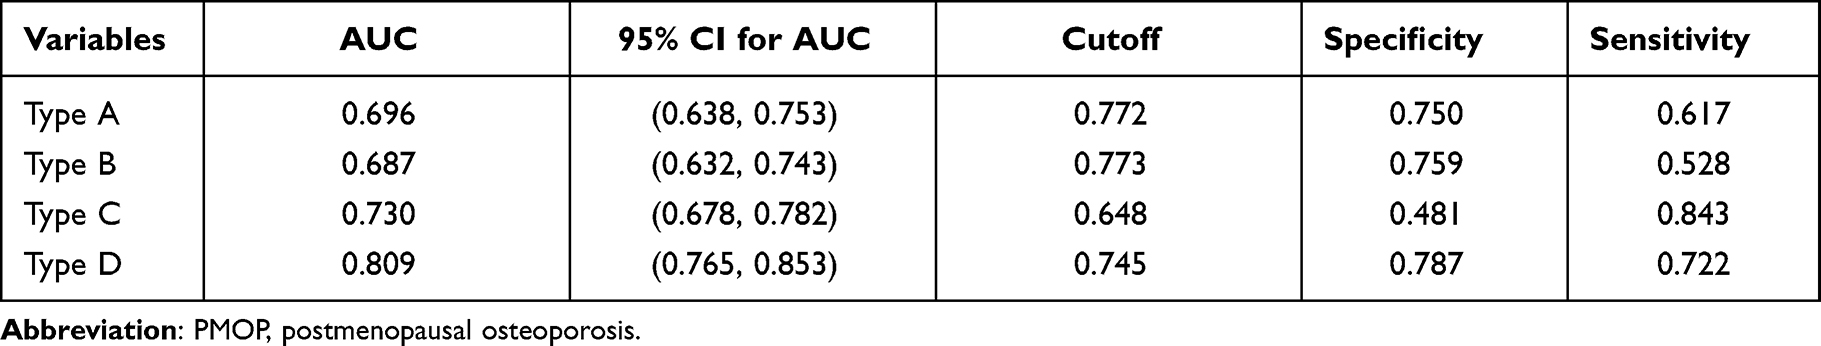 |
Table 5 Predictive Characteristics of Four Diagnostic Models for PMOP |
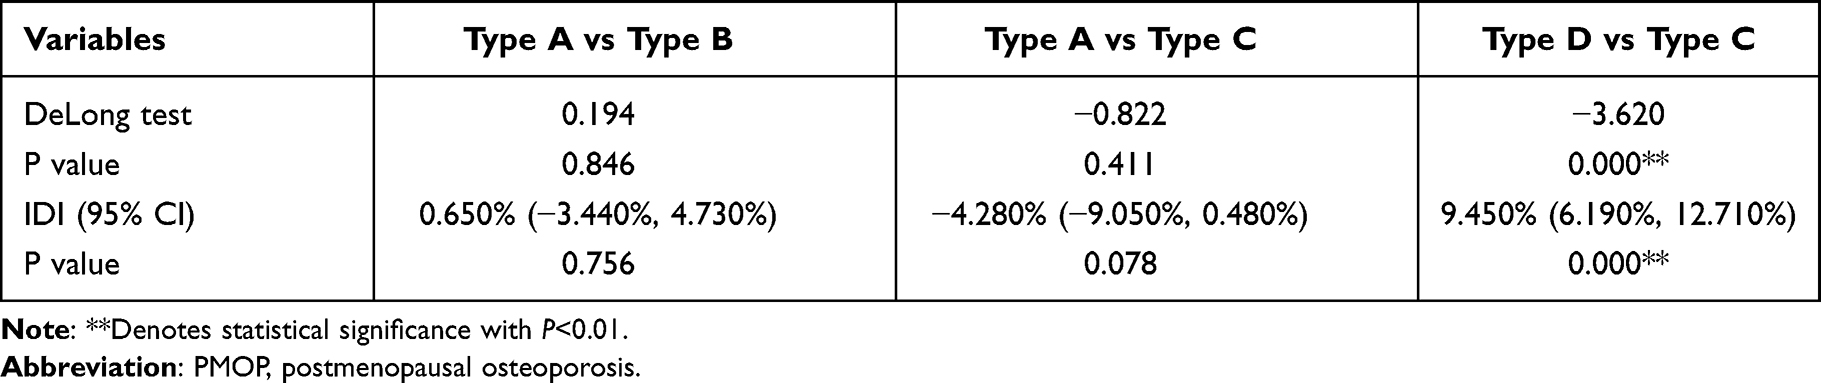 |
Table 6 Additional Predictive Value of IGF-1 with Leptin for PMOP |
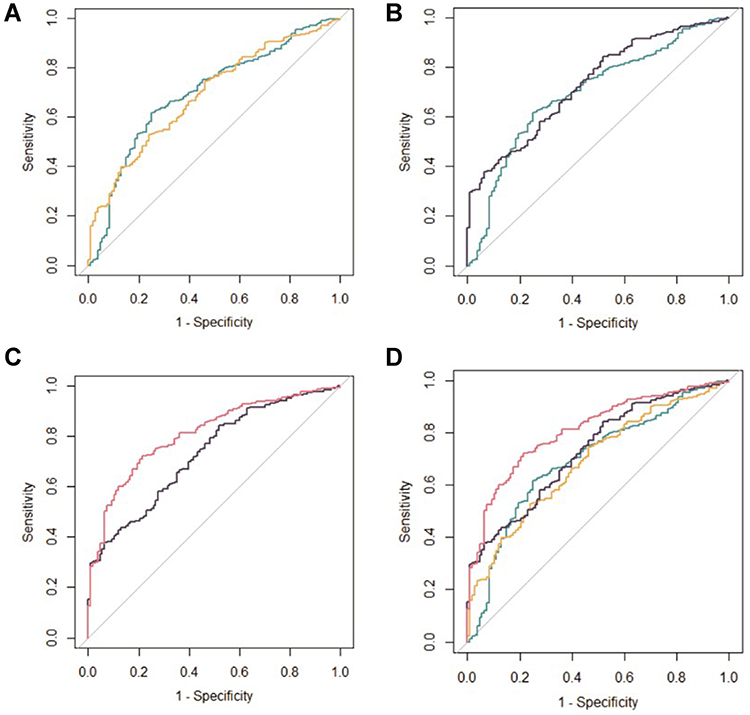 |
Figure 3 Receiver-operating characteristic (ROC) curves of the 4 diagnostic models for PMOP. (A) type A vs type B; (B) type A vs type C; (C) type C vs type D; (D) four types of diagnostic models. |
Furthermore, we determined the integrated discrimination improvement (IDI) to evaluate the efficacy of the different kinds of types for diagnosis. IGF-1 with leptin did significantly provide incremental value to the AUC of Type C, it markedly improved diagnostic efficacy, displaying an IDI of 9.45% (P = 0.000) (Table 6).
Discussion
Among numerous biomarkers, this study focused on the effectiveness of IGF-1 with leptin for diagnosing patients with PMOP alone and in combination with other markers, such as BMD, 25(OH)D3, OST, PTH, ALP, P, Mg, Ca, β-CTX and P1NP. Furthermore, the correlations between them and clinicopathological characteristics of OP patients also have explored. When analyzing the AUC between these “classical” bone metabolic markers and “new” indicators, we found that “IFG-1+leptin” (Type A) and “P1NP+β-CTX” (Type B) have similar discrimination effects [Type A: 0.696 (95% CI, 0.638,0.753); Type B: 0.687 (95% CI, 0.632–0.743); P=0.846]. It can even be close to the comprehensive distinguishing performance of other seven conventional indicators (OHD3, OST, PTH, ALP, Mg, β-CTX and P1NP) (Type C) [Type A: 0.696 (95% CI: 0.638,0.753); Type C: 0.730 (95% CI: 0.678, 0.782), P=0.411]. What’s more, if a higher-performance discrimination tool is to be obtained, incorporating the nine indicators together will assist to improve the prediction capacity of the panels [Type D: 0.809 (95% CI, 0.765–0.853)].
IGF-1, a member of the growth factor family, presents similar structure with that of insulin. Human skeleton cultured with high concentrations of IGF-1, which is involved in the regulation of bone metabolism.27 Moreover, it promotes the differentiation and proliferation of many kinds of cells, such as osteocytes. It can promote the re-establishment of vascular endothelium, interstitial cells or tissue cells in patients to improve the repair ability of patients’ organs.28 IGF-1 has recently been shown to inhibit bone resorption and promote bone formation.12 Vascular endothelial growth factor is involved in the regulation of bone growth, IGF-1 can promote angiogenesis by accelerating the secretion of it in osteoblasts.29 Also, lower expression of IGF-1 decreases bone mineral density and promote the occurrence of osteoporosis consequently by affecting the repair of collagen fibers, the mechanical stress ability of bone trabeculae or the flow of interstitial components of bone cells.30
The relationship between obesity and osteoporosis has been widely studied, the link between obesity and increased bone mass had been recently confirmed by epidemiological evidence. Leptin, a product of adipocytes, plays a significant role in regulating appetite. It may also directly promote the differentiation and proliferation of osteoblasts.31 Previous work has revealed that serum levels of leptin are positively correlated with BMD and that leptin levels are reduced in osteoporotic women.32,33 However, the main effect of leptin on BMD is still under debate in both in vivo and in vitro studies, as these results are inconsistent among different populations. These future prospective studies should include testing of multiple genes in both obese and lean subjects, collecting epidemiologic data of on dietary habits in different ethnic groups, and ideally, serial measurements of biomarkers in all included subjects, which allow a better understanding of the role of leptin in regulating weight in human populations. In summary, our results do not support the hypothesis that leptin itself does not have an essential role in maintaining bone mass in postmenopausal women.
The purpose and results of this study are shown in Figure 4. This study has certain limitations. Firstly, the cross-sectional design of the study limits our ability to establish causality and temporality of the observed associations. Secondly, only Beijing community women are included in our study, which limits the extrapolation of the results of our study. Thirdly, age difference between osteoporosis and non-osteoporosis patients was significant, it could reduce the significance of comparisons as cytokine is influenced by age. These along with other demographic characteristics may limit the generalizability of the findings to clinical practice. Furthermore, there have been numerous studies with same objective that have already highlighted the association between adipokines and PMOP. Notwithstanding these limitations, the main advancement of our study was the relatively large sample size and the wide number of bone turnover biomarkers analyzed. And based on the clinical information of the Chinese population, we believed that this study gave a further verification on the relationship between IGF-1, leptin and PMOP. It has some clinical implications for these two indicators to become potential markers for diagnosing PMOP.
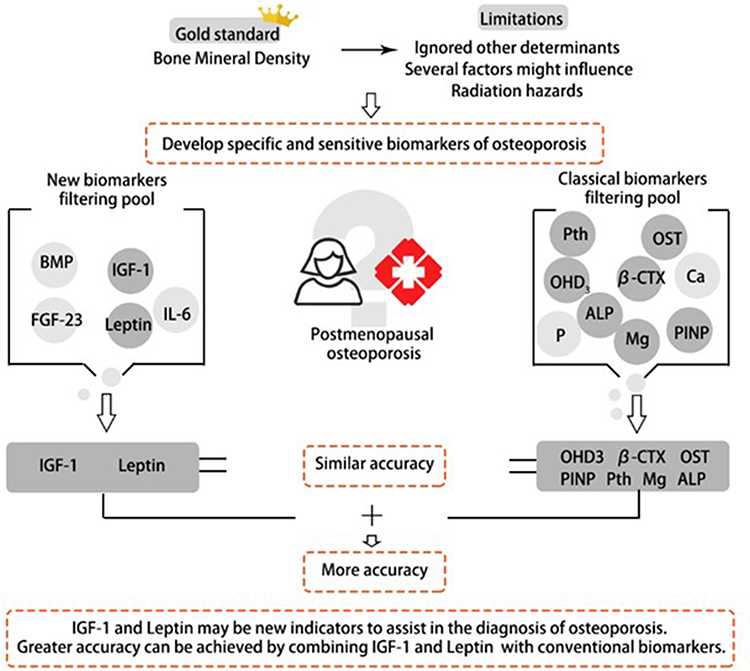 |
Figure 4 The combination of IGF-1 with leptin predicts PMOP patients with similar accuracy to classical biomarkers. This might be of interest in diagnosing PMOP, where the assessment of all biomarkers contributing to a diagnostic model can be expensive and time-consuming. |
Conclusion
Overall, IFG-1 and leptin seem to be key biomarker associated with PMOP in this study. The high prevalence of PMOP makes these cytokines with highly attractive in clinical practice. Although we did not perform longitudinal assessments, IGF-1 and leptin might bear the potential of becoming a very useful screening test also for clinical follow-up of patients.
Data Sharing Statement
All data reported in this study are available upon request by contact with the corresponding author.
Ethics Approval and Informed Consent
The study was approved by the medical ethics committee of Wangjing Hospital, and all procedures were performed in accordance with the Declaration of Helsinki. Written informed consent was obtained from all participants following a detailed description of the purpose and potential benefits from the study.
Consent for Publication
Written informed consent for publication was obtained from all participants.
Author Contributions
All authors made a significant contribution to the work reported, whether that is in the conception, study design, execution, acquisition of data, analysis and interpretation, or in all these areas; took part in drafting, revising or critically reviewing the article; gave final approval of the version to be published; have agreed on the journal to which the article has been submitted; and agree to be accountable for all aspects of the work.
Funding
This study was funded by the Innovation Team and Talents Cultivation Program of National Administration of Traditional Chinese Medicine (Grant number: ZYYCXTD-C-202003), the Fundamental Research Funds for the Central Public Welfare Research Institutes (Grant number: ZZ13-YQ-039, 2020YJSZX-4 and CI2021A02013). In addition, this work was also financially supported in part by the grants from the Priority Academic Program Development of Jiangsu Higher Education Institutions (PAPD).
Disclosure
The authors report no conflicts of interest in this work.
References
1. Clynes MA, Harvey NC, Curtis EM, et al. The epidemiology of osteoporosis. Br Med Bull. 2020;133:105. doi:10.1093/bmb/ldaa005
2. Rolvien T, Milovanovic P, Schmidt FN. Long-term immobilization in elderly females causes a specific pattern of cortical bone and osteocyte deterioration different from postmenopausal osteoporosis. J Bone Miner Res. 2020;35:1343–1351. doi:10.1002/jbmr.3970
3. Burns RJ, Deschênes SS, Schmitz N. Associations between depressive symptoms and indices of obesity in adults with prediabetes and normal blood glucose levels: results from the emotional health and wellbeing study. Can J Diabetes. 2018;42:626–631. doi:10.1016/j.jcjd.2018.05.005
4. Manolagas SC, O’Brien CA, Almeida M. The role of estrogen and androgen receptors in bone health and disease. Nat Rev Endocrinol. 2013;9(12):699–712. doi:10.1038/nrendo.2013.179
5. Li L, Chen X, Lv S, et al. Influence of exercise on bone remodeling-related hormones and cytokines in ovariectomized rats: a model of postmenopausal osteoporosis. PLoS One. 2014;9(11):e112845. doi:10.1371/journal.pone.0112845
6. Mishra GD, Kuh D. Health symptoms during midlife in relation to menopausal transition: British prospective cohort study. BMJ. 2012;344:e402. doi:10.1136/bmj.e402
7. Wang O, Hu Y, Gong S, et al. A survey of outcomes and management of patients post fragility fractures in China. Osteoporos Int. 2015;26:2631–2640. doi:10.1007/s00198-015-3162-6
8. Assessment of fracture risk and its application to screening for postmenopausal osteoporosis. Report of a WHO Study Group. World Health Organ Tech Rep Ser. 1994;843:l–129.
9. Marcus R. Clinical review 76: the nature of osteoporosis. J Clin Endocrinol Metab. 1996;81:1–5. doi:10.1210/jcem.81.1.8550734
10. Agnusdei D, Gentilella R. GH and IGF-I as therapeutic agents for osteoporosis. J Endocrinol Invest. 2005;28:32–36.
11. Belfiore A, Frasca F, Pandini G, et al. Insulin receptor isoforms and insulin receptor/insulin-like growth factor receptor hybrids in physiology and disease. Endocr Rev. 2009;30:586–623. doi:10.1210/er.2008-0047
12. Xian L, Wu X, Pang L, et al. Matrix IGF-1 maintains bone mass by activation of mTOR in mesenchymal stem cells. Nat Med. 2012;18(7):1095–1101. doi:10.1038/nm.2793
13. Ohlsson C, Mohan S, Sjögren K, et al. The role of liver-derived insulin-like growth factor-I. Endocr Rev. 2009;30:494–535. doi:10.1210/er.2009-0010
14. Seck T, Scheppach B, Scharla S, et al. Concentration of insulin-like growth factor (IGF)-I and -II in iliac crest bone matrix from pre- and postmenopausal women: relationship to age, menopause, bone turnover, bone volume, and circulating IGFs. J Clin Endocrinol Metab. 1998;83:2331–2337. doi:10.1210/jcem.83.7.4967
15. Yamaguchi T, Kanatani M, Yamauchi M, et al. Serum levels of insulin-like growth factor (IGF); IGF-binding proteins-3, −4, and −5; and their relationships to bone mineral density and the risk of vertebral fractures in postmenopausal women. Calcif Tissue Int. 2006;78:18–24. doi:10.1007/s00223-005-0163-z
16. Nakamura Y, Nakano M, Suzuki T, et al. Two adipocytokines, leptin and adiponectin, independently predict osteoporotic fracture risk at different bone sites in postmenopausal women. Bone. 2020;137:115404. doi:10.1016/j.bone.2020.115404
17. Cao JJ. Effects of obesity on bone metabolism. J Orthop Surg Res. 2011;6:30. doi:10.1186/1749-799X-6-30
18. Chen JR, Lazarenko OP, Wu X, et al. Obesity reduces bone density associated with activation of PPARγ and suppression of Wnt/β-catenin in rapidly growing male rats. PLoS One. 2010;5(10):e13704. doi:10.1371/journal.pone.0013704
19. Makki K, Froguel P, Wolowczuk I. Adipose tissue in obesity-related inflammation and insulin resistance: cells, cytokines, and chemokines. ISRN Inflamm. 2013;2013:139239. doi:10.1155/2013/139239
20. He JY, Jiang LS, Dai LY. The roles of the sympathetic nervous system in osteoporotic diseases: a review of experimental and clinical studies. Ageing Res Rev. 2011;10(2):253–263. doi:10.1016/j.arr.2011.01.002
21. Takeda S, Elefteriou F, Levasseur R, et al. Leptin regulates bone formation via the sympathetic nervous system. Cell. 2002;111(3):305–317. doi:10.1016/S0092-8674(02)01049-8
22. Probst-Hensch NM, Wang H, Goh VH, et al. Determinants of circulating insulin-like growth factor I and insulin-like growth factor binding protein 3 concentrations in a cohort of Singapore men and women. Cancer Epidemiol Biomarkers Prev. 2003;12:739–746.
23. Ruhl CE, Everhart JE. Relationship of serum leptin concentration with bone mineral density in the United States population. J Bone Miner Res. 2002;17:1896–1903. doi:10.1359/jbmr.2002.17.10.1896
24. Sun M, Zhang Y, H. S, et al. Prevalence of and risk factors for community-based osteoporosis and associated fractures in Beijing: study protocol for a cross-sectional and prospective study. Front Med. 2020;7:544697. doi:10.3389/fmed.2020.544697
25. Baum E, Peters KM. The diagnosis and treatment of primary osteoporosis according to current guidelines. Dtsch Arztebl Int. 2008;105(33):573–582. doi:10.3238/arztebl.2008.0573
26. Nelson HD. Menopause. Lancet. 2008;371(9614):760–770. doi:10.1016/S0140-6736(08)60346-3
27. Giustina A, Mazziotti G, Canalis E. Growth hormone, insulin-like growth factors, and the skeleton. Endocr Rev. 2008;29(5):535–559. doi:10.1210/er.2007-0036
28. Gao L, Gao HZ, Ren Y. The clinical observation of bone metabolic index and cytokine IGF-1 in postmenopausal osteoporosis patients. Chin J Lab Diagn. 2014;18(6):919–921.
29. Ding L, Li X, Sun H, et al. Transplantation of bone marrow mesenchymal stem cells on collagen scaffolds for the functional regeneration of injured rat uterus. Biomaterials. 2014;35(18):4888–4900. doi:10.1016/j.biomaterials.2014.02.046
30. Ljunghall S, Johansson AG, Burman P, et al. Low plasma levels of insulin-like growth factor 1 (IGF-1) in male patients with idiopathic osteoporosis. J Intern Med. 2010;232(1):59–64. doi:10.1111/j.1365-2796.1992.tb00550.x
31. Gordeladze JO, Drevon CA, Syversen U, et al. Leptin stimulates human osteoblastic cell proliferation, de novo collagen synthesis, and mineralization: impact on differentiation markers, apoptosis, and osteoclastic signaling. J Cell Biochem. 2002;85:825–836. doi:10.1002/jcb.10156
32. Zhao HY, Liu JM, Ning G. Study of relationship between serum leptin level and bone mineral density in postmenopausal women. Shanghai Med. 2004;27:4–7.
33. Zhong N, Wu XP, Xu ZR, et al. Relationship of serum leptin with age, body weight, body mass index, and bone mineral density in healthy mainland Chinese women. Clin Chim Acta. 2005;351:161–168. doi:10.1016/j.cccn.2004.09.003
 © 2022 The Author(s). This work is published and licensed by Dove Medical Press Limited. The full terms of this license are available at https://www.dovepress.com/terms.php and incorporate the Creative Commons Attribution - Non Commercial (unported, v3.0) License.
By accessing the work you hereby accept the Terms. Non-commercial uses of the work are permitted without any further permission from Dove Medical Press Limited, provided the work is properly attributed. For permission for commercial use of this work, please see paragraphs 4.2 and 5 of our Terms.
© 2022 The Author(s). This work is published and licensed by Dove Medical Press Limited. The full terms of this license are available at https://www.dovepress.com/terms.php and incorporate the Creative Commons Attribution - Non Commercial (unported, v3.0) License.
By accessing the work you hereby accept the Terms. Non-commercial uses of the work are permitted without any further permission from Dove Medical Press Limited, provided the work is properly attributed. For permission for commercial use of this work, please see paragraphs 4.2 and 5 of our Terms.