")
Back to Journals » Cancer Management and Research » Volume 13
The Potential of Visceral Adipose Tissue in Distinguishing Clear Cell Renal Cell Carcinoma from Renal Angiomyolipoma with Minimal Fat
Authors Liu J, Bao J, Zhang W, Li Q, Hou J, Wei X, Huang Y
Received 31 August 2021
Accepted for publication 13 November 2021
Published 30 November 2021 Volume 2021:13 Pages 8907—8914
DOI https://doi.org/10.2147/CMAR.S336920
Checked for plagiarism Yes
Review by Single anonymous peer review
Peer reviewer comments 2
Editor who approved publication: Professor Seema Singh
Jianhu Liu,1,2,* Jie Bao,3,* Weijie Zhang,1 Qiaoxing Li,2 Jianquan Hou,1 Xuedong Wei,1 Yuhua Huang1
1Department of Urology, The First Affiliated Hospital of Soochow University, Suzhou, 215006, People’s Republic of China; 2Department of Urology, Affiliated Kunshan Hospital of Jiangsu University, Suzhou, 215300, People’s Republic of China; 3Department of Radiology, The First Affiliated Hospital of Soochow University, Suzhou, 215006, People’s Republic of China
*These authors contributed equally to this work
Correspondence: Xuedong Wei
Department of Urology, The First Affiliated Hospital of Soochow University, No. 188 Shizi Street, Suzhou, Jiangsu, 215006, People’s Republic of China
Tel +86 18914061080
Fax +86 51265221447
Email [email protected]
Yuhua Huang
Department of Urology, The First Affiliated Hospital of Soochow University, No. 188 Shizi Street, Suzhou, Jiangsu, 215006, People’s Republic of China
Tel +86 18913752992
Fax +86 51265221447
Email [email protected]
Purpose: To overcome the challenge of preoperative differentiation between clear cell renal cell carcinoma (ccRCC) and renal angiomyolipoma with minimal fat (RMFAML), we evaluated the potential of visceral adipose tissue (VAT) in distinguishing RMFAML from ccRCC.
Patients and Methods: Patients (191) were divided into ccRCC and RMFAML groups according to postoperative pathology. Umbilical horizontal computed tomography (CT) images were used for visceral fat area (VFA), subcutaneous fat area (SFA) and total fat area (TFA) measurements. Logistic regression was used to identify risk factors for ccRCC. Areas under the receiver operating characteristic (ROC) curve (AUCs) were compared to identify the most valuable indicator for identifying ccRCC and RMFAML.
Results: In total, 166 patients had ccRCC, and 25 had RMFAML. ccRCC and RMFAML patients showed significant differences in age (P< 0.001), sex (P< 0.001), hypertension (P=0.027), BMI (P< 0.001), SFA (P=0.046), VFA (P< 0.001) and TFA (P< 0.001). According to multiple logistic regression analysis, male sex [4.311 (1.469∼ 12.653), p=0.008]; older age [1.047 (1.008∼ 1.088), p=0.017]; and higher BMI [1.305 (1.088∼ 1.566), p=0.004], SFA [1.013 (1.003∼ 1.023), p=0.008], VFA [1.026 (1.012∼ 1.041), p< 0.001] and TFA [1.011 (1.005∼ 1.017), p=0.001] were associated with ccRCC. The AUCs of sex (male), age, BMI, TFA, VFA, and SFA were 0.726, 0.687, 0.783, 0.769, 0.840, and 0.645, respectively. The VFA cut-off value was 69.99 cm2. The sensitivity and specificity of higher VFA (≥ 69.99 cm2) for ccRCC diagnosis were 79.52% and 80.00%, respectively.
Conclusion: In differentiating ccRCC from RMFAML, male sex, older age, and higher BMI, TFA, SFA, and VFA are risk factors for ccRCC. VFA is the most effective indicator for identifying ccRCC.
Keywords: body mass index, clear cell renal cell carcinoma, obesity-related index, renal angiomyolipoma with minimal fat, visceral adipose tissue, visceral fat area
Introduction
Renal cell carcinoma (RCC) and renal angiomyolipoma (AML) are the most common solid tumours of the kidney.1 Global cancer statistics for 2018 showed that among malignant tumours, kidney cancer ranked 16th and 17th in global morbidity and mortality, respectively.2 Moreover, the morbidity of RCC has gradually increased over recent decades.3 AMLs are classified as tumours of perivascular epithelial cells and are composed of variable proportions of blood vessels, smooth muscle and adipose tissue. AML can be classified into three subtypes in radiologic classification: fat-rich AML, fat-poor AML, and fat-invisible AML. Fat-rich AML has a computed tomography (CT) value of –10 Hounsfield units (HU) or less. The CT values of fat-poor AML and fat-invisible AML exceed −10 HU. Fat-poor AML is defined as AML with a tumour-to-spleen ratio of less than 0.71. Fat-invisible AML is AML with a tumour-to-spleen ratio of 0.71 or greater.4 In our research, two subtypes of RMFAML are considered: fat-poor AML and fat-invisible AML. Most AML and RCC cases can be distinguished by CT or magnetic resonance imaging (MRI) because of the presence of macroscopic adipose tissue in AML.
Approximately 4.5% of AMLs are classified as renal angiomyolipoma with minimal fat (RMFAML) because they contain very little fat; however, RMFAML cannot be identified on CT images.5 Therefore, in CT, MRI, and ultrasound imaging examinations, RMFAML appears similar to RCC, especially clear cell renal cell carcinoma (ccRCC), and it is difficult to distinguish between the two.6 It is necessary to distinguish ccRCC from RMFAML before surgery to prevent RMFAML from being misdiagnosed as ccRCC and subsequently undergoing unnecessary surgery. Previous studies focused on identifying ccRCC and RMFAML have mostly been in the field of imaging. Simpfendorfer et al7 applied pixel counts with subzero attenuation in CT scans to diagnose RMFAML. The numbers of pixels with attenuation less than −10, −20 and −30 HU were independently counted by three radiologists. The sensitivity, specificity and positive predictive value were 22%, 98% and 72%, respectively. Many previous studies have shown that CT histogram analysis can be used to diagnose AML,7,8 but research by Chaudhry et al9 showed that histogram analysis of attenuation measurements could not reliably distinguish RMFAML from ccRCC. A review by Zhang et al showed that texture analysis can be used to distinguish between fat-poor AML and RCC on both unenhanced and enhanced CT. Texture features are regarded as potential quantitative, noninvasive and effective imaging biomarkers. Machine learning-based methods using open-source software or high-precision algorithms may be of great help to future imaging studies.10 The percentage decrease in signal intensity of chemical shift MRI has high specificity and moderate sensitivity in predicting ccRCC but is less effective at predicting RMFAML.11 However, there is currently no universally accepted standard, and verification is needed before MRI features can be widely used in clinical practice.
Is there any other way to distinguish ccRCC from RMFAML? It is well known that obesity is a risk factor for RCC. Research by Wang et al12 showed that ccRCC is associated with an increase in visceral fat area (VFA). In clinical practice, we have found that patients with RCC tend to be more obese than patients with AML. Body adipose tissue has the biological functions of altering lipid metabolism, regulating fat factors and causing chronic inflammation. An increase in visceral adipose tissue (VAT) leads to an increase in proinflammatory cytokines,13 a decrease in circulating adiponectin level,14 and increases in leptin level15 and the severity of insulin resistance.16 The role of visceral fat in the development of RCC is more significant than that of subcutaneous fat. Therefore, the purpose of our research was to explore the significance of obesity and VAT for the identification of ccRCC and RMFAML.
Patients and Methods
Patient Selection and Study Design
We retrospectively analysed all patients who underwent surgical treatment between January 2016 to March 2019 and whose pathology was confirmed to be ccRCC or RMFAML. The patient exclusion criteria were a lack of availability of abdominal CT scans and postoperative pathology confirming non-ccRCC or the common type of AML. Cases with missing values were excluded. The postoperative pathological reports were provided by two pathology experts in our centre. A total of 191 patients were included in this study, of which 166 patients had ccRCC and 25 had RMFAML. This study was conducted in accordance with the Declaration of Helsinki and was approved by the Committee Board of the First Affiliated Hospital of Soochow University, Suzhou, China (ID: 2015138). All patients signed informed consent forms before surgery and passed the perioperative period safely.
The following variables were included in this study: age, sex, tumour size, hypertension, diabetes, body mass index (BMI), VFA, subcutaneous fat area (SFA) and total fat area (TFA) at the umbilical level of CT images. BMI is an index of the degree of obesity in humans. Based on the Chinese standard, obesity was defined as BMI≥28 kg/m2, and overweight was defined as 24≤BMI<28 kg/m2. It is difficult to quantitatively measure the volume of abdominal fat tissue. However, the umbilicus is a good alternative reference for the abdomen.12 We selected the image at the umbilical level of the CT images and measured the TFA, SFA, and VFA in this image using ImageJ 1.52a software (Figure 1). Adipose tissue (cm2) was calculated using the standard HU range of –190 to –30 HU. The measurement of adipose area was performed by two radiologists who were blinded to the pathological outcomes of the patients, and the average value was obtained as the final result.
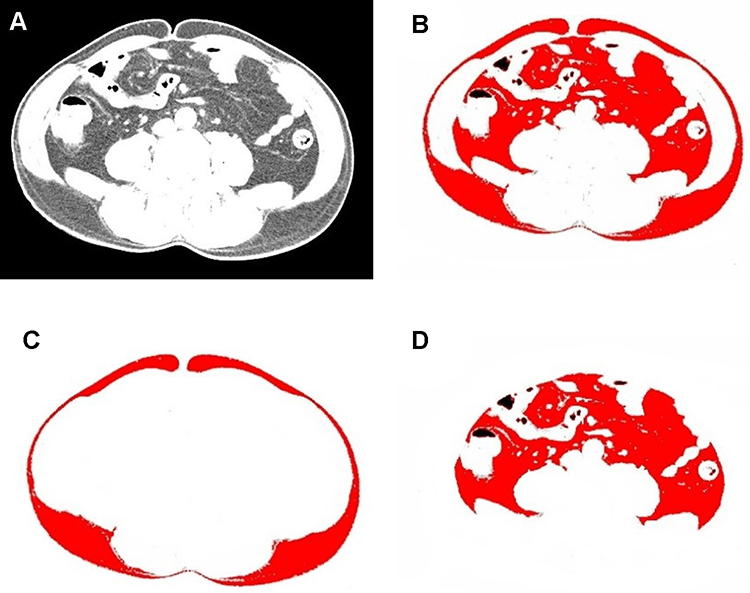 |
Figure 1 (A) CT image at the umbilical level. (B) The red part shows the total fat area (TFA). (C) The red part shows the subcutaneous fat area (SFA). (D) The red part shows the visceral fat area (VFA). |
Statistical Analysis
Statistical analyses were performed using SPSS 20.0 statistical software (SPSS Inc. USA) and MedCalc 16.1 (MedCalc Software, Belgium). Data with a normal distribution are expressed as the mean ± standard deviation (x ± SD) and were analysed using Student’s t-test. Pearson’s chi-square test was used to analyse categorical data. Data with a non-normal distribution are expressed as the median and range (minimum and maximum) and were analysed with the Mann–Whitney rank sum test. Univariate and multivariate logistic regression analyses were used to assess the risk factors for distinguishing ccRCC from AML. Odds ratios (ORs) with 95% confidence intervals (CIs) were calculated. Receiver operating characteristic (ROC) curves were used to determine the area under the curve (AUC) values and determine cut-off values for the variables. The AUC values were compared among different indicators with the DeLong test. P<0.05 was considered statistically significant.
Results
A total of 191 patients were included in this study, of which 166 patients had ccRCC and 25 had RMFAML. Table 1 shows the clinical data of the patients. ccRCC patients had significant differences from RMFAML patients in VFA, TFA, SFA, BMI, age, sex, and hypertension. RMFAML patients had younger ages and smaller VFA, TFA, and SFA as well as lower BMI. Most ccRCC patients were male, accounting for 69.28% of ccRCC patients, while the majority of RMFAML patients were female, accounting for 76.00% of RMFAML patients. The higher prevalence of hypertension in ccRCC patients may be related to the older ages of these patients than RMFAML patients, and hypertension is a risk factor for RCC.17 Student’s t-test showed a significant correlation between VFA and sex (P<0.001), while Pearson’s test showed that VFA was significantly associated with age (r = 0.222, P<0.001) (Figure 2).
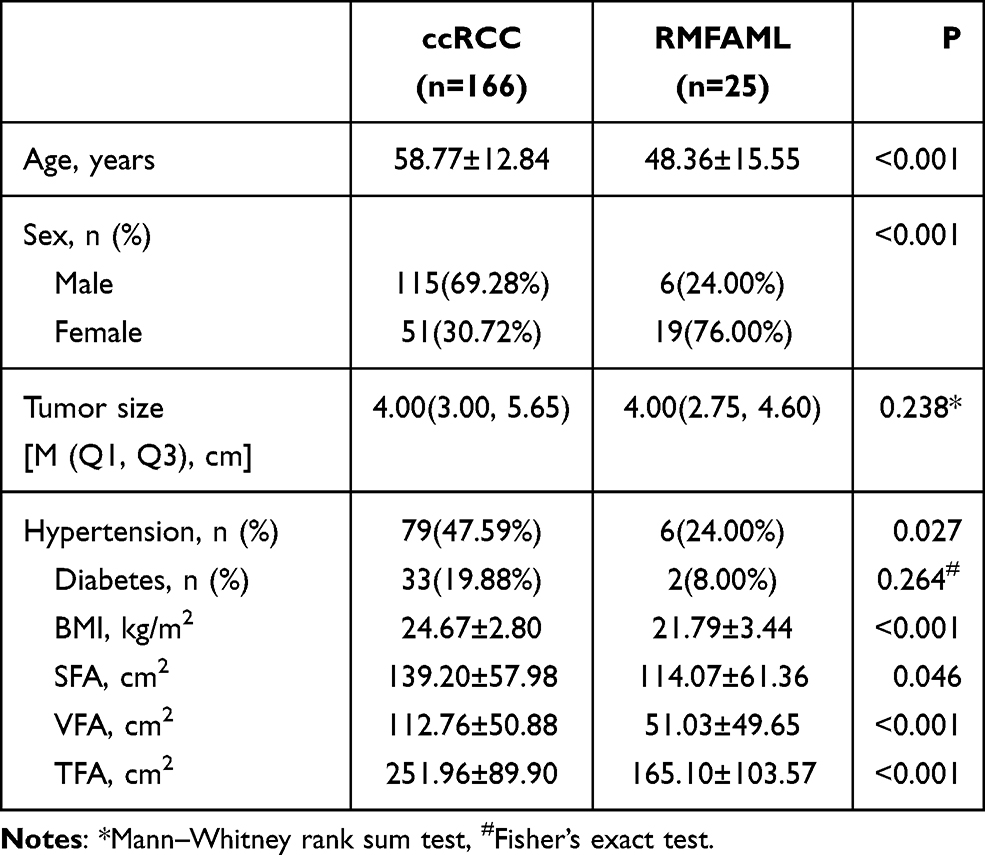 |
Table 1 The Clinical Data of the Patients |
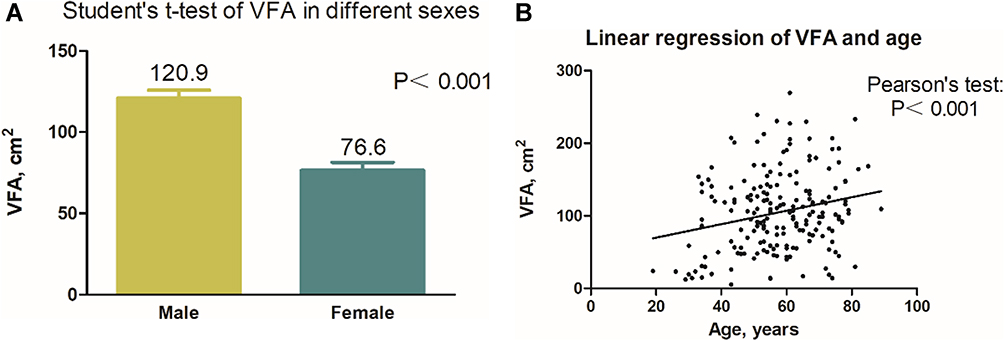 |
Figure 2 (A) Student’s t-test showed a significant correlation between VFA and sex (P<0.001). (B) Pearson’s test showed that VFA was significantly associated with age (r=0.222, P<0.001). |
Univariate logistic regression analysis revealed significant differences in age, sex, hypertension, BMI, SFA, VFA and TFA between the two groups (Table 2). Before conducting the multivariate logistic regression analysis, we found that BMI, VFA, SFA and TFA were linearly related to each other (Figure 3). Pearson’s test showed linear correlations among BMI, VFA, SFA and TFA. BMI was significantly associated with VFA (r=0.635, P<0.001), SFA (r=0.596, P<0.001), and TFA (r=0.730, P<0.001); VFA was significantly associated with SFA (r=0.826, P<0.001) and TFA (r=0.417, P<0.001); and TFA was significantly associated with SFA (r=0.857, P<0.001). Therefore, we divided the multivariate logistic regression analysis into 5 models.
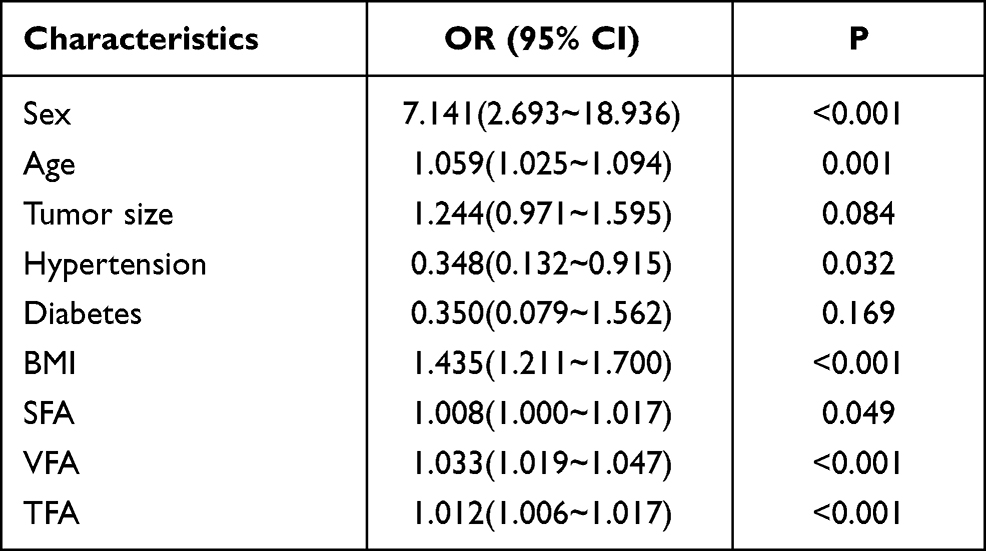 |
Table 2 Univariate Analysis of Predictors for Distinguishing ccRCC from RMFAML |
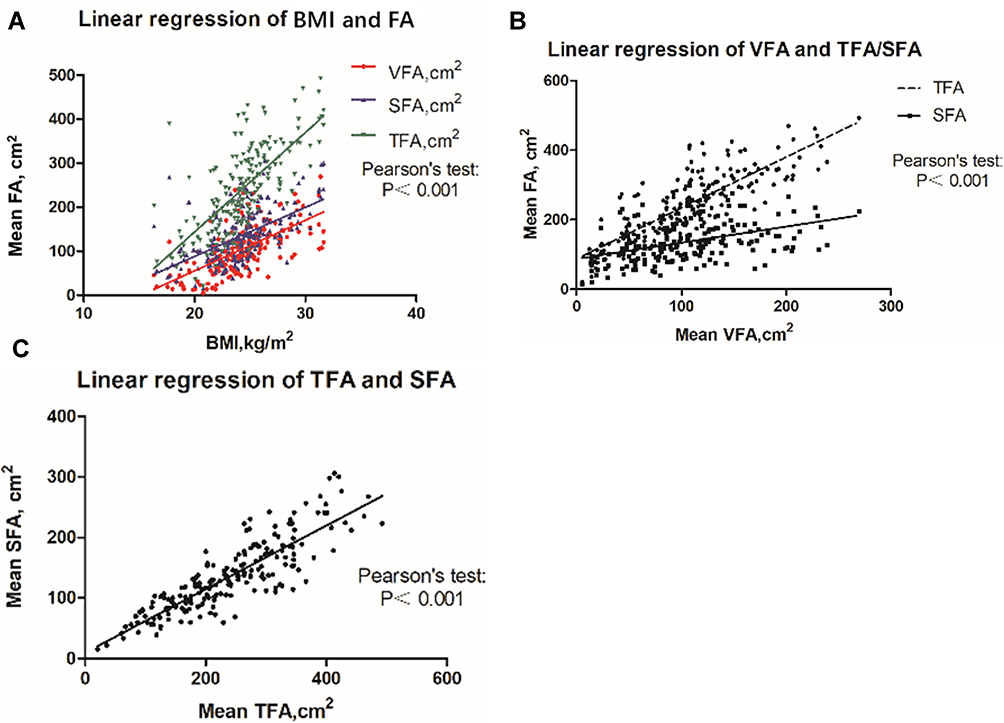 |
Figure 3 (A) Pearson’s test showed that BMI was linearly correlated with VFA (r=0.635, P<0.001), SFA (r=0.596, P<0.001), and TFA (r=0.730, P<0.001). (B) Pearson’s test showed that VFA was linearly correlated with SFA (r=0.826, P<0.001) and TFA (r=0.417, P<0.001). (C) Pearson’s test showed that TFA was linearly correlated with SFA (r=0.857, P<0.001). |
In models 1 to 4, BMI, TFA, SFA and VFA were sequentially added to the basic model containing age, sex and hypertension. TFA was the sum of VFA and SFA; if TFA, VFA, and SFA were all included in the multivariate regression analysis, TFA was considered redundant. In model 5, all the predictive indicators except TFA were included in the multivariate logistic regression analysis. Table 3 shows the results of the multivariate logistic regression analysis. BMI is the most widely used indicator of obesity or overweight. We used model 1 as the basic model. In model 1, multivariate logistic regression analysis showed that older age [1.047 (1.008~1.088) p=0.017], male sex [4.311 (1.469~12.653) p=0.008], and higher BMI [1.305 (1.088~1.566), p=0.004] were risk factors for ccRCC. In models 2 to 4, higher TFA [1.011 (1.005~1.017), p=0.001], SFA [1.013 (1.003~1.023), p=0.008] and VFA [1.026 (1.012~1.041), p<0.001] were also risk factors for ccRCC. The risk of ccRCC increased with age, BMI, TFA, SFA and VFA. In model 1, male patients were 4.311 times more likely to develop ccRCC than female patients (OR 4.311, 95% CI 1.469–12.653, P=0.008). In model 5, although BMI was linearly related to VFA and SFA, there were significant effects of sex [3.855 (1.041~14.278) p=0.043] and VFA [1.021 (1.002~1.040), p=0.034].
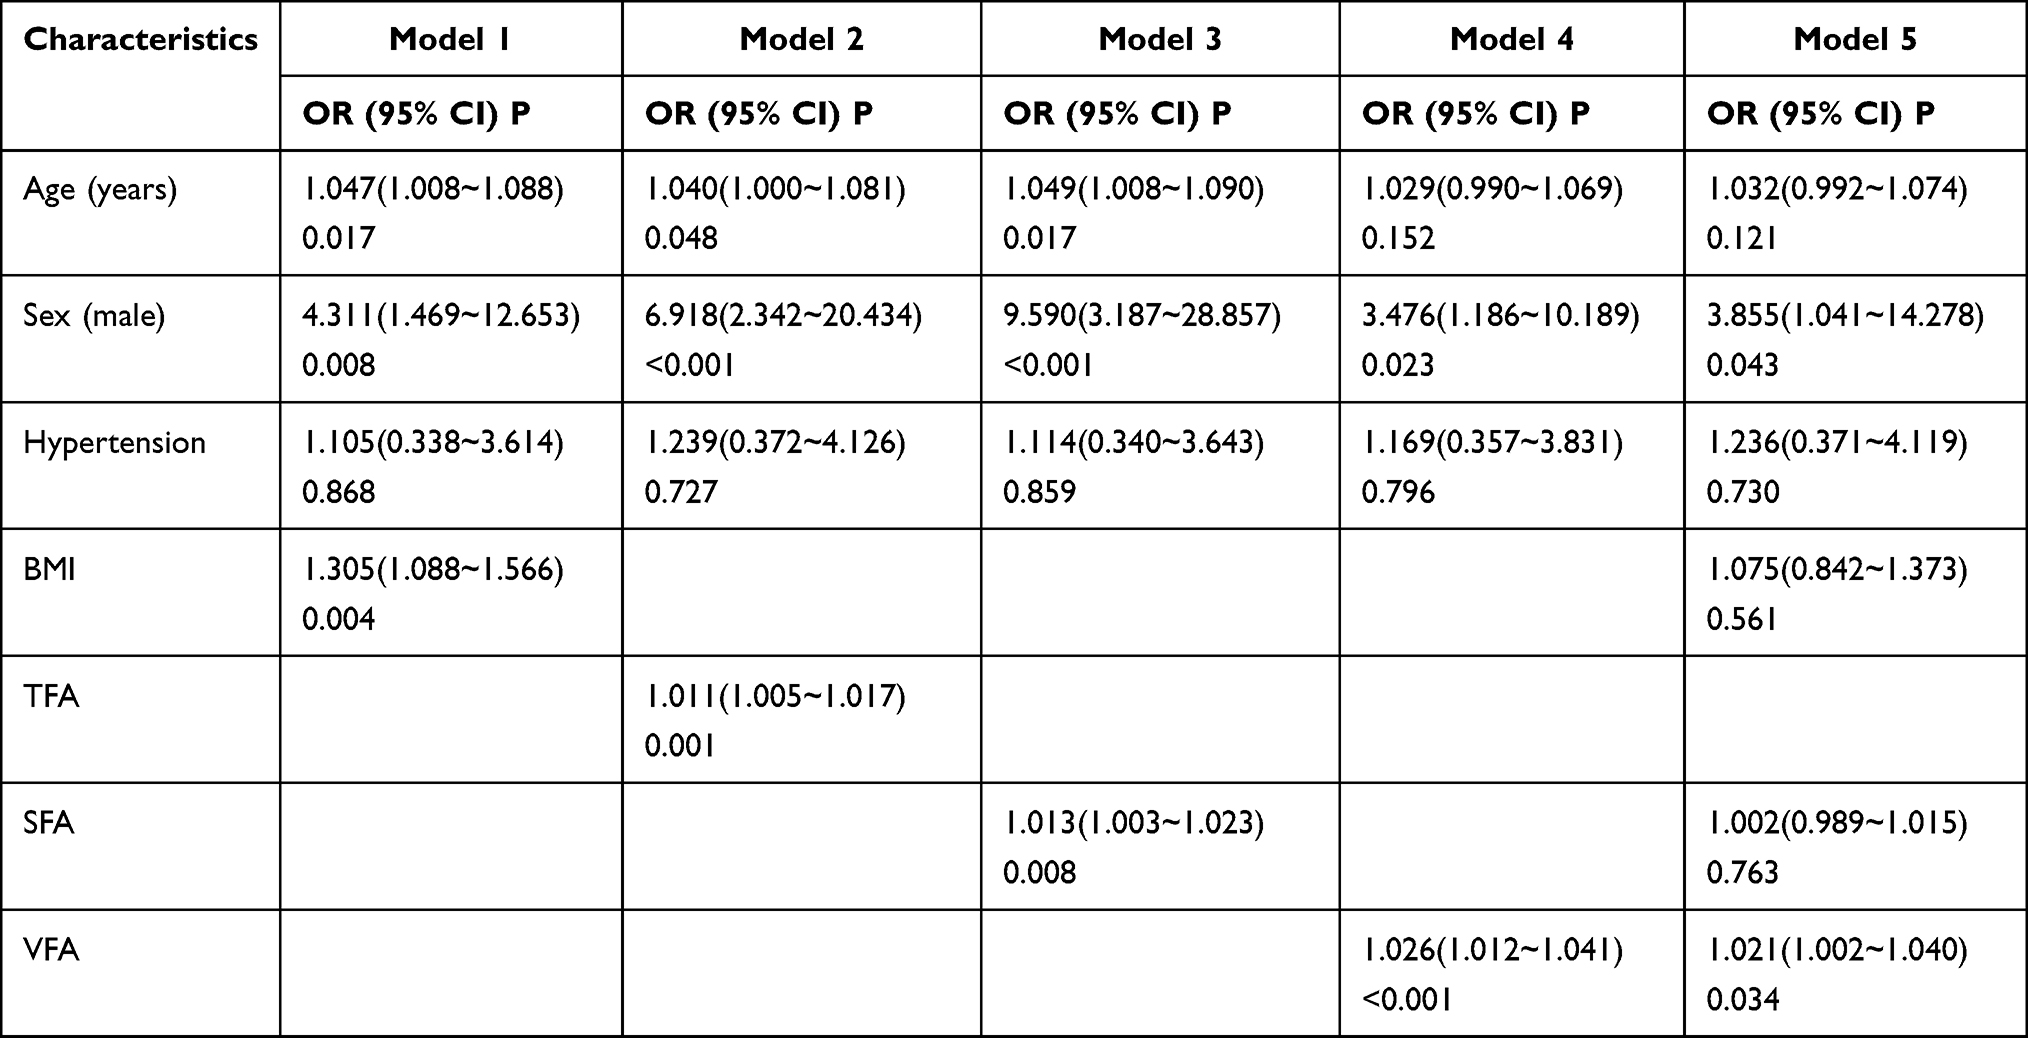 |
Table 3 Multivariate Analysis of Predictors for Distinguishing ccRCC from RMFAML |
To address the incremental value of sex (male), age, BMI, TFA, VFA and SFA in the differentiation of ccRCC from RMFAML, ROC curves were used to compare the AUCs of sex (male), age, BMI, TFA, VFA and SFA between the two groups and thereby identify the most valuable ccRCC predictors. As shown in Figure 4, the AUCs of sex (male), age, BMI, TFA, VFA and SFA were 0.726, 0.687, 0.783, 0.769, 0.840, and 0.645, respectively. DeLong’s test showed that the AUC of VFA was significantly different from that of age (P=0.0193), sex (P=0.0222), SFA (P<0.0001), and TFA (P= 0.0062); the AUCs of BMI and SFA were significantly different (P=0.0064); and the AUCs of SFA and TFA were significantly different (P=0.0001). Therefore, among the above predictor values, VFA was the best predictor to distinguish ccRCC from RMFAML. The cut-off value of VFA was 69.99 cm2; that is, when VFA ≥ 69.99 cm2, the probability of a diagnosis of ccRCC [79.52% (132/166)] was greater than that of RMFAML [20.00% (5/25)], and the sensitivity and specificity were 79.52% and 80.00%, respectively.
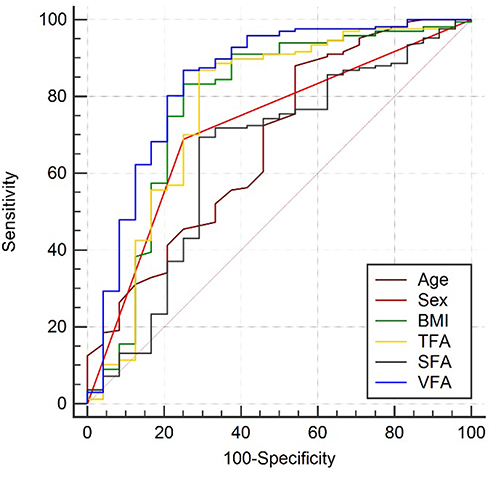 |
Figure 4 ROC curves of ccRCC vs RMFAML. The blue line represents VFA, the green line represents BMI, the Orange line represents TFA, the red line represents sex, the black line represents SFA, and the crimson line represents age. |
Discussion
This study explored the potential of VAT in identifying ccRCC and RMFAML. Sex, age, BMI, SFA, TFA, and VFA were informative for identifying these two diseases, and VFA was the best indicator for identification. Obesity is a risk factor for RCC; that is, obese patients are more likely to develop RCC. A meta-analysis by Callahan et al18 showed that compared to BMI <25 kg/m2, overweight and obesity were associated with an increased risk of ccRCC. However, AML is unrelated to obesity. Therefore, obesity-related indicators provide a method for distinguishing ccRCC from RMFAML. Our study showed that age and sex are also risk factors that distinguish the two diseases, and male patients are 4.311 times more likely to develop ccRCC than female patients. This finding is mainly related to the epidemiology of the two diseases. The ratio of men to women among RCC patients is 1.5:1, and the peak age of incidence is between 60 and 70 years.19 AML is one of the most common solid benign renal tumours.20 AML is prevalent in young and middle-aged women, most of whom are 40 to 60 years old. AML is four times more common in women than in men.
Obesity can cause abnormal expression of adipokines,21 chronic inflammation22 and insulin resistance,23 leading to the occurrence and development of RCC. Although BMI is indicative of the patient’s condition, it cannot indicate a fundamental abnormality in fat distribution. Wang et al12 reported that VFA can replace BMI as a risk factor for ccRCC; that is, patients with a high VFA have a higher incidence of ccRCC than other RCC pathological types. The function of VAT is significantly different from that of subcutaneous adipose tissue (SAT). VAT is more cellular, vascular, and innervated than SAT and contains more inflammatory cells and immune cells.24 VAT has a lower preadipocyte differentiation ability and a higher percentage of large adipocytes.25 Compared with SAT, VAT is more likely to be infiltrated by inflammatory cells and has a stronger ability to produce proinflammatory cytokines such as tumour necrosis factor-alpha (TNF-a), C-reactive protein (CRP), and interleukin-6 (IL-6).13 A persistent inflammatory state is a driving force leading to cancer.26 Increased VAT is associated with decreased adiponectin.27 Adiponectin is an important antiangiogenic factor, and low levels of adiponectin may accelerate the tumorigenesis and progression of ccRCC.28 VAT adipocytes are more insulin-resistant than SAT adipocytes.29 Insulin resistance due to increased VAT leads to increased levels of plasma insulin and insulin-like growth factors (IGFs). Insulin and IGFs may have stimulating effects on RCC cells, affecting the tumorigenesis and progression of RCC at the cellular level.30 Therefore, patients with abdominal obesity are more likely to have ccRCC.
The pathogenesis of AML is not clear but is thought to mainly involve the following aspects. 1. AML is most likely derived from perivascular epithelioid cells. 2. Increased oestrogen hormone promotes the clinical development of AML.31 3. With the increase in the expression of the antiapoptotic protein Bcl-2, the apoptosis induced by endoplasmic reticulum stress was inhibited, thus promoting the development of AML.32 4. In analyses of pathogenesis, no genetic factors that may affect fat accumulation have been found. We found that the body shape of RMFAML patients was normal, and the BMI of the patients was 21.79±3.44 kg/m2. In our study, multivariate analysis and ROC curve analysis showed that VFA was the best indicator for distinguishing RMFAML from ccRCC.
The present study has some limitations. This study is a retrospective study of patients from a single centre and may suffer from selection bias. The number of patients included in the study was small, especially the number of RMFAML patients, which was only 25. The results of this study would be more convincing if more RMFAML patients had been included, but unfortunately, RMFAML patients are very rare.
Conclusions
This study illustrated the potential of VAT in distinguishing ccRCC from RMFAML. Male sex; older age; and higher BMI, TFA, SFA and VFA were risk factors for ccRCC. The results of multivariate regression analysis and ROC curve analysis showed that VFA was the most effective indicator for distinguishing the two diseases. Increased VAT is strongly associated with ccRCC and is useful for distinguishing ccRCC from RMFAML.
Abbreviations
AUC, area under the curve; BMI, body mass index; ccRCC, clear cell renal cell carcinoma; CT, computed tomography; AML, renal angiomyolipoma; RMFAML, renal angiomyolipoma with minimal fat; RCC, renal cell carcinoma; SAT, subcutaneous adipose tissue; SFA, subcutaneous fat area; ROC, receiver operating characteristic; TFA, total fat area; VAT, visceral adipose tissue; VFA, visceral fat area.
Ethics Statement
The protocol for this research project was approved by a suitably constituted ethics committee of the institution, the Committee of the First Affiliated Hospital of Soochow University (Approval No. 2015138), and the project conformed to the provisions of the Declaration of Helsinki. Informed consent was obtained from all of the subjects. Animal studies: N/A.
Funding
This study received funding from the Suzhou Science and Technology Plan Project (SS201863), and the Key Research and Development Program of Jiangsu Province (Social Development, BE2020654).
Disclosure
The authors report no conflicts of interest in this work.
References
1. Fujii Y, Ajima J, Oka K, Tosaka A, Takehara Y. Benign renal tumors detected among healthy adults by abdominal ultrasonography. Eur Urol. 1995;27:124–127. doi:10.1159/000475142
2. Bray F, Ferlay J, Soerjomataram I, Siegel RL, Torre LA, Jemal A. Global cancer statistics 2018: GLOBOCAN estimates of incidence and mortality worldwide for 36 cancers in 185 countries. CA Cancer J Clin. 2018;68:394–424. doi:10.3322/caac.21492
3. Gandaglia G, Ravi P, Abdollah F, et al. Contemporary incidence and mortality rates of kidney cancer in the United States. Can Urol Assoc J. 2014;8:247–252. doi:10.5489/cuaj.1760
4. Song S, Park BK, Park JJ. New radiologic classification of renal angiomyolipomas. Eur J Radiol. 2016;85(10):1835–1842. doi:10.1016/j.ejrad.2016.08.012
5. Kim JK, Park SY, Shon JH, Cho KS. Angiomyolipoma with minimal fat: differentiation from renal cell carcinoma at biphasic helical CT. Radiology. 2004;230:677–684. doi:10.1148/radiol.2303030003
6. Jinzaki M, Tanimoto A, Narimatsu Y, et al. Angiomyolipoma: imaging findings in lesions with minimal fat. Radiology. 1997;205:497–502. doi:10.1148/radiology.205.2.9356635
7. Simpfendorfer C, Herts BR, Motta-Ramirez GA, et al. Angiomyolipoma with minimal fat on MDCT: can counts of negative-attenuation pixels aid diagnosis? AJR Am J Roentgenol. 2009;192:438–443. doi:10.2214/AJR.08.1180
8. Simpson E, Patel U. Diagnosis of angiomyolipoma using computed tomography-region of interest < or =−10 HU or 4 adjacent pixels < or =−10 HU are recommended as the diagnostic thresholds. Clin Radiol. 2006;61:410–416. doi:10.1016/j.crad.2005.12.013
9. Chaudhry HS, Davenport MS, Nieman CM, Ho LM, Neville AM. Histogram analysis of small solid renal masses: differentiating minimal fat angiomyolipoma from renal cell carcinoma. AJR Am J Roentgenol. 2012;198:377–383. doi:10.2214/AJR.11.6887
10. Zhang Y, Li X, Lv Y, Gu X. Review of value of CT texture analysis and machine learning in differentiating fat-poor renal angiomyolipoma from renal cell carcinoma. Tomography. 2020;6(4):325–332. doi:10.18383/j.tom.2020.00039
11. Jhaveri KS, Elmi A, Hosseini-Nik H, et al. Predictive value of chemical-shift MRI in distinguishing clear cell renal cell carcinoma from non-clear cell renal cell carcinoma and minimal-fat angiomyolipoma. AJR Am J Roentgenol. 2015;205(1):W79–W86. doi:10.2214/AJR.14.13245
12. Wang HK, Song XS, Cheng Y, et al. Visceral fat accumulation is associated with different pathological subtypes of renal cell carcinoma (RCC): a multicentre study in China. BJU Int. 2014;114:496–502. doi:10.1111/bju.12592
13. Lemieux I, Pascot A, Prud’homme D, et al. Elevated C-reactive protein: another component of the atherothrombotic profile of abdominal obesity. Arterioscler Thromb Vasc Biol. 2001;21:961–967. doi:10.1161/01.ATV.21.6.961
14. Scheid MP, Sweeney G. The role of adiponectin signaling in metabolic syndrome and cancer. Rev Endocr Metab Disord. 2014;15:157–167. doi:10.1007/s11154-013-9265-5
15. Mantzoros CS, Moschos S, Avramopoulos I, et al. Leptin concentrations in relation to body mass index and the tumor necrosis factor-alpha system in humans. J Clin Endocrinol Metab. 1997;82:3408–3413. doi:10.1210/jcem.82.10.4323
16. Misra A, Vikram NK. Clinical and pathophysiological consequences of abdominal adiposity and abdominal adipose tissue depots. Nutrition. 2003;19:457–466. doi:10.1016/S0899-9007(02)01003-1
17. Pischon T, Lahmann PH, Boeing H, et al. Body size and risk of renal cell carcinoma in the European prospective investigation into cancer and nutrition (EPIC). Int J Cancer. 2006;118:728–738. doi:10.1002/ijc.21398
18. Callahan CL, Hofmann JN, Corley DA, et al. Obesity and renal cell carcinoma risk by histologic subtype: a nested case-control study and meta-analysis. Cancer Epidemiol. 2018;56:31–37. doi:10.1016/j.canep.2018.07.002
19. Ljungberg B, Bensalah K, Canfield S, et al. EAU guidelines on renal cell carcinoma: 2014 update. Eur Urol. 2015;67:913–924. doi:10.1016/j.eururo.2015.01.005
20. Bhatt JR, Richard PO, Kim NS, et al. Natural history of renal angiomyolipoma (AML): most patients with large AMLs >4cm can be offered active surveillance as an initial management strategy. Eur Urol. 2016;70:85–90. doi:10.1016/j.eururo.2016.01.048
21. Ouchi N, Parker JL, Lugus JJ, Walsh K. Adipokines in inflammation and metabolic disease. Nat Rev Immunol. 2011;11:85–97. doi:10.1038/nri2921
22. Harvey AE, Lashinger LM, Hursting SD. The growing challenge of obesity and cancer: an inflammatory issue. Ann N Y Acad Sci. 2011;1229:45–52. doi:10.1111/j.1749-6632.2011.06096.x
23. Doyle SL, Donohoe CL, Lysaght J, Reynolds JV. Visceral obesity, metabolic syndrome, insulin resistance and cancer. Proc Nutr Soc. 2012;71:181–189. doi:10.1017/S002966511100320X
24. Li M, Wu H, Wang T, et al. Co-methylated genes in different adipose depots of pig are associated with metabolic, inflammatory and immune processes. Int J Biol Sci. 2012;8:831–837. doi:10.7150/ijbs.4493
25. Pfeiffer S, Krüger J, Maierhofer A, et al. Hypoxia-inducible factor 3A gene expression and methylation in adipose tissue is related to adipose tissue dysfunction. Sci Rep. 2016;6:27969. doi:10.1038/srep27969
26. Kundu JK, Surh YJ. Inflammation: gearing the journey to cancer. Mutat Res. 2008;659:15–30. doi:10.1016/j.mrrev.2008.03.002
27. Ibrahim MM. Subcutaneous and visceral adipose tissue: structural and functional differences. Obes Rev. 2010;11:11–18. doi:10.1111/j.1467-789X.2009.00623.x
28. Bråkenhielm E, Veitonmäki N, Cao R, et al. Adiponectin-induced antiangiogenesis and antitumor activity involve caspase-mediated endothelial cell apoptosis. Proc Natl Acad Sci U S A. 2004;101:2476–2481. doi:10.1073/pnas.0308671100
29. Frayn KN. Visceral fat and insulin resistance–causative or correlative? Br J Nutr. 2000;83:S71–7. doi:10.1017/S0007114500000982
30. Solarek W, Koper M, Lewicki S, Szczylik C, Czarnecka AM. Insulin and insulin-like growth factors act as renal cell cancer intratumoral regulators. J Cell Commun Signal. 2019;13:381–394. doi:10.1007/s12079-019-00512-y
31. Bissler JJ, Kingswood JC. Renal angiomyolipomata. Kidney Int. 2004;66:924–934. doi:10.1111/j.1523-1755.2004.00838.x
32. Novotna B, Takacova M, Hudecova S, et al. Activation of the ER stress and calcium signaling in angiomyolipoma. Neoplasma. 2016;63:687–695. doi:10.4149/neo_2016_505
 © 2021 The Author(s). This work is published and licensed by Dove Medical Press Limited. The full terms of this license are available at https://www.dovepress.com/terms.php and incorporate the Creative Commons Attribution - Non Commercial (unported, v3.0) License.
By accessing the work you hereby accept the Terms. Non-commercial uses of the work are permitted without any further permission from Dove Medical Press Limited, provided the work is properly attributed. For permission for commercial use of this work, please see paragraphs 4.2 and 5 of our Terms.
© 2021 The Author(s). This work is published and licensed by Dove Medical Press Limited. The full terms of this license are available at https://www.dovepress.com/terms.php and incorporate the Creative Commons Attribution - Non Commercial (unported, v3.0) License.
By accessing the work you hereby accept the Terms. Non-commercial uses of the work are permitted without any further permission from Dove Medical Press Limited, provided the work is properly attributed. For permission for commercial use of this work, please see paragraphs 4.2 and 5 of our Terms.