")
Back to Journals » International Journal of General Medicine » Volume 14
The POCUS Consult: How Point of Care Ultrasound Helps Guide Medical Decision Making
Authors Rice JA, Brewer J, Speaks T, Choi C, Lahsaei P, Romito BT
Received 20 September 2021
Accepted for publication 1 December 2021
Published 15 December 2021 Volume 2021:14 Pages 9789—9806
DOI https://doi.org/10.2147/IJGM.S339476
Checked for plagiarism Yes
Review by Single anonymous peer review
Peer reviewer comments 3
Editor who approved publication: Dr Scott Fraser
Jake A Rice,1,2 Jonathan Brewer,2 Tyler Speaks,1 Christopher Choi,1 Peiman Lahsaei,1 Bryan T Romito1
1Department of Anesthesiology and Pain Management, The University of Texas Southwestern Medical Center, Dallas, TX, USA; 2Department of Emergency Medicine, The University of Texas Southwestern Medical Center, Dallas, TX, USA
Correspondence: Bryan T Romito
Department of Anesthesiology and Pain Management, The University of Texas Southwestern Medical Center, 5323 Harry Hines Boulevard, Dallas, TX, 75390-9068, USA
Tel +1 214 648 7674
Fax +1 214 648 5461
Email [email protected]
Abstract: Point of care ultrasound (POCUS) allows for rapid, real-time evaluation of cardiovascular and respiratory pathology. The advent of portable, handheld devices and increased recognition by accrediting bodies of the importance of POCUS in guiding clinical decision making has expanded its use across the hospital setting and within medical training programs. POCUS allows clinicians to begin immediate investigation into their differential diagnoses without waiting for a formal imaging study, enhancing the speed of clinical interpretation. In addition to its diagnostic utility, POCUS can also inform clinicians of patients’ response to interventions when serial exams are obtained. This review examines the role of POCUS in the context of frequently encountered patients and highlights the key clinical questions that can be readily answered by POCUS.
Keywords: hemodynamics, trauma, respiratory failure, hypotension
Introduction
Interest in point of care ultrasound (POCUS) has steadily grown over the past few decades.1 This technique offers rapid diagnostic assistance and serves as a tool for the performance of many bedside procedures. POCUS provides immediate availability and real-time images that can guide medical decision making.2 Widespread implementation across the inpatient setting has become more common with the increased availability of handheld devices.3 These smaller devices not only make incorporation of POCUS into daily rounds possible, but they are also especially useful in situations where physical space is limited, such as during resuscitation efforts or during cardiac arrest scenarios.3 The POCUS skills applied to hospitalized patients are borderless and applicable to practitioners of many specialties. Noting the value of proficiency in POCUS, the American College of Emergency Physicians recommends the completion of 150–300 POCUS exams during Emergency Medicine residency.4 Similarly, the National Board of Echocardiography has recently developed a certification pathway for Critical Care Echocardiography,5 further highlighting the expanding role of POCUS in critical care. Given its growth, international societies have published best practice recommendations and position statements to ensure adequate training, education, and quality control for the use of ultrasound in the clinical setting.6
In the practice of medicine, it is common to develop a clinical question that requires further expertise to correctly answer. This question may pertain to the workup, diagnosis, or treatment of a patient and may involve consultants from all areas of medicine. In this way, the provider and consultant are bound by a clinical question for which they both seek an answer. Although POCUS cannot function independently at this time, like an expert consultant, it can be used to answer a clinical question. This review will examine the application of POCUS for frequently encountered patients and highlight the common questions that are often answered by POCUS. Of note, this review assumes a basic understanding of image acquisition and image interpretation. These skills will not be expanded upon and are beyond the scope of this review.
Materials and Methods
Relevant English language references in POCUS published between 1990 and 2021 deemed eligible based on abstract review were evaluated by the authors as full-length articles for this review. Included references consist of randomized controlled trials, non-randomized trials, prospective trials, retrospective trials, expert opinions, commentaries, position statements, society guidelines, structured and unstructured reviews, videos, images, and case reports. Only published references and those written in English were included in this review. All literature searches were performed using the PubMed database (pubmed.ncbi.nlm.nih.gov).
The Patient with Cardiac Dysfunction
Clinical Questions
(1) Does the patient have a pericardial effusion?
(2) If so, is tamponade present?
(3) Does the patient have left ventricular (LV) dysfunction?
(4) Does the patient have right ventricular (RV) dysfunction?
Cardiac dysfunction is a common finding among hospitalized patients.7 Focused Cardiac Ultrasound (FoCUS), is a limited, point of care assessment that provides rapid and real-time images that can be repeated at the bedside.8 Notably, FoCUS differs from a formal comprehensive transthoracic echocardiography (TTE) evaluation, which should be undertaken when focused findings and clinical presentations are discordant.9 Most societies recommend four sonographic windows to perform as part of a FoCUS examination, as demonstrated in Figure 1: subxiphoid view, parasternal long axis (PLAX) view, parasternal short axis (PSAX) view, and apical 4-chamber view.10
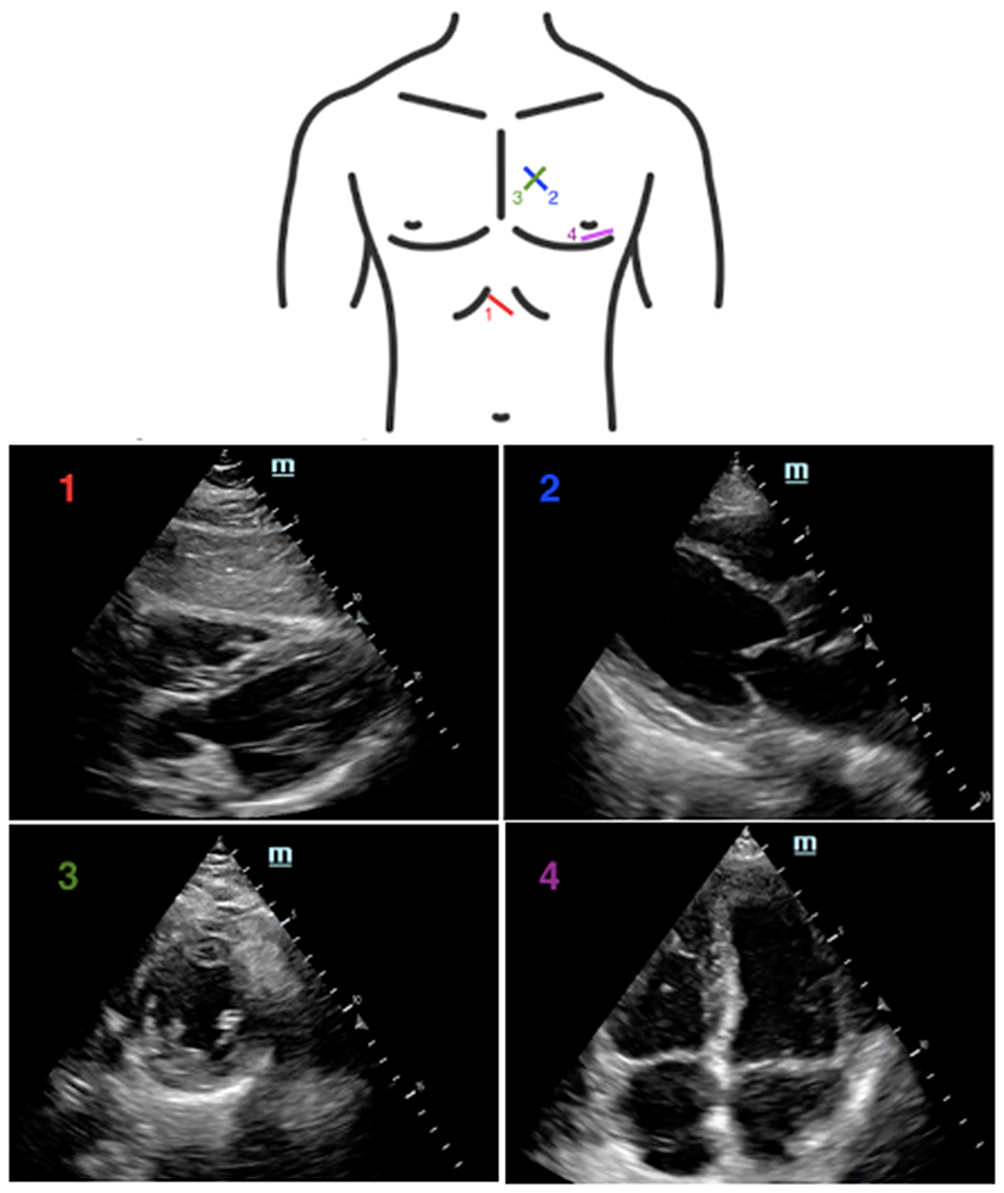 |
Figure 1 Location on the chest where the (1) subxiphoid, (2) parasternal long axis, (3) parasternal short axis, and (4) apical 4-chamber views are obtained, with corresponding sonographic images. |
The subxiphoid view is commonly used for visualization of the pericardium during the Focused Assessment in Trauma (FAST) exam in order to rule out a pericardial effusion and tamponade due to hemorrhage.11 Pericardial tamponade is a life-threatening condition that occurs when fluid accumulates within the pericardial sac and impairs filling of the right-sided chambers of the heart.12 This can rapidly lead to hemodynamic collapse due to decreased cardiac output. Early identification of pericardial fluid is of utmost importance, and POCUS can help confirm if there is a clinical suspicion for the development of tamponade physiology.12 When evaluating for tamponade, diastolic collapse of the RV carries a high specificity (75–90%). Systolic right atrial collapse has a sensitivity that ranges from 50% in early tamponade to 100% in late tamponade.13 The finding of a plethoric IVC with minimal respiratory variation carries a sensitivity ranging from 75% to 90% with a specificity of approximately 40%.14
The PLAX view allows for assessment of stroke volume by either visual estimation or quantitative approaches.15 This window also allows for visualization of the right and left ventricles, interventricular septum, left ventricular outflow tract (LVOT), left atrium, and pericardium. Visual estimation of LV function requires review of the wall motion of the endocardium during systole, as well as review of the anterior leaflet of the mitral valve.16 Under normal conditions, the anterior leaflet almost touches the interventricular septum upon opening. In the setting of reduced ejection fraction, the resultant decreased stroke volume will lead to decreased flow through the mitral valve and subsequent reduced movement of the anterior leaflet. The increased distance between the septum and anterior leaflet suggests a “reduced ejection fraction” that can be quantified as mild, moderate, or severe based on the distance between the septum and anterior leaflet.17 There are limitations to visual estimation and certain conditions which may impair diagnostic accuracy, including irregular rhythms, large or small left ventricular size, or with extremes of heart rate.18 Given these limitations, numerous quantitative approaches have been developed to provide for more accurate estimations of ejection fraction.16 The accuracy of many of these approaches will be diminished if regional wall motion abnormalities are present.19
The PSAX view is a dynamic view which allows for assessment of multiple cardiac structures. Starting at the cranial aspect of the PSAX axis, it is possible to visualize the aortic valve, right atrium, right ventricular outflow tract (RVOT), left atrium, and pulmonary artery. The pulmonary artery pressure can be calculated in this window allowing for evaluation of the presence of pulmonary hypertension by calculating the RVOT acceleration time.20 Moving toward the apex, the mitral valve comes into view and may be recognized by its “fish mouth” appearance, owing to its bicuspid nature. Analysis of the LV is not recommended at this level because the basal segments are not representative of the overall LV function.21 Further toward the apex, the left and right ventricle move into prominence. Increased pressure in the RV may flatten the interventricular septum, which can result in a D-shaped RV at this level.22 Finally, in the mid-papillary view, one can evaluate for wall motion abnormalities of the LV. The affected vascular territory can be elucidated based on the region affected.23
The apical 4-chamber view allows for the evaluation of multiple structures. The RV can be assessed for dilation, which is of particular use if there is a suspicion of acute pulmonary embolism (PE).23 Relative RV dilation, with an RV-to-LV end-diastolic diameter ratio ≥0.9, is suggestive of acute PE in the appropriate clinical setting.24 McConnell’s sign is characterized by normal RV apical contractility with akinesis of the RV free wall and offers a sensitivity of 77% and a specificity of 94% for PE.25 The tricuspid annular plane systolic excursion (TAPSE) reflects the longitudinal shortening of the RV and provides a method to assess the global RV function.26 The TAPSE is obtained in the apical 4-chamber view by placing an M-mode cursor on the lateral aspect of the tricuspid annulus. The operator then measures the peak distance travelled by this reference point during systole, with a normal value corresponding to ≥1.7 cm.27 TAPSE has shown utility in assessment of RV infarction and acute PE, and as a predictor of long-term mortality in patients with precapillary pulmonary hypertension.28–30
For a patient in cardiac arrest, POCUS may be used to help search for rapidly reversible causes, such as pneumothorax and cardiac tamponade. Patients found to have a pericardial effusion have significantly higher chances of survival given the potentially reversible cause of their arrest.31 While PE is often included in the differential diagnosis of the patient in cardiac arrest, it is important to exercise caution in the interpretation of RV dilation during cardiac arrest as all causes of arrest are likely to result in some degree of RV dilation.32,33
POCUS may also be used to evaluate for evidence of cardiac activity during a “code blue” scenario. Signs of cardiac activity during cardiac arrest are associated with increased survival compared to patients with no sonographic signs of cardiac activity.34 It is important not to prolong pulse checks to search for cardiac activity. Placing the probe on the patient’s chest prior to the pulse check may reduce the time of the pulse check.35 Additionally, designating personnel other than the code leader to perform the ultrasound exam may result in shorter pulse checks.36 If the patient achieves return of spontaneous circulation (ROSC), FoCUS may help direct further management. A regional wall motion abnormality may suggest the need for coronary angiography. A patient with a persistently dilated RV after ROSC may be more likely to be worked up or treated empirically for a massive PE.37
The Patient with Unclear Intravascular Volume Status
Clinical Questions
(1) Can POCUS predict a patient’s volume status?
(2) Can POCUS identify a potentially fluid responsive patient?
In response to a fluid challenge, a patient’s stroke volume will generally change based on their position on the Frank-Starling curve.38 Patients located on the ascending portion of the curve are likely to be responsive to fluid administration (showing at least a 10% increase in their stroke volume).39 Patients positioned on a flat portion of the curve may not demonstrate an increase in their stroke volume and may experience the negative effects of excess volume administration.38,40,41 While hypovolemia can lead to a reduction in circulating blood volume, arterial hypotension, and impaired end-organ perfusion, excessive fluid administration has negative effects on gas exchange, wound healing, and kidney function.42,43 The use of an accurate, noninvasive, point of care modality to guide fluid therapy has the potential to improve clinical outcomes and minimize complications associated with hypovolemia and hypervolemia.
Although there is a lack of high-quality evidence to support this practice, determination of volume status using POCUS often begins with a qualitative assessment.10 Ventricular size may offer a rough guide for intravascular fluid assessment in extreme cases.44,45 For example, visualization of a small and hyperkinetic LV cavity that obliterates at end-systole has been shown to correlate with hypovolemia.46 Additionally, the presence of a small (mean diameter 2.83 ± 0.37 cm measured in the PLAX view with brightness mode), collapsible RV may be a sign of hypovolemia.47 Conversely, patients with a dilated LV or RV are less likely to be responsive to fluids.45 These findings should be interpreted with caution as there are many factors that impact ventricular size and filling, including native chamber compliance, valvular abnormalities, portal hypertension, and obstructive lung disease.44,47
Cardiac ultrasound techniques can be used to estimate stroke volume and volume responsiveness. Specifically, stroke volume can be calculated as the product of the LVOT cross-sectional area (CSA) and the LVOT velocity-time integral (VTI) [Stroke volume = LVOT CSA x LVOT VTI].48 LVOT CSA can be calculated with the LVOT diameter (LVOTd) using the formula (LVOTd)2 x 0.785 [LVOT CSA = (LVOTd)2 x 0.785].49 In the PLAX view, the LVOTd can be measured during mid-systole between the inner edges of the LVOT.49 The LVOT VTI can be calculated from an anteriorly angled apical 4-chamber view.48,49 At this location, the pulsed-wave Doppler sampling volume box should be placed at the same site where the LVOT was measured and the VTI subsequently traced.50 Given that LVOTd (and thus LVOT CSA) should remain constant for a given patient, changes in LVOT VTI can be used as a surrogate for changes in stroke volume.51
Once quantified, variations in LVOT VTI can be used to assess fluid responsiveness.44,49 Specifically, Muller et al found that a 10% increase in LVOT VTI following rapid administration of 100 mL of colloid accurately predicted fluid responsiveness in a study of 39 patients with acute circulatory failure being mechanically ventilated with low tidal volumes.52 Similarly, Wang et al evaluated the effect of LVOT VTI variation on fluid responsiveness in 44 patients with septic shock receiving deep sedation and mechanical ventilation with tidal volumes between 8 and 10 mL/kg.53 In this study, LVOT VTI variation accurately predicted fluid responsiveness (increase in stroke volume of 15.9%) after volume administration with an area under the curve of 0.956, sensitivity of 87.5%, and specificity of 95%.
Changes in peak aortic velocity and aortic VTI can be used to assess fluid responsiveness by applying the same principles for stroke volume calculation used at the level of the LVOT.50 Maizel et al found that echocardiogram-based stroke volume measurement during a passive leg raise maneuver was predictive of volume responsiveness in a study of 34 critically ill spontaneously breathing patients.54 In this study, aortic blood flow was recorded (and aortic VTI subsequently calculated) using the pulsed-wave Doppler technique with the sampling volume box placed at the level of the aortic annulus while obtaining an anteriorly angled apical 4-chamber view of the heart. Similarly, Lamia et al measured the change in aortic VTI-derived stroke volume following passive leg raise and crystalloid administration in 24 spontaneously breathing critically ill patients.55 In this study, a passive leg raise-induced increase in aortic VTI ≥ 12.5% predicted an increase in stroke volume index of ≥15% after volume administration with 77% sensitivity and 100% specificity. Overall, fluid responsiveness can be accurately predicted in patients undergoing either spontaneous ventilation or mechanical ventilation by measuring stroke volume changes with a passive leg raise maneuver.10,56
The use of these techniques requires precise measurements to avoid errors in calculation and subsequent management.44,56 Computer-derived models for stroke volume calculation may offer an alternative when accurate measurements cannot be obtained,57 but more studies are needed to evaluate this practice. There are limitations associated with the use of these approaches. For example, LVOT VTI is not reliable in the presence of arrhythmias, subaortic obstruction, or at least moderate aortic insufficiency.49 Additionally, not all patients who are “volume responders” benefit from additional fluid administration. All findings should be taken in a clinical context.44 Finally, there is no consensus whether the ultrasound skills required for accurate volume status/responsiveness determination (eg, use of precise measurements, Doppler analysis) exceed the scope of a FoCUS assessment and should be reserved for a formal TTE evaluation.10,44,49,58 Ensuring continuing education and maintenance of certification will minimize technical errors and improve diagnostic accuracy.10
Another common technique for predicting fluid responsiveness is the assessment of the inferior vena cava (IVC) using ultrasound.59 Variation in transpulmonary pressure during respiration is transmitted to the right heart, which impacts venous return and IVC diameter.60 In spontaneous ventilation, negative transpulmonary pressure at the beginning of inspiration increases venous return from the vena cavae, resulting in IVC collapse as a function of its compliance.60 Patients with a reduced right-heart pressure and high IVC compliance (eg, from hypovolemia) will demonstrate significant collapse of their IVC during inspiration. Conversely, patients with elevated right-heart pressure will not have significant collapse of their IVC during inspiration.60 The opposite response occurs during controlled, positive-pressure ventilation (PPV), where the IVC distends during inspiration.61,62 The change in IVC diameter during PPV is directly proportional to its compliance. Patients undergoing PPV demonstrating significant IVC distention during inspiration may be positioned on the fluid responsive, ascending portion of the Frank-Starling curve. Using ultrasound-guided visualization, the IVC diameter can be directly measured and the degree of collapsibility or distensibility indexed.59 This can be performed in the subxiphoid view using M-mode with the IVC diameter measured 0.5–3 cm from the inferior cavoatrial junction.56
There have been several studies examining the relationship between volume responsiveness and indices of IVC collapsibility, distensibility, or variability in both spontaneously breathing63–72 and mechanically-ventilated73–81 patients. Because of the presence of multiple negative studies,69,71,79–81 the relationship between ultrasound-measured variation in IVC diameter and the prediction of fluid responsiveness remains unclear.10,82–84 Orso et al performed a systematic review and meta-analysis to assess the accuracy of ultrasonographic IVC measurements to determine fluid responsiveness.59 Twenty-seven studies were included in their review, 22 measuring a collapsibility index, one measuring IVC diameter, and four evaluating both indices. Overall, they found considerable heterogeneity among the included studies and concluded that ultrasound evaluation of IVC diameter and its variation with respiration does not seem to reliably predict fluid responsiveness.
Long et al performed a systematic review and meta-analysis examining respiratory variation in IVC diameter as a predictor of fluid responsiveness in patients with acute circulatory failure.85 The review included 17 studies involving 533 patients. Similar to other studies, ultrasonographic assessment of the IVC had a limited ability to predict fluid responsiveness with a pooled sensitivity of 63% and a pooled specificity of 73%. Overall, the results of these systematic reviews indicate that providers should exercise caution when using changes in IVC size to predict fluid responsiveness. The presence of limitations and confounding factors may contribute to the inconsistency in data attempting to describe this relationship. For example, the work of breathing with spontaneous ventilation impacts IVC size, and the regular motion of the IVC during respiration may incorrectly mirror changes in IVC diameter as it moves out of the ultrasound beam plane.50 The presence of elevated intra-abdominal pressure, diminished lung compliance, or right-heart dysfunction confounds normal IVC diameter measurements.56,82 Additionally, there is often a high degree of inter-operator variability when performing POCUS, which may affect accuracy.86
The severity of venous congestion visualized on ultrasound may provide further insight into patients’ volume status. Congestion-mediated hypervolemia will produce a rapid increase in venous pressures once the limits of capacitance have been exceeded, and several markers of this venous hypertension can be identified on ultrasound.87 Originally designed to predict the occurrence of postoperative acute kidney injury in a post-hoc analysis of a single-center prospective study of 145 patients undergoing cardiac surgery, the Venous Excess Ultrasound (VExUS) grading system incorporates hepatic vein Doppler, portal vein Doppler, intra-renal venous Doppler, and IVC ultrasound.87 In this study, the presence of two severe ultrasound abnormalities with an IVC diameter of ≥2 cm at intensive care unit (ICU) admission indicated a high risk of postoperative acute kidney injury. In a single-center observational study of 30 patients admitted to an ICU with cardiorenal syndrome, a VExUS score incorporating IVC respiratory variation, hepatic vein Doppler, and portal vein Doppler reliably demonstrated venous congestion and might be used to assist in the decision to remove fluids.88 While the results of these early studies87,88 provide evidence that venous congestion scores can aid in volume status assessment, larger prospective investigations are needed before this practice gains widespread adoption. Furthermore, the VExUS grading scores described above require advanced training in ultrasonography including Doppler analysis and may be beyond the scope of a limited POCUS evaluation.87,89
The Patient with Hemodynamic Instability
Clinical Questions
(1) Does the patient have cardiac tamponade?
(2) Does the patient have reduced LV ejection fraction?
(3) Does the patient have RV dysfunction?
(4) Does the patient have signs of hypovolemia?
(5) Does the patient have free fluid in the abdomen?
(6) Does the patient have aortic pathology?
(7) Does the patient have a pneumothorax or hemothorax?
Bedside ultrasound in the setting of trauma has been well established.90 The FAST exam was developed to answer three questions:91 Is there a pericardial effusion? Is there free intraperitoneal fluid? Is there a hemothorax? As noted in Figure 2, the exam requires the provider to obtain images via the subxiphoid, right upper quadrant (RUQ), left upper quadrant (LUQ), pelvic, and bilateral anterior lung windows. The value of FAST examination has been shown in both blunt and penetrating trauma.92,93 While a positive FAST is a strong indicator of exploratory laparotomy in patients with penetrating torso trauma,92 it is possible that patients with a negative FAST will require laparotomy for control of bleeding (ie, false negative).94 The extended focused abdominal scan for trauma (E-FAST) adds lung ultrasound to the examination. This has been shown to have moderate sensitivity for the detection of pneumothorax.95
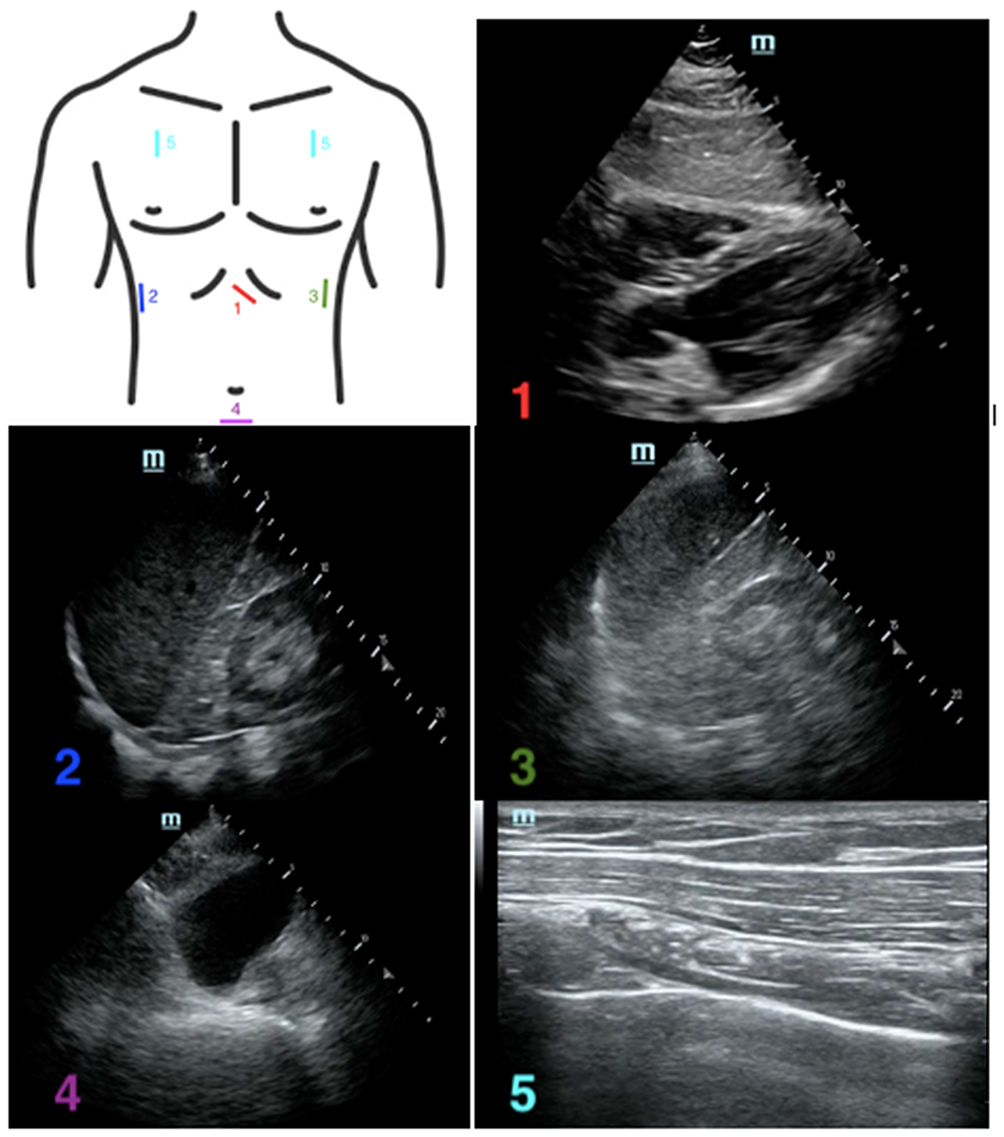 |
Figure 2 Location on the chest where the (1) subxiphoid, (2) right upper quadrant, (3) left upper quadrant, (4) pelvic, and (5) apical lung views are obtained, with corresponding sonographic images. |
Bedside ultrasound may be employed in parallel with resuscitative measures. If the patient has undifferentiated hypotension, the Rapid Ultrasound in Shock (RUSH) exam may be of particular utility.96 The RUSH exam is an emergency ultrasound protocol, which helps clinically differentiate various etiologies of shock in a short period of time. The exam includes evaluation of the heart, IVC, thoracic cavity, abdominal cavity, and large vessels.97,98 The order of the exam may be remembered with the HIMAP acronym (Heart, IVC, Morrison’s pouch, Aorta, Pneumothorax). Evaluation of the heart consists of a FoCUS examination evaluating for tamponade, gross LV ejection fraction, and RV function.99 Evaluation of the IVC is used to help assess volume status. Visualization of the thoracic and abdominal cavities should include evaluation of signs of pulmonary edema, pneumothorax, and free fluid. Evaluation of the vessels is focused on signs of a ruptured abdominal aortic aneurysm, aortic dissection, or deep venous thrombosis (DVT).99,100
The RUSH exam incorporates components of other common POCUS exams, such as FoCUS and the FAST exam.101 To evaluate the heart, the standard FoCUS views are performed, including the subxiphoid, PLAX, PSAX, and apical 4-chamber views. The IVC is then examined, and an E-FAST exam is completed. The subxiphoid view has already been obtained with FoCUS, so completion of this exam involves obtaining the RUQ, LUQ, pelvic, and bilateral lung views.101 The upper quadrant views allow for the evaluation of both the abdominal and the thoracic cavities. To conclude the exam, attention is now brought to the vessels by examination of the aorta, as well as the femoral vessels and popliteal vessels if there is a clinical suspicion for DVT/PE.101 The views obtained in the RUSH exam are shown in Figure 3. Since most of the views have been covered, only sonographic examples of the IVC and aortic views are included.
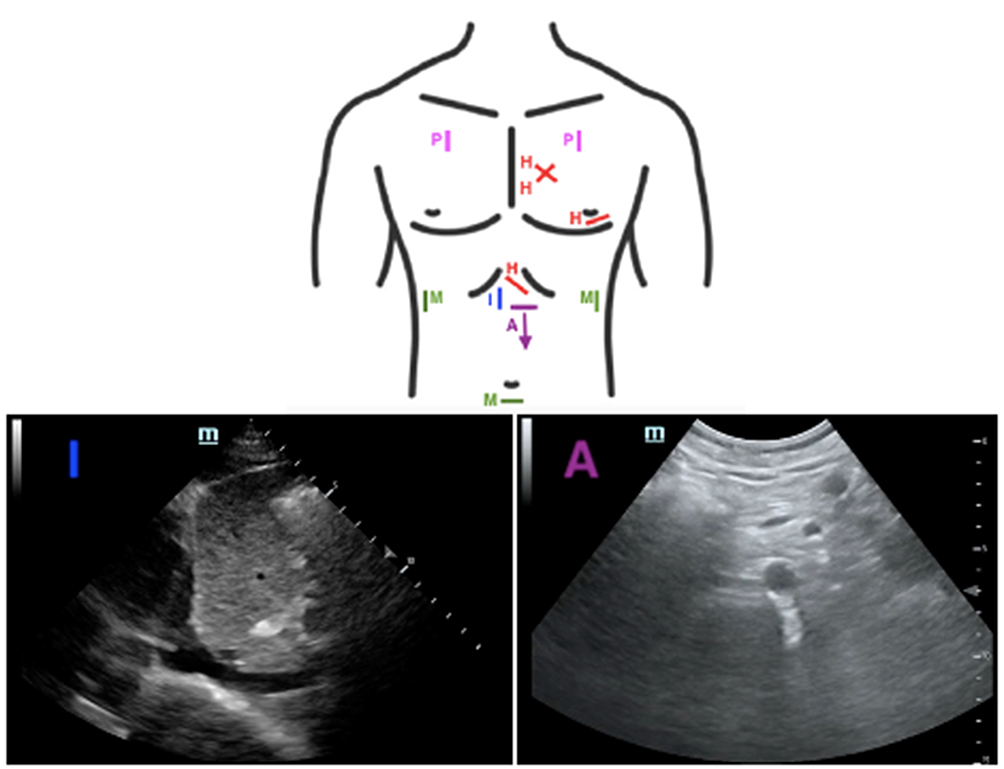 |
Figure 3 Diagram of the views obtained for completion of the RUSH exam using the HIMAP acronym. H: heart (focused cardiac ultrasound), I: IVC, M: Morrison’s pouch (RUQ followed by completion of an E-FAST exam), A: aorta, P: pneumothorax (already covered via E-FAST exam). Corresponding sonographic images of the IVC and aorta are included. Abbreviations: RUSH, rapid ultrasound in shock; IVC, inferior vena cava; RUQ, right upper quadrant; E-FAST, extended focused abdominal scan for trauma. |
The Patient with Respiratory Distress
Clinical Questions
(1) Does the patient have a pneumothorax?
(2) Does the patient have pulmonary edema?
(3) Does the patient have lung consolidation?
(4) Does the patient have a pleural effusion?
(5) Does the patient have lung collapse?
(6) What is the patient’s optimal lung opening pressure?
Point of care lung ultrasound may facilitate more rapid identification of pulmonary abnormalities versus formal radiology studies. For example, there are several readily visualized and well-described lung ultrasound findings associated with the presence of pneumothorax.102 These include the absence of synchronous movement of the pleural line with ventilation (ie, absence of “lung sliding”),103 the presence of a contact point between the pneumothorax air collection and collapsed lung (ie, presence of a “lung point”),103,104 the absence of lung sliding with the perception of heart activity at the pleural line (ie, absence of a “lung pulse”),105 and the absence of vertical hyperechoic comet-tail artifacts originating from the pleural line (ie, absence of B lines).102,103,106 The presence of B lines rules out pneumothorax with 100% sensitivity and 100% negative predictive power,107 while the presence of a lung point confirms pneumothorax with 100% specificity.104 POCUS is also useful in the evaluation of pleural effusion, which is usually readily identifiable due to the hypoechoic appearance of pleural fluid.108 Ultrasound is able to detect small volumes of pleural fluid and may assess the thickness of the fluid layer more accurately than plain-film radiography.109 Finally, the use of ultrasound for the diagnosis and management of pleural effusions may allow for a reduction in the number of chest x-rays and computerized tomography scans, decreasing radiation exposure, cost, and time to treatment.110,111
The Lung Ultrasound Score (LUSS) is a tool used to identify and quantify the degree of loss of aeration in the lungs due to various pulmonary pathologies (Figure 4).112 Each side of the patient’s chest is divided into 4 quadrants by the anterior axillary line and the level of the nipple. Each of the 8 total quadrants on each side is then examined with ultrasound and a score of 0–3 is given for each quadrant, with a total possible score of 24. A lines are hyperechoic horizontal reverberation artifacts visualized below the parietal pleural in regular intervals that indicate a high gas–volume ratio and normal aeration.103 Normal lung with normal lung sliding, along with A lines or no more than 1 B line corresponds to a score of 0.113 If multiple distinct B lines are present, a score of 1 is assigned. When multiple B lines are present, but they are more coalescent, a score of 2 is assigned. Finally, if air bronchograms are present, this is suggestive of consolidation and a score of 3 is assigned. A higher LUSS is associated with a greater 28-day mortality among hospitalized patients.113
 |
Figure 4 Sonographic images of the lung with the orientation of A lines and B lines superimposed. |
Lung ultrasound may also be used to guide the management of a patient undergoing fluid resuscitation by demonstrating signs of volume overload. In addition to being used in the LUSS and in the diagnosis of pneumothorax, B lines are suggestive of extravascular lung water (EVLW) content and are thus a surrogate for pulmonary edema.114 The presence of 3 or more B lines observed in 2 or more intercostal spaces is suggestive of acute decompensated heart failure.115 Lung ultrasound is as specific and more sensitive than chest x-ray in the identification of cardiogenic pulmonary edema.116 A meta-analysis of eight studies, including 1301 patients conducted by Wang et al, found that ultrasound diagnosed acute pulmonary edema with a sensitivity of 97% and specificity of 98%.117 After obtaining a baseline exam, serial monitoring of the number of B lines can be undertaken to assess the response to therapy as there is a relationship between the number of B lines and the severity of pulmonary congestion.106 In this manner, lung aeration can be evaluated by visualizing a reduction in B line burden.118
Lung pathology can be assessed based on the distribution of ultrasound findings. For example, B lines associated with cardiogenic pulmonary edema often follow a diffuse and symmetric spatial distribution in the dependent lung zones.108 Conversely, B lines due to pulmonary fibrosis are often associated with small subpleural consolidations and asymmetry of the pleural line at the posterior lung base.119 Sonographic features of acute lung injury/acute respiratory distress syndrome (ARDS) are more likely to follow a heterogeneous and irregular pattern with numerous subpleural consolidations and multiple B lines alternating with normal-appearing lung.119,120 Lung contusions are associated with multiple merging B lines arising from the pleural line and peripheral parenchymal lesions, defined as hypoechoic subpleural focal images with or without a pleural line gap.121 Finally, the ultrasound features associated with pneumonia include focal or multifocal hypoechoic lung texture with irregular blurred margins, often in the absence of pleural features.122
A feared complication of mechanical ventilation is ventilator-induced lung injury, caused by overdistension of alveoli and/or repetitive opening and closing of alveolar lung units.123 To avoid lung injury, clinicians often employ lung protective strategies, such as limiting tidal volume or driving pressure.124–126 Ultrasound has several unique features, which make it an attractive tool to adjust opening and closing pressures. It is non-invasive, easy-to-use, and highly specific and sensitive for diagnosing lung collapse.106 One effective approach for optimizing aeration is a four-step process described by Tusman et al.127 The first step is to determine the need for a recruitment maneuver using a comprehensive lung ultrasound exam.128 The presence of isolated or coalescent B lines or sub-pleural consolidations with static air-bronchograms is signs of possible moderate-to-severe lung collapse. These findings can be used to calculate a lung ultrasound aeration score described by Bouhemad et al.129 A high aeration score is an indication that the patient requires a recruitment maneuver. Although B lines can be associated with other pathologies, bilateral findings along with static air-bronchograms are strong indicators of collapsed but recruitable lung parenchyma.
Once the need for lung recruitment is established, the second step is to evaluate the hemodynamic status of the patient.127 Patients in any form of shock or preload-dependent state may not tolerate the increased intrathoracic pressures required for lung recruitment.130 If the patient is not hypovolemic, the clinician can start step three of the ultrasound-guided recruitment maneuver. Concentrating the ultrasound on the most dependent portion of the lung with airway collapse, the pressure is increased until re-aeration is visualized.127,131 Once the optimal opening pressure has been established, a stepwise decrease in positive end expiratory pressure (PEEP) can be used to determine the optimal closing pressure, 2 cm H2O above the PEEP at which lungs start to collapse again.127,131 The final step is to assess the effects of the above interventions.
Stevic et al simultaneously assessed lung recruitability using both recruitment-to-inflation (R/I) ratio and lung ultrasound aeration score in a prospective observational study of 24 patients with novel coronavirus disease-associated ARDS.132 The R/I ratio was calculated by the compliance of recruited lung divided by the lung compliance at low PEEP,133 while the lung ultrasound aeration score was determined according to the method described by Bouhemad et al.129 Investigators found that an R/I ratio of 0.7 correlated with lung ultrasound aeration score, further validating the use of ultrasound-guided lung recruitment.132
Ultrasound may also be used to guide the initial PEEP strategy in patients with ARDS. Salem et al compared a lung ultrasound aeration score-determined PEEP strategy with an FiO2-determined PEEP strategy in a prospective trial of 60 patients with ARDS receiving mechanical ventilation.134 In this study, the PEEP strategy determined by lung ultrasound was associated with improved oxygenation, lung compliance, and other clinical outcomes compared to the FiO2-determined strategy. Although this study was a single-center investigation and non-blinded in nature, it provides further evidence for the use of ultrasound-guided ventilator management in patients with ARDS.134 Overall, the use of lung ultrasound for lung recruitment is an evolving concept that requires further investigation. A recent systematic review on this topic concluded that while lung ultrasound findings with a non-focal morphology of ARDS are predictive of more re-aeration following a recruitment maneuver, the ultrasound findings associated with successful response to recruitment in patients without ARDS have not been identified.135
Other Patients
Clinical Questions
(1) Does the patient have evidence of a DVT?
(2) Does the patient have a retinal detachment?
(3) Does the patient have vitreous hemorrhage?
(4) Does the patient have elevated optic nerve sheath diameter, suggestive of elevated intracranial pressure?
Venous thromboembolic disease is common among hospitalized patients and leads to significant morbidity and mortality when undiagnosed.136 Formal ultrasonography for the diagnosis of DVT is often delayed and sometimes unavailable.137 POCUS has been shown to accurately diagnose DVT compared to formal evaluation.138 Two-point POCUS for DVT assesses the common femoral vein and the popliteal vein for compressibility, whereas the 3-point ultrasound technique additionally evaluates the superficial femoral vein. One large retrospective study by Adhikari et al found that 5.5% and 0.8% of detected DVTs in the emergency department were isolated to the superficial femoral vein and deep femoral vein.139 A recently published meta-analysis, however, did not find a significant difference between the two methods for the diagnosis of DVT in the emergency department setting.140 Importantly, the 2-point compression test does not mean two compressions with the probe; the intention should be to interrogate the region from the greater saphenous vein/femoral vein junction to the confluence of the deep and superficial femoral veins as well as the region behind the knee from the proximal popliteal vein to the confluence of the calf veins.141 Although diagnostic ultrasound is operator-dependent, Kory et al found that rapid and accurate diagnosis of proximal lower extremity DVTs can be achieved by intensivists.142 Most of the exams in this study were performed by critical care fellows with less than 2 years of experience after a 3-day training course. Of note, a review of the literature concluded that compressing vessels in order to diagnose a DVT should not cause an embolic event.141
Bedside ocular ultrasound is fast and non-invasive, allowing for the identification of common pathology, as well as ruling out increased intracranial pressure. While anterior eye lesions can be easily identified by medical history and physical exam, posterior lesions are more difficult to diagnose. Unfortunately, ophthalmoscopy is challenging and rarely performed in critical care practice.143 Since the eye is a fluid-filled structure laying superficially within the orbit, it is easy to visualize with ultrasound (Figure 5). Blaivas et al showed that skilled emergency medicine physicians accurately diagnosed 60 of 61 intraocular diseases by ultrasound.144 Retinal detachments appear on ultrasound as highly reflective membranes floating in the vitreous body. A classic “v shape” is seen with complete detachment, due to firm attachments of the retina at the ora serrata and the optic nerve head.145 Vitreous hemorrhage can be detected by hyperechoic particles seen swirling in the vitreous body (Figure 6).146 Intracranial pressure estimation can provide important clinical information in the ICU setting, and elevated ocular nerve sheath diameter is associated with an elevation of intracranial pressure. The inner layer of the optic nerve sheath is an extension of the subarachnoid space stemming from the central nervous system. A normal optical nerve sheath diameter is <5 mm in adults. By convention, measurements of the optic nerve sheath are made 3 mm posterior to the globe.147 Papilledema (edema of the retinal disc from increased intracranial pressure) can also be observed by ocular ultrasound. Bilateral elevation of the optical disk above the level of the retina on ultrasound was seen in 95% of patients with intracranial hypertension.148 A recent meta-analysis, which incorporated both emergency department and critical care populations, showed good diagnostic test accuracy for detecting elevated intracranial pressure with POCUS compared to computed tomography.149
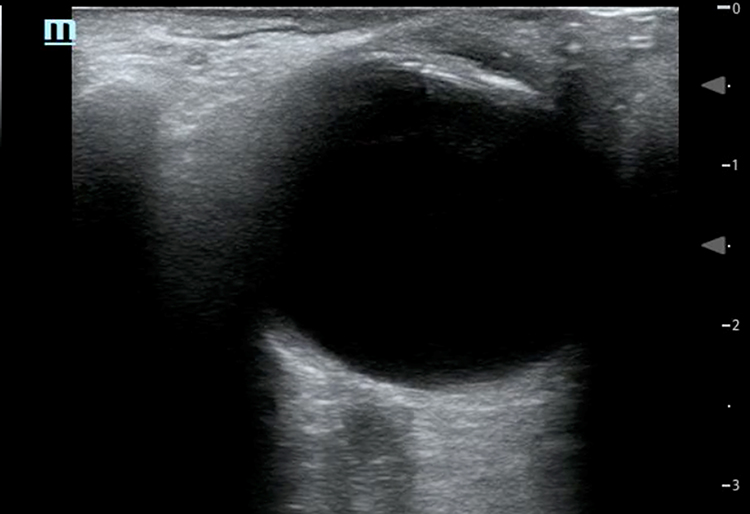 |
Figure 5 Normal ocular ultrasound with the lens visible at the superior aspect of the image and the optic nerve sheath visible at the inferior aspect of the image. |
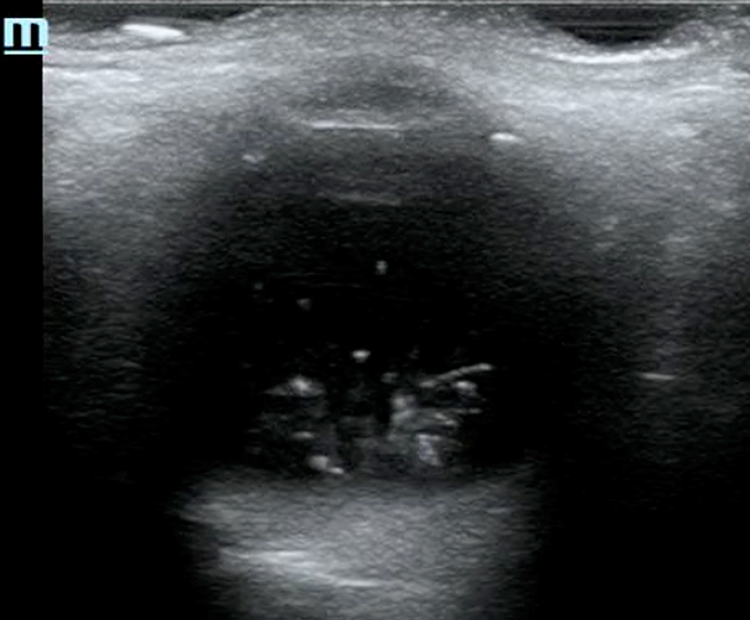 |
Figure 6 Ocular ultrasound example of a vitreous hemorrhage. |
Future POCUS Directions
The integration of artificial intelligence (AI)-based principles may reduce some of the technical and operator-specific limitations associated with image acquisition and interpretation within POCUS. Machine learning is the field of AI that focuses on extracting knowledge from data using computing. Machine learning approaches have been applied within several healthcare domains to augment pattern recognition and improve the accuracy of diagnoses.150 Integration of deep learning (a subset of machine learning) principles within POCUS has the potential to improve the accuracy and efficacy of imaging using automated image interpretation and incorporation of clinical scenario-specific algorithms.151 Blaivas et al developed and applied a deep learning algorithm to augment real-time video interpretation for POCUS-guided assessment of IVC collapsibility and fluid responsiveness.152 The algorithm was designed to automatically assess whether ultrasound videos demonstrated an IVC collapsibility of ≥25%. After training the algorithm on 220 public domain IVC ultrasound videos, researchers found that it demonstrated good agreement with three POCUS experts κ=0.45 (95% CI = 0.33–0.56). Bataille et al examined whether machine learning techniques applied to TTE data may predict fluid responsiveness following a standardized fluid challenge in 100 critically ill patients with severe sepsis or septic shock.153 The authors found that the predictive values of the machine learning approaches were as accurate as the hemodynamic response to a passive leg raise maneuver. Similarly, Asch et al developed a novel machine learning algorithm adapted for cardiac ultrasound views commonly used in the point of care setting (eg, apical and PLAX windows).154 Their algorithm allowed for a fully automated evaluation of LVEF and identification of LV dysfunction with similar accuracy to experienced cardiologists using visual estimation.
Conclusion
In conclusion, the POCUS consult is an emerging technique that has broad applicability across the hospital setting. It provides valuable clinical information, delivers data in real-time, and does not require years of expertise to master. The role of POCUS will continue to evolve with the incorporation of AI into healthcare, improving providers’ ability to accurately diagnose pathology and deliver optimal patient care.
Author Contributions
All authors made a significant contribution to this work, whether that is in the conception, manuscript design, analysis, or in all these areas. All authors took part in drafting, revising, and critically reviewing the article. All authors gave final approval for the version to be published, have agreed on the journal to which the article has been submitted, and agree to be accountable for the contents of the article.
Funding
No sources of funding were used in this work.
Disclosure
The authors declare that they have no competing interests.
References
1. Solomon SD, Saldana F. Point-of-care ultrasound in medical education–stop listening and look. N Engl J Med. 2014;370(12):1083–1085. doi:10.1056/NEJMp1311944
2. European Society of Radiology. Position statement and best practice recommendations on the imaging use of ultrasound from the European Society of Radiology ultrasound subcommittee. Insights Imaging. 2020;11(1):115. doi:10.1186/s13244-020-00919-x
3. Nielsen MB, Cantisani V, Sidhu PS, et al. The use of handheld ultrasound devices - an EFSUMB position paper. Ultraschall Med. 2019;40(1):30–39. doi:10.1055/a-0783-2303
4. American College of Emergency Physicians. Ultrasound guidelines: emergency, point-of-care and clinical ultrasound guidelines in medicine. Ann Emerg Med. 2017;69(5):e27–e54. doi:10.1016/j.annemergmed.2016.08.457
5. Kirkpatrick JN, Grimm R, Johri AM, et al. Recommendations for echocardiography laboratories participating in cardiac point of care cardiac ultrasound (POCUS) and critical care echocardiography training: report from the American Society of Echocardiography. J Am Soc Echocardiogr. 2020;33(4):409–422 e4. doi:10.1016/j.echo.2020.01.008
6. Cantisani V, Dietrich CF, Badea R, et al. EFSUMB statement on medical student education in ultrasound [short version]. Ultraschall Med. 2016;37(1):100–102. doi:10.1055/s-0035-1566959
7. Benjamin EJ, Muntner P, Alonso A, et al. Heart disease and stroke statistics-2019 update: a report from the American Heart Association. Circulation. 2019;139(10):e56–e528. doi:10.1161/CIR.0000000000000659
8. Orde S, Slama M, Hilton A, Yastrebov K, McLean A. Pearls and pitfalls in comprehensive critical care echocardiography. Crit Care. 2017;21(1):279. doi:10.1186/s13054-017-1866-z
9. Labovitz AJ, Noble VE, Bierig M, et al. Focused cardiac ultrasound in the emergent setting: a consensus statement of the American Society of Echocardiography and American College of Emergency Physicians. J Am Soc Echocardiogr. 2010;23(12):1225–1230. doi:10.1016/j.echo.2010.10.005
10. Via G, Hussain A, Wells M, et al. International evidence-based recommendations for focused cardiac ultrasound. J Am Soc Echocardiogr. 2014;27(7):683 e1–683 e33. doi:10.1016/j.echo.2014.05.001
11. Meyer DM, Jessen ME, Grayburn PA. Use of echocardiography to detect occult cardiac injury after penetrating thoracic trauma: a prospective study. J Trauma. 1995;39(5):
12. Alerhand S, Carter JM. What echocardiographic findings suggest a pericardial effusion is causing tamponade? Am J Emerg Med. 2019;37(2):321–326. doi:10.1016/j.ajem.2018.11.004
13. Singh S, Wann LS, Schuchard GH, et al. Right ventricular and right atrial collapse in patients with cardiac tamponade–a combined echocardiographic and hemodynamic study. Circulation. 1984;70(6):966–971. doi:10.1161/01.cir.70.6.966
14. Klein AL, Abbara S, Agler DA, et al. American Society of Echocardiography clinical recommendations for multimodality cardiovascular imaging of patients with pericardial disease: endorsed by the Society for Cardiovascular Magnetic Resonance and Society of Cardiovascular Computed Tomography. J Am Soc Echocardiogr. 2013;26(9):965–1012 e15. doi:10.1016/j.echo.2013.06.023
15. Narasimhan M, Koenig SJ, Mayo PH. Advanced echocardiography for the critical care physician: part 1. Chest. 2014;145(1):129–134. doi:10.1378/chest.12-2441
16. Prada G, Vieillard-Baron A, Martin AK, et al. Echocardiographic applications of M-mode ultrasonography in anesthesiology and critical care. J Cardiothorac Vasc Anesth. 2019;33(6):1559–1583. doi:10.1053/j.jvca.2018.06.019
17. Foster E, Cahalan MK. The search for intelligent quantitation in echocardiography: “eyeball,” “trackball” and beyond. J Am Coll Cardiol. 1993;22(3):848–850. doi:10.1016/0735-1097(93)90201-b
18. Marwick TH. The role of echocardiography in heart failure. J Nucl Med. 2015;56(Suppl 4):31S–38S. doi:10.2967/jnumed.114.150433
19. Parfrey PS, Collingwood P, Foley RN, Bahrle A. Images in nephrology. Left ventricular disorders detected by M-mode echocardiography in chronic uraemia. Nephrol Dial Transplant. 1996;11(7):1328–1331. doi:10.1093/ndt/11.7.1328
20. Parasuraman S, Walker S, Loudon BL, et al. Assessment of pulmonary artery pressure by echocardiography-A comprehensive review. Int J Cardiol Heart Vasc. 2016;12:45–51. doi:10.1016/j.ijcha.2016.05.011
21. Chetrit M, Roujol S, Picard MH, et al. Optimal technique for measurement of linear left ventricular dimensions. J Am Soc Echocardiogr. 2019;32(4):476–483 e1. doi:10.1016/j.echo.2018.12.001
22. Myers SJ, Kelly TE, Stowell JR. Successful point-of-care ultrasound-guided treatment of submassive pulmonary embolism. Clin Pract Cases Emerg Med. 2017;1(4):340–344. doi:10.5811/cpcem.2017.7.34504
23. Mitchell C, Rahko PS, Blauwet LA, et al. Guidelines for performing a comprehensive transthoracic echocardiographic examination in adults: recommendations from the American Society of Echocardiography. J Am Soc Echocardiogr. 2019;32(1):1–64. doi:10.1016/j.echo.2018.06.004
24. Fremont B, Pacouret G, Jacobi D, Puglisi R, Charbonnier B, de Labriolle A. Prognostic value of echocardiographic right/left ventricular end-diastolic diameter ratio in patients with acute pulmonary embolism: results from a monocenter registry of 1416 patients. Chest. 2008;133(2):358–362. doi:10.1378/chest.07-1231
25. Lopez-Candales A, Edelman K, Candales MD. Right ventricular apical contractility in acute pulmonary embolism: the McConnell sign revisited. Echocardiography. 2010;27(6):614–620. doi:10.1111/j.1540-8175.2009.01103.x
26. Ueti OM, Camargo EE, Ueti Ade A, de Lima-filho EC, Nogueira EA. Assessment of right ventricular function with Doppler echocardiographic indices derived from tricuspid annular motion: comparison with radionuclide angiography. Heart. 2002;88(3):244–248. doi:10.1136/heart.88.3.244
27. Miller D, Farah MG, Liner A, Fox K, Schluchter M, Hoit BD. The relation between quantitative right ventricular ejection fraction and indices of tricuspid annular motion and myocardial performance. J Am Soc Echocardiogr. 2004;17(5):443–447. doi:10.1016/j.echo.2004.01.010
28. Ghio S, Klersy C, Magrini G, et al. Prognostic relevance of the echocardiographic assessment of right ventricular function in patients with idiopathic pulmonary arterial hypertension. Int J Cardiol. 2010;140(3):272–278. doi:10.1016/j.ijcard.2008.11.051
29. Alam M, Wardell J, Andersson E, Samad BA, Nordlander R. Right ventricular function in patients with first inferior myocardial infarction: assessment by tricuspid annular motion and tricuspid annular velocity. Am Heart J. 2000;139(4):710–715. doi:10.1016/s0002-8703(00)90053-x
30. Rydman R, Soderberg M, Larsen F, Caidahl K, Alam M. Echocardiographic evaluation of right ventricular function in patients with acute pulmonary embolism: a study using tricuspid annular motion. Echocardiography. 2010;27(3):286–293. doi:10.1111/j.1540-8175.2009.01015.x
31. Gaspari R, Weekes A, Adhikari S, et al. Emergency department point-of-care ultrasound in out-of-hospital and in-ED cardiac arrest. Resuscitation. 2016;109:33–39. doi:10.1016/j.resuscitation.2016.09.018
32. Aagaard R, Granfeldt A, Botker MT, Mygind-Klausen T, Kirkegaard H, Lofgren B. The right ventricle is dilated during resuscitation from cardiac arrest caused by hypovolemia: a porcine ultrasound study. Crit Care Med. 2017;45(9):e963–e970. doi:10.1097/CCM.0000000000002464
33. Aagaard R, Caap P, Hansson NC, Botker MT, Granfeldt A, Lofgren B. Detection of pulmonary embolism during cardiac arrest-ultrasonographic findings should be interpreted with caution. Crit Care Med. 2017;45(7):e695–e702. doi:10.1097/CCM.0000000000002334
34. Hussein L, Rehman MA, Sajid R, Annajjar F, Al-Janabi T. Bedside ultrasound in cardiac standstill: a clinical review. Ultrasound J. 2019;11(1):35. doi:10.1186/s13089-019-0150-7
35. Clattenburg EJ, Wroe PC, Gardner K, et al. Implementation of the Cardiac Arrest Sonographic Assessment (CASA) protocol for patients with cardiac arrest is associated with shorter CPR pulse checks. Resuscitation. 2018;131:69–73. doi:10.1016/j.resuscitation.2018.07.030
36. Clattenburg EJ, Wroe P, Brown S, et al. Point-of-care ultrasound use in patients with cardiac arrest is associated prolonged cardiopulmonary resuscitation pauses: a prospective cohort study. Resuscitation. 2018;122:65–68. doi:10.1016/j.resuscitation.2017.11.056
37. Elfwen L, Hildebrand K, Schierbeck S, et al. Focused cardiac ultrasound after return of spontaneous circulation in cardiac-arrest patients. Resuscitation. 2019;142:16–22. doi:10.1016/j.resuscitation.2019.06.282
38. Marik PE. Fluid responsiveness and the six guiding principles of fluid resuscitation. Crit Care Med. 2016;44(10):1920–1922. doi:10.1097/CCM.0000000000001483
39. Marik PE, Monnet X, Teboul JL. Hemodynamic parameters to guide fluid therapy. Ann Intensive Care. 2011;1(1):1. doi:10.1186/2110-5820-1-1
40. Kelm DJ, Perrin JT, Cartin-Ceba R, Gajic O, Schenck L, Kennedy CC. Fluid overload in patients with severe sepsis and septic shock treated with early goal-directed therapy is associated with increased acute need for fluid-related medical interventions and hospital death. Shock. 2015;43(1):68–73. doi:10.1097/SHK.0000000000000268
41. Lee SJ, Ramar K, Park JG, Gajic O, Li G, Kashyap R. Increased fluid administration in the first three hours of sepsis resuscitation is associated with reduced mortality: a retrospective cohort study. Chest. 2014;146(4):908–915. doi:10.1378/chest.13-2702
42. Malbrain M, Langer T, Annane D, et al. Intravenous fluid therapy in the perioperative and critical care setting: executive summary of the International Fluid Academy (IFA). Ann Intensive Care. 2020;10(1):64. doi:10.1186/s13613-020-00679-3
43. Kreimeier U. Pathophysiology of fluid imbalance. Crit Care. 2000;4(Suppl 2):S3–S7. doi:10.1186/cc968
44. Flower L, Olusanya O, Madhivathanan PR. The use of critical care echocardiography in peri-arrest and cardiac arrest scenarios: pros, cons and what the future holds. J Intensive Care Soc. 2021;22(3):230–240. doi:10.1177/1751143720936998
45. De Backer D, Fagnoul D. Intensive care ultrasound: VI. Fluid responsiveness and shock assessment. Ann Am Thorac Soc. 2014;11(1):129–136. doi:10.1513/AnnalsATS.201309-320OT
46. Leung JM, Levine EH. Left ventricular end-systolic cavity obliteration as an estimate of intraoperative hypovolemia. Anesthesiology. 1994;81(5):1102–1109. doi:10.1097/00000542-199411000-00003
47. Zengin S, Al B, Genc S, et al. Role of inferior vena cava and right ventricular diameter in assessment of volume status: a comparative study: ultrasound and hypovolemia. Am J Emerg Med. 2013;31(5):763–767. doi:10.1016/j.ajem.2012.10.013
48. Tan C, Rubenson D, Srivastava A, et al. Left ventricular outflow tract velocity time integral outperforms ejection fraction and Doppler-derived cardiac output for predicting outcomes in a select advanced heart failure cohort. Cardiovasc Ultrasound. 2017;15(1):18. doi:10.1186/s12947-017-0109-4
49. Blanco P. Rationale for using the velocity-time integral and the minute distance for assessing the stroke volume and cardiac output in point-of-care settings. Ultrasound J. 2020;12(1):21. doi:10.1186/s13089-020-00170-x
50. Miller A, Mandeville J. Predicting and measuring fluid responsiveness with echocardiography. Echo Res Pract. 2016;3(2):G1–G12. doi:10.1530/ERP-16-0008
51. Koratala A, Kazory A. Point of care ultrasonography for objective assessment of heart failure: integration of cardiac, vascular, and extravascular determinants of volume status. Cardiorenal Med. 2021;11(1):5–17. doi:10.1159/000510732
52. Muller L, Toumi M, Bousquet PJ, et al. An increase in aortic blood flow after an infusion of 100 mL colloid over 1 minute can predict fluid responsiveness: the mini-fluid challenge study. Anesthesiology. 2011;115(3):541–547. doi:10.1097/ALN.0b013e318229a500
53. Wang J, Zhou D, Gao Y, Wu Z, Wang X, Lv C. Effect of VTILVOT variation rate on the assessment of fluid responsiveness in septic shock patients. Medicine (Baltimore). 2020;99(47):e22702. doi:10.1097/MD.0000000000022702
54. Maizel J, Airapetian N, Lorne E, Tribouilloy C, Massy Z, Slama M. Diagnosis of central hypovolemia by using passive leg raising. Intensive Care Med. 2007;33(7):1133–1138. doi:10.1007/s00134-007-0642-y
55. Lamia B, Ochagavia A, Monnet X, Chemla D, Richard C, Teboul JL. Echocardiographic prediction of volume responsiveness in critically ill patients with spontaneously breathing activity. Intensive Care Med. 2007;33(7):1125–1132. doi:10.1007/s00134-007-0646-7
56. McLean AS. Echocardiography in shock management. Crit Care. 2016;20:275. doi:10.1186/s13054-016-1401-7
57. Aligholizadeh E, Teeter W, Patel R, et al. A novel method of calculating stroke volume using point-of-care echocardiography. Cardiovasc Ultrasound. 2020;18(1):37. doi:10.1186/s12947-020-00219-w
58. Levitov A, Marik PE. Echocardiographic assessment of preload responsiveness in critically ill patients. Cardiol Res Pract. 2012;2012:819696. doi:10.1155/2012/819696
59. Orso D, Paoli I, Piani T, Cilenti FL, Cristiani L, Guglielmo N. Accuracy of ultrasonographic measurements of inferior vena cava to determine fluid responsiveness: a systematic review and meta-analysis. J Intensive Care Med. 2020;35(4):354–363. doi:10.1177/0885066617752308
60. Furtado S, Reis L. Inferior vena cava evaluation in fluid therapy decision making in intensive care: practical implications. Rev Bras Ter Intensiv. 2019;31(2):240–247. doi:10.5935/0103-507X.20190039
61. Heenen S, De Backer D, Vincent JL. How can the response to volume expansion in patients with spontaneous respiratory movements be predicted? Crit Care. 2006;10(4):R102. doi:10.1186/cc4970
62. Pinsky MR. Heart-lung interactions. Curr Opin Crit Care. 2007;13(5):528–531. doi:10.1097/MCC.0b013e3282efad97
63. Bortolotti P, Colling D, Colas V, et al. Respiratory changes of the inferior vena cava diameter predict fluid responsiveness in spontaneously breathing patients with cardiac arrhythmias. Ann Intensive Care. 2018;8(1):79. doi:10.1186/s13613-018-0427-1
64. Corl KA, George NR, Romanoff J, et al. Inferior vena cava collapsibility detects fluid responsiveness among spontaneously breathing critically-ill patients. J Crit Care. 2017;41:130–137. doi:10.1016/j.jcrc.2017.05.008
65. Preau S, Bortolotti P, Colling D, et al. Diagnostic accuracy of the inferior vena cava collapsibility to predict fluid responsiveness in spontaneously breathing patients with sepsis and acute circulatory failure. Crit Care Med. 2017;45(3):e290–e297. doi:10.1097/CCM.0000000000002090
66. Lanspa MJ, Grissom CK, Hirshberg EL, Jones JP, Brown SM. Applying dynamic parameters to predict hemodynamic response to volume expansion in spontaneously breathing patients with septic shock. Shock. 2013;39(2):155–160. doi:10.1097/SHK.0b013e31827f1c6a
67. de Valk S, Olgers TJ, Holman M, Ismael F, Ligtenberg JJ, Ter Maaten JC. The caval index: an adequate non-invasive ultrasound parameter to predict fluid responsiveness in the emergency department? BMC Anesthesiol. 2014;14:114. doi:10.1186/1471-2253-14-114
68. Muller L, Bobbia X, Toumi M, et al. Respiratory variations of inferior vena cava diameter to predict fluid responsiveness in spontaneously breathing patients with acute circulatory failure: need for a cautious use. Crit Care. 2012;16(5):R188. doi:10.1186/cc11672
69. Airapetian N, Maizel J, Alyamani O, et al. Does inferior vena cava respiratory variability predict fluid responsiveness in spontaneously breathing patients? Crit Care. 2015;19:400. doi:10.1186/s13054-015-1100-9
70. Weekes AJ, Tassone HM, Babcock A, et al. Comparison of serial qualitative and quantitative assessments of caval index and left ventricular systolic function during early fluid resuscitation of hypotensive emergency department patients. Acad Emerg Med. 2011;18(9):912–921. doi:10.1111/j.1553-2712.2011.01157.x
71. Corl K, Napoli AM, Gardiner F. Bedside sonographic measurement of the inferior vena cava caval index is a poor predictor of fluid responsiveness in emergency department patients. Emerg Med Australas. 2012;24(5):534–539. doi:10.1111/j.1742-6723.2012.01596.x
72. Seif D, Mailhot T, Perera P, Mandavia D. Caval sonography in shock: a noninvasive method for evaluating intravascular volume in critically ill patients. J Ultrasound Med. 2012;31(12):1885–1890. doi:10.7863/jum.2012.31.12.1885
73. Yao B, Liu JY, Sun YB, Zhao YX, Li LD. The Value of the inferior vena cava area distensibility index and its diameter ratio for predicting fluid responsiveness in mechanically ventilated patients. Shock. 2019;52(1):37–42. doi:10.1097/SHK.0000000000001238
74. Lu N, Xi X, Jiang L, Yang D, Yin K. Exploring the best predictors of fluid responsiveness in patients with septic shock. Am J Emerg Med. 2017;35(9):1258–1261. doi:10.1016/j.ajem.2017.03.052
75. Machare-Delgado E, Decaro M, Marik PE. Inferior vena cava variation compared to pulse contour analysis as predictors of fluid responsiveness: a prospective cohort study. J Intensive Care Med. 2011;26(2):116–124. doi:10.1177/0885066610384192
76. Moretti R, Pizzi B. Inferior vena cava distensibility as a predictor of fluid responsiveness in patients with subarachnoid hemorrhage. Neurocrit Care. 2010;13(1):3–9. doi:10.1007/s12028-010-9356-z
77. Feissel M, Michard F, Faller JP, Teboul JL. The respiratory variation in inferior vena cava diameter as a guide to fluid therapy. Intensive Care Med. 2004;30(9):1834–1837. doi:10.1007/s00134-004-2233-5
78. Barbier C, Loubieres Y, Schmit C, et al. Respiratory changes in inferior vena cava diameter are helpful in predicting fluid responsiveness in ventilated septic patients. Intensive Care Med. 2004;30(9):1740–1746. doi:10.1007/s00134-004-2259-8
79. Theerawit P, Morasert T, Sutherasan Y. Inferior vena cava diameter variation compared with pulse pressure variation as predictors of fluid responsiveness in patients with sepsis. J Crit Care. 2016;36:246–251. doi:10.1016/j.jcrc.2016.07.023
80. Charbonneau H, Riu B, Faron M, et al. Predicting preload responsiveness using simultaneous recordings of inferior and superior vena cavae diameters. Crit Care. 2014;18(5):473. doi:10.1186/s13054-014-0473-5
81. Sobczyk D, Nycz K, Andruszkiewicz P, Wierzbicki K, Stapor M. Ultrasonographic caval indices do not significantly contribute to predicting fluid responsiveness immediately after coronary artery bypass grafting when compared to passive leg raising. Cardiovasc Ultrasound. 2016;14(1):23. doi:10.1186/s12947-016-0065-4
82. Millington SJ. Ultrasound assessment of the inferior vena cava for fluid responsiveness: easy, fun, but unlikely to be helpful. Can J Anaesth. 2019;66(6):633–638. doi:10.1007/s12630-019-01357-0
83. Vignon P, Repesse X, Begot E, et al. Comparison of echocardiographic indices used to predict fluid responsiveness in ventilated patients. Am J Respir Crit Care Med. 2017;195(8):1022–1032. doi:10.1164/rccm.201604-0844OC
84. Vieillard-Baron A, Evrard B, Repesse X, et al. Limited value of end-expiratory inferior vena cava diameter to predict fluid responsiveness impact of intra-abdominal pressure. Intensive Care Med. 2018;44(2):197–203. doi:10.1007/s00134-018-5067-2
85. Long E, Oakley E, Duke T, Babl FE. Does respiratory variation in inferior vena cava diameter predict fluid responsiveness: a systematic review and meta-analysis. Shock. 2017;47(5):550–559. doi:10.1097/SHK.0000000000000801
86. Corl KA, Azab N, Nayeemuddin M, et al. Performance of a 25% inferior vena cava collapsibility in detecting fluid responsiveness when assessed by novice versus expert physician sonologists. J Intensive Care Med. 2020;35(12):1520–1528. doi:10.1177/0885066619881123
87. Beaubien-Souligny W, Rola P, Haycock K, et al. Quantifying systemic congestion with point-of-care ultrasound: development of the venous excess ultrasound grading system. Ultrasound J. 2020;12(1):16. doi:10.1186/s13089-020-00163-w
88. Bhardwaj V, Vikneswaran G, Rola P, et al. Combination of inferior vena cava diameter, hepatic venous flow, and portal vein pulsatility index: venous excess ultrasound score (VEXUS score) in predicting acute kidney injury in patients with cardiorenal syndrome: a prospective cohort study. Indian J Crit Care Med. 2020;24(9):783–789. doi:10.5005/jp-journals-10071-23570
89. Jury D, Shaw AD. Utility of bedside ultrasound derived hepatic and renal parenchymal flow patterns to guide management of acute kidney injury. Curr Opin Crit Care. 2021;27(6):587–592. doi:10.1097/MCC.0000000000000899
90. Neri L, Storti E, Lichtenstein D. Toward an ultrasound curriculum for critical care medicine. Crit Care Med. 2007;35(5 Suppl):S290–304. doi:10.1097/01.CCM.0000260680.16213.26
91. Gleeson T, Blehar D. Point-of-care ultrasound in trauma. Semin Ultrasound CT MR. 2018;39(4):374–383. doi:10.1053/j.sult.2018.03.007
92. Quinn AC, Sinert R. What is the utility of the Focused Assessment with Sonography in Trauma (FAST) exam in penetrating torso trauma? Injury. 2011;42(5):482–487. doi:10.1016/j.injury.2010.07.249
93. Melniker LA. The value of focused assessment with sonography in trauma examination for the need for operative intervention in blunt torso trauma: a rebuttal to “emergency ultrasound-based algorithms for diagnosing blunt abdominal trauma (review)”, from the Cochrane Collaboration. Crit Ultrasound J. 2009;1(2):73–84. doi:10.1007/s13089-009-0014-7
94. Rowell SE, Barbosa RR, Holcomb JB, Fox EE, Barton CA, Schreiber MA. The focused assessment with sonography in trauma (FAST) in hypotensive injured patients frequently fails to identify the need for laparotomy: a multi-institutional pragmatic study. Trauma Surg Acute Care Open. 2019;4(1):e000207. doi:10.1136/tsaco-2018-000207
95. Sauter TC, Hoess S, Lehmann B, Exadaktylos AK, Haider DG. Detection of pneumothoraces in patients with multiple blunt trauma: use and limitations of eFAST. Emerg Med J. 2017;34(9):568–572. doi:10.1136/emermed-2016-205980
96. Keikha M, Salehi-Marzijarani M, Soldoozi Nejat R, Sheikh Motahar Vahedi H, Mirrezaie SM. Diagnostic accuracy of Rapid Ultrasound in Shock (RUSH) exam; a systematic review and meta-analysis. Bull Emerg Trauma. 2018;6(4):271–278. doi:10.29252/beat-060402
97. Jain SS, Toraskar KK, Khan AH, Loya YS. Application of rapid ultrasound in shock protocol in the ICU for management of shock. Indian J Crit Care Med. 2014;18(8):550–551. doi:10.4103/0972-5229.138173
98. Yanagawa Y, Ohsaka H, Nagasawa H, Takeuchi I, Jitsuiki K, Omori K. An analysis using modified rapid ultrasound for shock and hypotension for patients with endogenous cardiac arrest. J Emerg Trauma Shock. 2019;12(2):135–140. doi:10.4103/JETS.JETS_99_18
99. Seif D, Perera P, Mailhot T, Riley D, Mandavia D. Bedside ultrasound in resuscitation and the rapid ultrasound in shock protocol. Crit Care Res Pract. 2012;2012:503254. doi:10.1155/2012/503254
100. Ghane MR, Gharib M, Ebrahimi A, et al. Accuracy of early rapid ultrasound in shock (RUSH) examination performed by emergency physician for diagnosis of shock etiology in critically ill patients. J Emerg Trauma Shock. 2015;8(1):5–10. doi:10.4103/0974-2700.145406
101. Perera P, Mailhot T, Riley D, Mandavia D. The RUSH exam: Rapid Ultrasound in SHock in the evaluation of the critically lll. Emerg Med Clin North Am. 2010;28(1):29–56, vii. doi:10.1016/j.emc.2009.09.010
102. Chan KK, Joo DA, McRae AD, et al. Chest ultrasonography versus supine chest radiography for diagnosis of pneumothorax in trauma patients in the emergency department. Cochrane Database Syst Rev. 2020;7:CD013031. doi:10.1002/14651858.CD013031.pub2
103. Mojoli F, Bouhemad B, Mongodi S, Lichtenstein D. lung ultrasound for critically ill patients. Am J Respir Crit Care Med. 2019;199(6):701–714. doi:10.1164/rccm.201802-0236CI
104. Lichtenstein D, Meziere G, Biderman P, Gepner A. The “lung point”: an ultrasound sign specific to pneumothorax. Intensive Care Med. 2000;26(10):1434–1440. doi:10.1007/s001340000627
105. Lichtenstein DA, Lascols N, Prin S, Meziere G. The “lung pulse”: an early ultrasound sign of complete atelectasis. Intensive Care Med. 2003;29(12):2187–2192. doi:10.1007/s00134-003-1930-9
106. Volpicelli G, Elbarbary M, Blaivas M, et al. International evidence-based recommendations for point-of-care lung ultrasound. Intensive Care Med. 2012;38(4):577–591. doi:10.1007/s00134-012-2513-4
107. Lichtenstein D, Meziere G, Biderman P, Gepner A. The comet-tail artifact: an ultrasound sign ruling out pneumothorax. Intensive Care Med. 1999;25(4):383–388. doi:10.1007/s001340050862
108. Lichtenstein DA. BLUE-protocol and FALLS-protocol: two applications of lung ultrasound in the critically ill. Chest. 2015;147(6):1659–1670. doi:10.1378/chest.14-1313
109. Kocijancic I, Vidmar K, Ivanovi-Herceg Z. Chest sonography versus lateral decubitus radiography in the diagnosis of small pleural effusions. J Clin Ultrasound. 2003;31(2):69–74. doi:10.1002/jcu.10141
110. Soni NJ, Franco R, Velez MI, et al. Ultrasound in the diagnosis and management of pleural effusions. J Hosp Med. 2015;10(12):811–816. doi:10.1002/jhm.2434
111. Brogi E, Gargani L, Bignami E, et al. Thoracic ultrasound for pleural effusion in the intensive care unit: a narrative review from diagnosis to treatment. Crit Care. 2017;21(1):325. doi:10.1186/s13054-017-1897-5
112. Zhao Z, Jiang L, Xi X, et al. Prognostic value of extravascular lung water assessed with lung ultrasound score by chest sonography in patients with acute respiratory distress syndrome. BMC Pulm Med. 2015;15:98. doi:10.1186/s12890-015-0091-2
113. Yin W, Zou T, Qin Y, et al. Poor lung ultrasound score in shock patients admitted to the ICU is associated with worse outcome. BMC Pulm Med. 2019;19(1):1. doi:10.1186/s12890-018-0755-9
114. Picano E, Pellikka PA. Ultrasound of extravascular lung water: a new standard for pulmonary congestion. Eur Heart J. 2016;37(27):2097–2104. doi:10.1093/eurheartj/ehw164
115. Pivetta E, Goffi A, Lupia E, et al. Lung ultrasound-implemented diagnosis of acute decompensated heart failure in the ED: a SIMEU multicenter study. Chest. 2015;148(1):202–210. doi:10.1378/chest.14-2608
116. Maw AM, Hassanin A, Ho PM, et al. Diagnostic accuracy of point-of-care lung ultrasonography and chest radiography in adults with symptoms suggestive of acute decompensated heart failure: a systematic review and meta-analysis. JAMA Netw Open. 2019;2(3):e190703. doi:10.1001/jamanetworkopen.2019.0703
117. Wang Y, Shen Z, Lu X, Zhen Y, Li H. Sensitivity and specificity of ultrasound for the diagnosis of acute pulmonary edema: a systematic review and meta-analysis. Med Ultrason. 2018;1(1):32–36. doi:10.11152/mu-1223
118. Ravi C, Johnson DW. Optimizing fluid resuscitation and preventing fluid overload in patients with septic shock. Semin Respir Crit Care Med. 2021;42(5):698–705. doi:10.1055/s-0041-1733898
119. Gargani L, Volpicelli G. How I do it: lung ultrasound. Cardiovasc Ultrasound. 2014;12:25. doi:10.1186/1476-7120-12-25
120. Copetti R, Soldati G, Copetti P. Chest sonography: a useful tool to differentiate acute cardiogenic pulmonary edema from acute respiratory distress syndrome. Cardiovasc Ultrasound. 2008;6:16. doi:10.1186/1476-7120-6-16
121. Soldati G, Testa A, Silva FR, Carbone L, Portale G, Silveri NG. Chest ultrasonography in lung contusion. Chest. 2006;130(2):533–538. doi:10.1378/chest.130.2.533
122. Via G, Storti E, Gulati G, Neri L, Mojoli F, Braschi A. Lung ultrasound in the ICU: from diagnostic instrument to respiratory monitoring tool. Minerva Anestesiol. 2012;78(11):1282–1296.
123. Gajic O, Dara SI, Mendez JL, et al. Ventilator-associated lung injury in patients without acute lung injury at the onset of mechanical ventilation. Crit Care Med. 2004;32(9):1817–1824. doi:10.1097/01.ccm.0000133019.52531.30
124. Kacmarek RM, Villar J, Sulemanji D, et al. Open lung approach for the acute respiratory distress syndrome: a pilot, randomized controlled trial. Crit Care Med. 2016;44(1):32–42. doi:10.1097/CCM.0000000000001383
125. Acute Respiratory Distress Syndrome Network. Ventilation with lower tidal volumes as compared with traditional tidal volumes for acute lung injury and the acute respiratory distress syndrome. N Engl J Med. 2000;342(18):1301–1308. doi:10.1056/NEJM200005043421801
126. Pavone LA, Albert S, Carney D, Gatto LA, Halter JM, Nieman GF. Injurious mechanical ventilation in the normal lung causes a progressive pathologic change in dynamic alveolar mechanics. Crit Care. 2007;11(3):R64. doi:10.1186/cc5940
127. Tusman G, Acosta CM, Costantini M. Ultrasonography for the assessment of lung recruitment maneuvers. Crit Ultrasound J. 2016;8(1):8. doi:10.1186/s13089-016-0045-9
128. Alonso JV, Turpie J, Farhad I, Ruffino G. Protocols for point-of-care-ultrasound (POCUS) in a patient with sepsis; an algorithmic approach. Bull Emerg Trauma. 2019;7(1):67–71. doi:10.29252/beat-0701010
129. Bouhemad B, Brisson H, Le-guen M, Arbelot C, Lu Q, Rouby JJ. Bedside ultrasound assessment of positive end-expiratory pressure-induced lung recruitment. Am J Respir Crit Care Med. 2011;183(3):341–347. doi:10.1164/rccm.201003-0369OC
130. Porter TR, Shillcutt SK, Adams MS, et al. Guidelines for the use of echocardiography as a monitor for therapeutic intervention in adults: a report from the American Society of Echocardiography. J Am Soc Echocardiogr. 2015;28(1):40–56. doi:10.1016/j.echo.2014.09.009
131. Tusman G, Acosta CM, Nicola M, Esperatti M, Bohm SH, Suarez-Sipmann F. Real-time images of tidal recruitment using lung ultrasound. Crit Ultrasound J. 2015;7(1):19. doi:10.1186/s13089-015-0036-2
132. Stevic N, Chatelain E, Dargent A, Argaud L, Cour M, Guerin C. Lung recruitability evaluated by recruitment-to-inflation ratio and lung ultrasound in COVID-19 acute respiratory distress syndrome. Am J Respir Crit Care Med. 2021;203(8):1025–1027. doi:10.1164/rccm.202012-4447LE
133. Chen L, Del Sorbo L, Grieco DL, et al. Potential for lung recruitment estimated by the recruitment-to-inflation ratio in acute respiratory distress syndrome. A clinical trial. Am J Respir Crit Care Med. 2020;201(2):178–187. doi:10.1164/rccm.201902-0334OC
134. Salem MS, Eltatawy HS, Abdelhafez AA, Alsherif SE. Lung ultrasound- versus FiO2-guided PEEP in ARDS patients. Egypt J Anaesthes. 2020;36(1):31–37. doi:10.1080/11101849.2020.1741253
135. Pierrakos C, Smit MR, Hagens LA, et al. Assessment of the effect of recruitment maneuver on lung aeration through imaging analysis in invasively ventilated patients: a systematic review. Front Physiol. 2021;12:666941. doi:10.3389/fphys.2021.666941
136. Ruppert A, Lees M, Steinle T. Clinical burden of venous thromboembolism. Curr Med Res Opin. 2010;26(10):2465–2473. doi:10.1185/03007995.2010.516090
137. Crisp JG, Lovato LM, Jang TB. Compression ultrasonography of the lower extremity with portable vascular ultrasonography can accurately detect deep venous thrombosis in the emergency department. Ann Emerg Med. 2010;56(6):601–610. doi:10.1016/j.annemergmed.2010.07.010
138. Pedraza Garcia J, Valle alonso J, Ceballos Garcia P, Rico Rodriguez F, Aguayo Lopez MA, Munoz-Villanueva MDC. Comparison of the accuracy of emergency department-performed point-of-care-ultrasound (POCUS) in the diagnosis of lower-extremity deep vein thrombosis. J Emerg Med. 2018;54(5):656–664. doi:10.1016/j.jemermed.2017.12.020
139. Adhikari S, Zeger W, Thom C, Fields JM. Isolated deep venous thrombosis: implications for 2-point compression ultrasonography of the lower extremity. Ann Emerg Med. 2015;66(3):262–266. doi:10.1016/j.annemergmed.2014.10.032
140. Lee JH, Lee SH, Yun SJ. Comparison of 2-point and 3-point point-of-care ultrasound techniques for deep vein thrombosis at the emergency department: a meta-analysis. Medicine (Baltimore). 2019;98(22):e15791. doi:10.1097/MD.0000000000015791
141. Lewiss RE, Kaban NL, Saul T. Point-of-care ultrasound for a deep venous thrombosis. Glob Heart. 2013;8(4):329–333. doi:10.1016/j.gheart.2013.11.002
142. Kory PD, Pellecchia CM, Shiloh AL, Mayo PH, DiBello C, Koenig S. Accuracy of ultrasonography performed by critical care physicians for the diagnosis of DVT. Chest. 2011;139(3):538–542. doi:10.1378/chest.10-1479
143. Lorente-Ramos RM, Arman JA, Munoz-Hernandez A, Gomez JM, de la Torre SB. US of the eye made easy: a comprehensive how-to review with ophthalmoscopic correlation. Radiographics. 2012;32(5):E175–E200. doi:10.1148/rg.325115105
144. Blaivas M, Theodoro D, Sierzenski PR. A study of bedside ocular ultrasonography in the emergency department. Acad Emerg Med. 2002;9(8):791–799. doi:10.1111/j.1553-2712.2002.tb02166.x
145. De La Hoz Polo M, Torramilans Lluis A, Pozuelo Segura O, Anguera Bosque A, Esmerado Appiani C, Caminal Mitjana JM. Ocular ultrasonography focused on the posterior eye segment: what radiologists should know. Insights Imaging. 2016;7(3):351–364. doi:10.1007/s13244-016-0471-z
146. Lahham S, Shniter I, Thompson M, et al. Point-of-care ultrasonography in the diagnosis of retinal detachment, vitreous hemorrhage, and vitreous detachment in the emergency department. JAMA Netw Open. 2019;2(4):e192162. doi:10.1001/jamanetworkopen.2019.2162
147. Roque PJ, Hatch N, Barr L, Wu TS. Bedside ocular ultrasound. Crit Care Clin. 2014;30(2):227–241. doi:10.1016/j.ccc.2013.10.007
148. Lochner P, Brio F, Zedde ML, et al. Feasibility and usefulness of ultrasonography in idiopathic intracranial hypertension or secondary intracranial hypertension. BMC Neurol. 2016;16:85. doi:10.1186/s12883-016-0594-3
149. Ohle R, McIsaac SM, Woo MY, Perry JJ. Sonography of the optic nerve sheath diameter for detection of raised intracranial pressure compared to computed tomography: a systematic review and meta-analysis. J Ultrasound Med. 2015;34(7):1285–1294. doi:10.7863/ultra.34.7.1285
150. Alexander JC, Romito BT, Cobanoglu MC. The present and future role of artificial intelligence and machine learning in anesthesiology. Int Anesthesiol Clin. 2020;58(4):7–16. doi:10.1097/AIA.0000000000000294
151. Shokoohi H, LeSaux MA, Roohani YH, Liteplo A, Huang C, Blaivas M. Enhanced point-of-care ultrasound applications by integrating automated feature-learning systems using deep learning. J Ultrasound Med. 2019;38(7):1887–1897. doi:10.1002/jum.14860
152. Blaivas M, Adhikari S, Savitsky EA, Blaivas LN, Liu YT. Artificial intelligence versus expert: a comparison of rapid visual inferior vena cava collapsibility assessment between POCUS experts and a deep learning algorithm. J Am Coll Emerg Physicians Open. 2020;1(5):857–864. doi:10.1002/emp2.12206
153. Bataille B, de Selle J, Moussot PE, Marty P, Silva S, Cocquet P. Machine learning methods to improve bedside fluid responsiveness prediction in severe sepsis or septic shock: an observational study. Br J Anaesth. 2021;126(4):826–834. doi:10.1016/j.bja.2020.11.039
154. Asch FM, Mor-Avi V, Rubenson D, et al. Deep learning-based automated echocardiographic quantification of left ventricular ejection fraction: a point-of-care solution. Circ Cardiovasc Imaging. 2021;14(6):e012293. doi:10.1161/CIRCIMAGING.120.012293
 © 2021 The Author(s). This work is published and licensed by Dove Medical Press Limited. The full terms of this license are available at https://www.dovepress.com/terms.php and incorporate the Creative Commons Attribution - Non Commercial (unported, v3.0) License.
By accessing the work you hereby accept the Terms. Non-commercial uses of the work are permitted without any further permission from Dove Medical Press Limited, provided the work is properly attributed. For permission for commercial use of this work, please see paragraphs 4.2 and 5 of our Terms.
© 2021 The Author(s). This work is published and licensed by Dove Medical Press Limited. The full terms of this license are available at https://www.dovepress.com/terms.php and incorporate the Creative Commons Attribution - Non Commercial (unported, v3.0) License.
By accessing the work you hereby accept the Terms. Non-commercial uses of the work are permitted without any further permission from Dove Medical Press Limited, provided the work is properly attributed. For permission for commercial use of this work, please see paragraphs 4.2 and 5 of our Terms.