")
Back to Journals » International Journal of General Medicine » Volume 15
The Overexpression of Fibronectin 1 Promotes Cancer Progression and Associated with M2 Macrophages Polarization in Head and Neck Squamous Cell Carcinoma Patients
Authors Zhou WH, Du WD, Li YF, Al-Aroomi MA, Yan C, Wang Y, Zhang ZY, Liu FY, Sun CF
Received 10 March 2022
Accepted for publication 10 May 2022
Published 17 May 2022 Volume 2022:15 Pages 5027—5042
DOI https://doi.org/10.2147/IJGM.S364708
Checked for plagiarism Yes
Review by Single anonymous peer review
Peer reviewer comments 2
Editor who approved publication: Dr Scott Fraser
Wan-Hang Zhou,1 Wei-Dong Du,1 Yan-Fei Li,2 Maged Ali Al-Aroomi,1 Cong Yan,1 Yao Wang,1 Ze-Ying Zhang,1 Fa-Yu Liu,1 Chang-Fu Sun1
1Department of Oral Maxillofacial-Head and Neck Surgery, School of Stomatology, China Medical University; Oral Diseases Laboratory of Liaoning, Shenyang, 110000, People’s Republic of China; 2Department of Prosthodontics, Guanghua School of Stomatology, Hospital of Stomatology, Sun Yat-sen University; Guangdong Provincial Key Laboratory of Stomatology, Guangzhou, 510055, People’s Republic of China
Correspondence: Fa-Yu Liu; Chang-Fu Sun, Department of Oral Maxillofacial-Head and Neck Surgery, School of Stomatology, China Medical University; Oral Diseases Laboratory of Liaoning, 117 Nanjing North Road, Heping District, Shenyang, Liaoning, 110000, People’s Republic of China, Tel +86 24 22894773, Fax +86 24 86602310, Email [email protected]; [email protected]
Purpose: This study aimed to investigate the biological roles of fibronectin 1 (FN1) in head and neck squamous cell carcinoma (HNSCC) and its effects on macrophage M2 polarization.
Methods: We analyzed FN1 expression pattern and examined its clinical relevance in HNSCC progression by bioinformatic analysis. Small interfering RNA (siRNA) was utilized to silence FN1 in HNSCC cells. Cell counting kit-8 (CCK-8) assay, colony formation assay, Transwell assay and wound healing assay were performed to reveal the effect of FN1 on malignant behaviors of HNSCC cells. Moreover, a co-culture model of macrophages and HNSCC cells was established to investigate whether FN1 induce macrophage M2 polarization. Finally, we used bioinformatic methods to explore the possible FN1-related pathways in HNSCC.
Results: FN1 is significantly overexpressed in HNSCC patients and has been obviously correlated with higher pathological stage and poor prognosis. Downregulation of FN1 suppressed the proliferation, migration and invasion of HNSCC cells, and inhibited macrophage M2 polarization in vitro. In addition, “PI3K-Akt” and “MAPK” signaling pathways may be involved in the malignant process of FN1 in HNSCC.
Conclusion: The overexpression of FN1 promotes HNSCC progression and induces macrophages M2 polarization. FN1 may serve as a promising prognostic biomarker and therapeutic target in HNSCC.
Keywords: fibronectin 1, head and neck squamous cell carcinoma, prognosis, macrophages, tumorigenesis
Introduction
As the sixth most commonly occurred cancer all over the world, head and neck squamous cell carcinoma (HNSCC) is responsible for around half a million deaths annually, and remains to be a major health issue globally.1 In the United States, HNSCC accounts for approximately 4% of all cancers.2 Classical risk factors of HNSCC are smoking and excessive alcohol consumption, causing at least 75% cases.3 Despite substantial improvements have been made in screening, diagnosis and multidisciplinary therapy of HNSCC over the past few decades, approximately 50% of patients still die of this disease.4 The molecular mechanism underlying the pathogenesis of HNSCC is not well explicated so far. Aberrantly expressed genes in HNSCC may participate in tumorigenesis and cancer progression and lead to unfavorable outcomes.5 In this context, exploration of novel biomarkers for the precise diagnosis and personalized treatment of HNSCC is urgently needed.
Fibronectin 1 (FN1) is one crucial member of the extracellular matrix glycoprotein family and has been found to be widely expressed by a variety of cell types. It mediates the interaction between cells and the extracellular matrix, and is irreplaceable in a number of developmental contexts like cell adhesion, migration, growth and differentiation.6,7 Recently, FN1 is increasingly attracting attention for its association between tumor progression and potential value as a therapeutic target in cancer immunotherapy.8,9 Glasner et al10 demonstrated that natural killer cells increased FN1 to alter tumor architecture and control metastasis, and proposed FN1 may help develop NK cell-dependent cancer therapies. Extensive studies have also been widely published in recent years, showing that FN1 is abnormally expressed in multiple cancers and contributes to tumor occurrence.11–15 Nevertheless, the biologic link between FN1 and HNSCC has not been well recognized so far. The clinical significance of FN1 in HNSCC remains undetermined. There is, therefore, an imperative need to systematically assess this important topic.
Developed from monocytes, macrophages could be divided into two different subgroups: the M1-type which exhibits pro-inflammatory functions, and the M2-type which suppresses the immune response.16 Macrophages recruited to the tumor tissue are known as tumor-associated macrophages (TAM). TAM can produce immunosuppressive molecules such as interleukin (IL) −10 and TGF-β (transforming growth factor-β, TGF-β) to block antitumor immunity, induce immune tolerance and thus favor an immunosuppressive tumor microenvironment (TME).17 It has been considered that TAMs are crucial for tumor progression and therapeutic effect,18,19 and is also an important determinant of inferior prognosis in HNSCC patients.20,21 However, very little is known about the essential role of FN1 in mediating M2-like macrophage polarization in HNSCC. In this study, we examined the expression pattern and the molecular function of FN1 in HNSCC, and provided evidence that FN1 promoted HNSCC cell proliferation, migration, invasion, and macrophages M2 polarization in vitro. Moreover, the potential underlying pathophysiologic mechanism was investigated.
Materials and Methods
Gene Expression Analysis
The mRNA expression levels of FN1 in diverse human tumors were first compared with their matched normal tissues via Tumor Immune Estimation Source 2.0 (TIMER2.0).22 The full names of the cancer genome atlas (TCGA) tumor abbreviations were supplied in Supplementary Table S1. We also extracted FN1 expression data from Oncomine database, a major cancer microarray repository and web-based data-mining platform,23 to systematically assess the abundance of FN1 based on diverse malignant tumor types. We explore the FN1 expression and analyze the association between FN1 and the clinicopathological parameters of HNSCC by level 3 RNA-sequencing data of HNSCC retrieved from TCGA. We also selected 5 datasets (GSE13397, GSE25099, GSE74530, GSE142083 and GSE65858) from the Gene expression omnibus (GEO) database24 to verify FN1 expression in HNSCC. Differences in FN1 expression and distribution at the protein level were evaluated in the Human Protein Atlas (HPA) database25 utilizing immunohistochemistry staining data of two patients (IDs: 1130 and 623). The FN1 antibodies used for immunohistochemistry were from Agilent (CAB000126).
Diagnosis and Survival Prognosis Analysis
To gauge the diagnostic value of FN1 in HNSCC, TCGA-HNSCC dataset was used to conduct receiver operating characteristic (ROC) curve analysis. The effect of FN1 mRNA expression on survival in HNSCC was assessed using TCGA data and GSE65858 dataset. Overall survival (OS) was employed as the end point. The median was set up as a cut-off value to split patients into high FN1 (upper 50%) and low FN1 expression (lower 50%) groups. The hazard ratio (HRs), 95% confidence intervals (CIs) and log-rank P-values were calculated. Ultimately, independent prognostic factors were identified by univariate and multivariate Cox regression analyses.
Cell Lines and Culture Conditions
Human acute monocytic leukemia cell-line THP-1 was purchased from the Cell Bank/Stem Cell Bank, Chinese Academy of Sciences (Shanghai, China). PCI-37B, which is a well-characterized HNSCC cell line derived from the metastatic lymph node of an oral squamous cell carcinoma (OSCC) patient, was a kind gift donated by the University of Pittsburgh Cancer Institute (Pittsburgh, PA, USA).26 THP-1 monocytes were cultured in Roswell Park Memorial Institute medium (RPMI-1640), complemented with additional 0.05mM β-mercaptoethanol (Gibco, Carlsbad, CA, USA). PCI-37B cell was maintained in Dulbecco’s modified Eagle’s medium (DMEM). All the cells were incubated in a humidified atmosphere with 5% CO2 at 37°C, supplemented with 10% fetal bovine serum (FBS), 100 U/mL penicillin and 100 µg/mL streptomycin (Gibco, CA, USA). The medium was changed three times a week, and cells passaged when 80% confluence was reached.
Cell Transfection
Three pairs of small interfering RNAs (siRNAs) and negative control siRNA (si-NC) purchased from Ribobio (Guangzhou, China) were transiently transfected to silence human FN1. The sequences were listed in Supplementary Table S2. According to the manufacturer’s instructions, HNSCC cells were seeded the day before transfection. siRNA duplexes were diluted into serum-free media Opti-MEM® (Gibco, Carlsbad, CA, USA). Then, transfection reagent INTERFERin® (Polyplus, SA, France) was added into the siRNA solution and incubated for 10 min at room temperature after vortex-mixed. Finally, INTERFERin®-siRNA complexes were added in a fresh complete medium to incubate cells at 37°Cfor 24 h. The knockdown efficiency of different siRNAs was tested using a quantitative real-time PCR assay.
RNA Extraction and Quantitative Real-Time PCR
Quantitative real-time PCR (qRT-PCR) was carried out to evaluate the mRNA expression levels of FN1 and macrophage-related genes. Total RNA was extracted from cultured cells and reversely transcribed into cDNA using TRIzol Reagent (TaKaRa, Kyoto, Japan) and PrimeScript RT reagent Kit (TaKaRa, Kyoto, Japan) according to the protocols recommended by the manufacturer. Subsequently, one-fifth of the cDNA was used as a template for qRT-PCR using a TB Green® Premix Ex Taq™ II reagent Kit (TaKaRa, Kyoto, Japan) via an ABI QuantStudio3 Real-Time PCR System (Applied Biosystems, Foster City, CA). The relative gene expression was calculated using the 2−ΔΔCT method. Housekeeping gene GAPDH was used as internal standard control. The primer sequences designed by Sangon Biotech (Shanghai, China) are presented in Table 1.
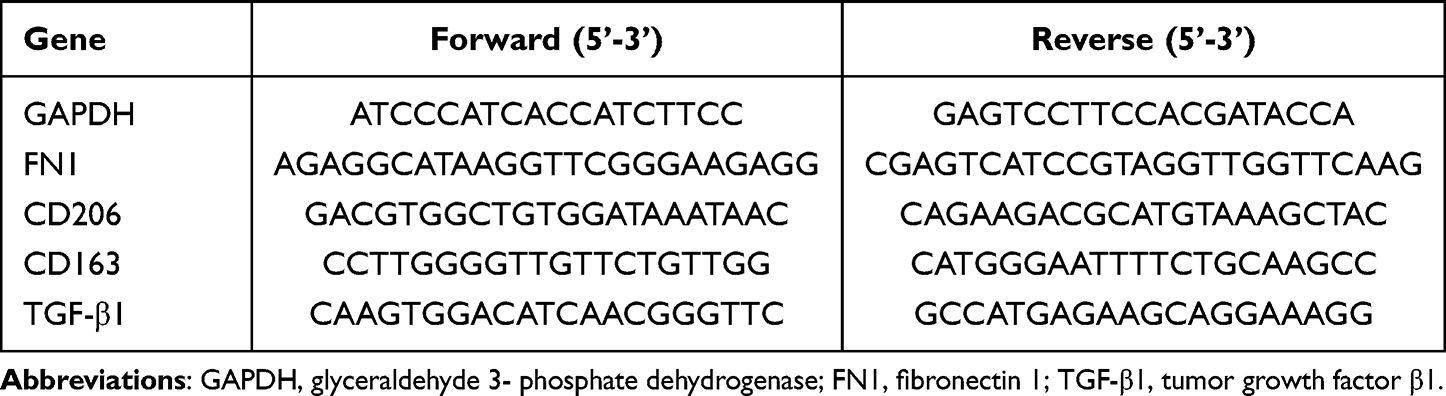 |
Table 1 Primers Used for qRT-PCR |
Cell Counting Kit-8 (CCK-8) Assay
Transfected cells were plated into 96-well plates at a density of 5000 cells per well in 100 µL medium. After culturing for 24, 48 72 and 96 h, the supernatant was replaced with 100 µL fresh medium containing 10 µL CCK-8 solution (Beyotime, Shanghai, China). The cells were incubated at 37°Cin the dark for an additional h. Subsequently, the optical density (OD) value of each well at wavelength 450 nm was measured by a microplate reader (Tecan infinite M200). Each group had five wells, and the experiment was repeated three times.
Colony Formation Assay
The transfected cells were plated into 6-well dishes at a density of 1000 cells/well and cultured for successive 14 days at 37°C. The culture medium was replaced every 5 days. Colonies were then fixed with cold 4% paraformaldehyde (PFA, Sigma-Aldrich, St. Louis, USA) for 15 min, stained with 0.1% crystal violet for 10 min (Sigma-Aldrich, St. Louis, USA) and washed with PBS. The number of colonies within the area of each well was calculated.
Transwell Cell Migration and Invasion Assay
Transwell assay was conducted to evaluate the tumor cells migration and invasion. HNSCC cells were cultured with 200μL fresh serum-free DMEM medium in the upper compartment of a 24-well Transwell chamber (8-um pore diameter; Corning, NY, USA) at a density of 4 × 10⁵ cells/mL. Matrigel matrix was diluted to 200μg/mL and applied to the top side of Transwell chamber in cell invasion assays, whereas in cell migration assays, the filter was not coated. Meanwhile, 800μL fresh DMEM medium containing 20% FBS was added to the lower chamber. After 24 h (48 h for invasion assay), the migrated and invaded cells were washed with PBS, fixed with 4% PFA for 30 min and stained with 10% crystal violet for 20 min at room temperature. The cells on the upper surface of the membrane were carefully wiped off by a cotton swab. The cells of each membrane were then photographed by Nikon Eclipse Ts2R inverted fluorescence microscope (Nikon, Tokyo, Japan) and counted in 3 random fields to quantify cell movement.
Would Healing Assays
HNSCC cells (1×10⁶/well) were plated in 6-well plates and grown to 80–90% confluence. Then, the monolayer of cells was scraped with a standard 200μL sterile micropipette tip to create a denuded gap of constant width. The cells were subsequently washed with PBS and then exposed to a serum-free medium for 12 h and 24 h. At the end of the exposure, the migrated gap was photographed under an inverted fluorescence microscope (Nikon, Tokyo, Japan). The wound healing rate was measured using Adobe Photoshop (Adobe, San Jose, USA).

Immune Infiltration Analysis
We first analyse the correlation of FN1 expression with overall immune infiltration degree in TCGA-HNSCC patients by generating immunescore using ESTIMATE (Estimation of STromal and Immune cells in MAlignant Tumor tissues using Expression data) algorithm.27 Then, the association between FN1 and some tumor-infiltrating immune cells (TIICs) in TCGA-HNSCC patients was evaluated using “Gene” module of the TIMER web server.28 Scatterplots containing the partial Spearman correlation (Cor) and purity-adjusted P-value were generated. The CIBERSORT method,29 a deconvolution algorithm to evaluate the changes in the expression of one set of genes relative to all other genes in the sample, and LM22 gene signature including 22 types of TIICs were used to further quantify the proportion of TIICs in HNSCC patients. In brief, the expression data of HNSCC patients from the TCGA database were divided into 2 groups according to the median expression value of FN1. CIBERSORT algorithm is run with a default signature matrix at one thousand permutations and estimated as a P-value for deconvolution via Monte Carlo sampling, establishing a measure of confidence in the results. The analysis was implemented by R packages “immuneeconv”. Finally, the association between FN1 expression and macrophage was explored by extracting data from TIMER2 web server.
Preparation of Conditioned Medium and Macrophage Differentiation
To obtain conditioned media (CM), HNSCC cells, with up to 80% confluence, were washed by PBS thrice and cultured for an additional 48 h with fresh RPMI-1640 medium without serum. Then, the cell-free supernatants were harvested, centrifuged at 1000 rpm for 5 min and collected after filtered using 0.22-μm polyvinylidene difluoride membrane filters. CM was stored at −80°C before future experiments.
THP-1 monocytes were differentiated into macrophages as previously described.30,31 In brief, the THP-1 cells were induced in the presence of 100 ng/mL phorbol-12-myristate-13 acetate (PMA, Sigma-Aldrich, USA) for 24 h to obtain resting macrophages (M0). Subsequently, when the medium was removed, M0 cells were cultured with fresh RPMI-1640 medium for another 48 h. Finally, the M0 cells were cultured in the CM of HNSCC cell lines for 72 h to establish a co-culture system.
Co-Expression Analysis
The co-expression analysis was conducted at gene and protein level. The co-expressed gene patterns of FN1 in HNSCC were screened through the LinkedOmics database.32 The correlation of results was tested by the Pearson correlation coefficient and presented, respectively, in volcano plot and heat maps. We also explored FN1-related proteins, construct a protein–protein interaction (PPI) network and predicted their functions via GeneMANIA,33 using FN1 as the query.
Functional Enrichment Analysis
Co-expressed genes of FN1 with a correlation coefficient greater than 0.3 were selected for GO (Gene Ontology) analysis and KEGG (Kyoto Encyclopedia of Genes and Genomes) enrichment analysis to identify the FN1-related signaling pathways in HNSCC. GO analysis includes 3 aspects: biological process (BP), cellular component (CC) and molecular function (MF). Enrichment analysis was performed using R packages “clusterProfiler”, “org.Hs.eg.db”, “enrichplot”, and “ggplot2”. The results were visualized as bar plots and bubble plots. Gene Set Enrichment Analysis (GSEA)34 was also performed using online tool Xiantao Academic (www.xiantao.love) by dividing TCGA-HNSCC patients into 2 groups according to the median expression value of FN1 to further define the possible FN1-related molecular mechanisms in HNSCC tumorigenesis. The gene set c2.cp.v7.2.symbols.gmt was selected for analysis. For each analysis, the number of gene set permutations was set to 1000. | Normalized enrichment score (NES) | > 3, the nominal (NOM) P value <0.05 and the false discovery rate (FDR) <0.1 were considered statistically significant.
Statistical Analyses
All statistical analyses were conducted using GraphPad Prism 9 (GraphPad Software, Inc., CA, USA). All experiments were repeated at least three times independently, and data are presented as the mean ± standard deviation (SD). The significant difference between the two groups was determined by Student’s t-test. The one-way ANOVA test was employed for comparison of more than two groups. Spearman correlation and Pearson Chi-squared tests were performed to assess the statistical significance of correlations between two variables. ROC curve was generated using the pROC package in R software. Kaplan–Meier method was used to estimate the survival curve and tested by the Log rank test to calculate the HR and log-rank P-value. Univariate and multivariate analyses were carried out using Cox proportional hazards regression model to identify risk factors and their HRs and 95% confidence intervals (CIs) related to HNSCC patient death. A two-tailed P<0.05 was considered statistically significant.
Results
FN1 is Overexpressed in HNSCC
The differential FN1 expression data were first extracted from TIMER2.0 to have a general overview of FN1 expression at the pan-cancer scale. FN1 was found to be significantly elevated in BRCA, GBM, HNSCC (red box), KIRC, LIHC, STAD, THCA, COAD, LIHC and PCPG (Figure 1A). Similarly, the results of Oncomine revealed that FN1 was overexpressed in 16 different tumors (Figure 1B). It is worthy mentioned that 7 datasets from 8 different analyses in Oncomine showed that FN1 was highly expressed in HNSCC compared to nontumor tissue. The detailed results of FN1 expression in HNSCC from Oncomine are summarized in Supplementary Figure S1.
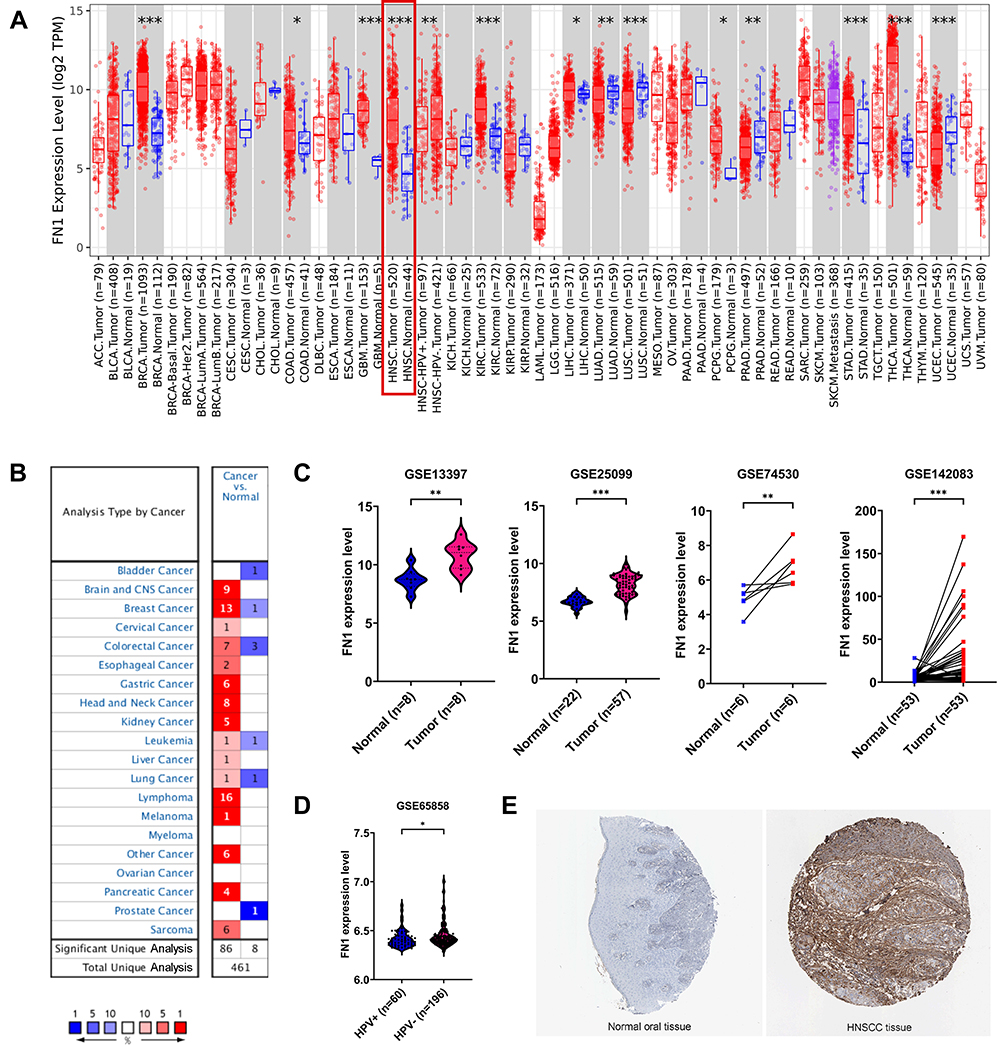 |
Figure 1 FN1 mRNA and protein levels were elevated in HNSCC. (A) FN1 expression patterns across different tumor types in TIMER. The red box represents HNSCC. (B) FN1 expression patterns across different tumor types in Oncomine. The red box represents HNSCC. The number in each cell present the number of datasets. (C) FN1 expression levels in HNSCC and normal tissues in GSE13397, GSE25099, GSE74530 and GSE142083 dataset. (D) FN1 expression levels in HPV+ and HPV- HNSCC in GSE65858. (E) FN1 protein expression levels in HNSCC and normal tissues, determined by immunohistochemistry staining from HPA website. The results are presented as the mean ± SD, *P < 0.05, **P < 0.01, ***P < 0.001. |
To better evaluate the FN1 expression in HNSCC, GEO data was applied. We found that FN1 mRNA expression level was higher in HNSCC tissue compared to nontumor tissue (Figure 1C). Interestingly, both TCGA and GEO data showed that the expression level of FN1 was significantly higher in human papilloma virus (HPV) negative HNSCC patients than HPV positive group, implying a potential association with HPV infection (Figure 1A and D). Similarly, the immunohistochemical data from HPA database showed that FN1 was almost not expressed in normal oral epithelial tissue, while HNSCC tissue had a moderate-to-strong staining (Figure 1E). Taken together, the results from multiple databases demonstrated that FN1 is elevated in HNSCC at both mRNA level and protein level.
High Expression of FN1 Predicted Advanced Malignancy and Poor Prognosis in Patients with HNSCC
Clinical information from TCGA-HNSCC dataset was utilized to examine the correlation between FN1 expression and clinicopathological features of HNSCC cases. As shown in Figure 2A–F, although no significant correlation was observed between FN1 expression and age, gender and T stage, patients with advanced histologic grades, clinical stages and N stages were more likely to overexpress FN1. Next, we evaluated the diagnostic value of FN1 using the ROC curve. The results showed that the area under the curve (AUC) of FN1 was 0.869 (Figure 2G), indicating a satisfactory diagnostic performance of FN1 in HNSCC. By dividing patients into high FN1 expression and low FN1 expression groups, we analyzed the prognostic value of FN1 in HNSCC. According to the survival plots generated using TCGA and GEO dataset (GSE65858), higher FN1 expression was significantly associated with unfortunate prognosis in HNSCC cases (TCGA OS: HR = 1.330, 95% CI = 1.020–1.735, P = 0.036; GSE65858 OS: HR = 1.513, 95% CI = 1.010–2.267, P=0.045) (Figure 2H and I). In addition, the expression level of FN1 differs according to HPV status as mentioned above. We thus investigate its effect on the prognosis in HPV positive and HPV negative HNSCC patients, respectively. By analyzing one of the largest HNSCC datasets in GEO (GSE65858), we found that FN1 was correlated with poor prognosis of HPV-HNSCC patients, while such association was not observed in HPV+ group (Figure 2J and K). Hence, we speculated that FN1 was inversely related to HPV infection in HNSCC patients.
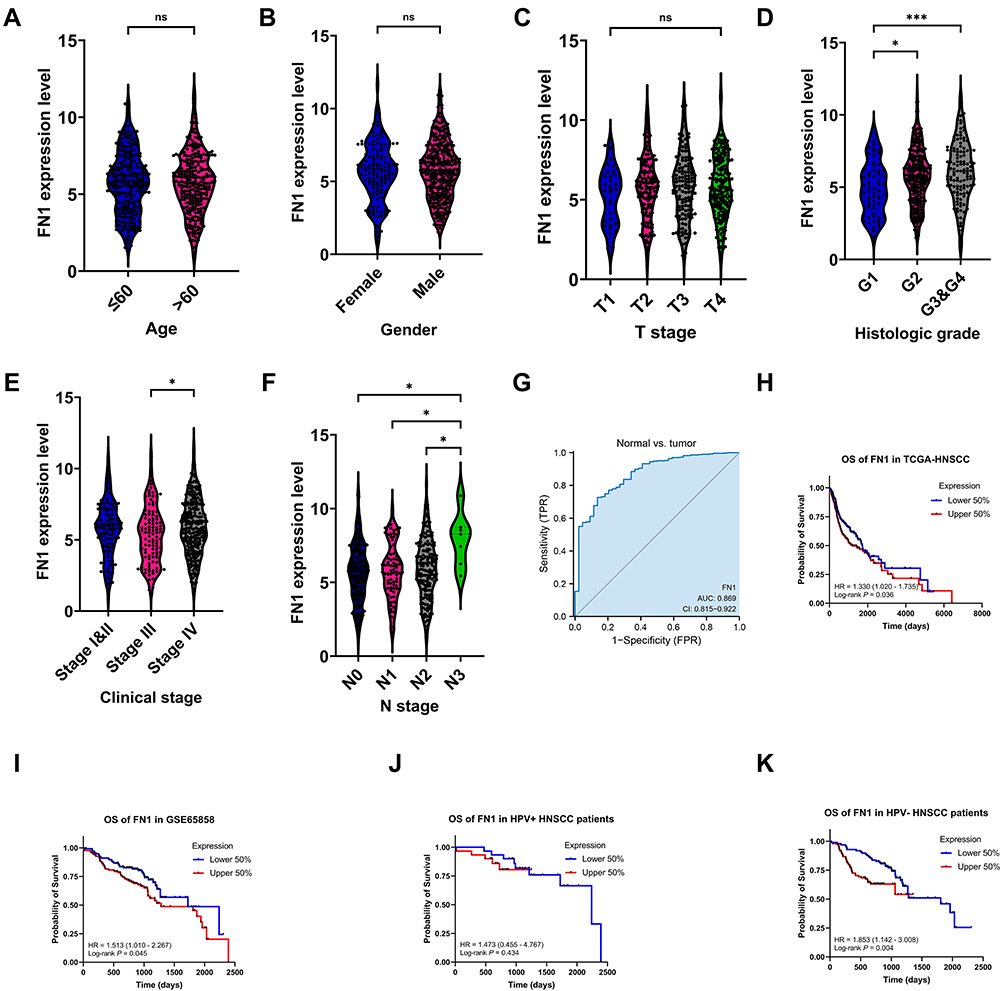 |
Figure 2 High expression of FN1 predicted advanced malignancy and poor prognosis in patients with HNSCC. (A–F) Relationship between FN1 expression and age, gender, T stage, histologic grade, clinical stage, and N stage of HNSCC patients. (G) Diagnostic value of FN1 in HNSCC. (H) OS of FN1 in HNSCC patients from TCGA. (I) OS of FN1 in HNSCC patients from GSE65858. (J) OS of FN1 in HPV+ HNSCC patients from GSE65858. (K) OS of FN1 in HPV- HNSCC patients from GSE65858. The results are presented as the mean ± SD. *P < 0.05, ***P < 0.001. Abbreviation: ns, not significant. |
As we have discovered that upregulated FN1 is related to worse prognosis in HNSCC, we tried to figure out whether FN1 is an independent prognostic factor of HNSCC. Cox univariate survival analysis indicated that N stage (P = 0.026), lymphovascular invasion (P = 0.002) and FN1 expression (P = 0.037) were significant characteristics affecting the OS of HNSCC patients (Table 2). The results of multivariate Cox regression analysis revealed that all 3 characteristics were independent predictors of poor survival in HNSCC patients (all P<0.05). Consequently, our study suggested that FN1 expression positively correlates with increased malignancy and poor prognosis of HNSCC patients.
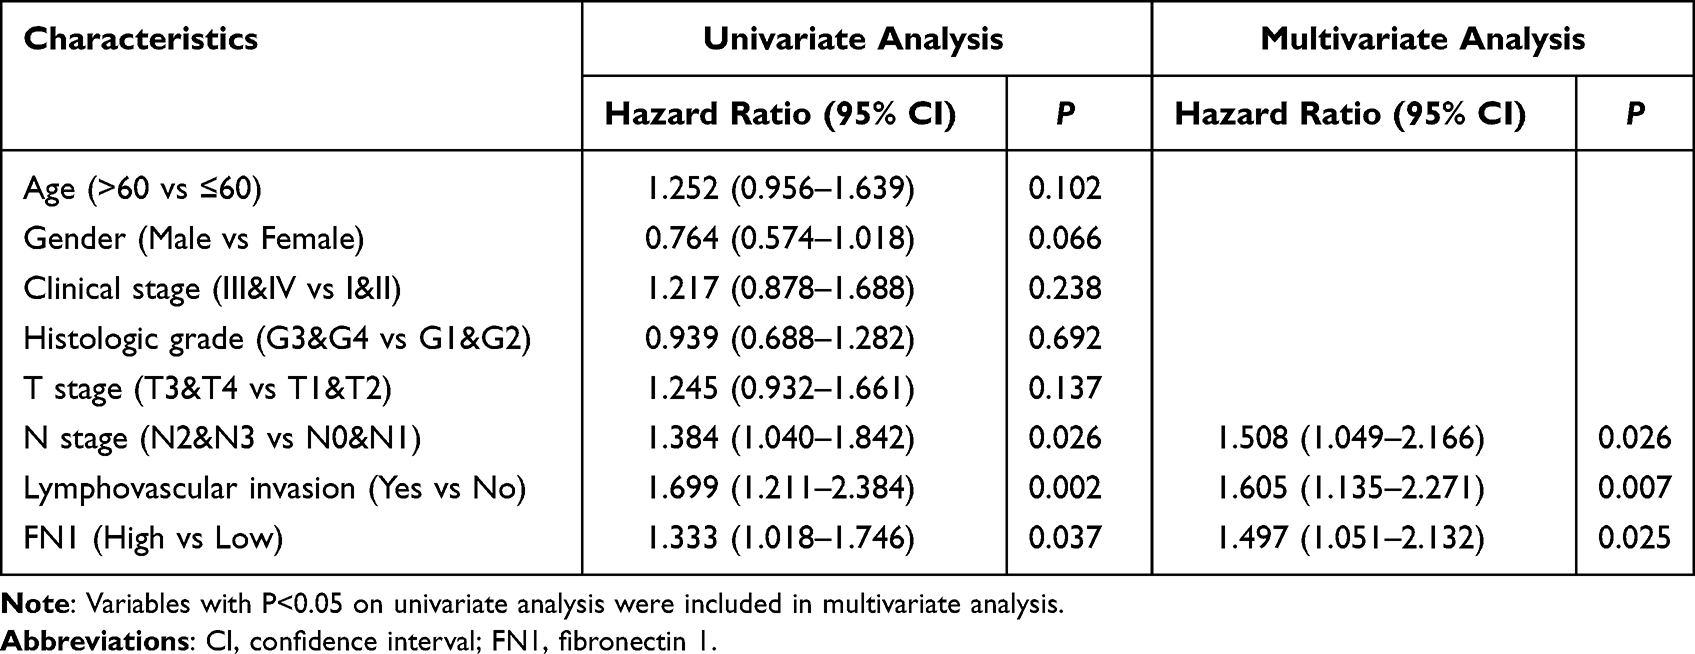 |
Table 2 Univariate and Multivariate Cox Regression Analysis of Overall Survival for HNSCC Patients |
Knockdown of FN1 Inhibits Proliferation, Migration and Invasion of HNSCC Cells
To investigate the potential biological function of FN1 in HNSCC, we used three independent siRNAs to knock down FN1 in HNSCC cells. After 24 h transfection, si-FN1#3 was found to most effectively reduce the FN1 expression at mRNA level (Figure 3A, all P < 0.001). As a result, si-FN1#3 was selected for the following experiments.
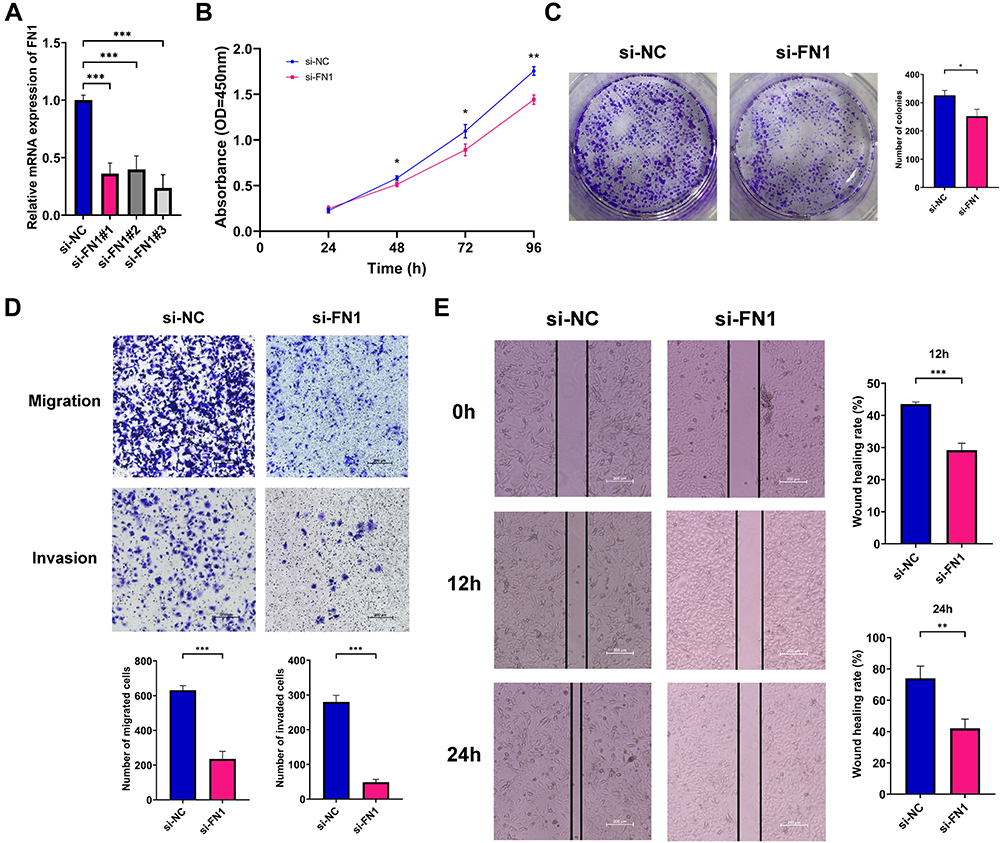 |
Figure 3 Effects of FN1 on the proliferation, migration and invasion of HNSCC cells. (A) qRT-PCR examining FN1 knockout efficiency in HNSCC cells; (B) cell proliferation of transfected HNSCC cells quantified by CCK-8 assays; (C) cell proliferation of transfected HNSCC cells quantified by colony formation assays; (D) cell migration and invasion of transfected HNSCC cells quantified by Transwell assays; (E) cell migration and invasion of transfected HNSCC cells quantified by wound healing assay assays; The results are presented as the mean ± SD, *P < 0.05 compared with the NC group, **P < 0.01 compared with the NC group, ***P < 0.001 compared with the NC group. |
CCK-8 and colony formation assays were performed to examine the effects of FN1 on cell vitality. As shown in Figure 3B, compared with si-NC group, HNSCC cell viability was decreased with FN1 silencing (48 h P = 0.03, 72 h P = 0.02, 96 h P = 0.002). Consistent with the CCK-8 results, the number of cell colonies in the si-FN1 group were remarkably less than those in the si-NC group (Figure 3C, P = 0.01).
Then, we measured cell migration and invasion ability of transfected HNSCC cells via Transwell and wound healing assays. The results of the Transwell assays showed that FN1 downregulation could result in a significant reduction in the number of migrated or invaded HNSCC cells (Figure 3D, both P < 0.001). Additionally, the wound healing rates were significantly decreased with FN1 knockdown at both 12 h and 24 h in comparison with negative control group (Figure 3E, 12 h P = 0.005, 24 h P < 0.001). Thus, it is indicated that FN1 knockdown could dramatically inhibit the proliferation, migration and invasion of HNSCC cells to mitigate cancer progression.
FN1 Contributes to Immune Infiltration and Facilitates Macrophage M2 Polarization in HNSCC
We first applied the ESTIMATE algorithm to analyze whether FN1 expression linked to the immune infiltration level in HNSCC. Figure 4A shows an obvious positive association between FN1 and Immunescore in HNSCC patients (P = 5.34e-05). Through TIMER2.0, we then discovered that high FN1 expression in HNSCC had the most significant correlation with infiltrating level of macrophage (Cor = 0.457, P = 2.35E−26). CD8+ T cell, however, seemed to have no relation with the expression level of FN1 (Cor = 0.017, P = 7.07E−01) (Figure 4B). Data from CIBERSORT analysis yielded a similar result, showing that various TIICs are increased in the high FN1 expression group (Figure 4C).
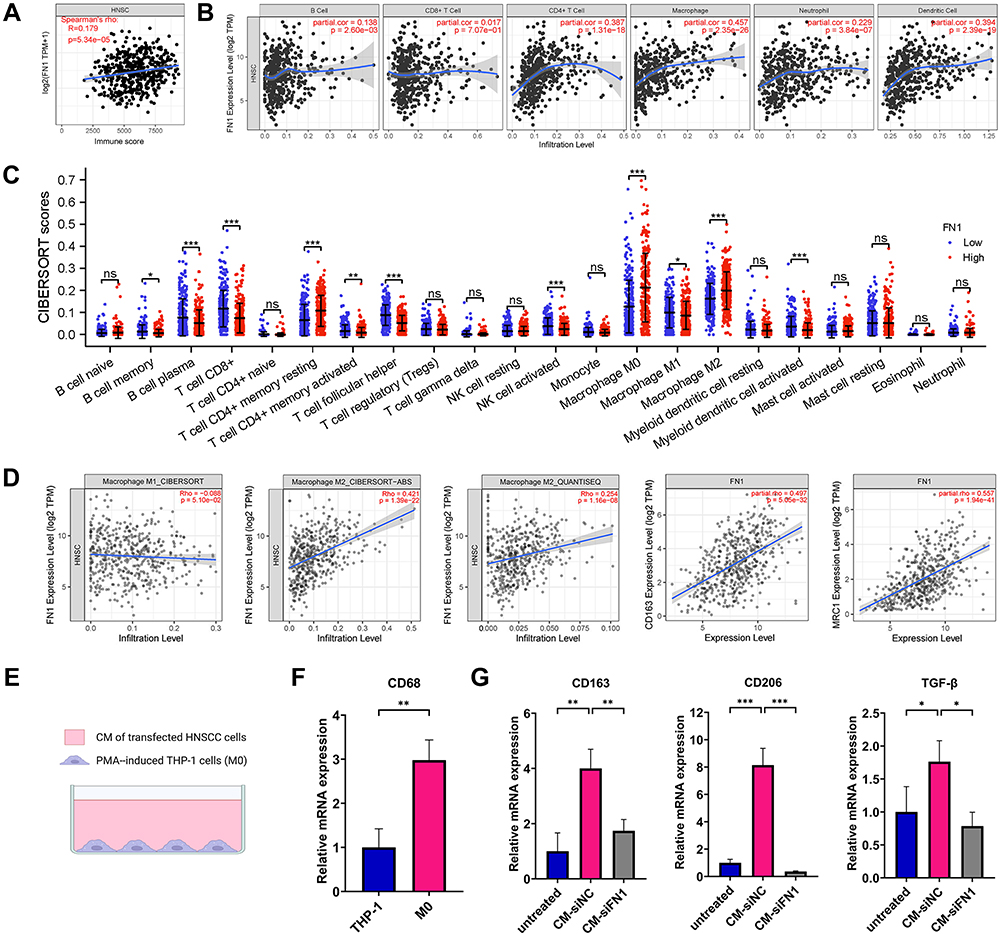 |
Figure 4 FN1 contributes to immune infiltration and facilitates macrophage M2 polarization in HNSCC. (A) The association between FN1 expression and the Immunescore of HNSCC patients using ESTIMATE algorithm. (B) Correlation between FN1 expression level and immune infiltrating levels based on TIMER database. (C) Immune cell infiltration level in high FN1 expression group and low FN1 expression group using CIBERSORT algorithm. (D) Correlation between FN1 expression and macrophage. (E) A sketch for the PMA-induced THP-1 cells and HNSCC cells coculture system. (F) CD68 was upregulated in M0 macrophages compared with THP-1 cells. (G) Knockdown of FN1 in HNSCC cells inhibits macrophage M2 polarization. The results are presented as the mean ± SD, *P < 0.05, **P < 0.01, ***P < 0.001. Abbreviation: ns, not significant. |
As shown in Figure 4B and C, in HNSCC, macrophage seems to be the cell type most effected by FN1 expression. Therefore, we further studied the association between FN1 and macrophage in TIMER2.0. Notably, the data obtained using three different algorithms (CIBERSOFT, CIBERSOFT-ABS and QUANTISEQ) suggested that FN1 is strongly correlated with M2 macrophage infiltration level while exhibiting no relationship with M1 macrophage in HNSCC. Furthermore, a positive correlation between two widely accepted M2 macrophage markers and FN1 expression in HNSCC was identified in TIMER2.0 database (CD163: spearman’s rho = 0.497, P = 5.05E−32; spearman’s rho = 0.557, P = 2.39E−19) (Figure 4D).
Next, we verify the correlation through an in vitro study. A sketch for the o-culture system is shown in Figure 4E. PMA was utilized to differentiate monocytic THP-1 into resting macrophage (M0). The upregulated mRNA levels of M0 macrophage marker CD68 were examined using qRT-PCR (Figure 4F, P = 0.005). To explore whether the knockdown of FN1 in HNSCC cells contributes to the process of M2 macrophage polarization, CM of transfected HNSCC cells was used to incubate M0 macrophages for 72 h. Untreated M0 macrophages were used as the negative control group. The mRNA levels of several M2 macrophage markers (CD163, CD206 and TGF-β) were markedly upregulated after treatment with CM of si-NC transfected HNSCC cells, while significantly downregulated in the si-FN1 group (Figure 4G, all P < 0.05). Altogether, these results imply that FN1 may be an inducer of macrophage M2 polarization in HNSCC.
FN1 Co-Expression Network in HNSCC
FN1 co-expression network in HNSCC was analyzed using LinkedOmics database. The heat maps of the top 50 genes co-expressed with FN1 in HNSCC are displayed as Figure 5A and B, respectively. As plotted in Figure 5C, a total of 20,163 positively correlated genes (shown as dark red dots) and 9518 negatively correlated genes (shown as dark green dots) were yielded. The full list of FN1 co-expressed genes in HNSCC is attached to the Supplementary Table S4. We also explored FN1-interacted proteins via GeneMANIA and constructed a PPI network of FN1 based on the top 20 significant proteins. Proteins co-expressed with FN1 include HGF (hepatocyte growth factor), COL1A1, TGM2 (transglutaminase 2), KLK3 (kallikrein-related peptidase 3) and COL8A1 (Collagen Type VIII Alpha 1 Chain). The PPI network also showed that various crucial biological functions, such as extracellular matrix organization, secretory granule, extracellular matrix disassembly and platelet activation, were intimately associated with FN1 (Figure 5D).
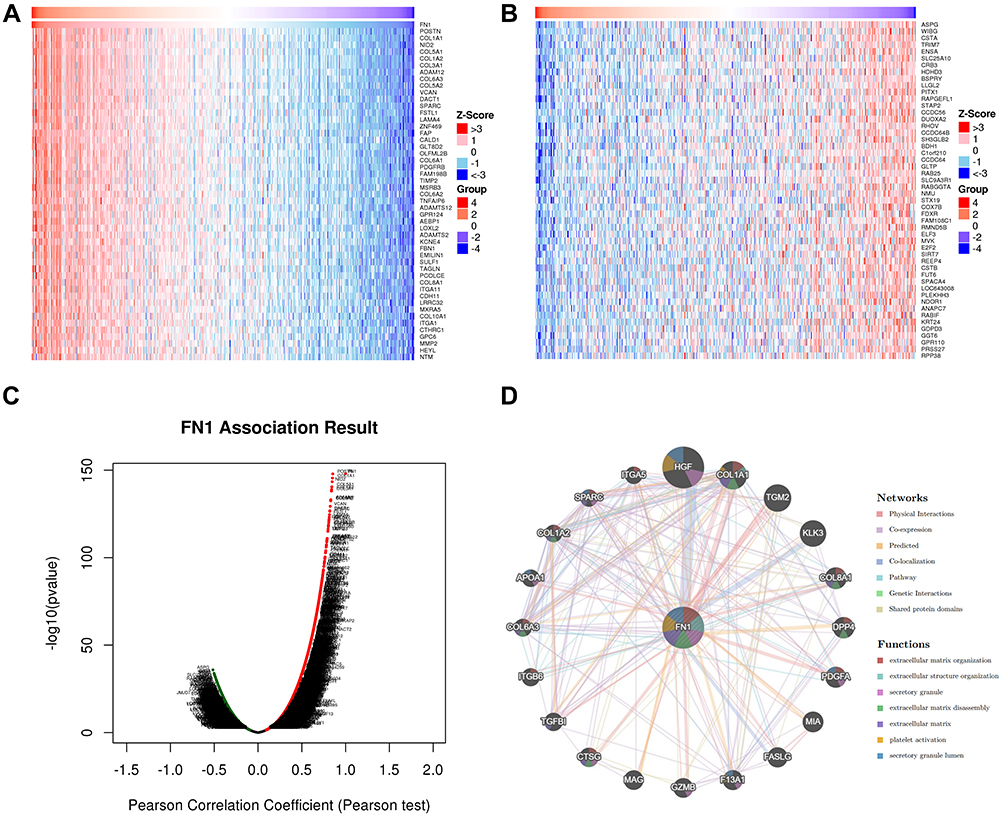 |
Figure 5 FN1 co-expression network in HNSCC. (A) Heatmap of top 50 genes positively related to FN1 in HNSCC. (B) Heatmap of top 50 genes negatively related to FN1 in HNSCC. (C) Volcano plot of whole significantly associated genes with FN1 distinguished by Pearson test in HNSCC. (D) PPI network of FN1 using GeneMANIA. Different colors of the network edge indicate the bioinformatics methods applied. Different colors for the network nodes indicate the biological functions of the set of enrichment genes. The top 7 most significant functions were displayed. |
FN1 is Involved in Cell Adhesion, Tumorigenesis and HPV Infection in HNSCC
By only including genes with a correlation coefficient of greater than 0.3, a total of 2843 co-expressed genes were obtained. The GO&KEGG pathway analysis was performed to identify the functions and pathways of FN1-coexpressed genes involved in HNSCC. The first 10 items in each group of GO enrichment and the first 30 items in KEGG pathway were presented by bar plots and bubble plots, respectively (Figure 6A and B, Supplementary Figure S2). We found that functions and pathways related to cell adhesion were significantly enriched, including “extracellular matrix organization”, “collagen-containing extracellular matrix”, “extracellular matrix structural constituent”, “cell−matrix adhesion”, “focal adhesion”, “cell adhesion molecules” and “ECM−receptor interaction”. Meanwhile, the most enriched KEGG pathway includes two widely acknowledged oncogenic pathways, “PI3K-Akt signaling pathway” and “MAPK signaling pathway”. KEGG also shows a strong correlation between FN1 and HPV infection, which is in line with our results above.
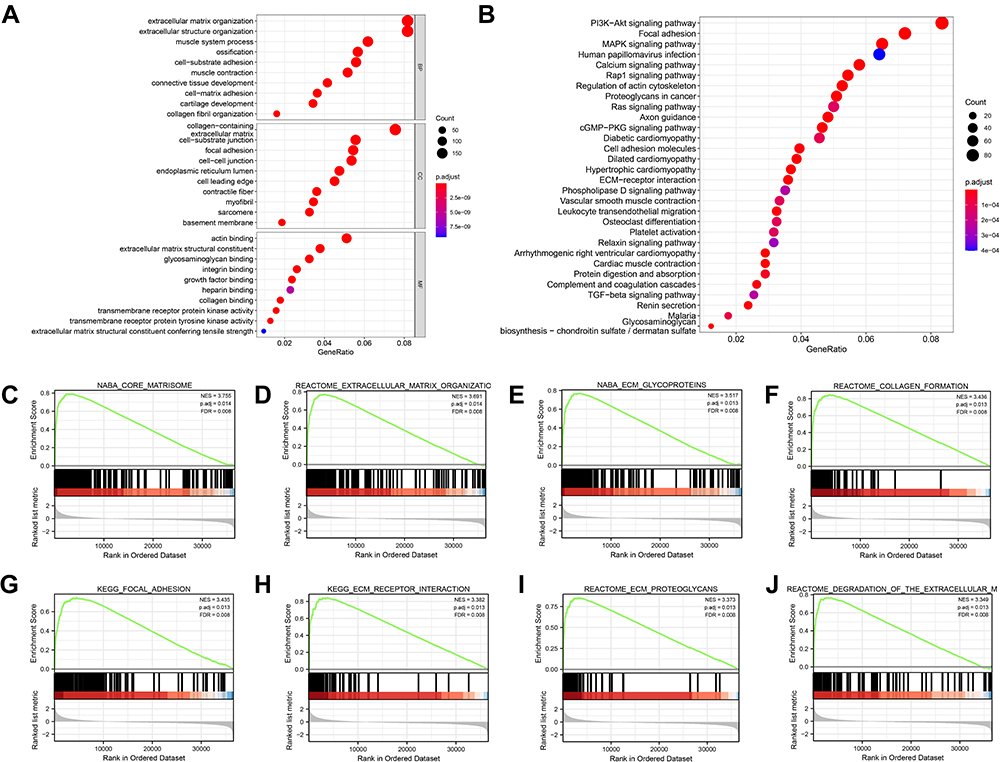 |
Figure 6 FN1 is involved in cell adhesion, immune activities and tumorigenesis in HNSCC. (A) GO enrichment bubble plot of FN1 and related genes. BP: biological process; CC: cellular component; MF: molecular function. (B) KEGG pathway bubble plot of FN1 and related genes. (C-J) GSEA results of FN1. The terms “core matrisome”, “extracellular matrix organization”, “ECM glycoproteins”, “collagen formation”, “focal adhesion”, “ECM receptor interaction”, “ECM proteoglycans” and “degradation of the extracellular matrix” were enriched in the FN1 high expression group in HNSCC patients. |
Furthermore, GSEA was conducted between samples with low and high FN1 expression to further define the FN1-associated signaling pathways in HNSCC. A total of 26 terms were significantly enriched in the high FN1 expression phenotype under the conditions of NOM P < 0.05, FDR q < 0.1 and |NES| > 3. Figure 6C–J exhibited the top 8 significantly terms. A summary of GSEA enrichment results is shown in Supplementary Table S3. Overall, the enrichment analysis data revealed that FN1 and its co-expressed genes may be involved in cell adhesion processes, oncogenic signaling pathways and HPV infection in HNSCC.
Discussion
As one of the most morbid and frequently lethal malignancy problems,35 HNSCC remains a major medical challenge worldwide, which highlights the importance of an improved understanding of HNSCC development. FN1, a high molecular weight extracellular matrix glycoprotein, is reported to mediate a variety of cell biological events like cell proliferation, cell attachment, cell motility, embryogenesis and extracellular matrix (ECM) assembly.9 Despite many studies discussing the relationship between FN1 and malignant tumors,36–38 its clear roles in HNSCC progression are yet to be elucidated. The present study was thus undertaken to comprehensively illustrate the biological effect of FN1 on HNSCC. Collectively, the results of our study seem to indicate that FN1 promotes cancer progression and is associated with M2 macrophage infiltration in HNSCC.
By analyzing the TCGA database and multiple GEO datasets, we firstly demonstrated that FN1 was overexpressed in HNSCC. This agrees with the FN1 protein expression in HNSCC tissues from The HPA website based on IHC analysis. Moreover, we found that upregulation of FN1 was positively associated with more advanced malignancy of HNSCC patients and led to poor prognosis. Importantly, multivariate Cox regression analysis further determined FN1 as an independent risk factor for HNSCC, predicting unfavorable overall survival for HNSCC patients. Hence, it is reasonable to consider that FN1 is involved in the malignant biological behaviors of HNSCC. As a result, we explored the effect of FN1 on HNSCC cells by suppressing FN1 expression in vitro. Our data revealed that FN1 depletion resulted in decreased proliferation, migration and invasion of HNSCC cells. Similar effects of FN1 had also been found in some previous studies on different tumors.39,40 In summary, the overexpression of FN1 promotes cancer development and could serve as a potential biomarker in HNSCC patients.
TME is a complex milieu and ecosystem where cancer cells depend on for sustained growth, invasion and metastasis.41 Accumulation of data has revealed that the immune status of TME is a key factor affecting cancer initiation and progression, and acts as a potential efficient prognosticator for HNSCC patients.42,43 TAMs are the most abundant immune cell types in the TME44 and are mostly displayed as M2 phenotypes in HNSCC.45 Compelling evidence has shown that TAM participates in multiple biological events including epithelial–mesenchymal transition, immune escape, tumor angiogenesis and cancer metastases.46–50 Moreover, recent studies have presented convincing evidence that copious M2 macrophages in TME are significantly associated with deteriorated OS in HNSCC patients.51–55 Through establishing a co-culture system using CM of FN1-deficient HNSCC cells, we observed an obvious decrease in the expression of M2 macrophage markers. These results suggest that FN1 may induce macrophage M2 polarization in HNSCC. This may partially explain why higher FN1 expression contributes to a worsened outcome in HNSCC patients. In thyroid cancer, overexpression of FN1 is found to be strongly correlated with the infiltration levels of M2 macrophages.56 Similar results were also acquired from a study in Switzerland, showing that FN1 was linked to the M2 TAM phenotype in renal carcinoma, associated with poor survival and increased tumor stage.57 Consistently, Yoshida et al58 revealed that cellular FN1 promoted the secretion level of M2 marker (interleukin-10, IL-10) and reduced M1 marker (tumor necrosis factor-alpha, TNF-α) in macrophages in a concentration-dependent manner. In fact, FN1 has been identified as a novel M2 marker in several studies.59,60 Taken together, our analysis clearly shows that the increased expression of FN1 has potential involvement in macrophage polarization, and might be a promising immunotherapy target.
Further exploration is needed for the precise mechanism underlying the molecular functions of FN1 in HNSCC. Through LinkedOmics database, nearly 30,000 genes correlate with FN1 in HNSCC were selected. Functional enrichment analysis based on co-expressed genes showed that FN1 was involved in cell adhesion in HNSCC patients. Cell adhesion is of vital importance for controlling tissue integrity and is also one of the vital mechanisms underlying cancer invasion and metastasis. Distant metastasis remains a major determinant when it comes to the prognosis of HNSCC patients.61 Our findings support the hypothesis that FN1 may promote metastases in HNSCC by regulating adhesion between the ECM and tumor cells. Our results were corroborated by an in vivo study in which ovarian cancer cells displayed decreased metastasis in mice bearing a tissue-specific deletion of FN1 in the lining of the peritoneal cavity.9 Although we were unable to confirm the relationship between FN1 and metastases in HNSCC by now, additional investigations are warranted to explore this essential topic in the future. On the other hand, signaling pathways including “PI3K-Akt”, “MAPK” and “Rap1” have been proved to promote cancer progression in HNSCC.62–64 In this study, we found that these signaling pathways were remarkably enriched by FN1. Thus, it is possible that FN1 participates in the carcinogenic process of HNSCC by affecting signaling pathways like “PI3K-Akt” and “MAPK”. One finding of great interest in the current study was the relationship between FN1 and HPV infection. In gene expression analysis and survival analysis, we discovered that FN1 was higher expressed in HPV-patients and had greater impact on their prognosis. On the other hand, no substantial correlation was observed between FN1 and the survival of HPV+ patients, which allows us to speculate that FN1 may be a protective factor of HPV infection. Although we were unable to determine the underlying mechanism by now, we plan to explore this essential topic in future studies.
Nevertheless, it is undeniable that there are several potential limitations that should be taken into consideration when interpreting the results of the current analysis. First, although bioinformatics analysis revealed that FN1 was highly expressed in HNSCC, additional prospective clinical trials with large population are still warranted to validate our results. Secondly, we have only predicted the FN1-related signaling pathways based on online databases. In addition, animal study is not performed due to limited money and time.
Conclusion
Within the limitations of the present study, we provide evidence that overexpression of FN1 contributes to tumor progression by directly promoting malignant behaviors of HNSCC cells. In addition, it was indicated that FN1 could also regulate macrophage M2 polarization. Our work highlighted the clinical significance of upregulated FN1 in the progression of HNSCC, and laid a theoretical basis for further exploring novel FN1-based cancer strategies for HNSCC patients.
Ethics Approval and Informed Consent
All methods in this study were carried out in accordance with relevant guidelines and regulations. All human data in the current study were retrieved from open public databases, which can be downloaded freely by users for scientific research and publication. No ethical issues were involved. Hence, this study was exempted from review by The Ethics Committee of School of Stomatology, China Medical University.
Acknowledgments
We would like to thank the co-workers of our lab for critical reading of the manuscript and some helpful discussions and friendly support they kindly give.
Author Contributions
All authors made a significant contribution to the work reported, whether that is in the conception, study design, execution, acquisition of data, analysis and interpretation, or in all these areas; took part in drafting, revising or critically reviewing the article; gave final approval of the version to be published; have agreed on the journal to which the article has been submitted; and agree to be accountable for all aspects of the work.
Disclosure
The authors report no conflicts of interest in this work.
References
1. Bray F, Ferlay J, Soerjomataram I, Siegel RL, Torre LA, Jemal A. Global cancer statistics 2018: GLOBOCAN estimates of incidence and mortality worldwide for 36 cancers in 185 countries. CA Cancer J Clin. 2018;68(6):394–424. doi:10.3322/caac.21492
2. Siegel RL, Miller KD, Jemal A. Cancer statistics, 2018. CA Cancer J Clin. 2018;68(1):7–30. doi:10.3322/caac.21442
3. Blot WJ, McLaughlin JK, Winn DM, et al. Smoking and drinking in relation to oral and pharyngeal cancer. Cancer Res. 1988;48(11):3282–3287.
4. Cohen EE, LaMonte SJ, Erb NL, et al. American cancer society head and neck cancer survivorship care guideline. CA Cancer J Clin. 2016;66(3):203–239. doi:10.3322/caac.21343
5. Li CY, Cai JH, Tsai JJP, Wang CCN. Identification of hub genes associated with development of head and neck squamous cell carcinoma by integrated bioinformatics analysis. Front Oncol. 2020;10:681. doi:10.3389/fonc.2020.00681
6. Pankov R, Yamada KM. Fibronectin at a glance. J Cell Sci. 2002;115(Pt 20):3861–3863. doi:10.1242/jcs.00059
7. Zollinger AJ, Smith ML. Fibronectin, the extracellular glue. Matrix Biol. 2017;60–61:27–37. doi:10.1016/j.matbio.2016.07.011
8. Lieverse RIY, Marcus D, van der Wiel AMA, et al. Human fibronectin extra domain B as a biomarker for targeted therapy in cancer. Mol Oncol. 2020;14(7):1555–1568. doi:10.1002/1878-0261.12705
9. Efthymiou G, Saint A, Ruff M, Rekad Z, Ciais D, Van Obberghen-Schilling E. Shaping up the tumor microenvironment with cellular fibronectin. Front Oncol. 2020;10:641. doi:10.3389/fonc.2020.00641
10. Glasner A, Levi A, Enk J, et al. NKp46 receptor-mediated interferon-γ production by natural killer cells increases fibronectin 1 to alter tumor architecture and control metastasis. Immunity. 2018;48(1):107–119.e104. doi:10.1016/j.immuni.2017.12.007
11. Li M, Wang K, Pang Y, et al. Secreted phosphoprotein 1 (SPP1) and fibronectin 1 (FN1) are associated with progression and prognosis of esophageal cancer as identified by integrated expression profiles analysis. Med Sci Monit. 2020;26:e920355. doi:10.12659/MSM.920355
12. Liang H, Yu M, Yang R, et al. A PTAL-miR-101-FN1 axis promotes EMT and invasion-metastasis in serous ovarian cancer. Mol Ther Oncolytics. 2020;16:53–62. doi:10.1016/j.omto.2019.12.002
13. Jiang K, Liu H, Xie D, Xiao Q. Differentially expressed genes ASPN, COL1A1, FN1, VCAN and MUC5AC are potential prognostic biomarkers for gastric cancer. Oncol Lett. 2019;17(3):3191–3202. doi:10.3892/ol.2019.9952
14. Wang S, Gao B, Yang H, Liu X, Wu X, Wang W. MicroRNA-432 is downregulated in cervical cancer and directly targets FN1 to inhibit cell proliferation and invasion. Oncol Lett. 2019;18(2):1475–1482. doi:10.3892/ol.2019.10403
15. Li L, Zhu Z, Zhao Y, et al. FN1, SPARC, and SERPINE1 are highly expressed and significantly related to a poor prognosis of gastric adenocarcinoma revealed by microarray and bioinformatics. Sci Rep. 2019;9(1):7827. doi:10.1038/s41598-019-43924-x
16. Locati M, Curtale G, Mantovani A. Diversity, mechanisms, and significance of macrophage plasticity. Annu Rev Pathol. 2020;15(1):123–147. doi:10.1146/annurev-pathmechdis-012418-012718
17. Pang X, Wang SS, Zhang M, et al. OSCC cell-secreted exosomal CMTM6 induced M2-like macrophages polarization via ERK1/2 signaling pathway. Cancer Immunol Immunother. 2021;70(4):1015–1029. doi:10.1007/s00262-020-02741-2
18. Petruzzi MN, Cherubini K, Salum FG, de Figueiredo MA. Role of tumour-associated macrophages in oral squamous cells carcinoma progression: an update on current knowledge. Diagn Pathol. 2017;12(1):32. doi:10.1186/s13000-017-0623-6
19. Brown JM, Recht L, Strober S. The promise of targeting macrophages in cancer therapy. Clin Cancer Res. 2017;23(13):3241–3250. doi:10.1158/1078-0432.CCR-16-3122
20. Liang B, Tao Y, Wang T. Profiles of immune cell infiltration in head and neck squamous carcinoma. Biosci Rep. 2020;40(2). doi:10.1042/BSR20192724
21. Alves AM, Diel LF, Lamers ML. Macrophages and prognosis of oral squamous cell carcinoma: a systematic review. J Oral Pathol Med. 2018;47(5):460–467. doi:10.1111/jop.12643
22. Li T, Fu J, Zeng Z, et al. TIMER2.0 for analysis of tumor-infiltrating immune cells. Nucleic Acids Res. 2020;48(W1):W509–w514. doi:10.1093/nar/gkaa407
23. Rhodes DR, Yu J, Shanker K, et al. ONCOMINE: a cancer microarray database and integrated data-mining platform. Neoplasia. 2004;6(1):1–6. doi:10.1016/S1476-5586(04)80047-2
24. Edgar R, Domrachev M, Lash AE. Gene expression omnibus: NCBI gene expression and hybridization array data repository. Nucleic Acids Res. 2002;30(1):207–210. doi:10.1093/nar/30.1.207
25. Uhlen M, Zhang C, Lee S, et al. A pathology atlas of the human cancer transcriptome. Science. 2017;357(6352). doi:10.1126/science.aan2507
26. Wang J, Zhang X, Thomas SM, et al. Chemokine receptor 7 activates phosphoinositide-3 kinase-mediated invasive and prosurvival pathways in head and neck cancer cells independent of EGFR. Oncogene. 2005;24(38):5897–5904. doi:10.1038/sj.onc.1208740
27. Yoshihara K, Shahmoradgoli M, Martínez E, et al. Inferring tumour purity and stromal and immune cell admixture from expression data. Nat Commun. 2013;4(1):2612. doi:10.1038/ncomms3612
28. Li T, Fan J, Wang B, et al. TIMER: a web server for comprehensive analysis of tumor-infiltrating immune cells. Cancer Res. 2017;77(21):e108–e110. doi:10.1158/0008-5472.CAN-17-0307
29. Newman AM, Liu CL, Green MR, et al. Robust enumeration of cell subsets from tissue expression profiles. Nat Methods. 2015;12(5):453–457. doi:10.1038/nmeth.3337
30. Dan H, Liu S, Liu J, et al. RACK1 promotes cancer progression by increasing the M2/M1 macrophage ratio via the NF-κB pathway in oral squamous cell carcinoma. Mol Oncol. 2020;14(4):795–807. doi:10.1002/1878-0261.12644
31. Xiao M, Zhang J, Chen W, Chen W. M1-like tumor-associated macrophages activated by exosome-transferred THBS1 promote malignant migration in oral squamous cell carcinoma. J Exp Clin Cancer Res. 2018;37(1):143. doi:10.1186/s13046-018-0815-2
32. Vasaikar SV, Straub P, Wang J, Zhang B. LinkedOmics: analyzing multi-omics data within and across 32 cancer types. Nucleic Acids Res. 2018;46(D1):D956–d963. doi:10.1093/nar/gkx1090
33. Warde-Farley D, Donaldson SL, Comes O, et al. The GeneMANIA prediction server: biological network integration for gene prioritization and predicting gene function. Nucleic Acids Res. 2010;38(Web Server issue):W214–220. doi:10.1093/nar/gkq537
34. Subramanian A, Tamayo P, Mootha VK, et al. Gene set enrichment analysis: a knowledge-based approach for interpreting genome-wide expression profiles. Proc Natl Acad Sci U S A. 2005;102(43):15545–15550. doi:10.1073/pnas.0506580102
35. Cancer Genome Atlas Network. Comprehensive genomic characterization of head and neck squamous cell carcinomas. Nature. 2015;517(7536):576–582. doi:10.1038/nature14129
36. Sun Y, Zhao C, Ye Y, et al. High expression of fibronectin 1 indicates poor prognosis in gastric cancer. Oncol Lett. 2020;19(1):93–102. doi:10.3892/ol.2019.11088
37. Žlajpah M, Hauptman N, Boštjančič E, Zidar N. Differential expression of extracellular matrix‑related genes DCN, EPHA4, FN1, SPARC, SPON2 and SPP1 in colorectal carcinogenesis. Oncol Rep. 2019;42(4):1539–1548. doi:10.3892/or.2019.7274
38. Zhan S, Li J, Wang T, Ge W. Quantitative proteomics analysis of sporadic medullary thyroid cancer reveals FN1 as a potential novel candidate prognostic biomarker. Oncologist. 2018;23(12):1415–1425. doi:10.1634/theoncologist.2017-0399
39. Cai X, Liu C, Zhang TN, Zhu YW, Dong X, Xue P. Down-regulation of FN1 inhibits colorectal carcinogenesis by suppressing proliferation, migration, and invasion. J Cell Biochem. 2018;119(6):4717–4728.
40. Wang J, Deng L, Huang J, et al. High expression of fibronectin 1 suppresses apoptosis through the NF-κB pathway and is associated with migration in nasopharyngeal carcinoma. Am J Transl Res. 2017;9(10):4502–4511.
41. Oliver AJ, Lau PKH, Unsworth AS, et al. Tissue-dependent tumor microenvironments and their impact on immunotherapy responses. Front Immunol. 2018;9:70. doi:10.3389/fimmu.2018.00070
42. Farlow JL, Brenner JC, Lei YL, Chinn SB. Immune deserts in head and neck squamous cell carcinoma: a review of challenges and opportunities for modulating the tumor immune microenvironment. Oral Oncol. 2021;120:105420. doi:10.1016/j.oraloncology.2021.105420
43. Economopoulou P, Kotsantis I, Psyrri A. Tumor microenvironment and immunotherapy response in head and neck cancer. Cancers. 2020;12(11):3377. doi:10.3390/cancers12113377
44. Ireland LV, Mielgo A. Macrophages and fibroblasts, key players in cancer chemoresistance. Front Cell Dev Biol. 2018;6:131. doi:10.3389/fcell.2018.00131
45. Li Z, Liu FY, Kirkwood KL. The p38/MKP-1 signaling axis in oral cancer: impact of tumor-associated macrophages. Oral Oncol. 2020;103:104591. doi:10.1016/j.oraloncology.2020.104591
46. Suárez-Sánchez FJ, Lequerica-Fernández P, Suárez-Canto J, et al. Macrophages in oral carcinomas: relationship with cancer stem cell markers and PD-L1 expression. Cancers. 2020;12(7):1764. doi:10.3390/cancers12071764
47. Zhang J, Zhang Q, Lou Y, et al. Hypoxia-inducible factor-1α/interleukin-1β signaling enhances hepatoma epithelial-mesenchymal transition through macrophages in a hypoxic-inflammatory microenvironment. Hepatology. 2018;67(5):1872–1889. doi:10.1002/hep.29681
48. Wenes M, Shang M, Di Matteo M, et al. Macrophage metabolism controls tumor blood vessel morphogenesis and metastasis. Cell Metab. 2016;24(5):701–715. doi:10.1016/j.cmet.2016.09.008
49. Lin Y, Xu J, Lan H. Tumor-associated macrophages in tumor metastasis: biological roles and clinical therapeutic applications. J Hematol Oncol. 2019;12(1):76. doi:10.1186/s13045-019-0760-3
50. Wei C, Yang C, Wang S, et al. Crosstalk between cancer cells and tumor associated macrophages is required for mesenchymal circulating tumor cell-mediated colorectal cancer metastasis. Mol Cancer. 2019;18(1):64. doi:10.1186/s12943-019-0976-4
51. Bouaoud J, Foy JP, Tortereau A, et al. Early changes in the immune microenvironment of oral potentially malignant disorders reveal an unexpected association of M2 macrophages with oral cancer free survival. Oncoimmunology. 2021;10(1):1944554. doi:10.1080/2162402X.2021.1944554
52. Wehrhan F, Büttner-Herold M, Hyckel P, et al. Increased malignancy of oral squamous cell carcinomas (oscc) is associated with macrophage polarization in regional lymph nodes - an immunohistochemical study. BMC Cancer. 2014;14(1):522. doi:10.1186/1471-2407-14-522
53. Weber M, Iliopoulos C, Moebius P, et al. Prognostic significance of macrophage polarization in early stage oral squamous cell carcinomas. Oral Oncol. 2016;52:75–84. doi:10.1016/j.oraloncology.2015.11.001
54. Hu Y, He MY, Zhu LF, et al. Tumor-associated macrophages correlate with the clinicopathological features and poor outcomes via inducing epithelial to mesenchymal transition in oral squamous cell carcinoma. J Exp Clin Cancer Res. 2016;35(1):12. doi:10.1186/s13046-015-0281-z
55. Hadler-Olsen E, Wirsing AM. Tissue-infiltrating immune cells as prognostic markers in oral squamous cell carcinoma: a systematic review and meta-analysis. Br J Cancer. 2019;120(7):714–727. doi:10.1038/s41416-019-0409-6
56. Geng QS, Huang T, Li LF, Shen ZB, Xue WH, Zhao J. Over-expression and prognostic significance of FN1, correlating with immune infiltrates in thyroid cancer. Front Med. 2021;8:812278. doi:10.3389/fmed.2021.812278
57. Dannenmann SR, Thielicke J, Stöckli M, et al. Tumor-associated macrophages subvert T-cell function and correlate with reduced survival in clear cell renal cell carcinoma. Oncoimmunology. 2013;2(3):e23562. doi:10.4161/onci.23562
58. Yoshida Y, Kang K, Chen G, Gilliam AC, Cooper KD. Cellular fibronectin is induced in ultraviolet-exposed human skin and induces IL-10 production by monocytes/macrophages. J Invest Dermatol. 1999;113(1):49–55. doi:10.1046/j.1523-1747.1999.00623.x
59. Khan K, Long B, Deshpande GM, Fox PL. Bidirectional tumor-promoting activities of macrophage Ezrin. Int J Mol Sci. 2020;21(20):7716. doi:10.3390/ijms21207716
60. Rahal OM, Wolfe AR, Mandal PK, et al. Blocking interleukin (IL)4- and IL13-mediated phosphorylation of STAT6 (Tyr641) decreases M2 polarization of macrophages and protects against macrophage-mediated radioresistance of inflammatory breast cancer. Int J Radiat Oncol Biol Phys. 2018;100(4):1034–1043. doi:10.1016/j.ijrobp.2017.11.043
61. Takes RP, Rinaldo A, Silver CE, et al. Distant metastases from head and neck squamous cell carcinoma. Part I. basic aspects. Oral Oncol. 2012;48(9):775–779. doi:10.1016/j.oraloncology.2012.03.013
62. Liu M, Banerjee R, Rossa C
63. Liu FY, Safdar J, Li ZN, et al. CCR7 regulates cell migration and invasion through MAPKs in metastatic squamous cell carcinoma of head and neck. Int J Oncol. 2014;45(6):2502–2510. doi:10.3892/ijo.2014.2674
64. Liu FY, Zhao ZJ, Li P, Ding X, Zong ZH, Sun CF. Mammalian target of rapamycin (mTOR) is involved in the survival of cells mediated by chemokine receptor 7 through PI3K/Akt in metastatic squamous cell carcinoma of the head and neck. Br J Oral Maxillofac Surg. 2010;48(4):291–296. doi:10.1016/j.bjoms.2009.06.007
 © 2022 The Author(s). This work is published and licensed by Dove Medical Press Limited. The full terms of this license are available at https://www.dovepress.com/terms.php and incorporate the Creative Commons Attribution - Non Commercial (unported, v3.0) License.
By accessing the work you hereby accept the Terms. Non-commercial uses of the work are permitted without any further permission from Dove Medical Press Limited, provided the work is properly attributed. For permission for commercial use of this work, please see paragraphs 4.2 and 5 of our Terms.
© 2022 The Author(s). This work is published and licensed by Dove Medical Press Limited. The full terms of this license are available at https://www.dovepress.com/terms.php and incorporate the Creative Commons Attribution - Non Commercial (unported, v3.0) License.
By accessing the work you hereby accept the Terms. Non-commercial uses of the work are permitted without any further permission from Dove Medical Press Limited, provided the work is properly attributed. For permission for commercial use of this work, please see paragraphs 4.2 and 5 of our Terms.