")
Back to Journals » Cancer Management and Research » Volume 14
The Overexpression and Clinical Significance of AP1S1 in Breast Cancer
Authors Zheng D, Fu W, Jin L, Jiang X, Jiang W, Guan Y, Hao R
Received 13 November 2021
Accepted for publication 24 March 2022
Published 16 April 2022 Volume 2022:14 Pages 1475—1492
DOI https://doi.org/10.2147/CMAR.S346519
Checked for plagiarism Yes
Review by Single anonymous peer review
Peer reviewer comments 2
Editor who approved publication: Dr Beicheng Sun
Danni Zheng,1,* Weida Fu,1,* Lingli Jin,1,* Xiaofang Jiang,2 Wenjie Jiang,1 Yaoyao Guan,3 Rutian Hao1
1Department of Breast Surgery, The First Affiliated Hospital of Wenzhou Medical University, Wenzhou, Zhejiang, People’s Republic of China; 2Department of Neurology, The First Affiliated Hospital of Wenzhou Medical University, Wenzhou, Zhejiang, People’s Republic of China; 3Department of Plastic Surgery, Sir Run-Run Hospital Affiliated to Zhejiang University, Hangzhou, People’s Republic of China
*These authors contributed equally to this work
Correspondence: Yaoyao Guan, 3 Qingchun East Road, Jianggan District, Hangzhou, Zhejiang, People’s Republic of China, Tel +86 571-86006618, Fax +86 571-86044817, Email [email protected] Rutian Hao, South White Elephant Warm hospital first New Area, Ouhai District, Wenzhou, Zhejiang, People’s Republic of China, Tel +86 577 5557, Fax +86 577-55578033, Email [email protected]
Purpose: To explore the mechanism of AP1S1 in breast cancer.
Methods and Results: In different datasets, we found that AP1S1 is more highly expressed in breast tumors, which was furthermore verified in our local cohort.Immune infiltration analysis showed that AP1S1 was related to a variety of immune cells. The higher AP1S1 expression was negatively correlated with a variety of immune infiltrating cells, suggesting that AP1S1 may affect cellular immunity.Clinical analysis showed that patients with higher AP1S1 expression had higher estrogen receptor gene expression and were more prone to distant metastasis and lymph node metastasis.The overall survival rate, disease-specific survival rate, and progression-free interval time were worse in the group with higher AP1S1 expression. AP1S1 may be a potential oncogene of breast cancer, and overexpression is related to the poor prognosis of breast cancer.Therefore, a nomogram was constructed, along with correlated gene analysis and functional analysis to further explore the carcinogenic mechanism, practical clinical issues, and value of AP1S1.
Conclusion: AP1S1 is a potential oncogene of breast cancer.
Keywords: breast cancer, AP1S1, immune infiltration, prognosis, oncogene
Introduction
Breast cancer has overtaken lung cancer as the most common worldwide cancer according to 2020 cancer data on new cases.1 The global incidence of breast cancer is severe, increasing at a rate of ~0.5% per year.2 Breast cancer alone accounts for 30% of female cancers and is the primary cause of cancer deaths among women aged 20 to 59 years.1 Although current breast cancer treatment has good efficacy with the 5-year survival rate of early breast cancer reaching more than 95%, the survival rate of advanced breast cancer is not as optimistic. Therefore, early diagnosis and treatment are crucial for patients with breast cancer.3
In eukaryotic cells, protein transport between organelles is principally mediated by clathrin-coated vesicles whose assembly needs adaptor protein (AP) complexes.4,5 The AP complex determines the choice of protein cargo transported between the trans-Golgi network, endosome, lysosome, and plasma membrane.6 The AP-1 complex contains four subunits, β1, γ, δ1, and μ1.7 To date, there have been some serious genetic diseases caused by mutations in encoding genes of AP components. AP1S1, a member of the AP family, which encodes the subunit (σ1A) of the connexin complex (AP-1)8,9 affects clathrin coat assembly and transport between the trans-Golgi network, endosomes, and plasma membrane.10 It has been documented that the mutation or deletion of AP1S1 is inseparable from the occurrence of some diseases.9,10 Loss of AP1S1 function can cause intestinal epithelial barrier defects, while AP1S1 mutations can cause non-syndromic forms of congenital diarrhea.10 Some reports have shown that the mutation of AP1S1 might cause MEDNIK syndrome, characterized by an increase in the number of tryptase-positive mast cells.11,12 This served as a reminder that AP1S1 potentially also impacts immune cells.8,11,13 The other AP1 subunits have also been linked to specific conditions. For instance, AP1G1 contains a γ subunit related to the occurrence of the liver14 and colon cancers.15 The clathrin adaptor AP1 complex subunit μ1 (AP1M1) can promote the proliferation of hepatocellular carcinoma cells.16 AP1B1-deficient mice develop epithelial immune dysfunction.17 However, AP1S1 has not been studied in any form of cancer, and its role in breast cancer is unclear. Therefore, this study was aimed to elucidate the role of AP1S1 in breast malignant tumors.
Materials and Methods
Patients and Breast Tissue Samples Collection
We collected 37 surgical specimens from patients with breast cancer and normal tissues adjacent to the tumors. The breast cancer specimen was diagnosed as primary breast cancer by at least two pathologists. Baseline clinical data was obtained from all patients after signing an informed consent form. The study was reviewed and approved by the ethics committee of the First Affiliated Hospital of Wenzhou Medical University. The data on breast cancer mRNA expression was downloaded from the TCGA data portal (https://tcga-data.nci.nih.gov/tcga/).
RNA Extraction, Reverse Transcription, and RT‑qPCR
Total RNA was extracted from cells using TRIZOL reagent (Invitrogen, Waltham, MA, USA). The concentration and purity of RNA were detected at 260/280 nm using spectrophotometry (Thermo, San Jose, CA, USA), before performing reverse transcription (Toyobo, Osaka, Japan). A real-time PCR system (Applied Biosystems 7500; Thermo) was used for real-time reaction and analysis. The primers sequence used were as follows: AP1S1-F: TGCGAGCTGGACATCATCTTCAAC; AP1S1-R: GGCGACTCATCCTCCTCTTGC.
Characteristics Acquisition and Analysis
We obtained RNA-seq data and the corresponding clinical information from the TCGA database (https://cancergenome.nih.gov/). The clinicopathologic data of the verification cohort was obtained from the First Affiliated Hospital of Wenzhou Medical University. We divided the data obtained by TCGA and the local validation cohort into a high expression and low expression group according to the median of AP1S1 expression, before analyzing the correlation between AP1S1 expression and clinicopathological factors. GraphPad Prism v7.0 was used to analyze and compare the different expressions of each cohort.
Gene Expression Analysis
For breast cancer subtypes in the TCGA database that did not have sufficient normal tissues as controls for statistical analysis, we supplemented corresponding normal tissues from the GTEx database by the Gene Expression Profiling Interactive Analysis v2 (GEPIA2, http://gepia.cancer-pku.cn/). The ggplot2 R package was used to visually probe AP1S1 expression in different datasets. Pictures of immunohistochemical slices and related information were downloaded from the Human Protein Atlas (HPA, https://www.proteinatlas.org/).
Genetic Variation Analysis
We used the cBioPortal website to analyze the copy number, frequency, and mutation type characteristics of AP1S1 in breast cancer. The cBioPortal data was available from the TCGA database.
Immune Infiltration Analysis
We performed an immune infiltration analysis using the GSVA package v1.34.0 of R v3.6.3. The immune infiltration levels of different immune cells were calculated with single-sample gene set enrichment analysis (ssGSEA). The Spearman correlation coefficient was used to investigate the correlation between AP1S1 expression and immune infiltration. The Stromal score and ESTIMATE score information corresponding to the TCGA samples was downloaded from the ESTIMATE website (https://bioinformatics.mdanderson.org/estimate/).
ROC Curve and Survival Analysis
The PROC v1.17.0.1 and ggplot2 v3.3.3 packages of R v3.6.3 were used to draw the receiver operating characteristic (ROC) curve. Survival maps and survival plots were obtained from GEPIA2. The survival v3.2–10 packages of R v3.6.3 were used to establish a COX regression model to statistically analyze the association between AP1S1 expression and survival rate.
Nomogram Prediction Model
Based on the multivariate COX regression analysis variables, a nomogram was constructed to predict the survival probability of patients with breast cancer at 1, 2, and 5 years. The Rms v6.2–0 and survival v3.2–10 packages of R v3.6.3 were executed as tools for drawing this nomogram.
AP1S1-Binding Proteins and AP1S1-Correlated Genes Analysis
The STRING (https://string-db.org/) tool was used to download the first 50 AP1S1-binding proteins supported by experimental evidence, and the first 100 AP1S1-related genes from the GEPIA2 website. The ggplot2 package v3.3.3 of R v3.6.3 was used to draw a heat map of the top 100 AP1S1-related genes. This package was also used to draw the scatter plot and Venn diagram of the first 10 AP1S1-related genes.
Functional Enrichment Analysis
The ClusterProfiler package v3.14.3 and org.Hs.eg.db v3.10.0 packages of R v3.6.3 were used to execute enrichment analysis on the Kyoto Encyclopedia of Genes and Genomes (KEGG) and gene ontology (GO) databases. GSEA data was obtained from the MSigDB Collections (https://www.gsea-msigdb.org/gsea/msigdb/index.jsp), and GSEA illustrated using ggplot2 v3.3.3 package of R v3.6.3. The protein–protein interaction (PPI) network analysis was performed with STRING (https://string-db.org/).
Results
Baseline Characteristics of Patients
We downloaded the bioinformation of 1083 patients with breast cancer in the TCGA database and separated the data into high and low AP1S1 expression to analyze the difference in their baseline characteristics (Table 1). The baseline characteristics of the local verification cohort are shown in Table 2.
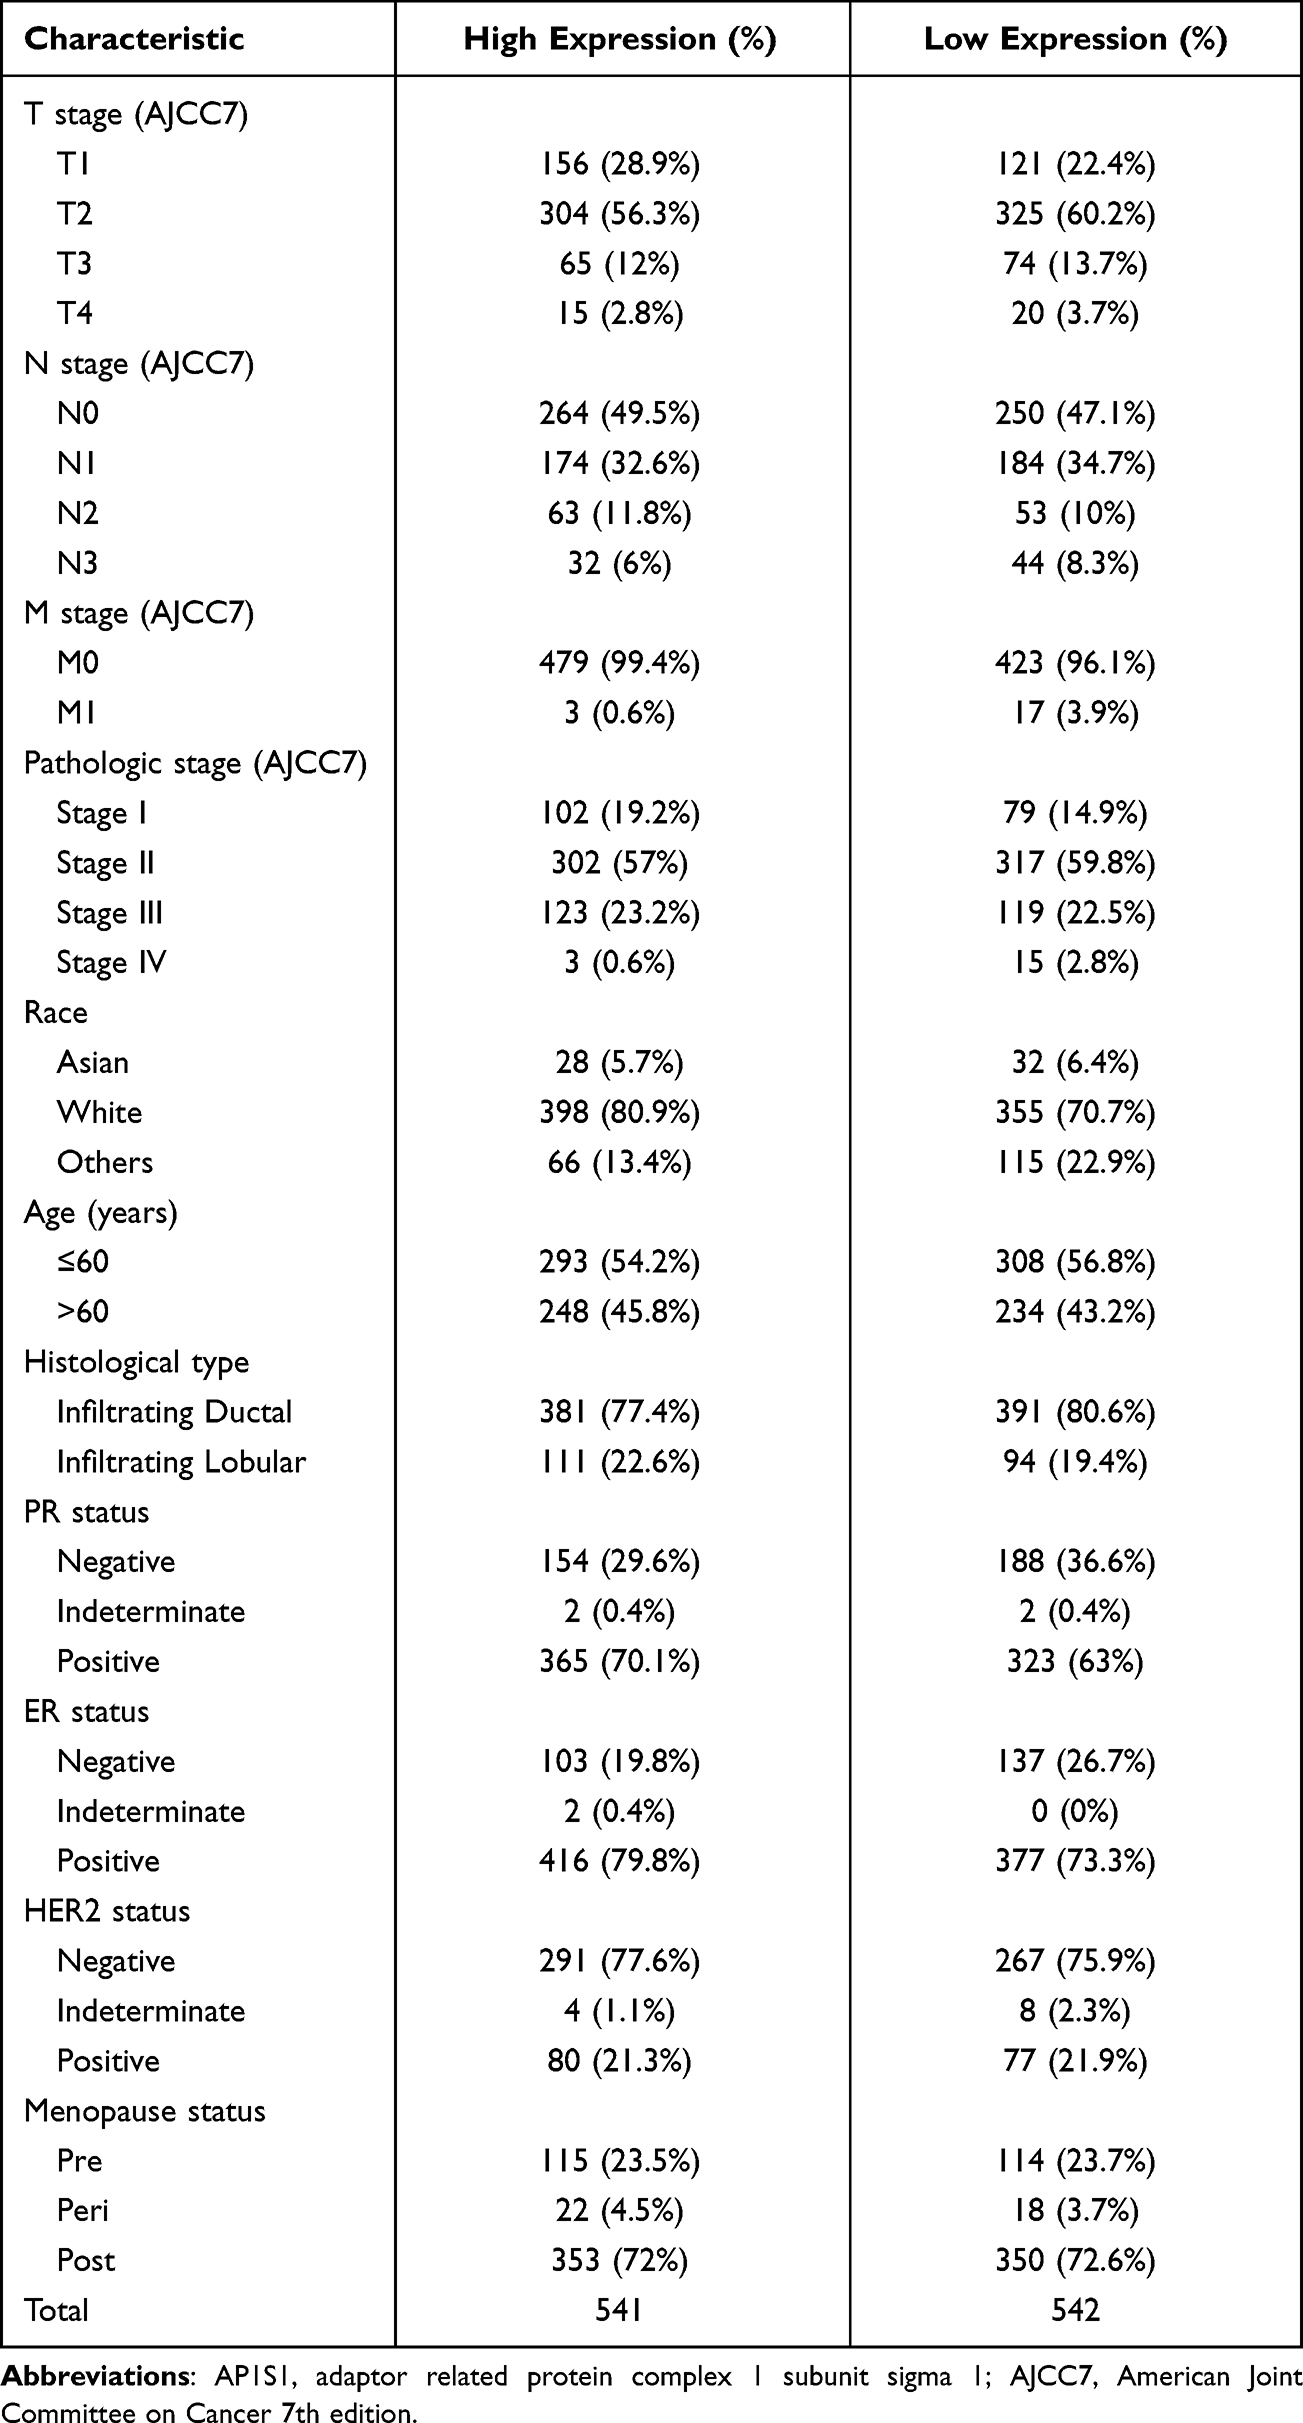 |
Table 1 Baseline Characteristics of the AP1S1 High Expression Set and the Low Expression Set in the TCGA Cohort |
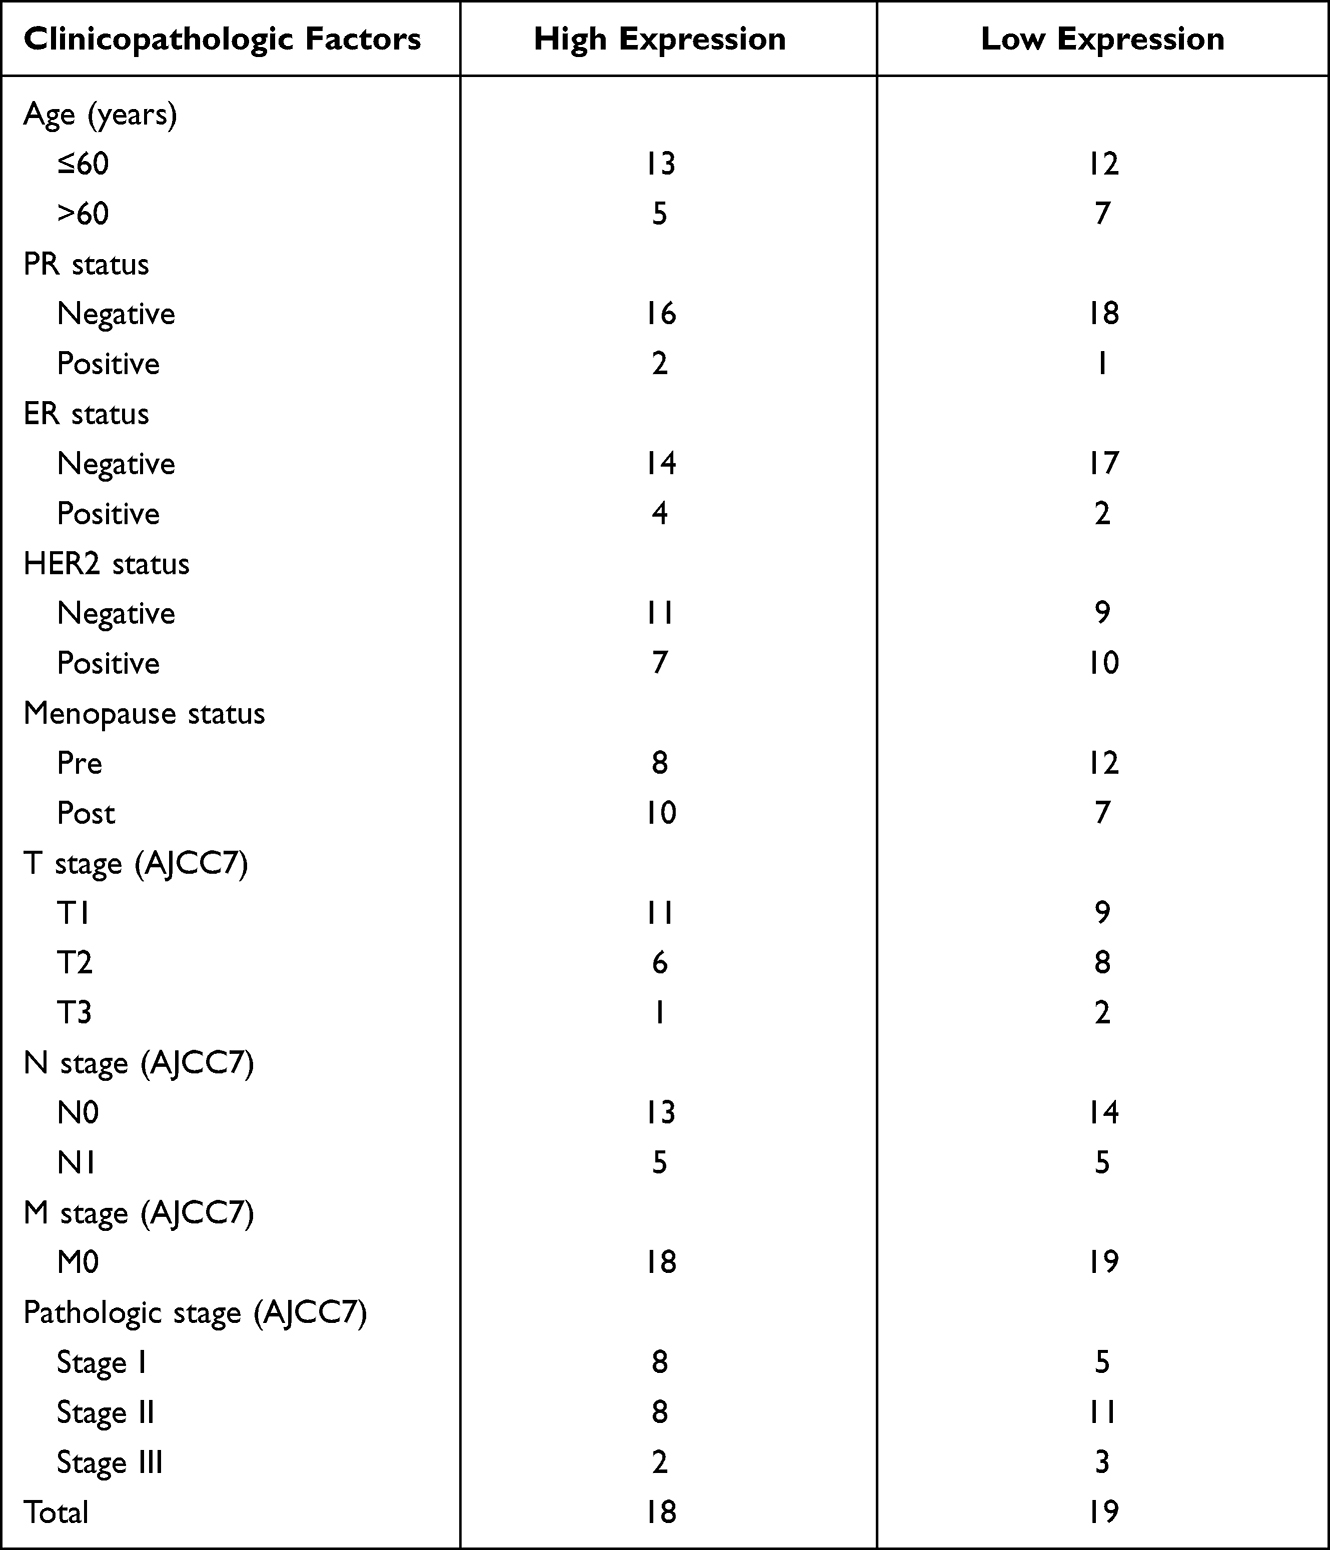 |
Table 2 Baseline Characteristics of the AP1S1 High Expression Set and the Low Expression Set in the Validated Cohort |
AP1S1 mRNA is Overexpressed in Breast Cancer
We evaluated AP1S1 expression, exon expression, and methylation level in the TCGA database, and AP1S1 expression and exon expression were significantly higher in tumor tissues, whereas AP1S1 methylation levels were higher in normal tissues (Figure 1A). The AP1S1 expression in breast tumors was higher than normal tissues in the TCGA and TCGA+GTEx databases by unpaired test (Figure 1B and C). In addition, the result of the expression analysis on paired breast samples in TCGA showed a similar result (Figure 1D). After the analysis of different breast cancer subtypes, we also found that AP1S1 has different expressions in different breast cancer subtypes. As shown in Figure 1E, AP1S1 is highly expressed in basal-like, HER2+, luminal A, and luminal B breast cancer. In our local validation cohort, we further verified that the RNA levels of AP1S1 were over-expressed in breast tumors (Figure 1F–I).
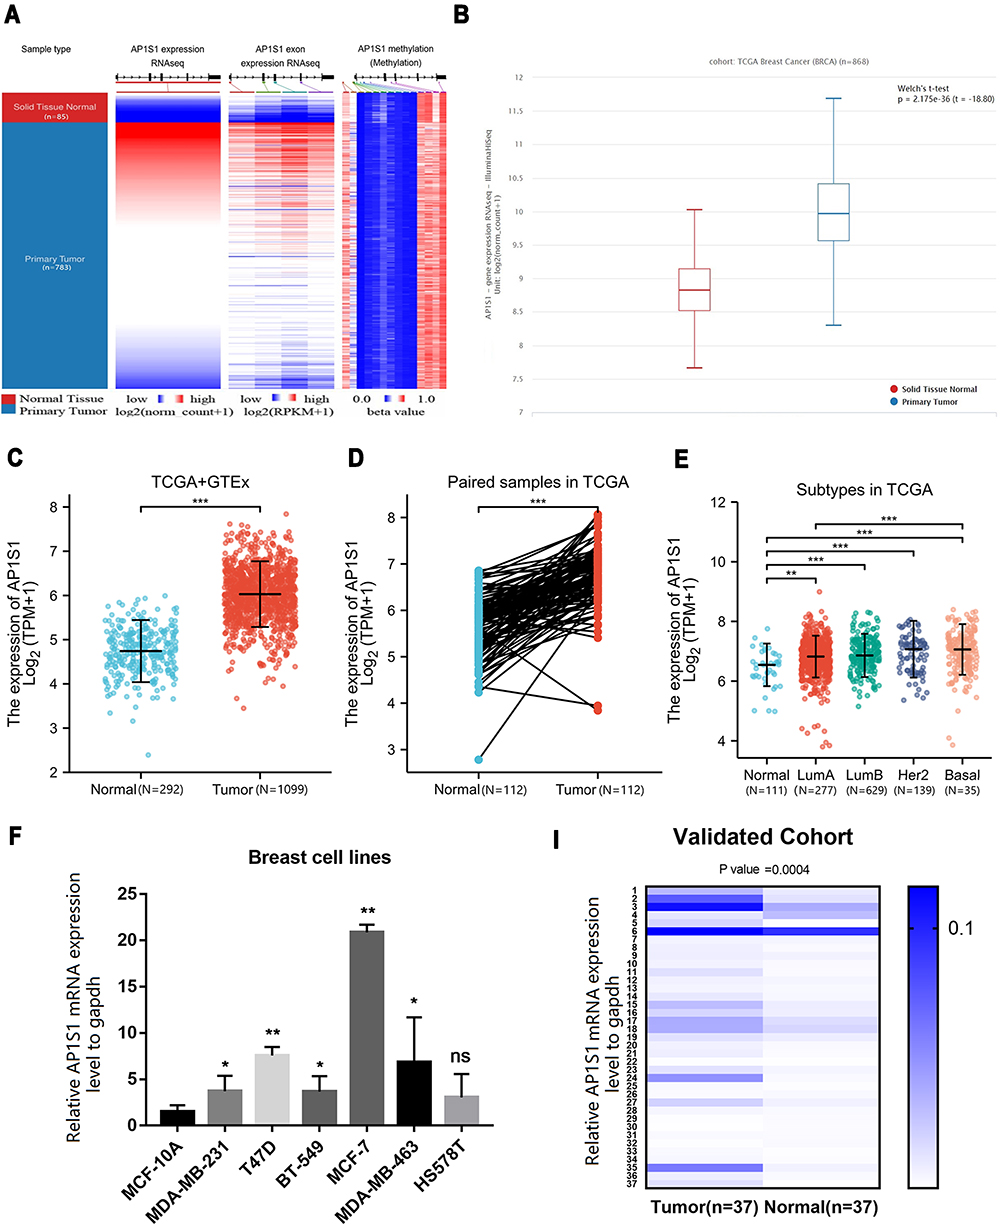 |
Figure 1 The expression level of AP1S1 in breast cancer. (A) The heat maps of AP1S1 mRNA expression, exon expression and methylation in primary breast cancer and corresponding normal tissues from UCSC Xena. (B) The AP1S1 expression level of no paired breast cancer patients in TCGA dataset. (C) AP1S1 expression of no paired breast cancer patients in TCGA+GTEx dataset. (D) AP1S1 expression level of paired breast cancer patients in TCGA dataset. (E) AP1S1 expression of different breast cancer subtypes in TCGA dataset. (F) AP1S1 expression in different breast cell lines. (I) AP1S1 expression in breast cancer in validated cohort. ns: no significance, * P<0.05, **p<0.01, ***p<0.001. |
Genetic Alteration of AP1S1 in Breast Cancer
We analyzed the molecular characteristics of AP1S1 and found a mutation rate of AP1S1 in breast cancer samples of 0.6% with the most common mutation amplified mutation (Figure 2A). Analysis of the correlation between AP1S1 mRNA expression, gene change, and copy number showed that amplification is positively correlated with mRNA expression (Figure 2B and C). This further confirmed that AP1S1 was overexpressed in breast cancer and might be an oncogene of breast tumors.
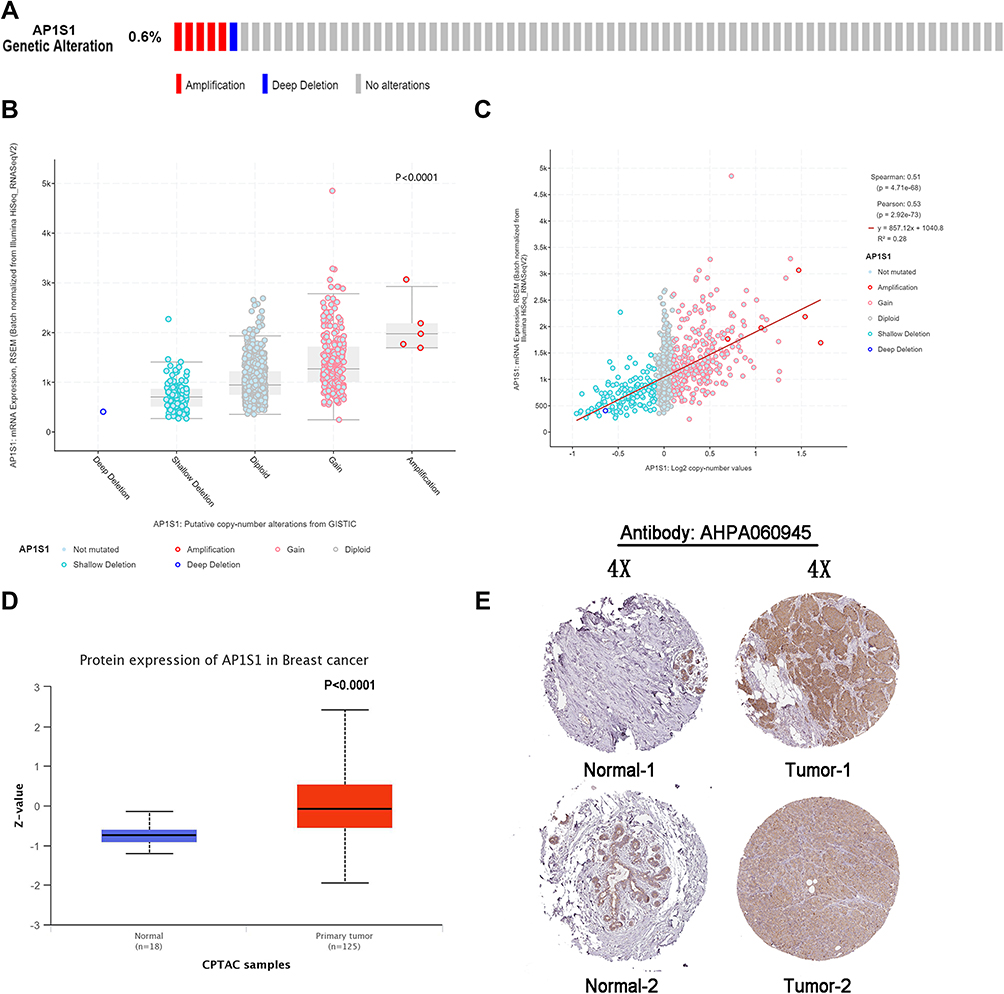 |
Figure 2 The genetic alteration and protein expression of AP1S1. (A) The genetic alteration frequency of AP1S1 in breast cancer using the cBioPortal tool. (B) The correlations between the mRNA expression level and genetic alterations of AP1S1 from cBioPortal. (C) The correlations between the mRNA expression level and copy number of AP1S1 from cBioPortal. (D) The protein expression of AP1S1 in breast cancer from CPTAC database. (E) IHC slices of AP1S1 in breast from HPA. |
AP1S1 Protein is Overexpressed in Breast Cancer
By analyzing the protein levels of AP1S1 in breast cancer, we found that AP1S1 protein was upregulated in breast cancer (Figure 2D). Analyzing the immunohistochemical sections from the Human Protein Atlas database, we found a similar manifestation (Figure 2E) of AP1S1 protein upregulation in breast cancer. The specific information of these sections is shown in Table 3. These results indicate that AP1S1 was overexpressed in breast cancer, suggesting a relationship between AP1S1 and the occurrence of breast cancer.
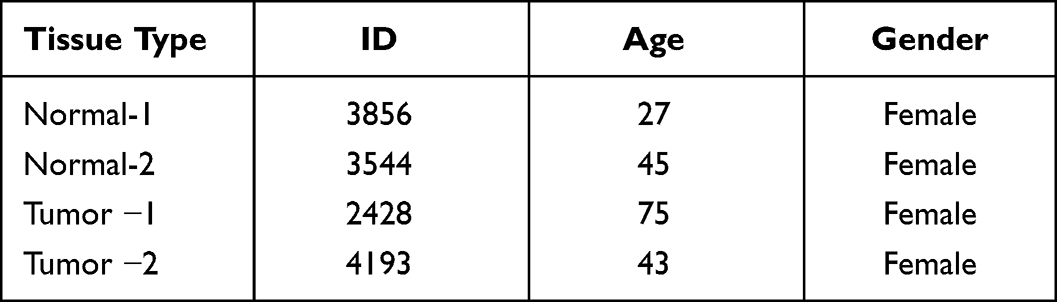 |
Table 3 The Basic Information of IHC Slices |
AP1S1 is Related to Immune Infiltration
We explored the correlation between AP1S1 expression in breast cancer and immune infiltration (Figure 3). These cells include B cells, CD8+ T, cytotoxic, dendritic cells (DCs), aDC, iDCs, pDCs, eosinophils, macrophages, mast cells, neutrophils, natural killer (NK) CD56dim, NK cells, T cells, T helper (Th), T central memory, T effector memory, T follicular helper, Th 1 cells, etc. Infiltrating cells were negatively correlated with high AP1S1 expression which infers that its expression might affect tumor immunity. Moreover, AP1S1 expression was negatively correlated with the ESTIMATE, immune score, and interstitial score. In contrast, the ESTIMATE, immune score, and interstitial score were positively correlated with better outcomes. This further indicates that high AP1S1 expression might have a specific relationship with the poor prognosis of breast cancer.
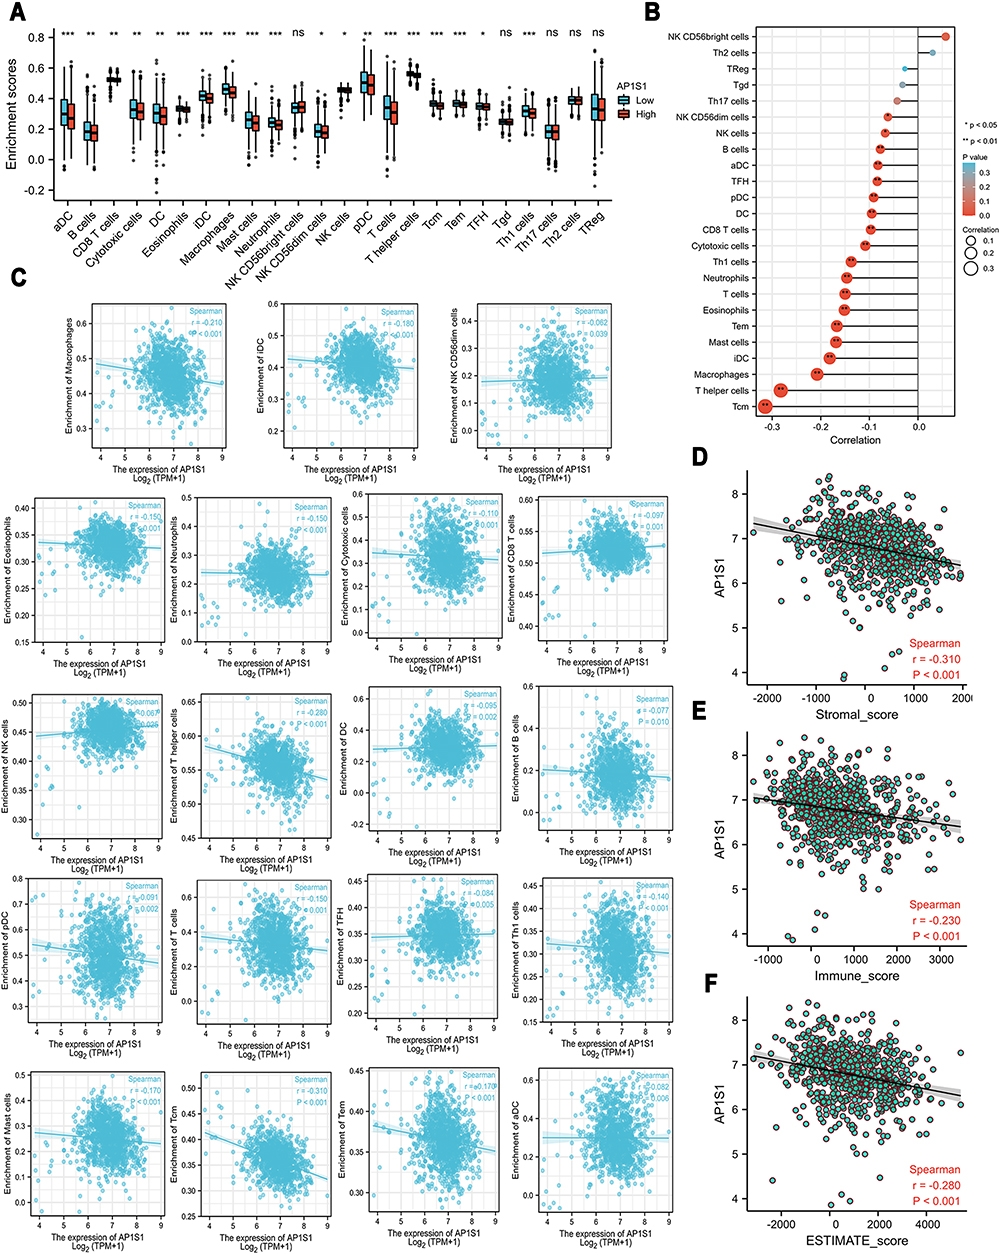 |
Figure 3 Correlations between the expression level of AP1S1 and immune infiltration. (A) The bar graph about the immune infiltration level of different immune infiltration cells in AP1S1 high set and low set. (B) The lollipop figure about the correlations between the expression level of AP1S1 and immune infiltration of different immune infiltration cells. (C) The scatter diagrams about the correlations between the expression level of AP1S1 and immune infiltration level of different immune infiltration cells. (D–F) The scatter diagrams about the correlations between the expression level of AP1S1 and stromal score (D), immune score (E) and ESTIMATE score (F). |
Connection Between AP1S1 Expression and Clinical Factors
To explore the role of high AP1S1 expression in breast cancer, we analyzed the relevance between clinical factors and AP1S1 expression in the TCGA cohort by single factor logistic regression. According to the median, we divided patients with breast cancer into two groups (high and low expression groups). Univariate logistic regression showed that AP1S1 expression in patients with estrogen receptor (ER)-negative breast cancer was higher than that of ER-positive, T stage II-IV, distant metastasis, and patients with higher pathological stage. Collectively, it suggests that increased AP1S1 expression is connected with the poor prognosis of breast cancer and might be a potential oncogene related to the occurrence and development of breast cancer (Table 4, Figure 4).
 |
Table 4 The Correlation Between AP1S1 Expression and Clinicopathologic Factors in the TCGA Cohort |
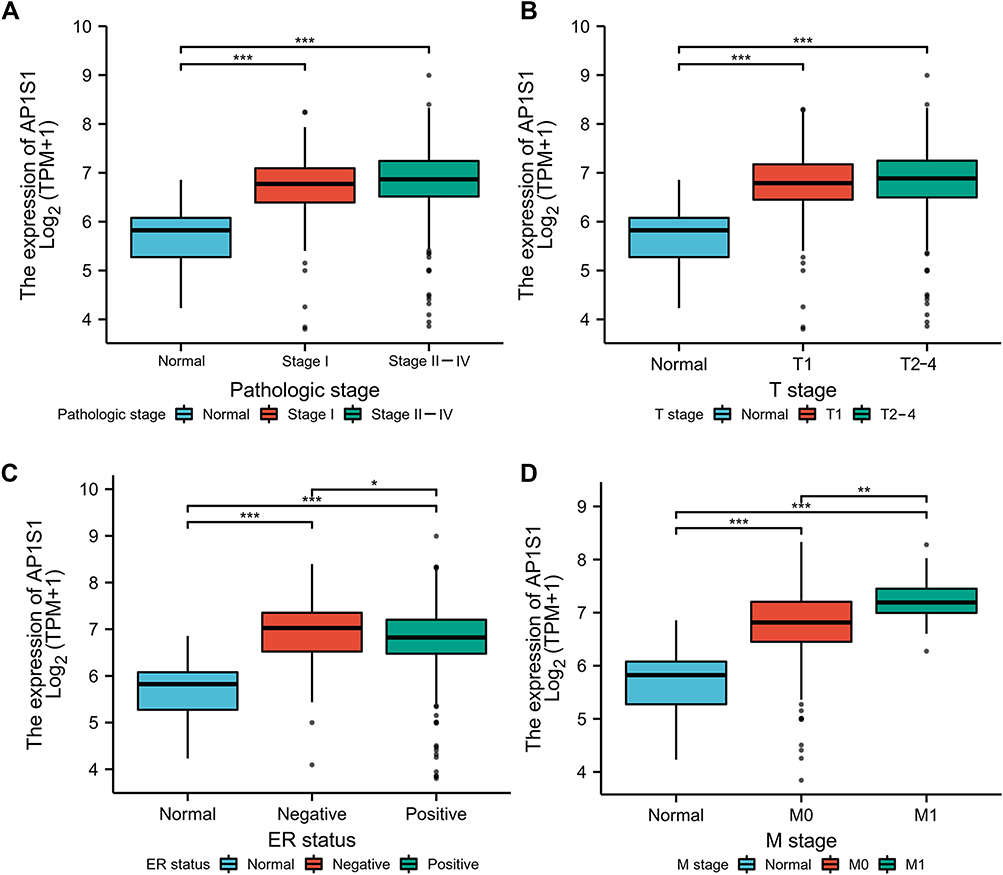 |
Figure 4 The correlation between AP1S1 expression and clinical factors in TCGA. The correlation between SEC61 expression and Pathologic stage (A), T stage (B), ER status (C) and M stage (D). *P<0.05, **p<0.01, ***p<0.001. |
Diagnostic Value of AP1S1 Expression in Breast Cancer
In this study, to evaluate the diagnostic value of AP1S1 expression in breast cancer, ROC curve analysis was conducted. The area under the curve (AUC) of AP1S1 expression was 0.917 (Figure 5A), which indicated a high diagnostic value in distinguishing between tumor and normal tissue. AP1S1 expression was also an effective marker to differentiate the distant metastasis stage of breast cancer (Figure 5B). This result suggests that AP1S1 expression has a good discriminating value in breast cancer.
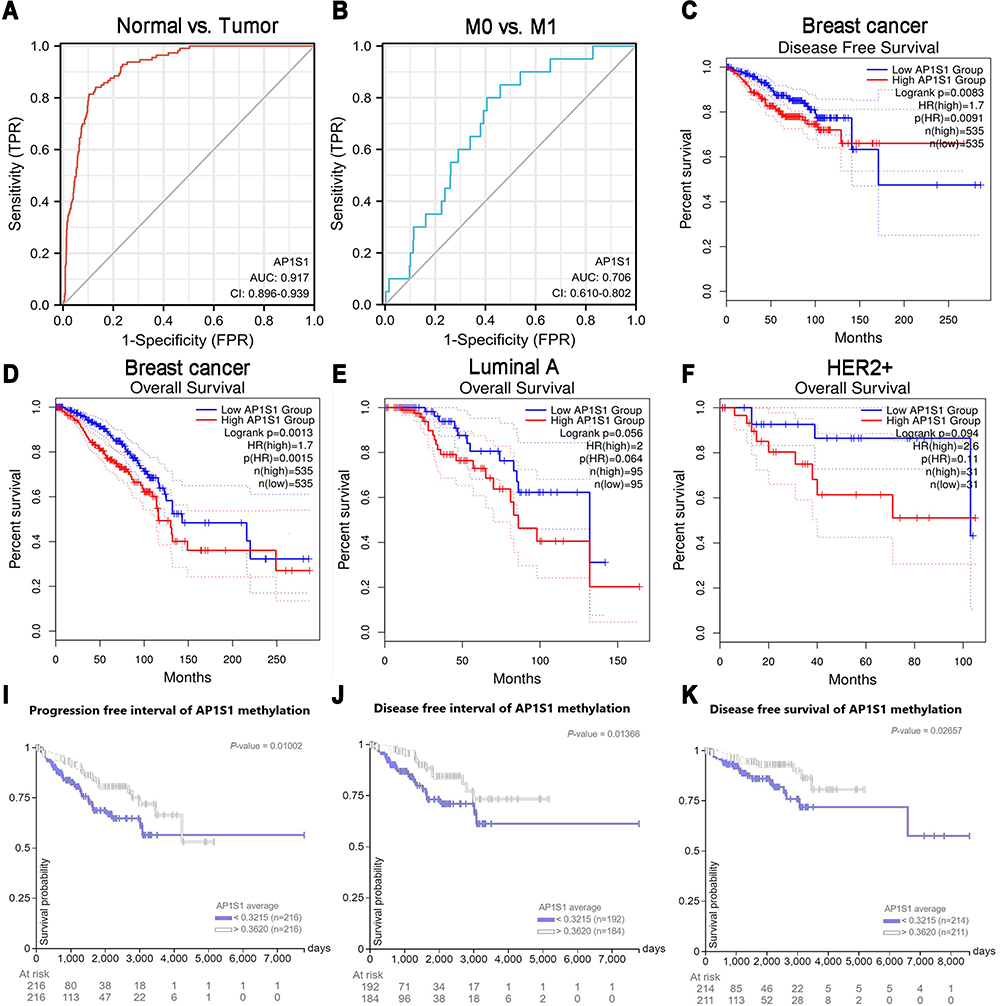 |
Figure 5 Diagnostic value of the expression and the survival analysis of AP1S1 in breast cancer. (A) ROC curve for differentiating normal people and breast cancer patients. (B) ROC curve for differentiating M0 and M1 stage patients. (C) Disease free survival plot of breast cancer patients that grouped by AP1S1 expression level. (D) Overall survival plot of breast cancer patients that grouped by AP1S1 expression level. (E and F) Overall survival plots of luminal A (E) and HER2+ (F) subtypes breast cancer subgroup patients. (I–K) Progression free interval, disease free interval and disease free survival plots of breast cancer patients that grouped by AP1S1 methylation level from UCSC Xena. |
The Relationship Between AP1S1 Expression and Survival
To analyze the relationship between AP1S1 expression and survival, a Kaplan-Meier analysis was used. Univariate Cox regression analysis of disease-specific survival suggested that high AP1S1 expression (P=0.002, [HR]=2.014, 95% CI=1.285–3.156), T stage ≥ 2 (P=0.038, [HR]=1.781, 95% CI=1.033–3.071), lymph node metastasis (P<0.001, [HR]=3.797, 95% CI=2.222–6.489), occurrence of distant metastasis (P<0.001, [HR]=7.454, 95% CI=3.988–13.931), and pathological stage ≥ stage 2 (P=0.004, [HR]=3.396, 95% CI=1.478–7.803) were all associated with poor disease-specific survival (Table 5). Multivariate Cox regression analysis of disease-specific survival suggests that lymph node metastasis (P=0.003, [HR]=2.644, 95% CI=1.385–5.050), distant metastasis (P<0.001, [HR]=4.357, 95% CI=2.046–9.279), and high AP1S1 expression (P=0.016, [HR]=1.873, 95% CI=1.122–3.127) were independent risk factors for disease-specific survival of patients with breast cancer (Table 6). Then, we plotted the survival curve of AP1S1 expression (Figure 5C–F). The survival curve revealed shorter disease-free survival of patients with higher AP1S1 expression. Whether in the total patients with breast cancer or luminal A and HER2+ subtypes, patients with high AP1S1 expression had poor overall survival. In Figure 1A, we showed that the AP1S1 methylation level was lower in breast tumors. In addition, the survival analysis of AP1S1 methylation showed that higher methylation was connected with higher survival probability. Therefore, the survival analysis of AP1S1 methylation (Figure 5I–K) also verified that higher AP1S1 expression was connected with poor survival. Next, we made a nomogram to predict the survival rate of patients with breast cancer at 1-, 2-, and 5 years (Figure 6A). The 1-, 2-, and 5-year survival rates AUCs were 0.843, 0.769, and 0.753, respectively, confirming that the nomogram has good predictive value and certain diagnostic significance (Figure 6B). Our nomogram might provide a reference for future clinical prediction of disease-free survival duration for patients with breast cancer, and help guide personalized treatment of patients with breast cancer.
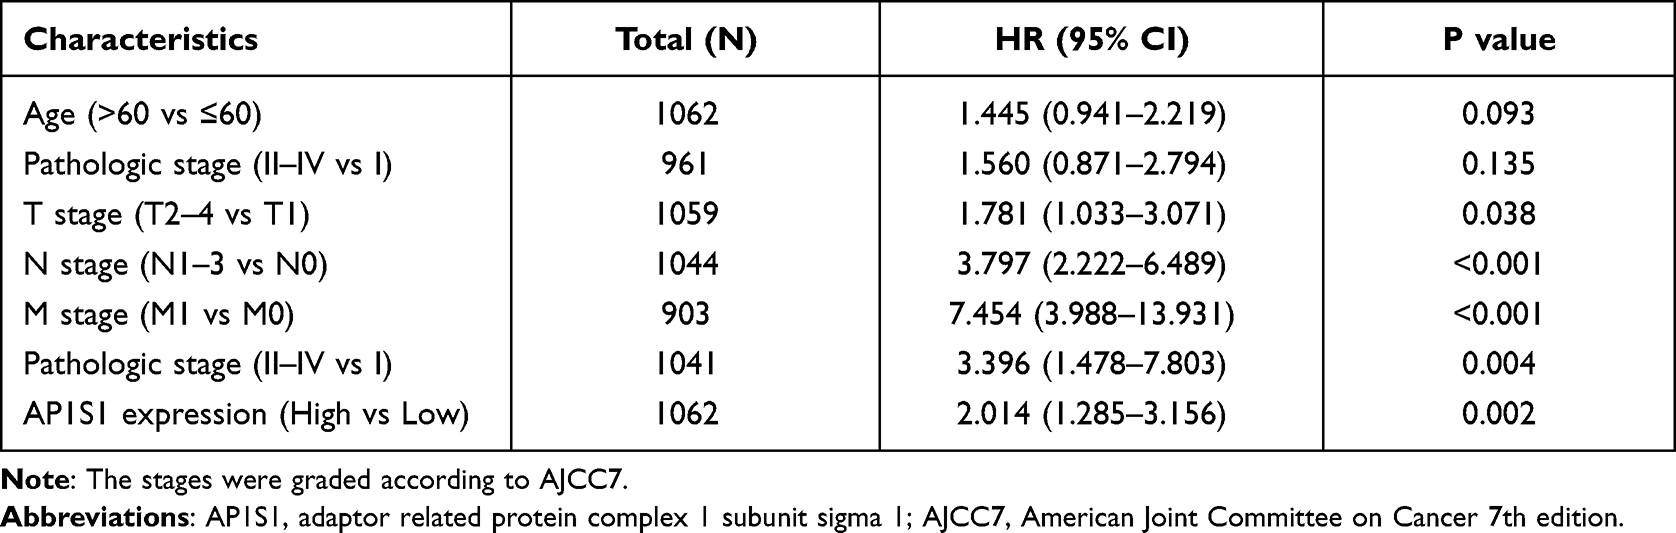 |
Table 5 Univariate COX Regression Analysis for Disease Specific Survival in the TCGA Cohort |
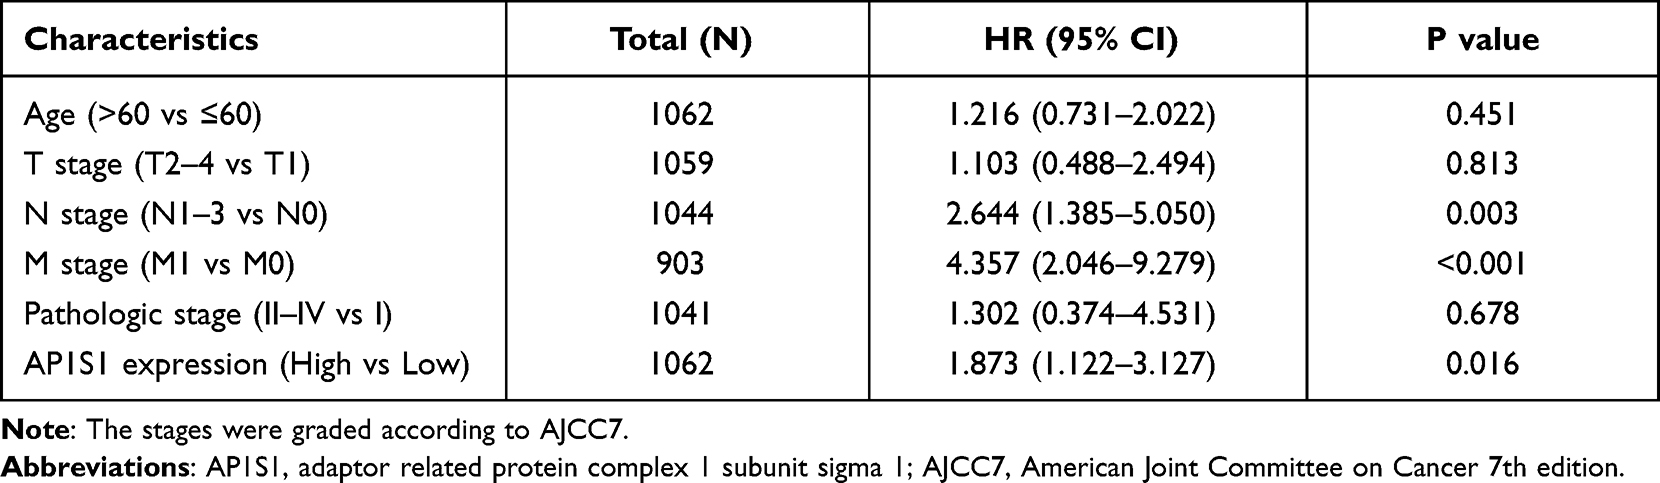 |
Table 6 Multivariate COX Regression Analysis for Disease Specific Survival in the TCGA Cohort |
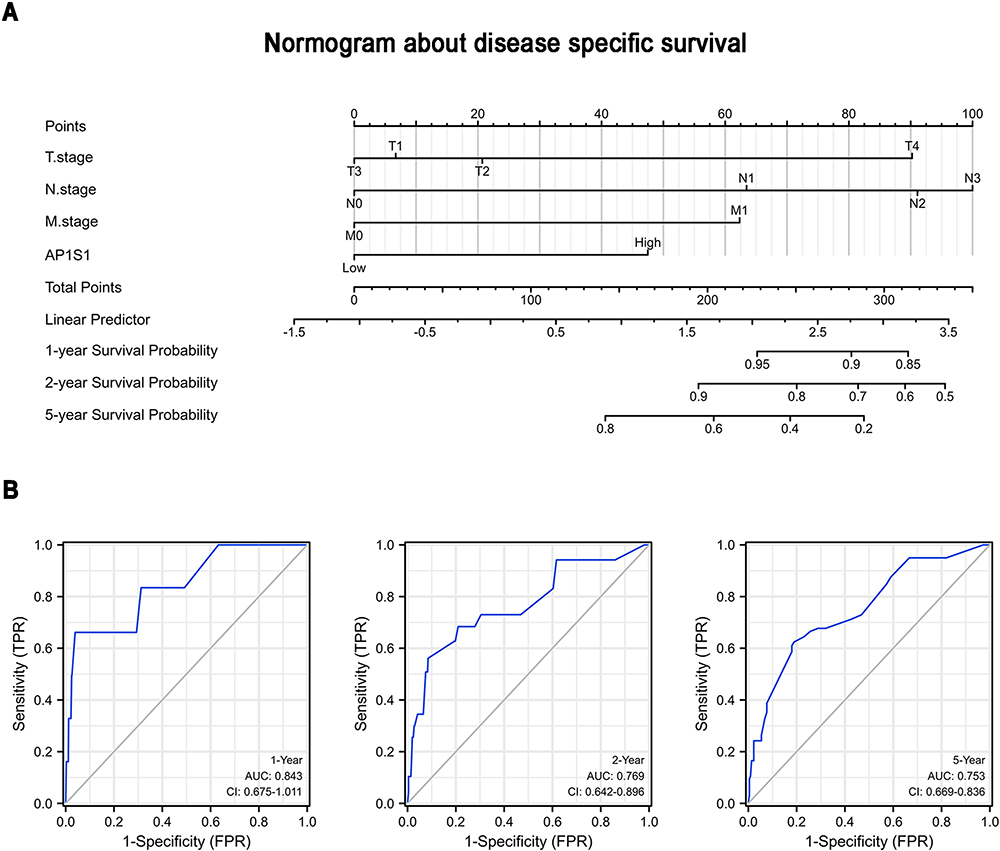 |
Figure 6 A nomogram about disease specific survival. (A) A nomogram for predicting the 1 year, 2 years, and 5 years disease specific survival probability of breast cancer patients. (B) ROC curves of the nomogram. |
AP1S1 Functional Enrichment Analysis
To explore the carcinogenic mechanism of AP1S1, we downloaded the top 50 AP1S1 binding proteins from STRING as well as the top 100 genes related to AP1S1 in GEPIA2 for pathway enrichment analysis. Figure 7A shows the interaction network diagram of the top 10 genes most closely related to AP1S1 binding protein. It can be seen from Figures 7B and D that the five genes GNB2, PDAP1, POP7, LRWD1, and COPS6 had the strongest (and significantly positive) correlation with AP1S1. Next, we cross-analyzed the top 50 proteins and the top 100 genes and found two common members AP4M1 and ARF5 (Figure 7C). We also performed KEGG and GO analysis of these genes and proteins. Figure 8A–C shows GO enrichment analysis of three types of gene functions: biological processes, cellular components, and molecular functions, Figure 8D shows the KEGG analysis results, and Figure 8E the GO and KEGG enrichment interaction network. The results showed that the genes analyzed (ie, AP1S1) were mainly related to immune response, membrane, and clearly binding. To explore the signaling pathways activated by AP1S1 in breast cancer, we performed a GSEA analysis. The first four paths are shown in Figure 9. Pathway enrichment results suggested that AP1S1 might affect ribosome function, respiratory chain electron transport, and eukaryotic cell translation. We hypothesized that AP1S1 might play a tumor-promoting role by influencing specific pathways that transmit information through vesicles. However, these pathways are still unknown and need to be explored in the future.
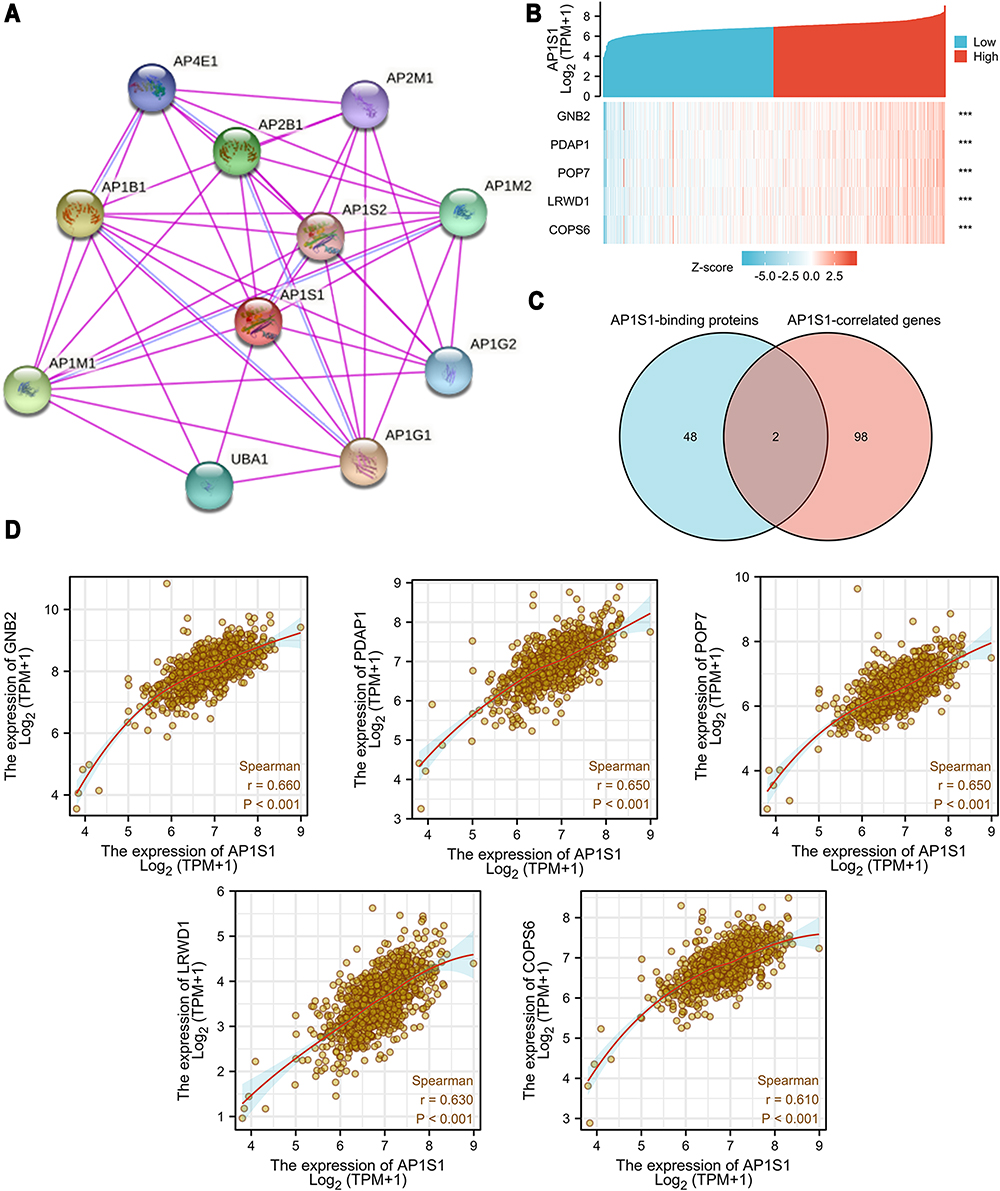 |
Figure 7 AP1S1-related gene and AP1S1-binding proteins enrichment analysis. (A) Protein–protein interaction network of AP1S1. (B) Heat map about the top 5 AP1S1-related gene enrichment. (C) A Venn diagram about intersection analysis of the top 50 proteins and the top 100 genes. (D) The scatter diagrams about the top 5 AP1S1-related gene enrichment. ***p<0.001. |
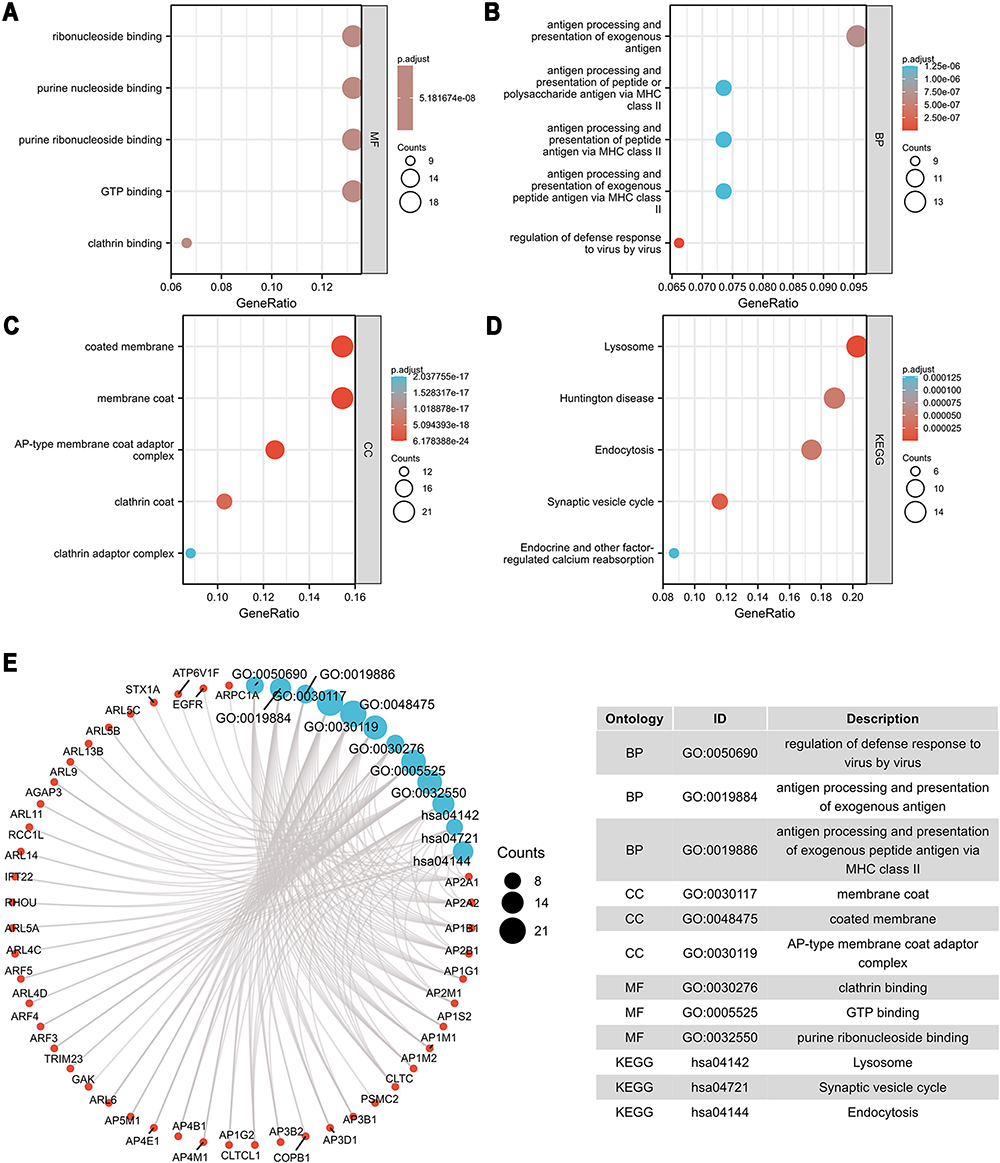 |
Figure 8 GO and KEGG Enrichment analyses of AP1S1. (A–C) GO enrichment analyses of AP1S1. (D) KEGG enrichment analyses of AP1S1. (E) GO and KEGG enrichment interactive network. |
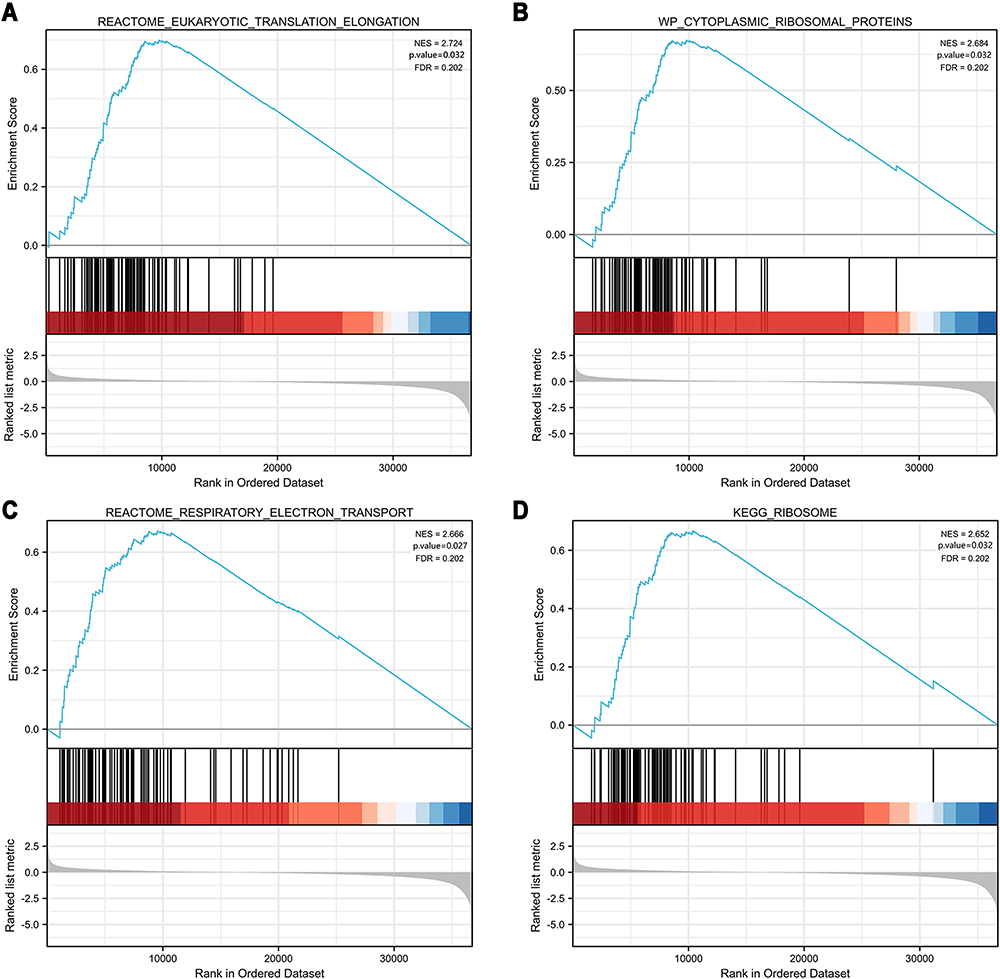 |
Figure 9 GSEA enrichment analysis of AP1S1. (A) Reactome eukaryotic translation elongation. (B) Cytoplasmic ribosomal proteins. (C) Reactome respiratory electron transport. (D) Ribosome. These pathways suggested that AP1S1 might affect ribosome function, respiratory chain electron transport, and eukaryotic cell translation. |
Discussion
Breast malignant tumor is the highest incidence of cancer globally and the primary cause of cancer-related death.18 The incidence of malignant tumor, which is a systemic disease, is gradually increasing annually.1 With progress in the treatment of breast cancer, including targeted therapy, endocrine therapy, and other comprehensive treatment methods, the mortality rate of breast cancer has decreased. However, the exact molecular mechanism of breast cancer still requires better understanding.
By analyzing AP1S1 expression, exon expression, and methylation levels in the TCGA database, we found that AP1S1 expression and exon expression were higher in tumors. Furthermore, AP1S1 was highly expressed in different breast cancer subtypes. Therefore, we suspected an association between that AP1S1 expression and breast cancer. Our hypothesis was confirmed by testing 37 local pairs of paired breast and para-cancer tissues. These results suggested that AP1S1 expression might be a potential breast cancer oncogene. Next, we statistically analyzed the clinicopathological features in a TCGA cohort, and the results suggested that AP1S1 expression might be highly correlated with the occurrence and development of breast cancer. Moreover, the molecular analysis suggested that amplification was the most common mutation of AP1S1 in breast cancer. It had been reported that the AP1 complex was involved in vesicle formation, transport, and protein sorting.19–21 We hypothesized that the amplification of AP1S1 in tumor cells resulted in high AP1S1 expression. This led to increased vesicle formation and transportation, which promoted certain signaling and ultimately led to breast cancer. The specific mechanism of this still needed to be further explored.
It is known that innate immunity and adaptive immune response are closely related to tumor surveillance.22 Initially, innate immune cells (such as NK cells, DCs, and macrophages) kill tumor cells and present tumor antigens to activate adaptive immune responses (such as CD8+ T cells and CD4+ T cells).23 The immune cells respond to the tumor, and the tumor develops an anti-immune response.24 In immune infiltration analysis, it was found that the high AP1S1 expression was negatively correlated with a variety of immune infiltrating cells. We hypothesized that the high AP1S1 expression could reduce the immunogenicity of tumors and thus evade immune surveillance, which has a certain reference value for the immunotherapy of breast cancer. In addition, AP1S1 expression was negatively correlated with the ESTIMATE, immune score, and interstitial score, which quantified the low level of immunological and stromal components in tumors—with higher AP1S1 expression associated with lower levels of immune invasion. Although we could infer that AP1S1 overexpression was associated with immunosuppression, the function of immune cells in different diseases is complex. Th1 and Th2 cells secrete different cytokines with opposite effects on tumors. Th1 cells inhibit tumor growth, while Th2 cells promote tumor growth.25 CD4+ T cells differentiate into Th1 or Th2 subsets under the combined action of the environment and genes,26,27 while in some diseases, Th1 cells might even turn into Th2 cells.28 The exact mechanism of this is yet to be explored. In our study, the high AP1S1 expression was negatively correlated with Th1, which was statistically significant. However, the positive correlation with Th2 was not statistically significant. This suggested that the high AP1S1 expression could promote tumor growth, but can not be said for certain from our results. Immunosuppressive checkpoints and factors did not further confirm our conjecture; therefore, our results need to be verified at the protein level in future studies.
From the immune infiltration analysis, it was discovered that AP1S1 was related to various immune infiltrating cells that might affect tumor immunity. From the logistic regression analysis of AP1S1 with clinicopathological characteristics, it was shown that patients with high AP1S1 expression had higher ER expression rates and were more likely to have distant metastasis and lymph node metastasis. The overall survival rate, disease-specific survival rate, and progression-free interval of the AP1S1 high expression group were poor. Based on COX regression analysis, we constructed a nomogram for predicting the survival probability of patients with breast cancer at 1, 2, and 5 years with AUCs of 0.843, 0.769, and 0.753, respectively, suggesting that our nomogram had a good predictive value.
We attempted to study the carcinogenic mechanism of AP1S1. We performed KEGG and GO analysis on the top 50 AP1S1-related binding proteins and the top 100 AP1S1-related genes. The results suggested that AP1S1 and related genes were related to immune response, lysosomal vesicle transport, and protein presentation, which was consistent with previous studies.19–21 The enrichment results of the AP1S1 pathway suggested that AP1S1 was related to cytoplasmic ribosomal protein, respiratory chain electron transport, and eukaryotic cell translation. We hypothesize that AP1S1 is involved in protein sorting and vesicle transport, which ultimately leads to the formation of tumors by influencing specific pathways and information transmission through vesicles.
Our study is not without limitations. First, it lacks basic experiments to promote the mechanism of tumor occurrence and development. However, we used biogenic analysis to find some AP1S1-related pathways, and our analysis could provide a direction for future basic experiments. Therefore, our study promotes further exploration of the AP1S1 gene in the future to fully understand its function and mechanism for better clinical diagnosis and prognosis of breast cancer.
In conclusion, our study found that AP1S1 is a potential oncogene of breast cancer. This study provides insight for AP1S1 as a new potential biomarker for breast cancer treatment, diagnosis, and prognosis.
Abbreviations
AP, adaptor protein; AP1M1, AP1 complex subunit μ1; AUC, area under the curve; DCs, dendritic cells; ER, estrogen receptor; GO, gene ontology; HPA, Human Protein Atlas; KEGG, Kyoto Encyclopedia of Genes and Genomes; NK, natural killer; PPI, protein–protein interaction; ROC, receiver operating characteristic; ssGSEA, single-sample gene set enrichment analysis; Th, T helper.
Data Sharing Statement
The data sets and additional images supporting the conclusions of this study are included in this article. Raw data is available on the main electronic data storage system of First Affiliated Hospital of Wenzhou Medical University and authorization to access may be granted upon reasonable request to the authors.
Ethical Approval and Consent to Participate
Our research was in line with the Declaration of Helsinki. Ethical approval for this study was obtained from the Ethics Committee of the First Affiliated Hospital of Wenzhou Medical University.
Consent for Publication
Written informed consent was obtained from the patients for the publication of this research and accompanying images. A copy of the written consent is ready for review by the Editor in Chief of this journal.
Acknowledgments
The authors would like to thank all the doctors of the Department of Breast Surgery, The First Affiliated Hospital of Wenzhou Medical University (Wenzhou, China), and Yaoyao Guan for providing essential information required for this study.
Funding
Funding information: Natural Science Foundation of Zhejiang Province, Grant/Award Numbers: LGF18H160032.
Disclosure
The authors declare that they have no conflicts of interest in this work.
References
1. Siegel R, Miller KD, Fuchs HE, et al. Cancer statistics, 2021. CA: Cancer J Clin. 2021;71(1):7–33. doi:10.3322/caac.21654
2. Pfeiffer R, Webb-Vargas Y, Wheeler W, et al. Proportion of U.S. Trends in breast cancer incidence attributable to long-term changes in risk factor distributions. Cancer Epidemiol Biomark Prev. 2018;27(10):1214–1222. doi:10.1158/1055-9965.EPI-18-0098
3. Moo T, Sanford R, Dang C, et al. Overview of breast cancer therapy. PET Clin. 2018;13(3):339–354
4. Bonifacino J, Glick BJC. The mechanisms of vesicle budding and fusion. Cell. 2004;116(2):153–166. doi:10.1016/s0092-8674(03)01079-1
5. Robinson MS. Adaptable adaptors for coated vesicles. Trends Cell Biol. 2004;14(4):167–174.
6. Owen D, Collins BM, Evans PR, et al. Adaptors for clathrin coats: structure and function. Ann Rev cell Develop Biol. 2004;20:153–191. doi:10.1146/annurev.cellbio.20.010403.104543
7. Bonifacino JS. Adaptor proteins involved in polarized sorting. J Cell Biol. 2014;204(1):7–17.
8. Montpetit A, Côté S, Brustein E, et al. Disruption of AP1S1, causing a novel neurocutaneous syndrome, perturbs development of the skin and spinal cord. PLoS Gene. 2008;4(12):e1000296. doi:10.1371/journal.pgen.1000296
9. Meyer C, Zizioli D, Lausmann S, et al. mu1A-adaptin-deficient mice: lethality, loss of AP-1 binding and rerouting of mannose 6-phosphate receptors. EMBO J. 2000;19(10):2193–2203. doi:10.1093/emboj/19.10.2193
10. Klee K, Janecke AR, Civan HA, et al. AP1S1 missense mutations cause a congenital enteropathy via an epithelial barrier defect. Hum Genet 2020;139(10):1247–1259.
11. Martinelli D, Dionisi-Vici C. AP1S1 defect causing MEDNIK syndrome: a new adaptinopathy associated with defective copper metabolism. Ann N Y Acad Sci. 2014;1314:55–63. doi:10.1111/nyas.12426
12. Hu Frisk JM, Kjellén L, Kaler SG, et al. Copper regulates maturation and expression of an MITF:Tryptase axis in mast cells. J Immunol. 2017;199(12):4132–4141. doi:10.4049/jimmunol.1700786
13. Martinelli D, Travaglini L, Drouin CA, et al. MEDNIK syndrome: a novel defect of copper metabolism treatable by zinc acetate therapy. Brain. 2013;136:872–881. doi:10.1093/brain/awt012
14. Sun Y, Cao F-L, Qu -L-L, et al. MEG3 promotes liver cancer by activating PI3K/AKT pathway through regulating AP1G1. Eur Rev Med Pharmacol Sci. 2019;23(4):1459–1467. doi:10.26355/eurrev_201902_17103
15. Yun W, Hu Y-M, Zhao C-B, et al. HCP5 promotes colon cancer development by activating AP1G1 via PI3K/AKT pathway. Eur Rev Med Pharmacol Scii. 2019;23(7):2786–2793. doi:10.26355/eurrev_201904_17553
16. Kou Y, Yan X, Liu Q, et al. HBV upregulates AP-1 complex subunit mu-1 expression via the JNK pathway to promote proliferation of liver cancer cells. Oncol Letters. 2019;18(1):456–464. doi:10.3892/ol.2019.10291
17. Takahashi D, Hase K, Kimura S, et al. The epithelia-specific membrane trafficking factor AP-1B controls gut immune homeostasis in mice. Gastroenterology. 2011;141(2):621–632. doi:10.1053/j.gastro.2011.04.056
18. Bray F, Ferlay J, Soerjomataram I, et al. Global cancer statistics 2018: GLOBOCAN estimates of incidence and mortality worldwide for 36 cancers in 185 countries. CA Cancer J Clin. 2018;68(6):394–424. doi:10.3322/caac.21492
19. Boehm M, Bonifacino JS. Adaptins: the final recount. Mol Biol Cell. 2001;12(10):2907–2920. doi:10.1091/mbc.12.10.2907
20. Candiello E, Kratzke M, Wenzel D, et al. AP-1/σ1A and AP-1/σ1B adaptor-proteins differentially regulate neuronal early endosome maturation via the Rab5/Vps34-pathway. Sci Rep. 2016;6:29950. doi:10.1038/srep29950
21. Candiello E, Mishra R, Schmidt B, et al. Differential regulation of synaptic AP-2/clathrin vesicle uncoating in synaptic plasticity. Sci Rep. 2017;7(1):15781. doi:10.1038/s41598-017-16055-4
22. Kim R, Emi M, Tanabe KJI. Cancer immunoediting from immune surveillance to immune escape. Immunology. 2007;121(1):1–14. doi:10.1111/j.1365-2567.2007.02587.x
23. Iwasaki A, Medzhitov RJS. Regulation of adaptive immunity by the innate immune system. Science. 2010;327(5963):291–295. doi:10.1126/science.1183021
24. Finn OJ. Cancer immunology. New Engl J Med. 2008;358(25):2704–2715. doi:10.1056/NEJMra072739
25. Romagnani S. Th1/Th2 cells. Inflamm Bowel Dis. 1999;5(4):285–294. doi:10.1097/00054725-199911000-00009
26. Banchereau J, Steinman RJN. Dendritic cells and the control of immunity. Nature. 1998;392(6673):245–252. doi:10.1038/32588
27. Kaliński P, Hilkens CM, Wierenga EA, et al. T-cell priming by type-1 and type-2 polarized dendritic cells: the concept of a third signal. Immunol Today. 1999;20(12):561–567. doi:10.1016/s0167-5699(99)01547-9
28. O’Shea J, Paul WJS. Mechanisms underlying lineage commitment and plasticity of helper CD4+ T cells. Science. 2010;327(5969):1098–1102. doi:10.1126/science.1178334
 © 2022 The Author(s). This work is published and licensed by Dove Medical Press Limited. The full terms of this license are available at https://www.dovepress.com/terms.php and incorporate the Creative Commons Attribution - Non Commercial (unported, v3.0) License.
By accessing the work you hereby accept the Terms. Non-commercial uses of the work are permitted without any further permission from Dove Medical Press Limited, provided the work is properly attributed. For permission for commercial use of this work, please see paragraphs 4.2 and 5 of our Terms.
© 2022 The Author(s). This work is published and licensed by Dove Medical Press Limited. The full terms of this license are available at https://www.dovepress.com/terms.php and incorporate the Creative Commons Attribution - Non Commercial (unported, v3.0) License.
By accessing the work you hereby accept the Terms. Non-commercial uses of the work are permitted without any further permission from Dove Medical Press Limited, provided the work is properly attributed. For permission for commercial use of this work, please see paragraphs 4.2 and 5 of our Terms.